


 , Hong-liang Zhou 3,*
1 Department of Psychiatry, The Affiliated Mental Health Center of Jiangnan University, 214151 Wuxi, Jiangsu, China
2 Department of Psychology, Wuxi Mental Health Center, Training Base of Hubei University of Medicine, 442000 Shiyan, Hubei, China
3 Department of Psychology, The Affiliated Hospital of Jiangnan University, 214151 Wuxi, Jiangsu, China
†These authors contributed equally.
Abstract
Deficits in emotion recognition have been shown to be closely related to social-cognitive functioning in schizophrenic. This study aimed to investigate the event-related potential (ERP) characteristics of social perception in schizophrenia patients and to explore the neural mechanisms underlying these abnormal cognitive processes related to social perception.
Participants included 33 schizophrenia patients and 35 healthy controls (HCs). All participants underwent electroencephalogram recording while completing the Emotion Intensity Recognition Task (EIRT). Behavioral data and ERP components were analyzed using repeated measures analysis of variance.
Schizophrenia patients had longer reaction times (RTs) to sad faces compared with disgusted faces, and had lower accuracy than the HCs. Additionally, schizophrenia patients had lower accuracy than the HCs for disgusted faces, surprised faces, angry faces, and fearful faces. Late Positive Potential (LPP) mean amplitudes of the HCs were larger than the schizophrenia patients for sad faces in the frontal lobe and central lobe. For happy faces, the HCs elicited larger LPP mean amplitudes than schizophrenia patients in the frontal lobe and central lobe. For surprised faces, the LPP mean amplitudes were higher in the HCs in the central lobe and parietal lobe than in schizophrenia patients. The HCs exhibited larger LPP mean amplitudes for angry faces in the frontal lobe, central lobe, and parietal lobe than in schizophrenia patients. For fearful faces, the HCs elicited a larger LPP mean amplitude than schizophrenia patients in the frontal lobe, central lobe, and parietal lobe.
Schizophrenia patients present impaired social perception, and the observed ERP patterns provide valuable insights into the neural mechanisms underlying the EIRT results, highlighting the differences between HCs and schizophrenia patients. These findings underscore the potential of the EIRT as a biomarker for cognitive and emotional dysregulation in schizophrenia.
No: ChiCTR2300078149. Registered 29 November, 2023; https://www.chictr.org.cn/showproj.html?proj=211510.
Keywords
- event-related potential
- schizophrenia
- social cognition
- social perception
- Emotion Intensity Recognition Task
Schizophrenia is a chronic and severe mental disorder. Characterized by episodes of psychosis, schizophrenia causes people to lose touch with reality. Such symptoms are typically accompanied by disorganized thinking, lack of motivation and reduced social engagement, which can significantly impair daily functioning [1]. Cognitive dysfunction is an important symptom of schizophrenia, including neurocognitive impairments and social cognitive dysfunctions [2].
Social cognition refers to the mental processes involved in understanding, reasoning and responding to the intentions, tendencies and behaviors of other individuals [3]. Social perception is a domain of social cognition. Social perception involves the ability to pick up on social cues and integrate contextual information in social settings. People with schizophrenia may struggle with this, affecting their ability to navigate and respond appropriately in social interactions [4]. Research indicates that social perception deficit is distinct from the more general cognitive deficits seen in schizophrenia, such as problems with memory or attention and they have a unique impact on functional outcomes [5]. Improving social perception in schizophrenia patients has been identified as a crucial area for intervention, as enhancements in social cognitive abilities can lead to better social functioning and overall quality of life [6].
Previous studies have reported that the Emotion Intensity Recognition Task (EIRT) is used to evaluate the function of social perception [7, 8]. The EIRT is a psychological assessment tool designed to measure an individual’s ability to discern and evaluate the intensity of emotional expressions. This task typically involves presenting participants with a series of stimuli, such as facial expressions, vocal tones, or written scenarios, which depict various emotions at different intensity levels. Participants are then asked to rate the intensity of the emotion being expressed using a specified scale. The task is crucial for understanding emotional processing and regulation as it provides insights into how individuals perceive and respond to emotional cues [9].
Research on the EIRT in schizophrenia has provided significant insights into the emotional processing deficits commonly associated with this psychiatric disorder. Schizophrenia is characterized by profound disruptions in cognitive and emotional functioning and the EIRT has been instrumental in quantifying the extent to which individuals with schizophrenia can perceive and evaluate emotional intensities. Studies utilizing the EIRT in schizophrenia populations have consistently demonstrated that these individuals often exhibit impaired recognition of emotional intensity, particularly in facial expressions and vocal tones [8, 10]. These deficits are more marked for negative emotions, including fear and anger, potentially contributing to the social and functional deficits observed in schizophrenia.
Further investigations are exploring the neurobiological underpinnings of social perception deficit, with studies employing neuroimaging techniques to examine the brain regions involved in emotional processing [11, 12, 13]. Such research aims to develop a more comprehensive understanding of the connection between neural abnormalities and emotional recognition challenges in schizophrenia, thus opening avenues for novel therapeutic strategies.
Employing EIRT in conjunction with neuroimaging modalities such as the blood oxygen level dependent magnetic resonance imaging (MRI) has been pivotal in elucidating the neural mechanisms underlying these deficits [8]. Neuroimaging studies using EIRT have revealed altered activation patterns in key brain regions involved in emotional processing in individuals with schizophrenia. For instance, reduced activity in the amygdala, prefrontal cortex and fusiform gyrus during a task is frequently observed [14, 15, 16]. These areas are essential for emotion recognition and intensity differentiation, suggesting that the neural circuitry typically engaged in processing emotional cues is disrupted in schizophrenia [17, 18]. With good spatial resolution, functional MRI (fMRI) can be used to study cognitive function, however, fMRI is disadvantaged by low temporal resolution, thus techniques with higher temporal resolution are required to better probe changes in cognitive state during the EIRT.
Event-related potentials (ERPs) are electrophysiological responses to specific sensory, cognitive, or motor events. They are derived from electroencephalography (EEG) recordings and are characterized by their time-locked relationship with external or internal stimuli. ERPs provide a direct measure of the neural activity associated with processing of these events, offering a unique temporal resolution of the order of milliseconds [19]. Due to their non-invasive nature and fine temporal resolution, ERPs are extensively used in cognitive neuroscience, psychology and clinical research [20, 21].
Previous studies using ERP technology have shown that patients with schizophrenia have impaired facial emotion recognition function, primarily manifested as a decrease in the efficiency of decoding facial emotional features [22, 23]. However, the results of these studies are limited by the experimental paradigm and need to be further confirmed by a well-established experimental paradigm that reflects social cognitive function, such as social perception, to confirm the functional deficits in social perception of schizophrenia patients. Further examination of these ERP characteristics could enhance understanding of the neural processes involved in social perception within this population. Insights gained from understanding the neural mechanisms responsible for deficits in social perception could identify novel targets for pharmacological and neuromodulatory interventions. The study reported here included both schizophrenia patients and healthy controls (HCs). The EIRT was used to investigate the neural processes underlying social perception and to measure ERPs during the EIRT. The aim was to delineate ERP characteristics of social perception and further explore the neural mechanisms involved in the cognitive processing of abnormal social perceptions in schizophrenia.
Participants in this study were diagnosed with schizophrenia. Diagnosis adhered to the criteria outlined in the Diagnostic and Statistical Manual of Mental Disorders, Fifth Edition. Participant ages ranged from 18 to 65 years. Exclusion criteria for patients included: (1) Presence of any physical illness as confirmed by clinical evaluations and medical records; (2) History of substance abuse or dependence; (3) Modified electroconvulsive therapy within the previous 12 months. For HCs, inclusion criteria were: (1) Absence of psychiatric disorders as per diagnostic and statistical manual of mental disorders, fifth edition (DSM-5) criteria; (2) No current use of medications known to affect cognitive functions; (3) Age range 18 to 65 years.
Schizophrenia patients were selected from the Wuxi Mental Health Center, China.
HCs were recruited from Wuxi City, China, via advertisements in local residential
communities. Sample size estimation was performed using G*Power software (Version
3.1.9.7; Heinrich-Heine-Universität Düsseldorf, Düsseldorf, Germany),
targeting a statistical power of 0.95 (1-
Prior to the commencement of the experiment, written informed consent was obtained from all participants after thoroughly explaining the procedures. In cases where schizophrenia patients lacked the capacity to consent, detailed explanations of the experimental procedures were provided to their next of kin, caretakers, or legal guardians, who then gave consent on their behalf.
The study was conducted from December 1, 2023, to December 31, 2024. It received ethical approval from the Ethics Committee on Human Studies (WXMHCIRB2023LLky076) at Wuxi Mental Health Center, China and was conducted in compliance with the Declaration of Helsinki.
The handedness for all participants was assessed by the Annett handedness scale [24]. Patients with schizophrenia were assessed by both an associate chief psychiatrist and a psychiatric resident. Psychopathology was assessed using the Positive and Negative Syndrome Scale (PANSS). This meant that a chlorpromazine-equivalent dose was calculated based on previously reported methodologies [25]. To assess cognitive processing in terms of social perception, participants were administered the EIRT.
The EIRT was developed based on the methodology outlined in Adolphs et al. [26]. As shown in Fig. 1, this task employed a set of facial stimuli sourced from the Chinese Affective Picture System [27]. It consisted of six expressive faces depicting happiness, sadness, fear, anger, disgust and surprise, along with three neutral faces. The EIRT paradigm was programmed with E-Prime 3.0 software (Psychological Software Incorporated, Pittsburgh, PA, USA). Participants were presented with 39 face stimuli in a randomized sequence across each block, without a time constraint. The procedure was replicated across six distinct blocks. In each block, participants were exposed to one specific emotional label and were required to evaluate the intensity of the emotion displayed by the faces on a scale ranging from zero (not at all) to five (very much). Following the assessment of all 39 faces corresponding to a particular emotion, subjects proceeded to rate faces in the context of a different emotion in the subsequent block. For each facial stimulus, participants rated the intensity of all six fundamental emotions. Reaction times (RTs) and accuracy levels were documented for each trial across the six experiments. The RT was determined as the duration from the presentation of the facial image to the moment of pressing the key to select a response. Accuracy was defined as the proportion of correct responses selected by participants when identifying specific facial expressions in each experimental block. In the ERIT Task, to account for the potential variability in subjects’ perceptions of the absolute intensity of emotional facial stimuli (For instance, where some subjects might rate all stimuli as highly intense while others may perceive them as rather weak) we quantified each subject’s accuracy of task performance in recognizing different emotional faces using Pearson correlation coefficients. Further details of the task and the analytical procedures have been delineated in prior research [26, 28, 29, 30].
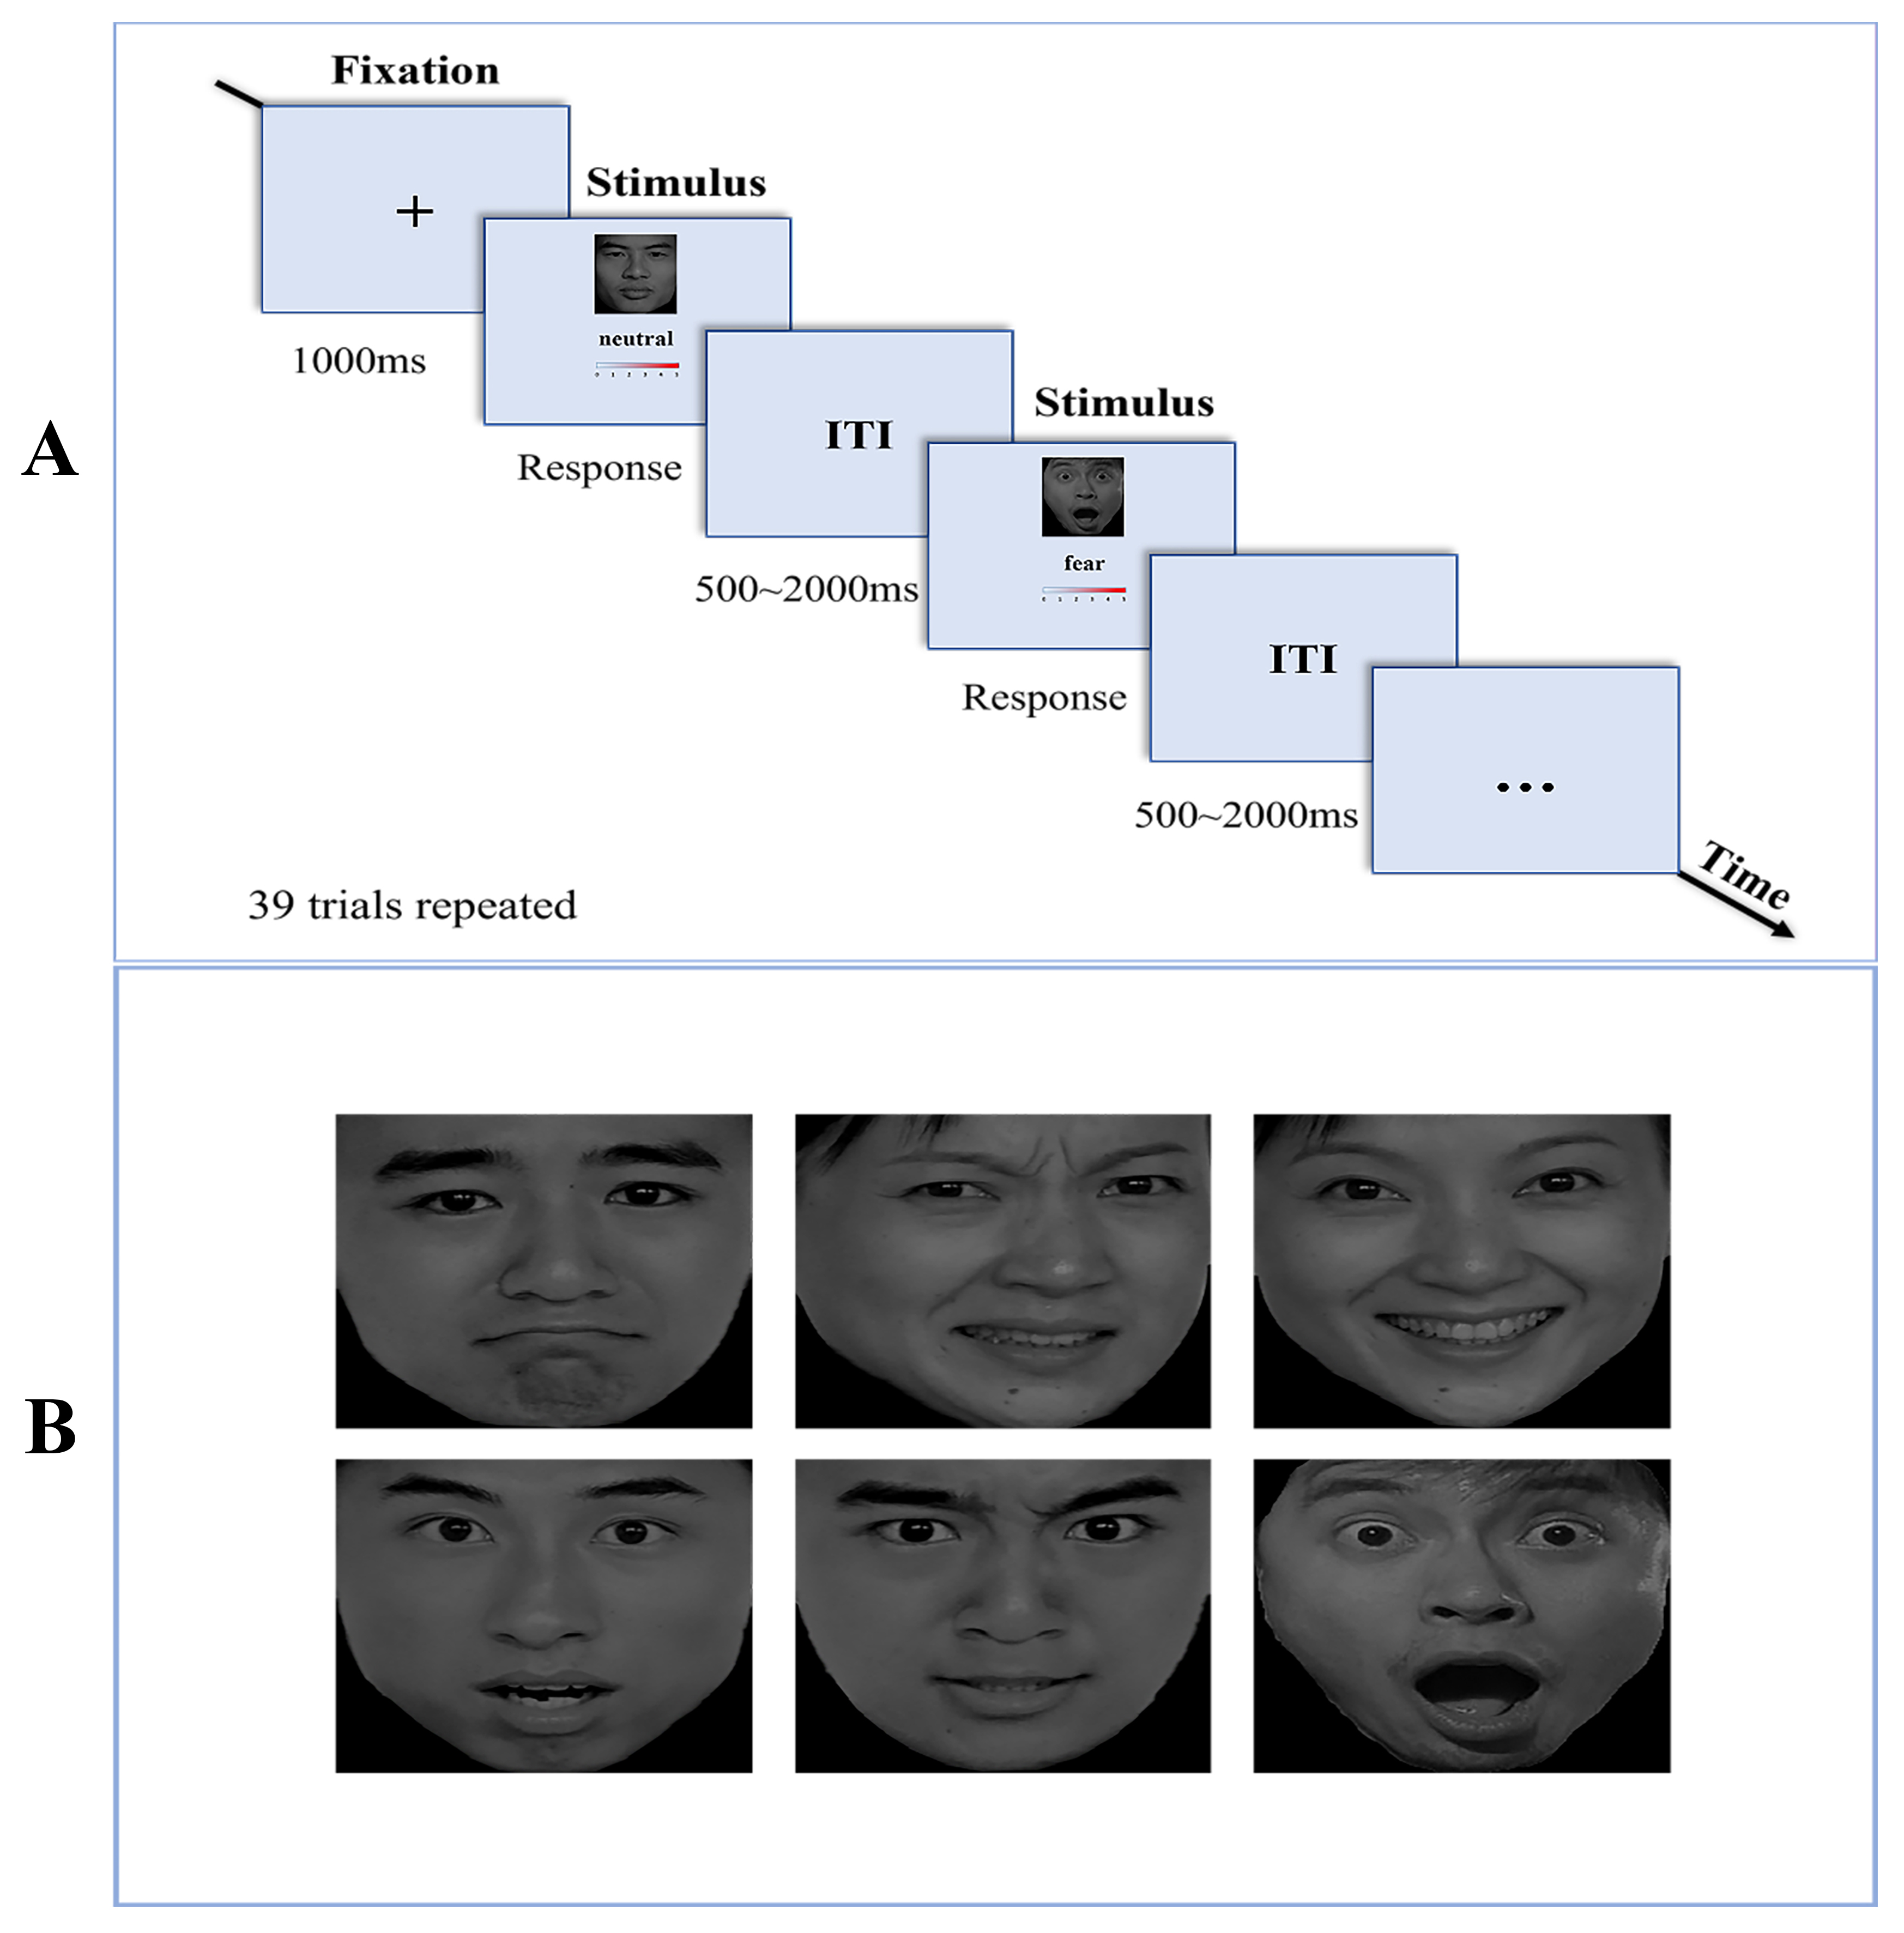 Fig. 1.
Procedure of the EIRT Task. (A) Illustration of the EIRT task, there were six blocks with different target stimuli and each block contained 39 trials. (B) The emotional facial stimuli employed in the EIRT task. Top row: sad, disgusted, happy faces. Base row: surprise, anger, fear faces. This figure was drawn using Adobe Photoshop 2024 (Adobe Systems lnc., San Jose, CA, USA.). Abbreviations: EIRT, Emotion Intensity Recognition Task; ITI, inter-trial interval.
Continuous electroencephalographic recordings (EEGs, bandpass filtered between
0.05 to 100 Hz, digitized at 500 Hz) were conducted using a 64-channel Ag-AgCl
elastic cap, adhering to the International 10/20 System, via the BioSemi Active
Two system (https://www.biosemi.com/Products_ActiveTwo.htm). Electrooculographic recordings included vertical measurements (VEOG)
from electrodes above and below the left eye, and horizontal measurements from
electrodes placed at the outer canthi of both eyes. Reference electrodes were
affixed to the left and right mastoids and the ground electrode was situated
beneath the left clavicle. Impedance across all electrodes was kept under 5
k
Following the methodology outlined by Li et al. [7], electrode sites were selected in the frontal lobe (F3, Fz, F4), central lobe (C3, Cz, C4) and parietal lobe (P3, Pz, P4) for subsequent analysis. Based on the grand average ERPs and referring to previous reports [7], the following ERP components were analyzed in several different duration time-windows: N100 (100–140 ms), P200 (150–200 ms), N250 (210–300 ms) and LPP (400–800 ms). In this study, the mean amplitude and latency of each ERP component and electrode site were measured, then mean amplitudes and latencies for each of the three brain regions studies were obtained.
Data were analyzed using the Statistical Program for Social Sciences software
version 22.0 (SPSS, IBM Corp, Armonk, NY, USA). Comparisons of mean age (years),
educational attainment (years), duration of illness (months) and age at onset
were made between patients with schizophrenia and HCs using independent sample
t-tests. Additionally, differences in handedness and sex ratio were
assessed using the Pearson chi-square test. A two (group: schizophrenia patient
(SCZ) vs. HC)
As shown in Table 1, there were no significant differences between the two groups in age, gender and years of education. The SCZ group were all inpatients who had been receiving stable doses of antipsychotic medication during their hospitalization.
| Variables | SCZ (n = 33) | HC (n = 35) | Statistical value | |
| t | p | |||
| Age (years) | 34.4 (7.4) | 33.9 (5.2) | 0.311 | 0.756 |
| Sex (male/female) | 22/11 | 21/14 | 0.325 (χ2) | 0.569 |
| Education (years) | 14.0 (2.2) | 14.3 (2.2) | –0.649 | 0.519 |
| Handedness (R/M/L) | 10/11/12 | 11/13/11 | 0.199 (χ2) | 0.905 |
| Age at onset (years) | 22.7 (6.1) | - | - | - |
| Duration of illness (years) | 11.9 (6.4) | - | - | - |
| Antipsychotics (mg/day chlorpromazine equivalent) | 506.7 (298.6) | - | - | - |
| PANSS Positive | 17.0 (5.1) | - | - | - |
| PANSS Negative | 17.6 (5.3) | - | - | - |
| PANSS General | 34.7 (9.2) | - | - | - |
| PANSS Total | 69.3 (16.6) | - | - | - |
Abbreviations: SCZ, schizophrenia; HC, healthy control; SD, standard deviation; R, Right; M, Mixed; L, Left; PANSS, Positive and Negative Syndrome Scale.
RTs showed a significant main effect for emotion type [F (5, 62) =
4.186, p = 0. 002,
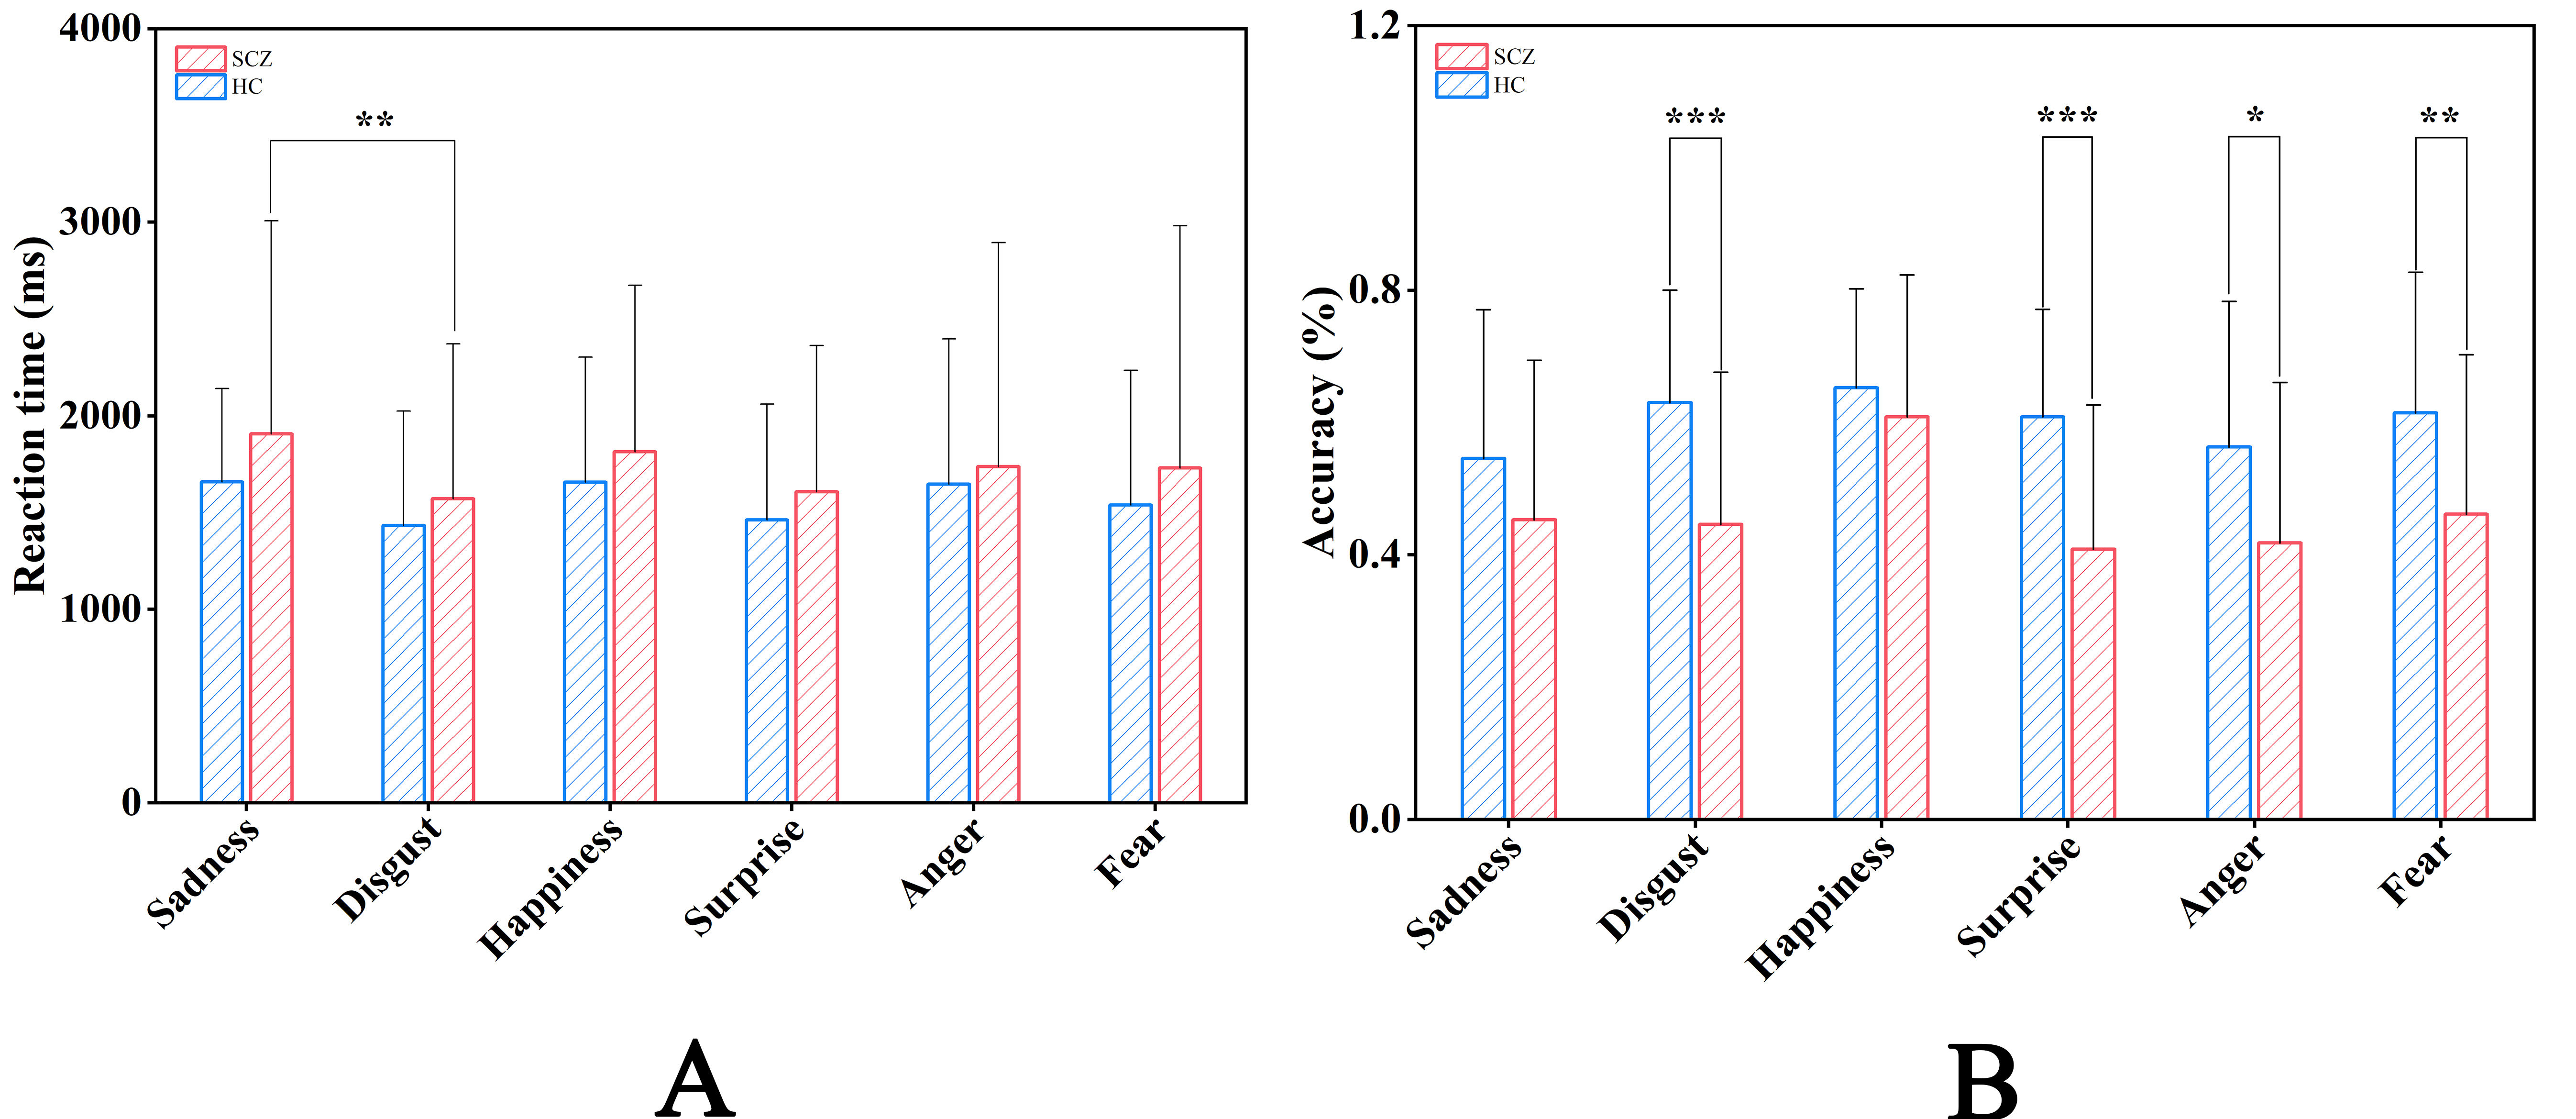 Fig. 2.
Comparisons of Behavioral Data. Reaction Time (A) and
Accuracy (B) in the different emotional faces for Schizophrenia group and Healthy
control group. Notes: *p
Accuracy showed a significant main effect for the group [F (1, 66) =
8.908, p = 0.004,
The average number of trials for ERP data analysis in each emotional face experiment is given in Table 2. No significant differences were observed in six emotional face experiments between the SCZ and HC groups. This finding confirms the comparability of the valid number of trials for the ERP components between subjects from both groups, thereby establishing a rational and valid foundation for subsequent ERP data analysis.
| Emotions | SCZ (n = 33) | HC (n = 35) | Statistical value | |
| t | p | |||
| Happiness | 34.9 (2.4) | 34.5 (2.1) | 0.831 | 0.409 |
| Sad | 34.1 (1.4) | 33.9 (1.3) | 0.448 | 0.656 |
| Angry | 35.4 (1.1) | 34.9 (1.5) | 1.791 | 0.078 |
| Fear | 36.3 (1.6) | 35.9 (2.1) | 1.052 | 0.297 |
| Surprise | 35.3 (1.4) | 35.3 (1.8) | –0.024 | 0.981 |
| Disgust | 35.0 (1.6) | 35.1 (1.2) | –0.165 | 0.869 |
Abbreviations: SCZ, schizophrenia; HC, healthy control; SD, standard deviation; ERP, event-related potential.
The mean amplitudes and latencies of the N100, P200, N250 and LPP for different emotional faces in frontal, central and parietal lobes are given in Table 3.
| Variables | SCZ (n = 33) | HC (n = 35) | ||||||||||
|---|---|---|---|---|---|---|---|---|---|---|---|---|
| Frontal lobe | Central lobe | Parietal lobe | Frontal lobe | Central lobe | Parietal lobe | |||||||
| Amplitude | Latency | Amplitude | Latency | Amplitude | Latency | Amplitude | Latency | Amplitude | Latency | Amplitude | Latency | |
| N100 | ||||||||||||
| Sad | –0.1 (3.1) | 110.7 (8.7) | –0.2 (2.7) | 115.3 (11.6) | –0.3 (2.4) | 119.8 (14.1) | –0.9 (2.6) | 113.4 (10.5) | –0.8 (2.4) | 113.8 (10.7) | –0.8 (2.1) | 121.2 (12.3) |
| Disgust | –0.6 (2.8) | 114.7 (13.5) | –0.6 (2.4) | 117.8 (13.2) | –0.6 (2.4) | 123.1 (12.0) | –1.6 (2.2) | 114.6 (11.0) | –1.6 (2.1) | 116.2 (11.4) | –1.5 (2.0) | 123.0 (11.1) |
| Happy | –0.3 (2.9) | 111.1 (11.0) | –0.4 (2.5) | 114.5 (12.0) | –0.4 (2.4) | 119.2 (13.9) | –1.2 (2.5) | 115.9 (12.1) | –0.9 (2.1) | 114.9 (11.8) | –0.5 (2.1) | 118.9 (13.6) |
| Surprise | –0.3 (3.3) | 112.9 (11.4) | –0.5 (2.9) | 116.4 (12.3) | –0.5 (2.4) | 121.6 (13.1) | –0.6 (2.8) | 113.0 (11.1) | –0.5 (2.3) | 115.4 (11.6) | –0.5 (1.9) | 122.4 (12.1) |
| Anger | –0.3 (3.2) | 112.7 (11.0) | –0.5 (2.5) | 116.3 (11.9) | –0.6 (2.1) | 123.6 (12.9) | –1.0 (2.6) | 113.4 (11.2) | –0.9 (2.2) | 114.4 (11.8) | –0.9 (2.0) | 120.8 (11.8) |
| Fear | –0.7 (2.9) | 112.8 (10.0) | –0.8 (2.6) | 115.6 (11.1) | –0.6 (2.2) | 122.2 (13.2) | –1.6 (2.1) | 115.1 (11.7) | –1.5 (2.1) | 116.5 (12.7) | –1.0 (2.2) | 122.0 (12.7) |
| P200 | ||||||||||||
| Sad | 5.5 (4.4) | 172.6 (15.9) | 4.5 (3.2) | 173.3 (14.0) | 2.7 (2.9) | 183.1 (14.8) | 5.7 (3.5) | 167.2 (12.1) | 4.9 (3.4) | 170.7 (12.6) | 3.3 (3.5) | 183.1 (13.0) |
| Disgust | 4.9 (4.3) | 173.6 (14.0) | 4.2 (3.6) | 175.9 (14.6) | 2.6 (3.0) | 185.8 (13.7) | 5.9 (4.2) | 171.6 (12.4) | 5.1 (3.9) | 174.6 (14.1) | 3.6 (4.0) | 182.1 (12.4) |
| Happy | 5.0 (4.3) | 170.2 (14.2) | 4.0 (3.3) | 172.8 (14.8) | 2.4 (3.0) | 182.7 (17.1) | 5.8 (3.2) | 166.3 (11.4) | 4.8 (3.1) | 168.0 (12.6) | 3.3 (3.5) | 177.5 (13.5) |
| Surprise | 4.3 (4.7) | 170.9 (13.7) | 3.6 (3.8) | 175.2 (15.0) | 2.2 (3.2) | 182.1 (15.4) | 5.7 (3.6) | 167.9 (12.6) | 5.0 (3.4) | 169.6 (12.5) | 3.4 (3.6) | 179.4 (13.7) |
| Anger | 5.3 (4.1) | 170.3 (14.0) | 4.4 (3.0) | 171.9 (14.2) | 2.8 (2.8) | 184.7 (13.2) | 5.4 (3.6) | 167.2 (12.6) | 4.7 (3.2) | 167.5 (12.1) | 3.3 (3.3) | 177.6 (14.2) |
| Fear | 5.2 (4.2) | 172.3 (15.2) | 4.4 (3.2) | 174.9 (13.2) | 2.7 (2.7) | 182.2 (17.2) | 6.5 (3.2) | 169.3 (12.7) | 5.6 (3.2) | 170.0 (12.3) | 3.9 (3.5) | 178.6 (13.3) |
| N250 | ||||||||||||
| Sad | 0.7 (3.8) | 246.0 (26.0) | 2.3 (2.8) | 244.3 (27.0) | 5.5 (2.4) | 246.6 (32.8) | 1.5 (4.6) | 236.3 (17.2) | 2.7 (4.0) | 239.6 (22.2) | 5.5 (3.2) | 236.8 (25.1) |
| Disgust | 0.5 (3.6) | 255.8 (27.0) | 2.2 (2.5) | 248.2 (27.2) | 5.2 (2.3) | 246.3 (33.0) | 1.4 (4.5) | 237.6 (19.1) | 2.7 (3.8) | 237.3 (19.7) | 5.3 (3.4) | 235.7 (24.1) |
| Happy | 1.0 (3.7) | 249.0 (27.1) | 2.5 (3.1) | 246.4 (30.5) | 5.3 (3.1) | 247.8 (34.1) | 0.9 (4.1) | 236.8 (19.3) | 2.0 (3.6) | 237.3 (23.9) | 5.1 (2.9) | 235.2 (27.1) |
| Surprise | 0.3 (3.4) | 248.7 (28.2) | 2.0 (2.8) | 246.5 (26.9) | 5.3 (3.0) | 239.9 (30.2) | 1.2 (4.6) | 239.2 (21.5) | 2.6 (4.0) | 238.4 (23.9) | 5.5 (3.2) | 236.4 (25.7) |
| Anger | 0.9 (3.6) | 251.9 (28.9) | 2.6 (2.8) | 245.3 (27.7) | 5.6 (2.8) | 247.1 (34.9) | 1.3 (4.4) | 239.1 (18.3) | 2.6 (3.6) | 239.3 (24.3) | 5.3 (3.2) | 236.9 (25.7) |
| Fear | 0.9 (3.3) | 247.2 (25.2) | 2.7 (2.6) | 241.8 (24.1) | 5.7 (2.8) | 240.6 (30.0) | 1.7 (4.4) | 241.0 (23.3) | 3.0 (3.6) | 240.6 (24.6) | 5.9 (2.9) | 236.6 (26.7) |
| LPP | ||||||||||||
| Sad | 5.4 (3.5) | 579.9 (98.8) | 5.9 (3.0) | 582.3 (104.7) | 5.9 (2.9) | 557.5 (110.9) | 7.8 (4.7) | 579.1 (119.0) | 8.1 (3.9) | 580.5 (115.1) | 9.1 (3.3) | 532.6 (110.1) |
| Disgust | 5.2 (4.0) | 583.1 (108.0) | 5.7 (3.4) | 590.1 (108.3) | 5.4 (2.9) | 559.3 (111.6) | 7.7 (4.2) | 560.5 (122.9) | 8.1 (3.3) | 563.3 (114.3) | 9.0 (2.8) | 528.3 (105.5) |
| Happy | 6.1 (4.5) | 585.3 (121.8) | 6.5 (4.0) | 605.5 (119.7) | 6.1 (3.6) | 574.4 (113.8) | 7.2 (4.5) | 596.3 (116.1) | 7.8 (4.1) | 601.6 (102.9) | 9.1 (3.3) | 594.3 (104.6) |
| Surprise | 5.1 (3.9) | 561.6 (136.4) | 5.5 (3.6) | 567.6 (126.4) | 5.3 (3.2) | 504.2 (107.6) | 6.1 (4.6) | 592.2 (129.8) | 6.8 (3.9) | 595.0 (114.3) | 7.9 (3.2) | 546.2 (113.0) |
| Anger | 4.9 (4.4) | 570.9 (127.1) | 5.5 (3.8) | 583.6 (110.6) | 5.6 (3.1) | 568.2 (100.9) | 7.1 (5.0) | 568.5 (120.5) | 7.7 (4.3) | 565.7 (109.5) | 8.8 (4.0) | 518.2 (101.5) |
| Fear | 5.5 (4.0) | 563.6 (127.3) | 6.1 (3.7) | 565.7 (114.4) | 5.9 (3.1) | 524.6 (126.8) | 7.5 (5.5) | 584.7 (118.7) | 8.2 (4.7) | 579.0 (108.7) | 9.4 (4.4) | 546.4 (104.9) |
Abbreviations: SCZ, schizophrenia; HC, healthy control; SD, standard deviation, LPP, late positive potential.
As given in Figs. 3,4, for the N100 mean amplitudes, no significant main effect
was revealed either for the group or the group
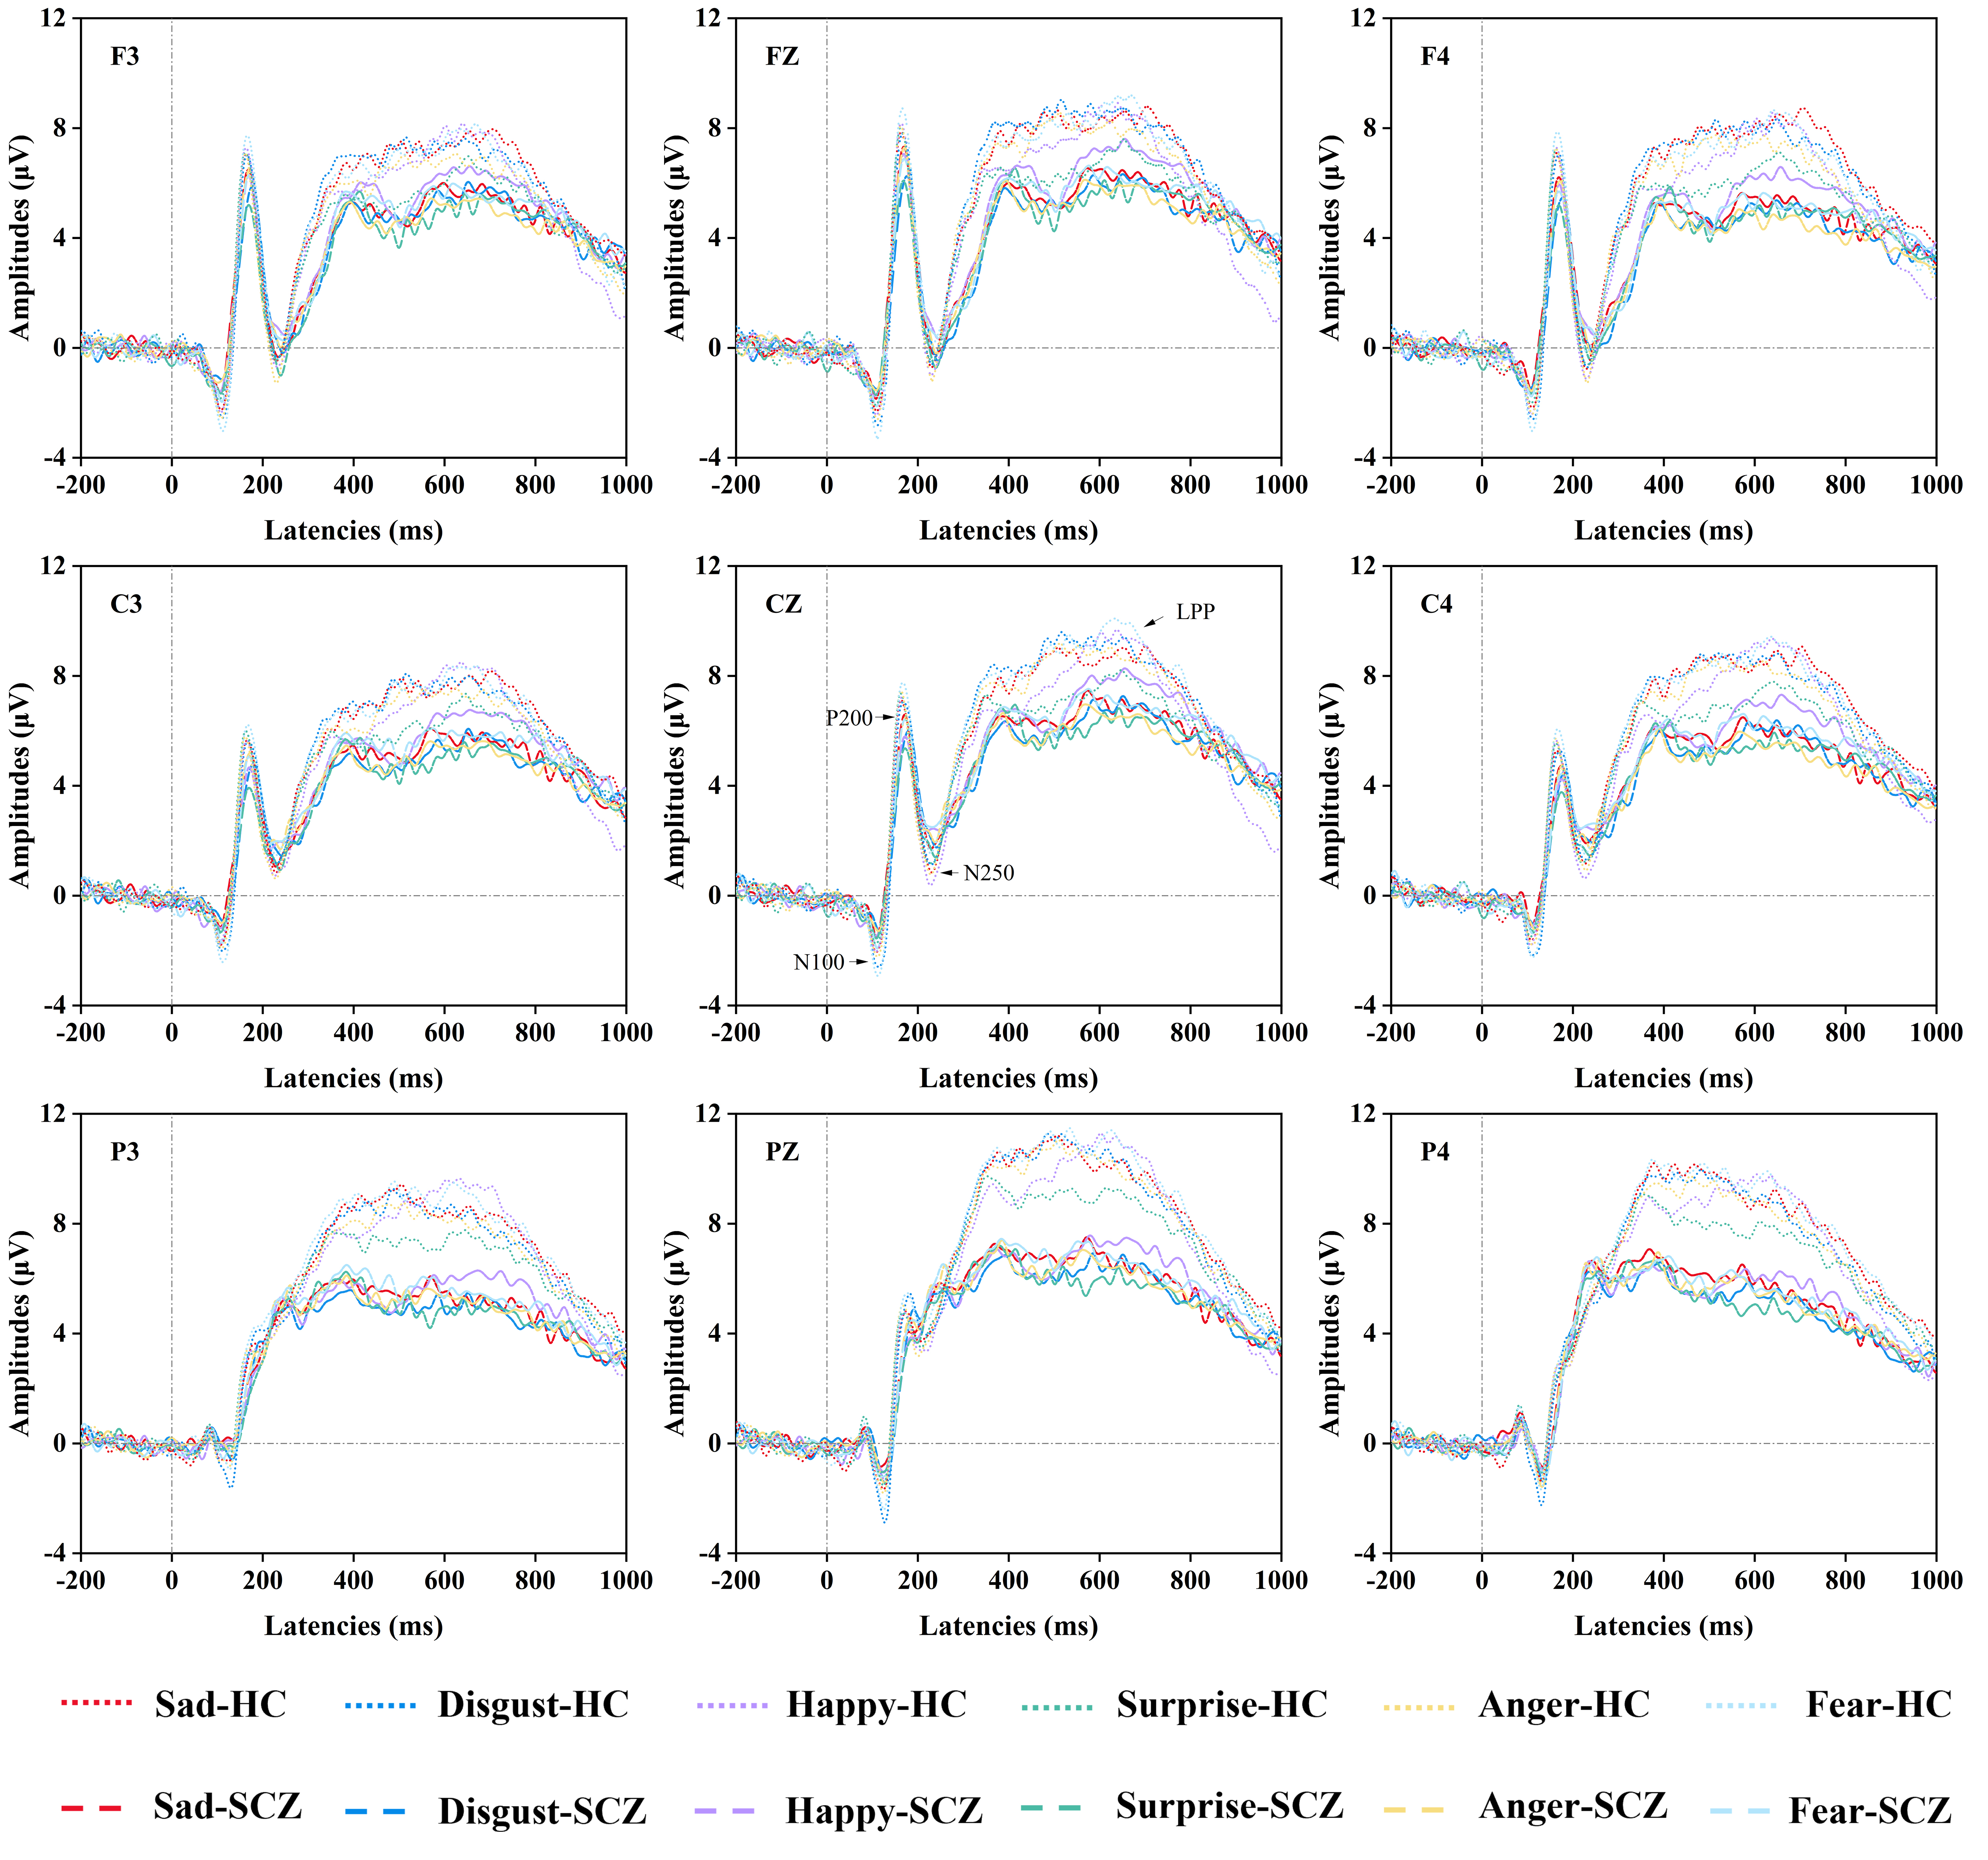 Fig. 3.
Comparisons of ERP Data. The grand averaged ERP (N100, P200, N250, LPP) waveforms for selected electrodes (F3, Fz, F4, C3, Cz, C4, P3, Pz, P4) in the schizophrenia group and the healthy control group under different emotional faces (sad faces, disgust faces, happy faces, surprise faces, anger faces, fear faces). Abbreviations: SCZ, schizophrenia; HC, healthy control; LPP, late positive potential; ERP, event-related potential.
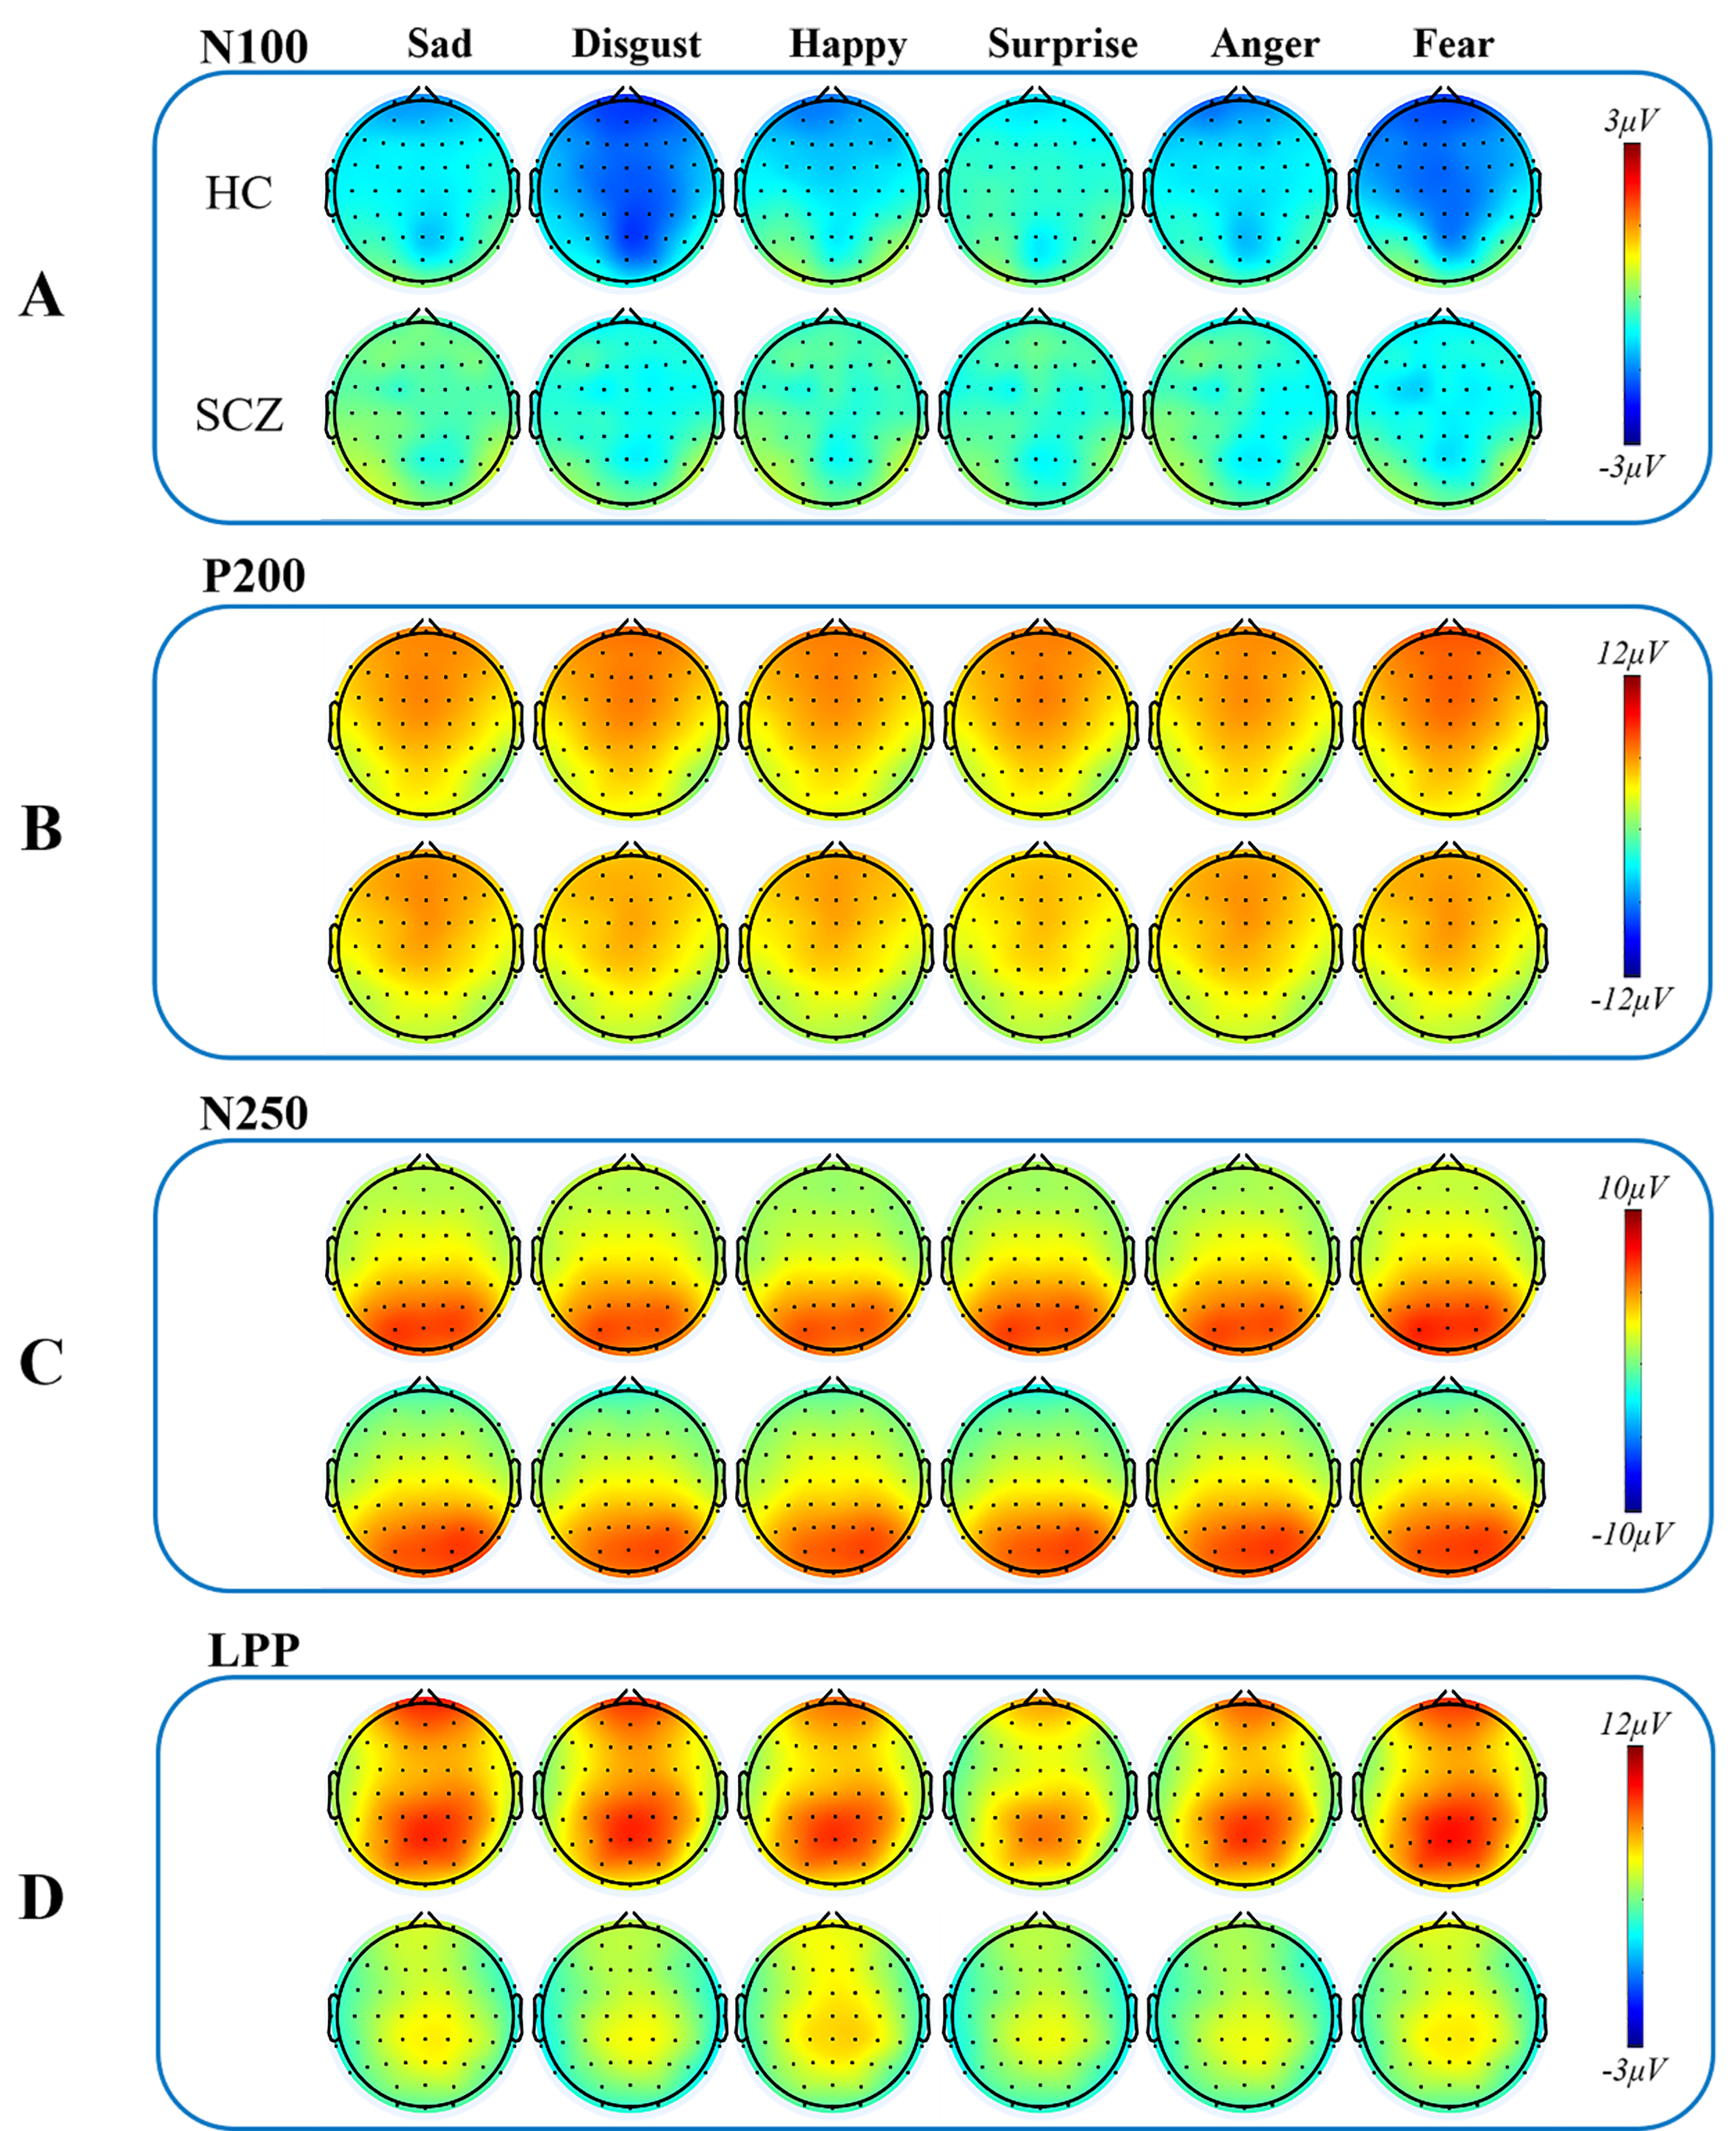 Fig. 4.
Topographic maps of ERP components. Topographic maps of four ERP components (N100, P200, N250, LPP) in different emotional faces (sad faces, disgust faces, happy faces, surprise faces, anger faces, and fear faces) in the schizophrenia group and the healthy control group. (A) Topographical distribution of grand averaged N100 within a time window of 100–140 ms post-stimuli under different emotional faces. (B) Topographical distribution of grand averaged P200 within a time window of 150–200 ms post-stimuli under different emotional faces. (C) Topographical distribution of grand averaged N250 within a time window of 210–300 ms post-stimuli under different emotional faces. (D) Topographical distribution of grand averaged LPP within a time window of 400–800 ms post-stimuli under different emotional faces. Abbreviations: SCZ, schizophrenia; HC, healthy control; LPP, late positive potential, ERP, event-related potential.
For the N100 latencies, no main effect was revealed for either the group or the
group
The P200 mean amplitudes, given in Figs. 3,4, showed no significant main effect
either for the group or the group
For the P200 latencies, analysis revealed no significant main effect for either
the group or the group
As given in Figs. 3,4, for the N250 mean amplitudes, it was revealed that there
was no main effect for either the group or the group
For the N250 latency, there were neither significant main effects nor interactions.
As given in Figs. 3,4, for the LPP mean amplitudes, it was revealed that the
main effects of the group [F (1, 66) = 7.563, p = 0. 008,
For the LPP latencies, analysis revealed neither main effect for the group nor
the group
As shown in Fig. 5, in the SCZ group, the Positive and Negative Syndrome Scale - Positive Symptoms Subscale (PANSS-P) scores were found to be negatively correlated with the P200 latencies (r = –0.350, p = 0.046, p fdr = 0.256), and the LPP mean amplitudes for sad faces (r = –0.379, p = 0.030, p fdr = 0.221). Among disgust faces, PANSS-P scores were negatively correlated with the N250 latencies (r = –0.406, p = 0.019, p fdr = 0.148). Among happy faces, the PANSS-P scores were negatively correlated with the P200 latencies, their mean amplitudes and the N250 latencies (r = –0.422, –0.392, –0.397, p = 0.015, 0.024, 0.022, p fdr = 0.095, 0.117, 0.114). There was also a negative correlation between the Positive and Negative Syndrome Scale Total Scores (PANSS-T) scores and the P200 mean amplitudes (r = –0.414, p = 0.017, p fdr = 0.095) for happy faces. Among surprise faces, the PANSS-P scores were negatively correlated with the P200 and LPP mean amplitudes (r = –0.383, –0.371, p = 0.028, 0.034, p fdr = 0.168, 0.189). There was also a negative correlation between the PANSS-T scores and the P200 mean amplitudes (r = –0.351, p = 0.045, p fdr = 0.219) for surprise faces. Among anger faces, the PANSS-P scores were negatively correlated with the P200 and LPP mean amplitudes (r = –0.439, –0.376, p = 0.011, 0.031, p fdr = 0.086, 0.186). The PANSS-T scores were negatively correlated with the P200 mean amplitudes (r = –0.355, p = 0.043, pfdr = 0.202). RTs were negatively correlated with the N100 mean amplitudes (r = –0.357, p = 0.042, p fdr = 0.202). Among fear faces, it was found that the P200 mean amplitude was negatively correlated with the Positive and Negative Syndrome Scale - Negative Symptoms Subscale (PANSS-N) scores and PANSS-T scores (r = –0.361, –0.373, p = 0.039, 0.032, p fdr = 0.179, 0.161). There was also a negative correlation for fear faces between the PANSS-P scores and the P200 latencies (r = –0.372, p = 0.033, p fdr = 0.161). No statistically significant correlations were found between other ERP component latencies and amplitudes, RTs and scale scores.
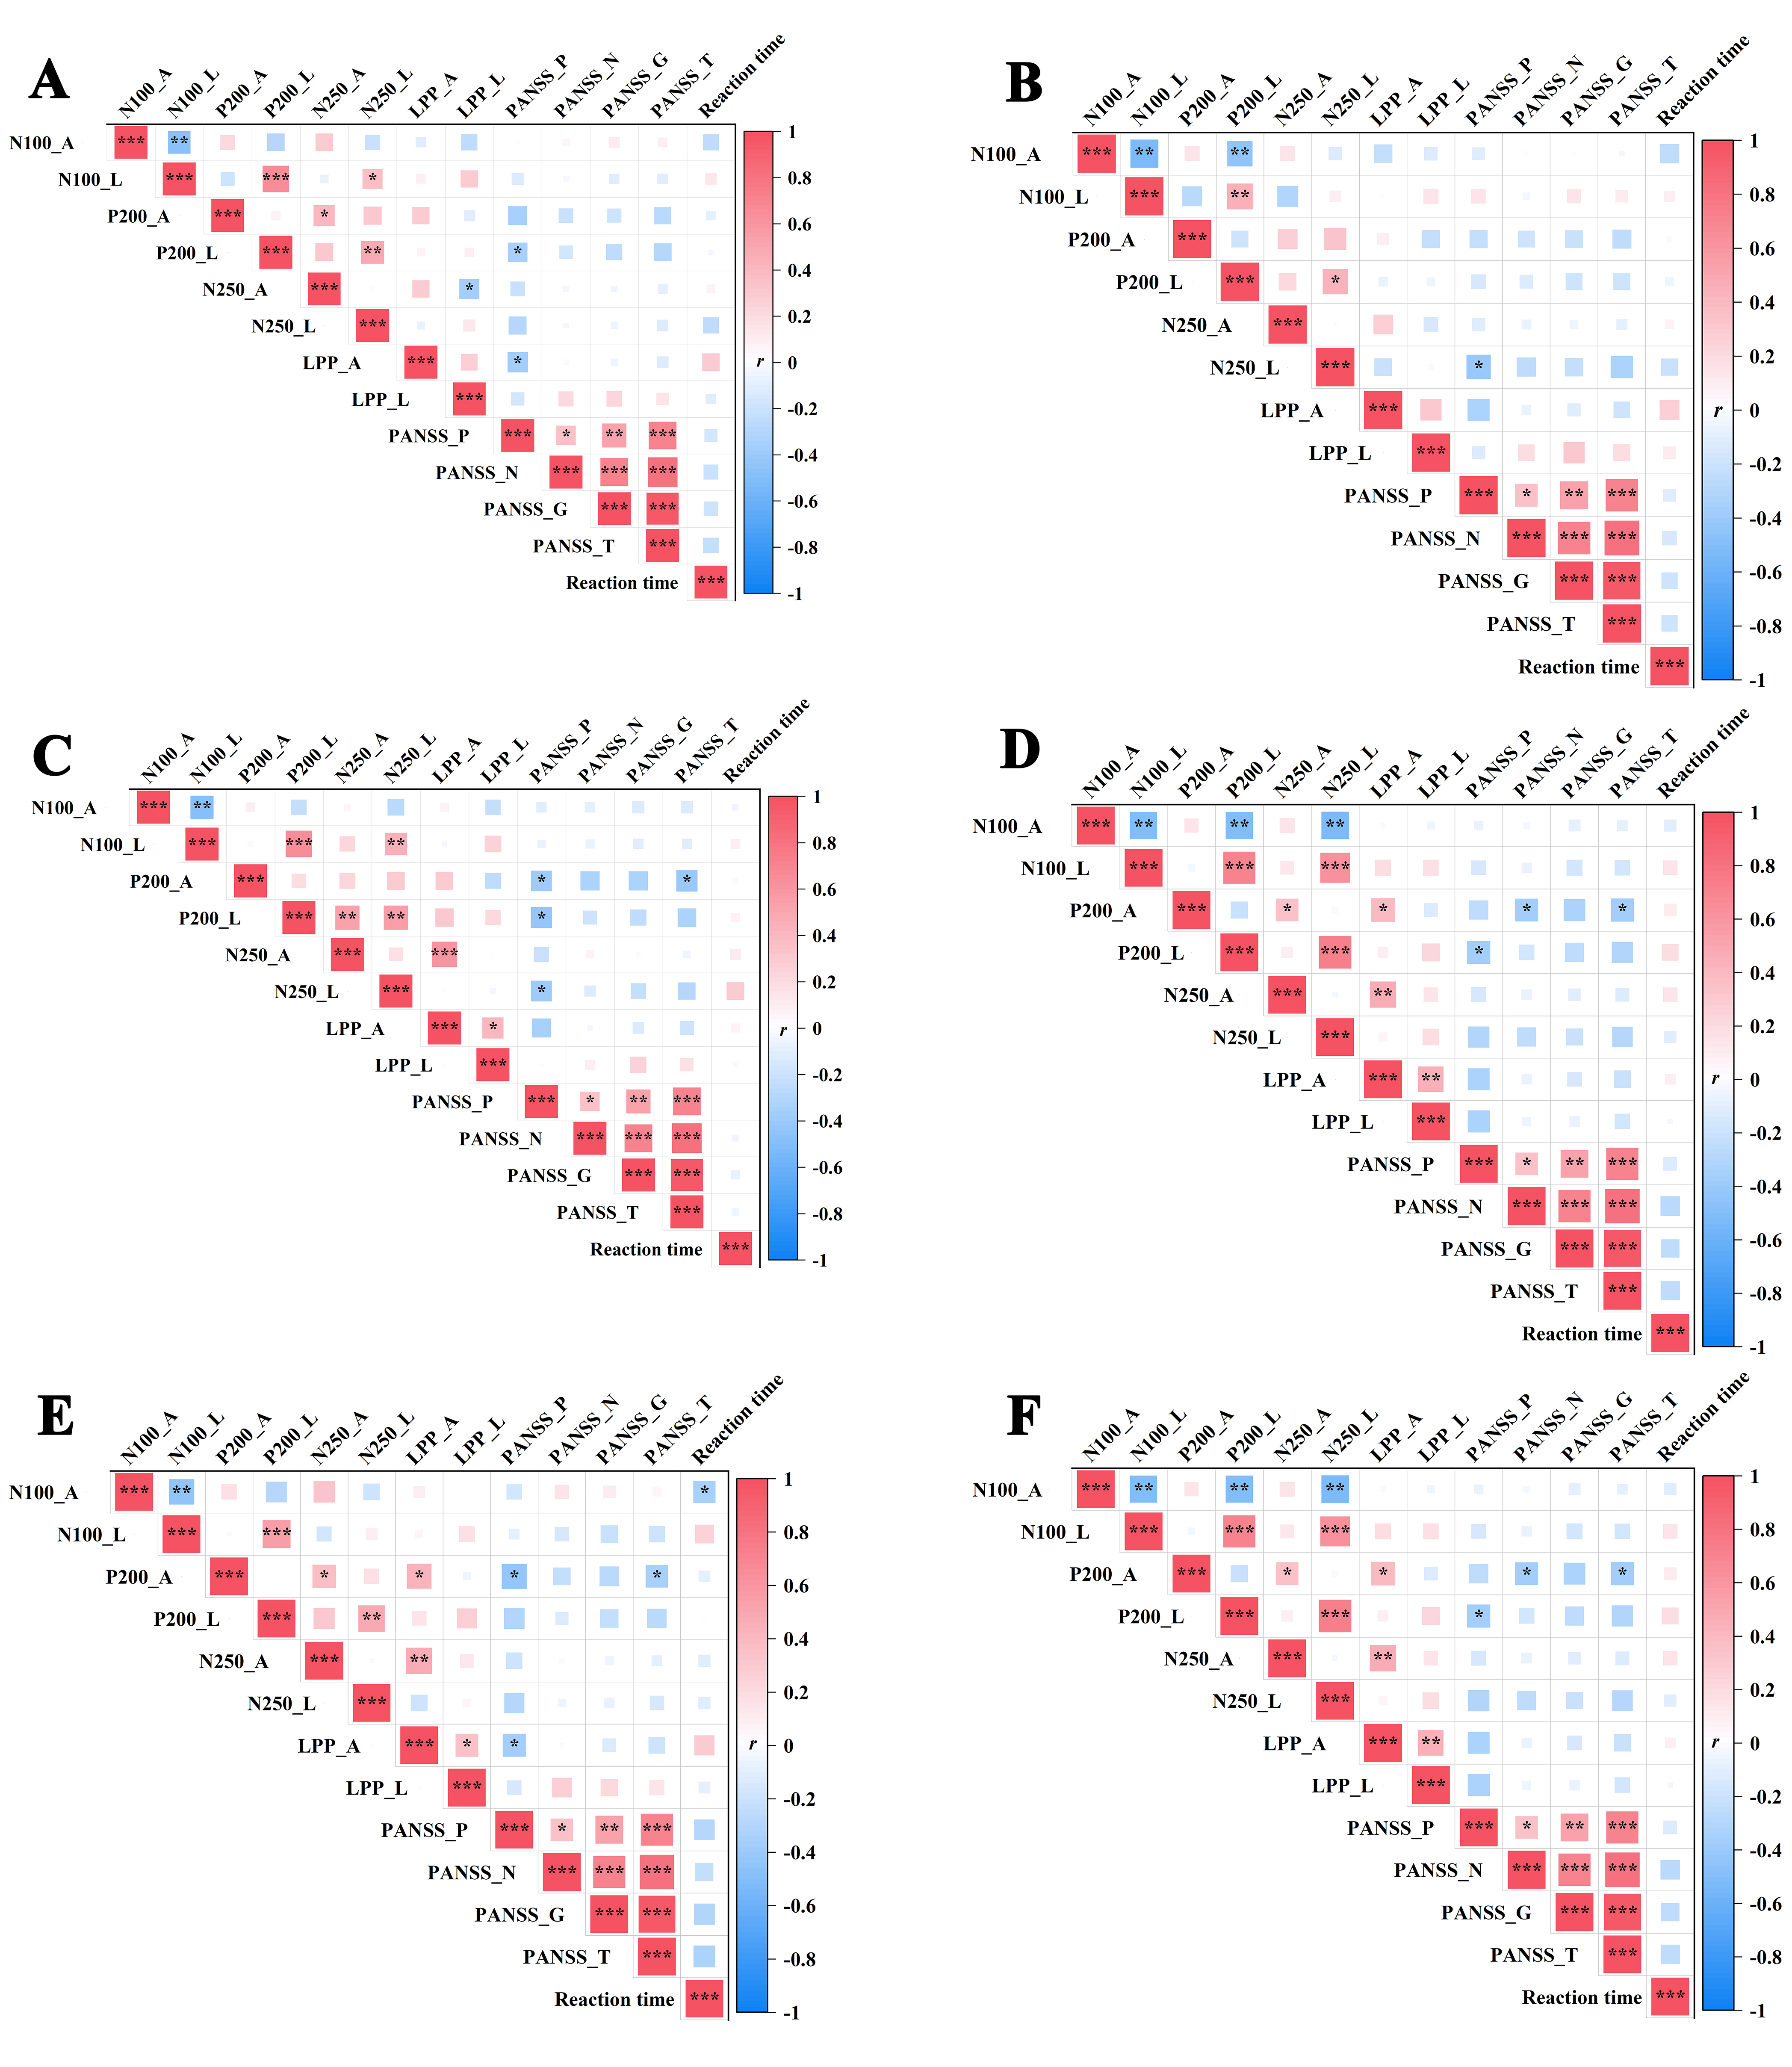 Fig. 5.
The correlation analysis of ERP (N100, P200, N250, LPP)
components’ latency and mean amplitude, reaction times and scale scores in
different emotional faces. (A) Sad faces, (B) disgust faces, (C) happy faces,
(D) surprise faces, (E) anger faces and (F) fear faces. Notes: *p
In the SCZ group, disease courses were found to be positively correlated with the N100 mean amplitudes (r = 0.410, p = 0.018, p fdr = 0.108) and disgust faces were negatively correlated with the N100 mean latencies (r = –0.506, p = 0.003, p fdr = 0.054). Additionally, disease course was found to be positively correlated with the N100 mean amplitudes of surprise faces (r = 0.398, p = 0.022, p fdr = 0.104). The courses of the SCZ group were not correlated with either the amplitudes or latencies of other ERP components.
As shown in Fig. 6, no significant correlations were observed among the reaction
times and ERP components within the healthy control group for all different
emotional faces (all p
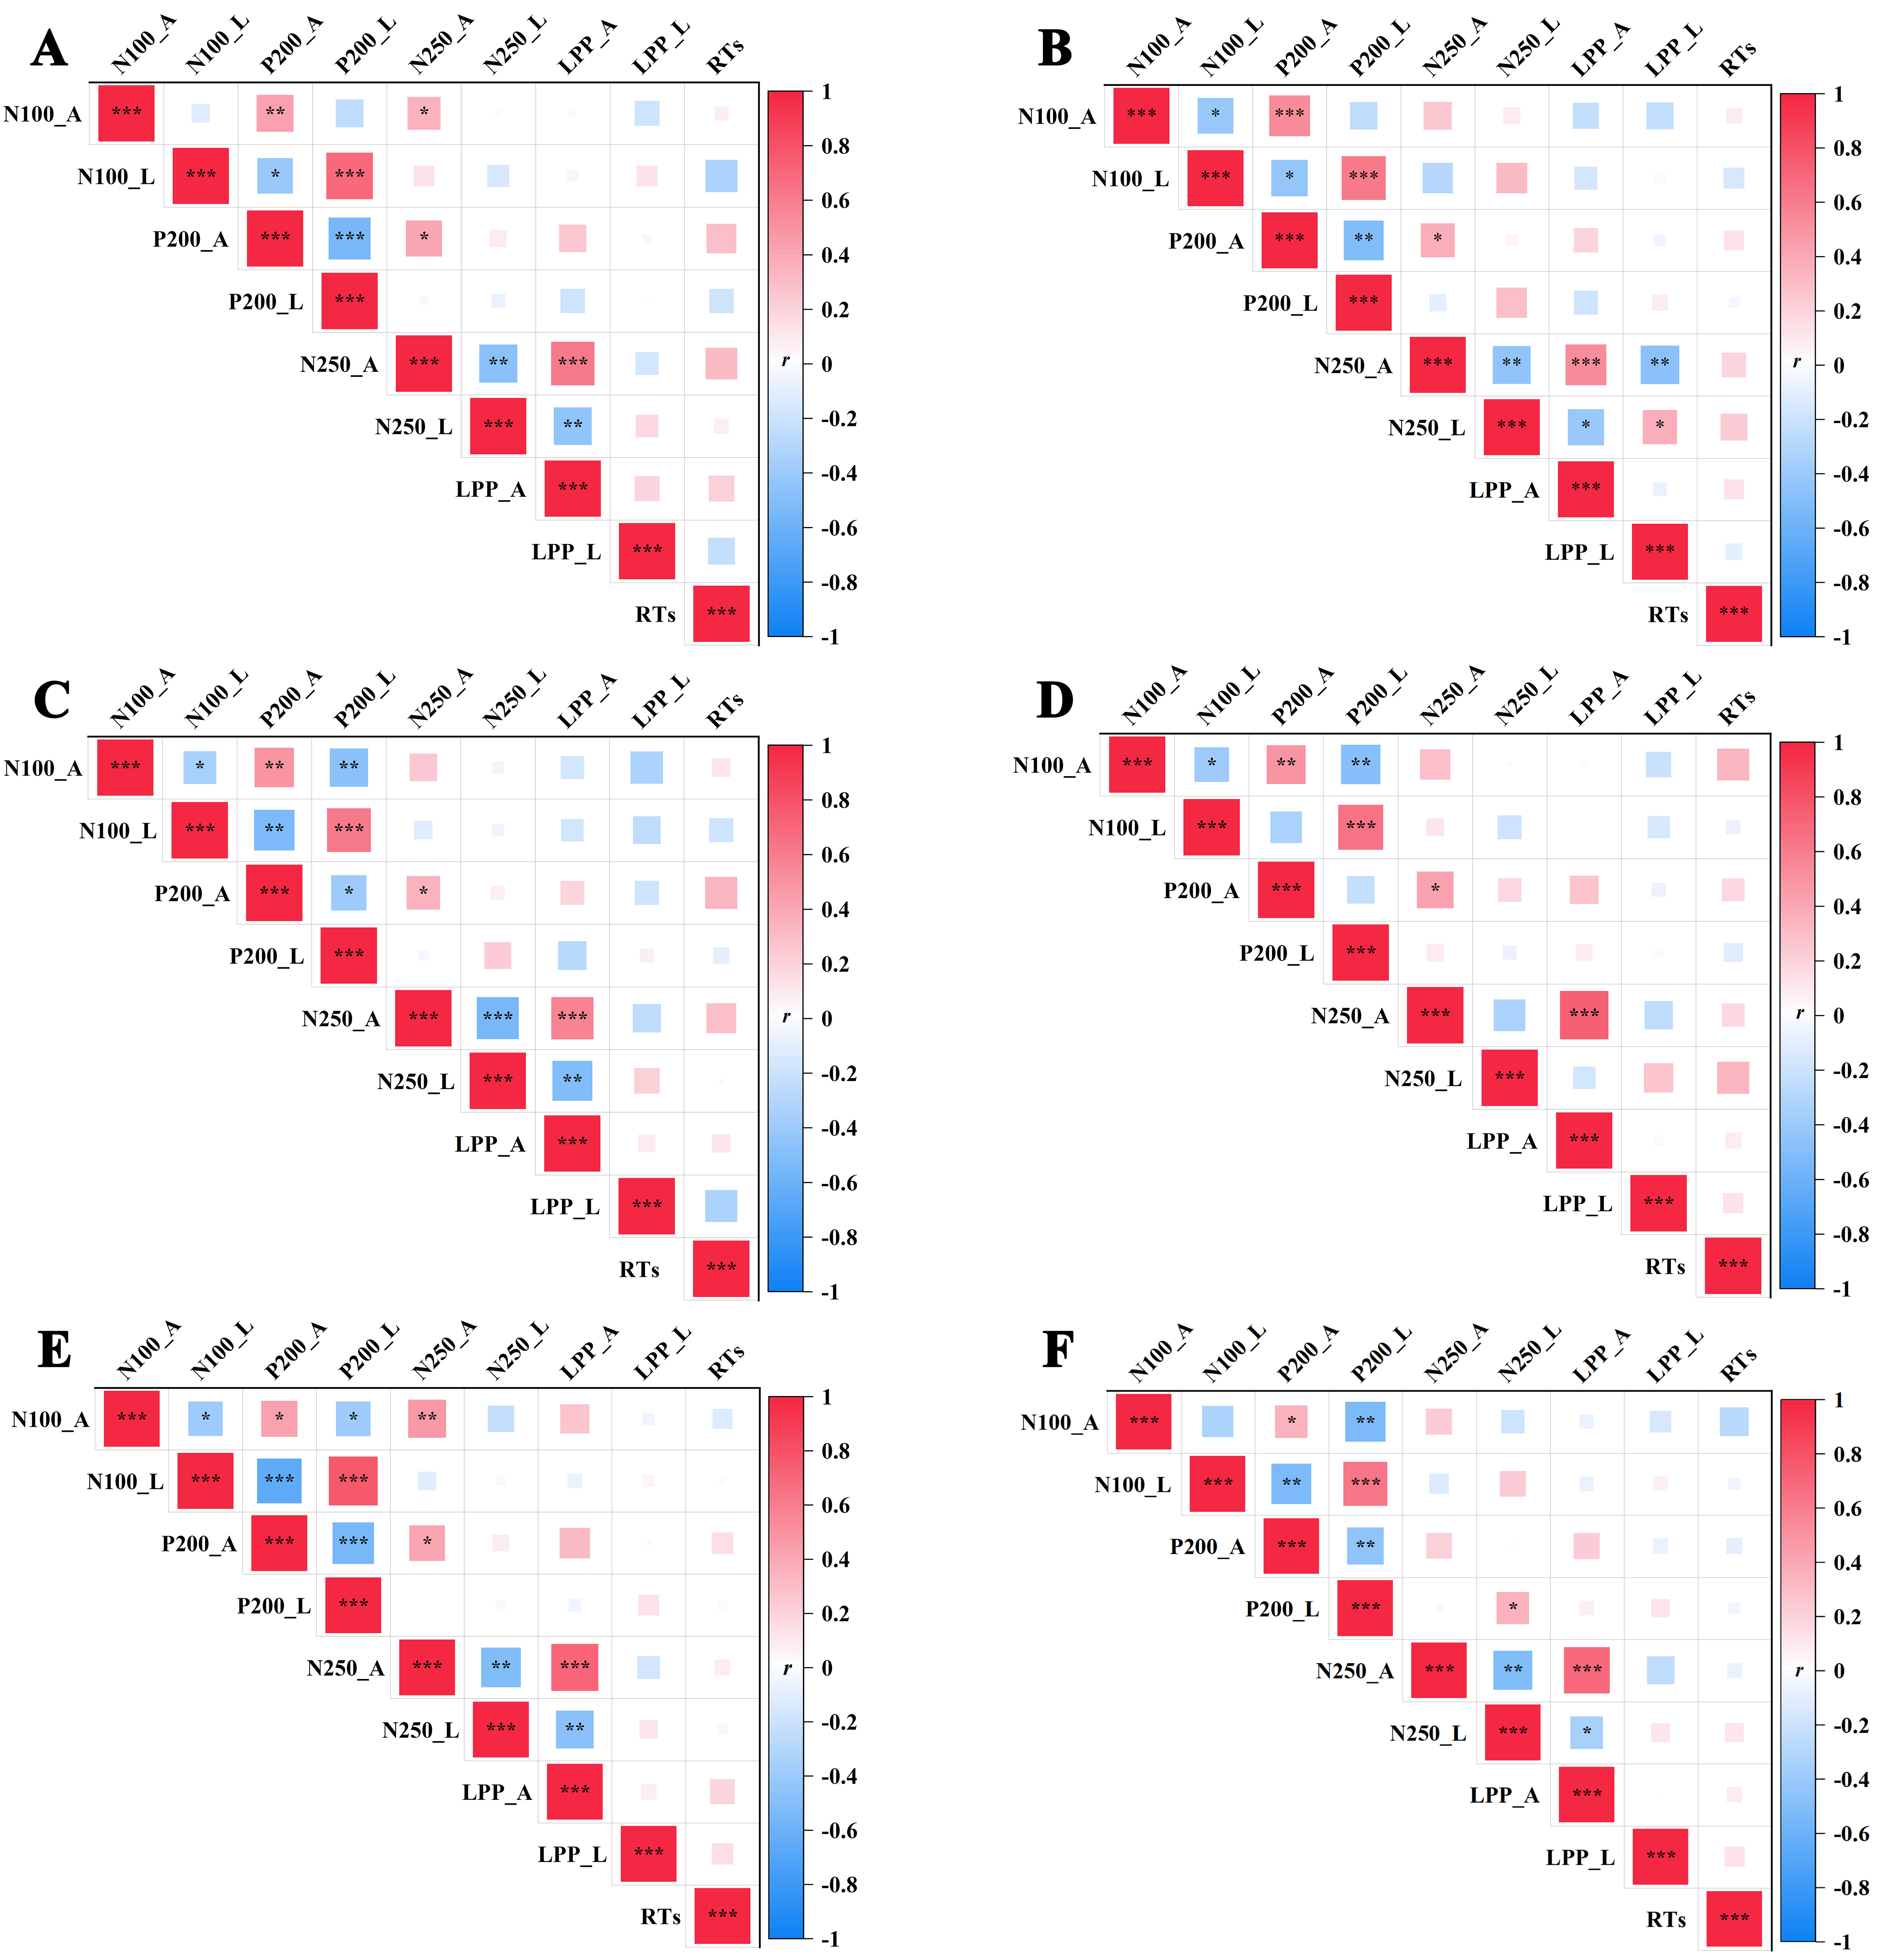 Fig. 6.
Correlation analysis of various variables within the healthy
control group. (A) Sad faces, (B) disgusted faces, (C) happy faces, (D) surprise
faces, (E) angry faces and (F) fear faces. Notes: *p
This study represents an initial exploration of ERP characteristics associated with social perception deficits using EIRT measurement, further delving into the neural mechanisms underlying the cognitive processing of these deficits in schizophrenia. The study reports that schizophrenia patients had longer RTs to sad faces compared to disgusted faces, with lower accuracy than the HCs. Additionally, schizophrenia patients had lower accuracy than the HCs for disgust, surprise, angry and fear faces. LPP mean amplitudes of HCs were larger than schizophrenia patients for sad faces in the frontal and central lobes. For happy faces, HCs elicited larger LPP mean amplitudes than schizophrenia patients in the frontal and central lobes. For surprise faces, the LPP mean amplitudes were higher in the HCs in the central and parietal lobes than for schizophrenia patients. HCs exhibited larger LPP mean amplitudes for anger faces in the frontal, central and parietal lobes than schizophrenia patients. HCs elicited larger LPP mean amplitudes for fear faces than schizophrenia patients in the frontal, central and parietal lobes.
Research has consistently highlighted that individuals with schizophrenia often exhibit significant deficits in social perception. These deficits manifest as impairments in recognizing emotional expressions, understanding social cues and engaging in social reasoning [32, 33]. For instance, studies utilizing tasks such as the “Reading the Mind in the Eyes” test have demonstrated that patients with schizophrenia perform more poorly than HCs in identifying emotions based solely on the eye region of faces [34]. Consistent with the above research, this study indicated that schizophrenia patients have impaired social perception.
Neuroimaging studies have showed that abnormalities in key brain regions are commonly reported in schizophrenia, including: the amygdala, prefrontal cortex and superior temporal sulcus, which are involved in emotion processing and social cognition [35, 36, 37, 38]. These structural and functional impairments correlate with the severity of clinically observed social cognitive deficits.
Recent advances in ERP studies have significantly enhanced understanding of social perception deficits in schizophrenia [39, 40]. ERP studies, which provide insights into the timing and processing stages of brain activity, are instrumental in delineating these deficits. One of the key findings from ERP research is the altered amplitude and latency of specific components such as the N170 and P300, which are associated with facial recognition and social information processing [41, 42]. Moreover, study employing the Emotional Face Recognition Task have shown that these ERP alterations (N170, P300) correlate with the severity of social cognitive impairments [43]. This indicates not only a disruption in the neural processing stages but also its impact on the functional outcomes in social interactions. Such alterations suggest a neural basis for the impaired ability to recognize and interpret facial expressions and social cues, a core challenge faced by individuals with schizophrenia.
EIRT explores how individuals discern varying levels of emotional expression. ERPs have been extensively used to investigate the neural mechanisms underlying emotion intensity recognition. Research in this area often focuses on components such as the P1 and LPP, which are linked to different stages of emotional processing [7, 44]. The LPP, a component associated with the sustained cognitive appraisal of emotional stimuli, shows sensitivity to emotional intensity [45]. Research demonstrates that LPP amplitudes are larger for highly intense emotional stimuli, supporting the notion that more intense emotions elicit stronger cognitive evaluations [46, 47].
This study investigated the ERP characteristics of social perception deficit with EIRT and further explored the neural mechanism of the cognitive processing of abnormal social perception deficits in schizophrenia. In the context of schizophrenia, ERP measurements during EIRT have revealed significant abnormalities in the LPP mean amplitude, which suggests a disrupted neural response to emotional cues. Typically, the LPP amplitude is associated with the allocation of attentional resources toward emotionally salient stimuli and the intensity of emotional evaluation. In HCs, more emotionally intense stimuli elicit larger LPP amplitudes, indicating greater engagement with the emotional content. However, in schizophrenia, reduced or atypical LPP responses may indicate a diminished ability to both appropriately allocate attention to and evaluate the emotional significance of stimuli. This impairment can lead to difficulties in emotional regulation and social cognition, areas often compromised in schizophrenia. The atypical LPP amplitude response may also reflect broader abnormalities in the neural circuitry involved in emotion processing, including areas such as the prefrontal cortex and limbic system, which are crucial for emotional perception and response.
It was observed that the impairment of social perception function in schizophrenic patients resulted from central nervous system dysfunction, mainly manifested in the abnormal ERP components of the EIRT task in schizophrenic patients when compared with HCs. Thus, LPP abnormalities observed in ERP studies during EIRT in schizophrenia patients underly significant disruptions in emotional processing. These disruptions are critical not only for understanding the neurobiological underpinnings of schizophrenia but also for developing targeted interventions that aim to improve emotional and social functioning in these individuals.
This study concludes that the impaired social perception of schizophrenia patients and the observed ERP patterns, provide valuable insights into the neural mechanisms underlying the EIRT, highlighting the differences between HCs and schizophrenia patients. These findings underscore the potential of EIRT as a biomarker for cognitive and emotional dysregulation in schizophrenia. The use of ERPs to study emotion intensity recognition not only furthers understanding of the neural bases of emotional processing but also holds implications for clinical applications.
The study had some limitations. First, although a preliminary estimate of the sample size was made, it was still relatively small. Second, the sample is only from Jiangsu Province, China and cannot represent the characteristics of all patients with schizophrenia. Third, there are methodological limitations. This study used a single task (EIRT), which may not capture the full range of emotional processing or cognitive abilities of an individual. Additionally, the task only used facial expression to elicit emotions, which may not be representative of other forms of emotional processing or social perception. Finally, due to the lack of ERP spatial resolution, the study of the neural mechanism of social perception function in schizophrenia is imprecise.
Based on results reported here, it is proposed that future research directions should include: (1) As the current study was only cross-sectional, developed to examine the possible neural mechanisms underlying abnormal social perception in patients with schizophrenia, a longitudinal investigation of changes in social perception over time or in response to treatment is needed. This could provide valuable information on the dynamic nature of this deficit. (2) Studies are needed to validate the results reported here that use experimental models that more fully represent emotional processing or social perception. (3) A large sample of patients of different races and regions with schizophrenia should be selected to carry out studies with the same experimental parameters to further verify the reported results. (4) Studies should develop more advanced methodology, for example by combining ERP techniques with other neuroimaging methods such as fMRI or magnetoencephalography, to enable a more comprehensive understanding of the temporal and spatial dynamics of brain activity during emotion intensity recognition tasks.
In this study, the datasets that were utilized and analyzed are available upon formal request to the corresponding author.
ZHZ and HLZ designed the research study, JJL, XPL, JMH, YFS and LMC performed the research, XHL and XZG provided help and advice on the experiments, and JJL analyzed the data. All authors contributed to editorial changes in the manuscript. All authors read and approved the final manuscript. All authors have participated sufficiently in the work and agreed to be accountable for all aspects of the work.
The study program was approved by the Ethics Committee on Human Studies (WXMHCIRB2023LLky076) at Wuxi Mental Health Center, China and was conducted in compliance with the Declaration of Helsinki. All participants have signed informed consent forms to ensure the ethical conduct of the research and the rights of the participants.
We are grateful to all the people except the author who took part in this study.
This study is supported by Wuxi Municipal Health Commission Major Project (No. 202107).
The authors declare no conflict of interest.
References
Publisher’s Note: IMR Press stays neutral with regard to jurisdictional claims in published maps and institutional affiliations.