


 , Lea Baumgärtner 4
1 Department of Computing and Mathematics, Manchester Metropolitan University, M1 5GD Manchester, UK
2 School of Technology, Woxsen University, 502345 Hyderabad, India
3 Centre for Research Impact & Outcome, Chitkara University Institute of Engineering and Technology, Chitkara University, 140401 Punjab, India
4 Department of Media, Hochschule der Medien, University of Applied Science, 70569 Stuttgart, Germany
Abstract
Schizophrenia is a complex and disabling mental disorder that represents one of the most important challenges for neuroimaging research. There were many attempts to understand these basic mechanisms behind the disorder, yet we know very little. By employing machine learning techniques with age-matched samples from the auditory oddball task using multi-site functional magnetic resonance imaging (fMRI) data, this study aims to address these challenges.
The study employed a three-stage model to gain a better understanding of the neurobiology underlying schizophrenia and techniques that could be applied for diagnosis. At first, we constructed four-level hierarchical sets from each fMRI volume of 34 schizophrenia patients (SZ) and healthy controls (HC) individually in terms of hemisphere, gyrus, lobes, and Brodmann areas. Second, we employed statistical methods, namely, t-tests and Pearson's correlation, to assess the group differences in cortical activation. Finally, we assessed the predictive power of the brain regions for machine learning algorithms using K-nearest Neighbor (KNN), Naive Bayes, Decision Tree (DT), Random Forest (RF), Support Vector Machines (SVMs), and Extreme Learning Machine (ELM).
Our investigation depicts promising results, obtaining an accuracy of up to 84% when applying Pearson's correlation-selected features at lobes and Brodmann region level (81% for Gyrus), as well as Hemispheres involving different stages. Thus, the results of our study were consistent with previous studies that have revealed some functional abnormalities in several brain regions. We also discovered the involvement of other brain regions which were never sufficiently studied in previous literature, such as the posterior lobe (posterior cerebellum), Pyramis, and Brodmann Area 34.
We present a unique and comprehensive approach to investigating the neurological basis of schizophrenia in this study. By bridging the gap between neuroimaging and computable analysis, we aim to improve diagnostic accuracy in patients with schizophrenia and identify potential prognostic markers for disease progression.
Keywords
- functional magnetic resonance imaging (fMRI)
- schizophrenia
- feature selection
- region of interest (ROI)
- machine learning
Schizophrenia has a significant public health impact, affecting 1 in every 100 people globally and posing paramount challenges not only to individuals who are diagnosed but also to their families. Schizophrenia patients usually display psychosis (hallucinations, delusions), as well as reduced emotional expression and cognitive deficits that impair memory and attention [1, 2, 3], thereby making schizophrenia a leading cause of disability worldwide.
Despite extensive research, we still do not fully understand the precise brain mechanisms underpinning schizophrenia. The most consistent finding from structural neuroimaging is that individuals with schizophrenia havediminished brain volumes, yet the consensus on specific involved regions remains narrow [4]. While functional magnetic resonance imaging (fMRI) has provided insights about brain activity patterns in schizophrenia, no single model can explain all the outcome-related signals seen in fMRI [5].
Our study aims to address this existing inconsistency in identifying localized brain abnormalities related to schizophrenia. This proposed approach uses fMRI in combination with cutting-edge machine learning techniques to develop biomarkers identification and diagnostic tools. Our research aims to precisely locate abnormal brain activity patterns in people with schizophrenia and specifically target the most important regions of their brains. We believe that this strategy will validate previously reported areas and discover new regions involved in the disorder. We also anticipate that machine learning will greatly improve clinicians’ ability to distinguish schizophrenia patients from healthy individuals.
In this paper, we seek to perform task-based fMRI data analysis to meet these aims in cohorts of patients and control subjects. Employing voxel-wise analysis, we aim to identify brain areas exhibiting differences in neuronal activity. Next, we use advanced statistical methods to identify the most characteristic brain activation patterns related to schizophrenia [6]. We use these insights to develop complex machine learning models that accurately predict the characteristics of the illness and thereby distinguishing the schizophrenia patients from healthy individuals.
By repurposing fMRI technology with state-of-the-art machine learning algorithms, our research aims to advance the understanding of schizophrenia. Our objective is to identify novel brain regions associated with this disorder and improve the existing diagnostic schemes, leading to improved treatment strategies and better outcomes for sufferers of this devastating condition.
Despite decades of neurophysiological and neuroimaging investigations, the etiopathogenesis of schizophrenia remains elusive. We have selected 48 studies out of hundreds of literature items on neuroimaging in schizophrenia published over the past three decades, which depict region-wise functional changes in schizophrenia. In this section, we will discuss some of the affected brain areas obtained from the results of the initial research. Table 1 (Ref. [7, 8, 9, 10, 11, 12, 13, 14, 15, 16, 17, 18, 19, 20, 21, 22, 23, 24, 25, 26, 27, 28, 29, 30, 31, 32, 33, 34, 35, 36, 37, 38, 39, 40, 41, 42]) provides a comprehensive chronological overview of key studies that have investigated brain regions affected in schizophrenia using various neuroimaging techniques. Each entry includes the brain region studied, the year of publication, the authors, and the primary focus of the study. This table illustrates the progression of research over the years and highlights the diverse methodologies and focuses within the field. By presenting this information, we aim to situate our study within the broader context of existing literature and show how our research builds on previous findings to deepen the understanding of schizophrenia’s neural mechanisms.
| Brain region | Year | Authors | Study focus |
| Dorsolateral Prefrontal Cortex | 1992 | Park [7] | Poor memory performance, eye movement deficits |
| 2001 | Meyer-Lindenberg et al. [8] | Cerebellar, prefrontal differences | |
| 2003 | Schlosser et al. [9] | Reduced prefrontal-cerebellar connectivity | |
| 2004 | Jansma et al. [10] | N-Back task performance | |
| 2005 | Tan et al. [11] | Impaired functionality | |
| 2011 | Costafreda et al. [12] | Pattern recognition techniques | |
| 2022 | Lalousis et al. [13] | Trait-based abnormalities | |
| 2023 | Smucny et al. [14] | Advanced neuroimaging | |
| Cerebellum | 2001 | Meyer-Lindenberg et al. [8] | Working memory tasks |
| 2003 | Schlosser et al. [9] | Connectivity alterations | |
| 2004 | Takahashi et al. [15] | Differential neural response | |
| 2013 | Guccione et al. [16] | Functional differentiation | |
| 2013 | Yu et al. [17] | Functional activation | |
| 2019 | Yan et al. [18] | Differentiation in activation | |
| 2020 | Lavigne et al. [19] | Activation differences | |
| Thalamus | 2000 | Manoach et al. [20] | Working memory performance |
| 2004 | Takahashi et al. [15] | Emotional processing | |
| 2013 | Yu et al. [17] | Functional activation | |
| 2019 | Yan et al. [18] | Activation differences | |
| 2020 | Lavigne et al. [19] | Activation differences | |
| 2020 | Bakshi and Kemether [21] | Gene expression changes | |
| Prefrontal Cortex | 2003 | Schlosser et al. [9] | Reduced connectivity |
| 2004 | Takahashi et al. [15] | Emotional processing | |
| 2005 | Tan et al. [11] | Impaired functionality | |
| 2011 | Costafreda et al. [12] | Pattern recognition techniques | |
| 2012 | Deserno et al. [22] | Reduced connectivity | |
| 2022 | Zhang et al. [23] | Prefrontal activation | |
| Hippocampus | 2001 | Meyer-Lindenberg et al. [8] | Emotional processing |
| 2002 | Ford et al. [24] | Combined structural-functional classification | |
| 2004 | Takahashi et al. [15] | Emotional processing | |
| 2007 | Kumari et al. [25] | Affective processing | |
| 2023 | Szymanski et al. [26] | Hippocampal dysfunction | |
| Midbrain | 2005 | Fahim et al. [27] | Midbrain activity |
| 2010 | Romaniuk et al. [28] | Emotional processing | |
| 2023 | Fuentes-Claramonte et al. [29] | Midbrain abnormalities | |
| Subcallosal Gyrus | 2008 | Filbey et al. [30] | Functional abnormalities |
| 2021 | Yang et al. [31] | Structural changes | |
| Brodmann Area 4 | 2004 | Rogowska et al. [32] | Sensorimotor processing |
| 2005 | Ford et al. [33] | Activation patterns | |
| Brodmann Area 11 | 2007 | Zhou et al. [34] | Orbitofrontal activity |
| Brodmann Area 25 | 2001 | Stephan et al. [35] | Cingulate cortex activity |
| 2004 | Haznedar et al. [36] | Subgenual cingulate | |
| Brodmann Area 36 | 2005 | Katsel et al. [37] | Perirhinal cortex |
| 2011 | Walther et al. [38] | Resting-state activity | |
| Brodmann Area 39 | 2006 | Marjoram et al. [39] | Parietal cortex |
| 2007 | Whalley et al. [40] | Angular gyrus | |
| Ventral Lateral Nucleus | 2006 | Clinton et al. [41] | Striatal activation |
| 2018 | Giordano et al. [42] | Functional connectivity |
The table includes the year of publication, authors, sample sizes, and study focus.
The role of the dorsolateral prefrontal cortex (DLPFC) in schizophrenia has been extensively investigated in previous studies [7, 9, 10, 11, 13, 14, 43]. For instance, Park and Holzman (1992) [7] analyzed the contribution of the DLFPC to the schizophrenia phenotype by designing an ad-hoc delayed-response paradigm. They investigated twelve schizophrenia patients, twelve bipolar patients, and twelve healthy controls. The results showed that schizophrenia patients had significantly poorer performance in memory-guided delayed responses compared to both control groups. Furthermore, a deficit in smooth-pursuit eye movements was also traced back to dorsolateral prefrontal dysfunction.
Jansma et al. (2004) [10] tested ten schizophrenia patients on atypical antipsychotic medication and ten healthy controls. Schizophrenia patients showed increasingly poor performance on the N-Back tasks, resulting in a peak activation of the working memory system at a lower load than healthy controls. However, there was no evidence that the shape of the load–response curve in DLPFC, as measured via fMRI, was abnormal in schizophrenia. Based on this observation, working memory dysfunction was traced back to an impaired functional output of the entire working memory system [10]. The impaired functionality of the DLPFC in schizophrenia patients can also be seen in other studies [44, 45].
The ventrolateral prefrontal cortex (VLPFC) is a brain area that has been extensively studied in schizophrenia [9, 11, 23]. In a study by Schlösser et al. (2003) [9], fMRI data from twelve schizophrenia patients (treated with either typical or atypical antipsychotics) and six healthy subjects were analyzed to examine the affected connectivity in schizophrenia. The authors concluded that the cortical-subcortical-cerebellar network exhibited effective connectivity in all groups. However, using a path model, the results revealed reduced connectivity strength in the left prefrontal/right cerebellar network and inter-hemispheric connections in patients treated with antipsychotics. Conversely, an increased connectivity strength was observed in thalamo-prefrontal connections to the left VLPFC and DLPFC. In comparison, atypically treated patients displayed a decreased connectivity strength from the left prefrontal to the right cerebellar and from the right prefrontal to the left cerebellar, and from the right VLPFC to the right DLPFC.
In addition to the DLPFC and VLPFC, other studies have investigated the prefrontal cortex (PFC) and found it to be affected in schizophrenia [11, 12, 15, 22]. The cerebellum, or cerebellar area, has also been evaluated as an affected brain region in schizophrenia. Meyer-Lindenberg et al. (2001) [8] investigated disturbed neural interactions by evaluating cooperation action characteristics on the functional connectivity systems level. The researchers applied the N-Back working memory task on 13 schizophrenia patients and 13 healthy controls using positron emission tomography. A pattern showed differences in the cerebellar and the inferotemporal parahippocampal loadings of the patients. Differences were also observed in the dorsolateral prefrontal and anterior cingulate activity of the healthy control.
Furthermore, Guccione et al. (2013) [16] applied Multiset Canonical Correlation Analysis (M-CCA) to an fMRI dataset of nine schizophrenia patients and an equal number of healthy controls. By using this multivariate technique, the authors identified specific brain areas related to the working memory task. Their findings revealed that the cerebellum seems to be a differentiating brain area for the diagnosis of schizophrenia. Several other researchers have also identified differences in functional activations in the cerebellum region of schizophrenia patients compared to healthy controls [5, 17, 18, 19, 46].
The thalamus is a region of active research in the field of schizophrenia. Several studies have investigated the thalamus and have found it to be an essential biomarker for the disorder [17, 19, 20, 21, 25, 46, 47]. Manoach et al. (2000) [20] analyzed fMRI data from an equal number of schizophrenia and healthy subjects to identify abnormalities in the thalamus and basal ganglia, which are units of frontostriatal circuity in working memory. After comparing working memory task load conditions between the groups, the authors found that schizophrenia patients exhibited a deficit in working memory performance in the DLPFC, with activity observed in the basal ganglia thalamus.
Furthermore, Bakshi et al. (2020) [21] investigated gene expression changes and potential transcriptional targets in two thalamic regions using postmortem samples from 11 schizophrenia subjects and healthy controls. The authors identified the anterior thalamic nucleus as a region affected by schizophrenia.
The hippocampal region has also been identified as another area affected by schizophrenia in several studies [8, 15, 24]. Ford et al. (2002) [24] analyzed fMRI data from 15 schizophrenia patients and eight healthy controls and found that the hippocampal region can be classified as a distinguished brain region affected by the disorder. Additionally, Shi et al. (2007) [48] used multivariate pattern classification on fMRI data and anatomical templates to study defective brain functionalities in 48 schizophrenia patients and 35 healthy subjects. The authors claimed that their discriminative model was able to identify abnormal brain regions in schizophrenia patients, including ten distinguishable areas such as the hippocampus, pallidum, amygdala, and cerebellum. Overall, these studies highlight the importance of investigating the thalamus and hippocampal regions in understanding the neurobiological mechanisms underlying schizophrenia.
The Striatum has been implicated as another potentially affected brain region in schizophrenia [18, 49, 50]. Previous research has shown functional changes in this region. Juckel et al. (2006) [49] analyzed the Blood Oxygen Level Dependent (BOLD) response in the ventral Striatum of medicated schizophrenia patients using fMRI data. The researchers examined twenty schizophrenia patients and ten healthy subjects, of which ten schizophrenia patients had been treated with typical neuroleptics and the remaining ten with atypical neuroleptics. The experiment results revealed that the healthy subjects and the atypical neuroleptics treated schizophrenia patients displayed ventral striatal activation. However, typical neuroleptics treated patients did not show any differences. These patients had decreased activation in the left ventral Striatum, which resulted in the severity of negative symptoms. Zeng et al. (2018) [50] created a deep discriminant autoencoder network using a large fMRI dataset of 734 images, including 357 schizophrenia patients. The authors found distinct abnormalities in the cortical-striatal-cerebellar circuit in schizophrenia patients.
Takahashi et al. (2004) [15] investigated emotional response and the neural basis of affected emotional processing, comparing 15 schizophrenia patients and 15 healthy subjects. The subjects were instructed to perform a task while whole-brain activities were measured using fMRI. When confronted with unpleasant pictures, control subjects displayed activities in the amygdaloid–hippocampal region, prefrontal cortex, thalamus, basal ganglia, cerebellum, midbrain, and visual cortex. However, schizophrenia patients showed less activation in the neural circuit in the right amygdala, bilateral hippocampal region, and medial prefrontal cortex (MPFC). The authors identified functional damage in emotional processing in schizophrenia, especially in the right amygdala and MPFC. Similar results about the amygdala can be found in other literature [48].
As discussed earlier, the prefrontal cortex, the whole frontal lobe, is another potential area that has been found to be affected in several research studies [5, 19, 46, 51, 52]. Gold et al. (1997) [51] examined the neuropsychological battery and the load of the working memory-letter-number (LN) span of schizophrenia in 36 schizophrenia patients and 20 healthy controls. As impaired Wisconsin Card Sorting Test (WCST) performance appears to be a factor of dysfunction in the frontal lobe, the researchers applied regression analyses on the LN performance of schizophrenic patients. The authors found that working memory might be a possible determinant of one aspect of WCST performance in schizophrenia, leading to an affected frontal lobe region.
Recent research has significantly advanced our understanding of schizophrenia through the use of fMRI combined with innovative machine learning techniques. In a notable study, Zhang et al. (2024) [53] employed linear support vector machines (SVM) to differentiate schizophrenia patients from controls using both static and dynamic brain activity indices, achieving an area under the curve (AUC) of 0.87 and an accuracy of 81.28%. This highlights the potential of combining various brain activity measures for improved diagnostic accuracy [53]. Building on the theme of dynamic analysis, Zhu et al. (2024) [54] introduced the Temporal Brain Category Graph Convolutional Network (Temporal-BCGCN), which analyzed time-varying brain connectivity. Their method not only provided deeper insights into the brain’s functional dynamics but also achieved impressive accuracies of 83.62% and 89.71% on distinct datasets, underscoring the utility of graph-based models in capturing complex brain patterns [54].
Furthermore, Wang et al. (2024) [55] explored the efficiency of deep learning through a Multiple Sparsely Connected Network (MSCN), which excelled in reducing redundancy in functional connectivity data. Their approach resulted in a high classification accuracy of 91.71%, with a specificity of 94.99% and a sensitivity of 88.69%, demonstrating the MSCN’s robustness in distinguishing schizophrenia cases [55]. Wismüller et al. (2023) [56] also contributed significantly to this field by implementing Large-Scale Extended Granger Causality (lsXGC) to analyze directed causal relationships in fMRI data. Their innovative multivariate method achieved an F1 score of 87.40% and an AUC of 95.00%, significantly surpassing traditional connectivity measures [56]. Additionally, Yang et al. (2019) [57] refined the classification process using a Multiple Feature Image Capsule Network Ensemble, integrating diverse imaging features through deep learning to handle the complexity of schizophrenia’s functional brain patterns. This integrated approach markedly improved diagnostic accuracy, showcasing the strength of deep capsule networks in medical imaging analysis [57]. Lastly, Zeng et al. (2018) [50] addressed cross-site diagnostic challenges using a discriminant deep learning model that learned shared functional connectivity features across multiple sites. This model effectively demonstrated the potential for widespread clinical application with accuracies around 85.0% in multi-site pooling classifications [50]. These studies collectively underline the significant advancements in using machine learning to interpret fMRI data for schizophrenia, offering promising directions for future research and potential clinical applications.
We can see that numerous studies have explored the functional changes in various brain regions in schizophrenia using fMRI data. These investigations enhance our understanding of the neural mechanisms behind schizophrenia and show the potential of combining neuroimaging with advanced statistical and machine learning techniques to improve diagnostic accuracy. This ongoing research significantly contributes to the field of schizophrenia, providing valuable insights that pave the way for future studies and potential therapeutic advancements for better treatment plans.
The fMRI dataset utilized in this study is publicly available for download from (http://schizconnect.org/). This dataset includes data from two distinct acquisition sites, identified as site 0009 and site 0010. Both sites employed 1.5 T MRI scanners, which were used to acquire fMRI data, ensuring uniformity in data collection techniques across the sites. The dataset comprised 34 individuals diagnosed with schizophrenia, with 21 from site 0009 and 13 from site 0010, and 34 healthy control subjects, evenly split with 17 from each site. All participants underwent fMRI scanning while performing the same cognitive task—the auditory oddball task—to maintain consistency in the task paradigm across both groups. Each subject contributed data from four runs of each scan, enhancing the robustness and replicability of the research findings.
Table 2 presents the demographic characteristics of the participants. It is essential to acknowledge potential chances of variations between the two sites in acquisition parameters, including the MR machine utilized. Although the information provided by the fBIRN repository states that the pulse sequence parameters were closely aligned, as determined through pilot studies conducted by the research team. These parameters encompassed an orientation of the anterior-commissure posterior-commissure line, 27 slices with a thickness of 4 mm, a repetition time (TR) of 2 seconds, a time to echo of 40 ms for 1.5 T scanners, a matrix size of 64
| Subject | Samples Size | Age Group | Sex | Handedness | Age of Onset | Smoking | Treatment Status | Medication | Clinical Characteristics | ||
| (years) | (M/F) | (R/L) | (years (median)) | (Yes/No) | (Yes/No) | Depression Level | Severity Level | Cognitive Impairment Level | |||
| Healthy | 34 | 38.24 |
24/10 | 30/4 | NA | 10/24 | NA | NA | NA | NA | NA |
| Schizophrenia | 34 | 40.35 |
27/7 | 28/7 | 22 | 25/9 | Inpatient: 15 | Yes: 24 | Mild: 22 | Mild: 12 | Mild: 21 |
| Outpatient: 19 | No: 10 | Moderate: 8 | Moderate: 16 | Moderate: 11 | |||||||
| Severe: 4 | Severe: 6 | Severe: 2 | |||||||||
Note: Participant IDs for Healthy subjects include: 001063297025, 001012753423, …, 001012126889.
Participant IDs for Schizophrenia subjects include: 000998241845, 001084262659, …, 001096709026.
Detailed mapping of IDs to specific data is available upon request.NA, Not Applicable.
Our study used the fMRI dataset of subjects performing the standard auditory oddball (AUD) task. The oddball paradigm, which is well-known in schizophrenia research, accurately generates a particular pattern of brain activity linked with the condition. The simplicity of the AUD task along with positive tolerance among people with schizophrenia renders it an intriguing option for studies. While the oddball paradigm may only provide light on specific aspects of schizophrenia pathology, it remains an effective tool for identifying potential functional imaging biomarkers. Consequently, the selection of the oddball paradigm to identify a representative schizophrenia marker stands as both scientifically valid and technically robust.
Throughout the task, a continuous sound beam played as subjects listened attentively, discerning any deviant (oddball) tone from the standard tone. The task duration spanned 280 seconds. Subjects fixated on a gray screen bearing a black cross; upon detecting a deviant tone, they promptly pressed the ‘1’ button, succeeded by a sequence of standard tones (duration = 100 ms). Deviant tones (duration = 100 ms) occurred every 6 to 15 seconds. Each task run concluded with a 15-second silent interval. Within each run, a total of 140 brain images were acquired, with a TR of 2 seconds.
While there may have been minor differences in data collecting settings between the two study sites, all individuals were subjected to the same task paradigm (the auditory oddball task) and scanning techniques to ensure sample homogeneity. Furthermore, the research design included a variety of measures to reduce potential confounding factors. These measures encompassed the exclusion of healthy controls with present or past head trauma or medical conditions, while exclusively enrolling subjects diagnosed with schizophrenia disorder meeting Diagnostic and Statistical Manual of Mental Disorders, 4th ed. (DSM-IV) criteria. The dataset comprised subjects from two distinct recording sites. Specifically, both sites enrolled an equal number of healthy individuals (17 from each site), but differed in the number of subjects with schizophrenia, with 21 from Site 0009 and 13 from Site 0010, thus ensuring a balanced and robust dataset for comparative analysis.
We performed a set of separate statistical analyses to determine any potential disparities in age and gender between healthy subjects and schizophrenia patients. To evaluate the age differences, we have conducted a two-sample t-test to compare the mean age across both groups. The obtained results, as shown in Table 3, yielded a t-statistic of –1.03 and a corresponding p-value of 0.31. We can conclude that these findings indicate a lack of statistically significant variance in mean age between healthy subjects and schizophrenia patients.
| t-statistic | p-value | |
| Age Difference | –1.03 | 0.31 |
| Gender Difference (Male) | –1.40 | 0.17 |
| Gender Difference (Female) | 0.82 | 0.43 |
Similarly, we have also investigated the gender disparities by stratifying each cohort into male and female subgroups, followed by performing individual two-sample t-tests for each subgroup. As shown in Table 3, the t-statistic for the male subgroup comparison stood at –1.40, yielding a p-value of 0.17, while the t-statistic for the female subgroup comparison was 0.82, yielding a p-value of 0.43. These outcomes underscore the absence of statistically significant gender discrepancies between healthy individuals and those with schizophrenia. The analyses reveal that age and gender differences between healthy and schizophrenia subjects are not statistically significant. It suggests that age and gender do not influence our results. Thus, we can conclude that the slight differences between the two subgroups (male and female) are likely due to the disease itself.
In this study, we preprocessed the raw dataset using the Statistical Parametric Mapping toolbox version 12 (SPM12, https://www.fil.ion.ucl.ac.uk/spm/software/spm12/) in MATLAB [58], which is widely used for analyzing neuroimaging data. We acquired the raw scans with a voxel size of 3.4
Next, we normalized the fMRI scans into the standard Montreal Neurological Institute (MNI) space by using an EPI template in SPM12. This transformation changed the initial voxel size to 3
The preprocessing of the fMRI data analysis resulted in the generation of 4 dimensional (4D) images for each partaker which we later analyzed using the General Linear Model (GLM). The GLM is an important tool when analyzing fMRI data because it allows us to analyze the relationship between observed ‘neural activity’ and ‘experimental conditions’. With the help of GLM, one can indicate the specific zones of the brain that demonstrate considerable fluctuations in their activity concerning some stimuli or actions.
Specifically, within the GLM framework, we estimated a condition pair that involved the comparison of the deviant tone to the standard tone. This comparison aids us in obtaining a 3D spatial map referred to as a contrast map that demonstrates voxel activation in the two contrast conditions. The voxels with the value ‘0’ indicate no activation during the task and hence are useful for comparison with other conditions. The GLM analysis was conducted for each of the participants and each of the four runs and therefore, was very specific.
Subsequently, we averaged the four contrast maps in each participant to obtain an average 3D contrast map. This step is essential as it brings down the feature vector size and enables us to handle the large dimensionality of fMRI data. However, even with this reduction, the number of dimensions is still large and presents difficulties in accurately distinguishing the two classes of interest, which are schizophrenia patients and healthy controls. There were several reasons behind our choice of the GLM. First, the GLM assists us with a reasonable estimation of the brain’s response to specific tasks, which is critical for detecting patterns related to schizophrenia. Second, by taking the average of the contrast maps, we are increasing the specificity and thus the signal-to-noise ratio which is important in the detection of changes in brain activity. Finally, this method is beneficial in preparing for subsequent phases of analysis that include the use of these contrast maps to build and enhance the models used in the machine learning system. These models will also assist in the classification of people according to brain activity patterns and, in general, contribute towards the enhancement of knowledge of schizophrenia’s neural foundation.
In the next step of our method, we divided brain data into four levels based on Talairach’s space atlas, using the WFU Pickatlas software (version 3.0.5, https://www.nitrc.org/projects/wfu_pickatlas/) for automatic brain region labeling [59]. Each subject’s brain data was split our predetermined regions of interests (ROI) into the following four levels: Hemisphere, Gyrus, Lobe, and Cell type (Brodmann Areas).
Firstly, we divided the brain data at the Hemisphere level, distinguishing between the left and right hemispheres. This step allows us to see how schizophrenia might affect each side of the brain differently. Then, we segmented the brain data at the Gyrus level, which involves dividing the brain into various gyri. This finer segmentation helps us examine more specific regions within each hemisphere. Moving on to the Lobe level, we categorized the brain data into the frontal, parietal, temporal, and occipital lobes. Since each lobe has distinct functions, this step helps us identify which lobes are more involved in schizophrenia. Lastly, we used Brodmann Areas, which are regions of the cerebral cortex defined based on cell organization. This level provides a very detailed view of the brain down to the specific types of cell organization.
This methodology was necessary because schizophrenia is a complex disorder that likely impacts multiple brain regions in different ways. By segmenting the brain into hierarchical levels, we can analyze the specific involvement of each region more precisely. This approach allows us to identify subtle differences in brain activity that might be overlooked with a more generalized analysis. Furthermore, it helps us correlate specific brain areas with the symptoms and severity of schizophrenia, leading to a better understanding of its neural mechanisms.
After segmenting the brain data, we analyzed each section separately, focusing on the brain regions identified in both existing studies and our ROI. This method enabled us to study the activity of specific brain areas related to schizophrenia, enhancing our understanding of the disorder’s neural mechanisms.
In this stage, we used statistical feature selection techniques to find differences in brain activity between individuals with schizophrenia and healthy subjects. We applied these techniques on fMRI data obtained after the GLM analysis and the parcellation of brain regions according to our ROIs.
We used filter-based feature selection methods to reduce the data to a significant subset of features. One method was the Pearson correlation coefficient, which measures the correlation between two variables. The coefficient ranges between +1 and –1, where a value of 0 indicates no correlation. The formula for calculating the Pearson correlation coefficient is:
To determine the statistical significance of the differences in brain activity, we applied the Student’s paired t-test. We used this method to find significant voxels between the two groups of population, schizophrenia and healthy controls. We assumed the null hypothesis (
The t-statistic value is calculated between the dataset of
We applied both the Pearson correlation and t-test to test the groups for statistical inference. A smaller p-value indicates a more significant difference between the two groups. We selected significant voxels based on their p-values, representing functional differences in brain regions.
To ensure reliability and validity, we applied the Pearson correlation and t-test on each level of brain regions (Hemisphere, Lobes, Gyrus, and Brodmann Areas). For the t-test, we selected features with a p-value lower than 0.05. For the Pearson correlation, we selected features where the R2 value, calculated from the correlation coefficient, lay between R2 > 0.001 and R2 < 0.002.
To identify the threshold for
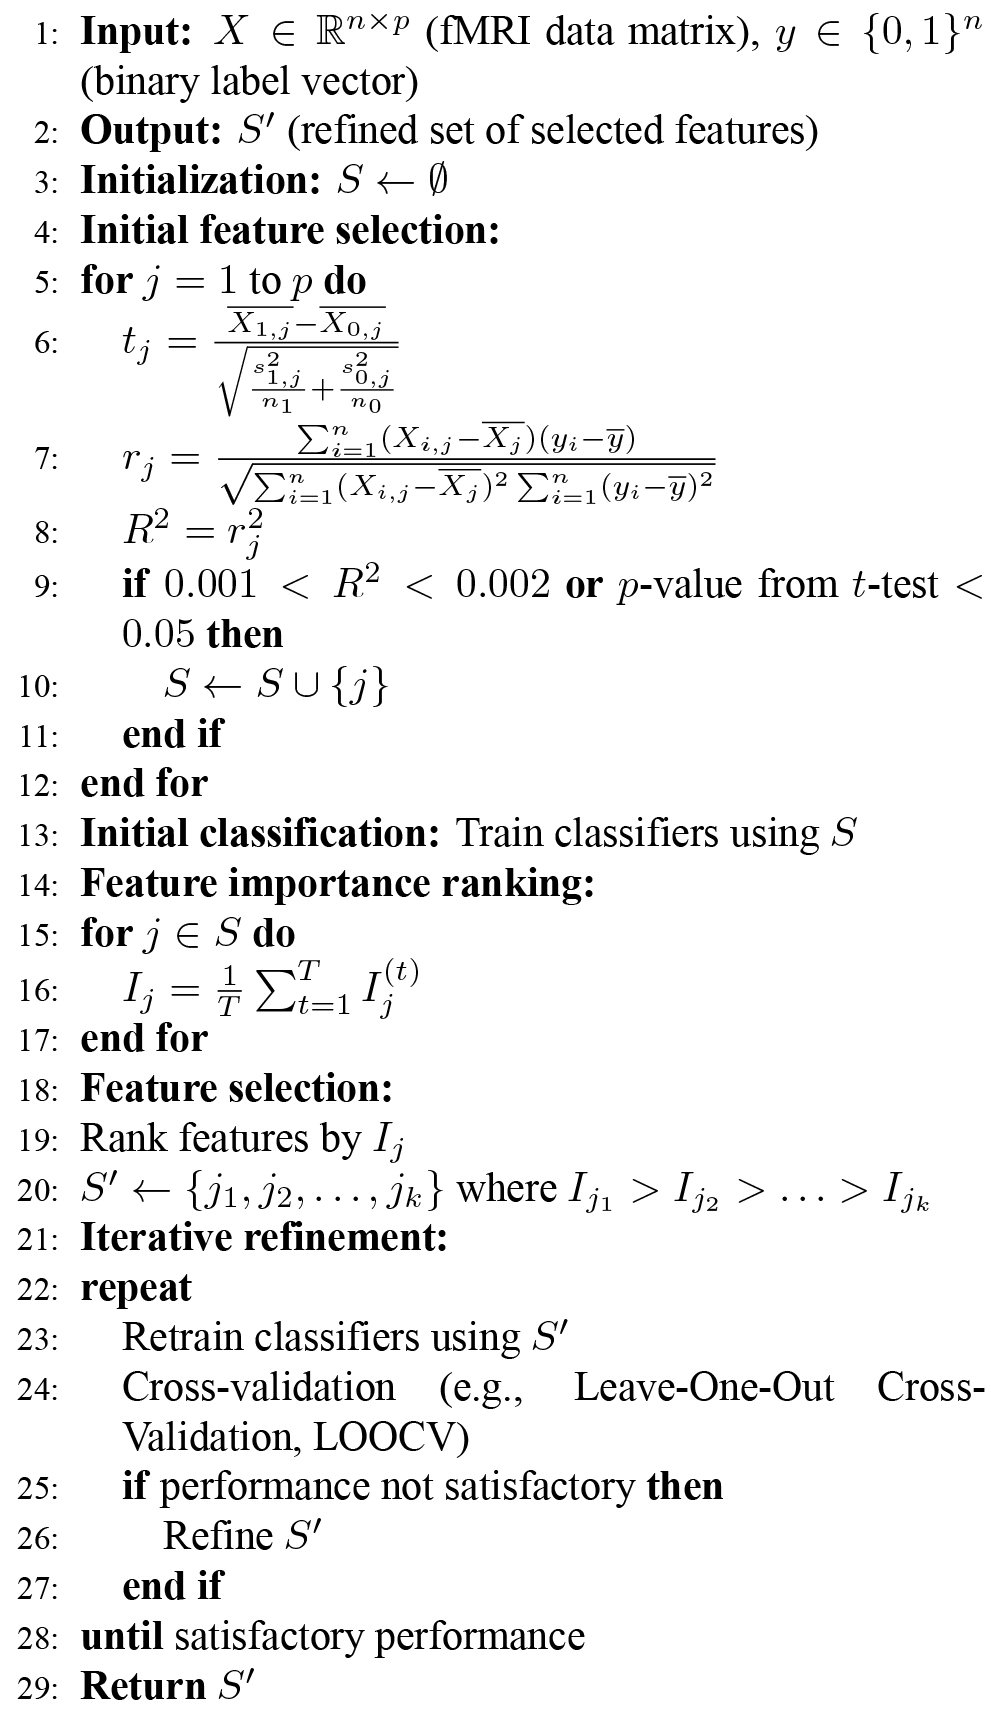
Apart from the statistical feature selection techniques described above, we also employed a classification-guided feature selection approach. This approach was based on the outcomes of preceding classification exercises, aiming to identify the most discriminant features. However, we specifically utilized features that consistently improved classification accuracy across various classifiers for subsequent analysis. Our proposed iterative feature selection approach also assessed the practical significance of the selected features, ensuring that the differences between schizophrenia patients and healthy controls were statistically significant.
After performing statistical feature selection on the data, we used the features selected from the results of the t-test and Pearson’s correlation as input for various machine learning classifiers. To classify schizophrenia and healthy subjects in this study, we employed several well-known machine learning algorithms, including K-nearest neighbor (KNN), Decision Tree (DT), Random Forest, Naive Bayes (NB), SVM, and Extreme Learning Machines (ELM) [60].
K-nearest Neighbor (K-NN) is a supervised machine learning algorithm widely used for classification tasks. Unlike probabilistic calculations, K-NN employs distance metrics to cluster the given data. Distance metrics such as Minkowski, Manhattan, Cosine, and Euclidean Distance can be used depending on the dataset and study objective. Minkowski distance calculates real-valued vector spaces, requiring a normed vector space. The Manhattan distance metric computes the distance between points in space based on the sum of differences in the data coordinates and is referred to as city block distance. The Cosine distance measures the similarity between two given vectors and is primarily used for text analysis. The Euclidean distance metric, commonly used in K-NN classifications, calculates the straight distance between two coordinates in Euclidean space. For this study, we opted for the Euclidean distance metric as it was the most suitable and best-performing distance metric for our research goal and dataset. After experimenting with values ranging from 1 to 4, we selected a
Furthermore, we utilized the Decision Tree (DT) algorithm, a supervised method for classification and regression. The DT algorithm predicts the value of a variable by learning decision rules inferred from data features. These decision rules are represented as a tree, where branches depict decisions based on learned attributes and input target values. DT decisions are usually transparent and interpretable since they can be visualized. However, DTs tend to overfit quickly when there is a large number of features influencing the decision. Therefore, pruning can be applied to set the maximum depth of a DT. The number of splits in DTs determines the possible decisions on the node and whether the target variable is categorical or numeric. In this study, given our categorical classification problem, we set the number of splits (nSplit) as 2 for decision tree building.
In our research, we applied the Random Forest (RF) algorithm, a supervised learning method used for regression and classification in fMRI studies of schizophrenia. The RF algorithm comprises several decision trees that collaborate to improve the output and stabilize the decision. While decision trees in RFs determine the outcome of the prediction, only a subset of the data is used to train each DT, leading to a variety of differently trained models working together to achieve a better-generalized outcome. This technique, known as bagging, is utilized. To implement the RF algorithm, the number of bags containing an ensemble of DTs must be determined. After experimenting with various parameters for the number of bags, we found that setting 10 bags for the RF algorithm yielded the best performance in our study.
Another classifier used in this study is the Naive Bayes (NB) classifier, a machine learning technique based on Bayes’ theorem. The NB classifier calculates the probability of A under a given event B. It is termed naive since two assumptions are applied to the dataset: all features are independent and equal in importance. However, it is crucial to determine a good approximation of the probability distribution to improve the prediction. This can be achieved through feature engineering or assuming a normal distribution. Nonetheless, incorrect assumptions can bias the outcome. Therefore, we utilized Kernel Density Estimation (KDE), which defines the density around the features and enhances the result [61].
SVM serve as another supervised machine learning classifier employed in this study. This algorithm enhances the class separation of the data by transforming the training dataset into a higher dimensional dataset through the application of boundaries in space, termed hyperplanes. These hyperplanes are calculated using notable data points known as support vectors, delineating the separated areas representing different classes. SVM utilizes the kernel function to determine Gram matrix elements’ computation, presenting a table of vectors. The selection of the kernel function provides efficient methods for transforming the data into higher dimensions. Various kernel functions, such as Gaussian or Radial Basis Function (RBF) kernel, are employed for one-class learning. The polynomial kernel facilitates non-linear models linear function, which is the default used for two-class learning and thus applied in this study.
The final classifier employed in our experiments is the Extreme Learning Machines (ELM) algorithm. Unlike standard Neural Networks, which use backpropagation to recalculate the neurons’ weights, ELM utilizes the Moore-Penrose generalized inverse method for weight calculation. The Moore-Penrose inverse, known as a generalization of the inverse matrix, is employed for this purpose. In this study, we conducted hyperparameter optimization for the ELM algorithm by experimenting with various combinations of parameters. Different applicable activation functions, including sigmoidal, sine, hardline, triangular, and radial basis functions, were explored. We adopted an automated approach to determine the best combination of parameters, considering different numbers of hidden neurons ranging from 300 to 10,000 and various numbers of training iterations ranging from 50 to 2000.
We utilized the features obtained through filter-based statistical feature selection methods for each of the brain map hierarchies in the classification using the aforementioned classifiers. For all classifiers, we applied Leave-One-Out Cross-Validation (LOOCV) technique. Although LOOCV entails computational expenses, it ensures reliable and unbiased evaluation of the model performance, particularly beneficial for smaller datasets. LOOCV finds widespread application in the classification of neuroimaging studies. We meticulously tuned the parameters in each classifier to achieve the highest accuracy. To offer a clearer understanding of our proposed approach, we depicted the process in the form of a flow diagram, as illustrated in Fig. 1. Alongside the detailed diagram, we have also formulated an algorithm (as stated in Algorithm 1) for the reproducibility of our proposed methodology.
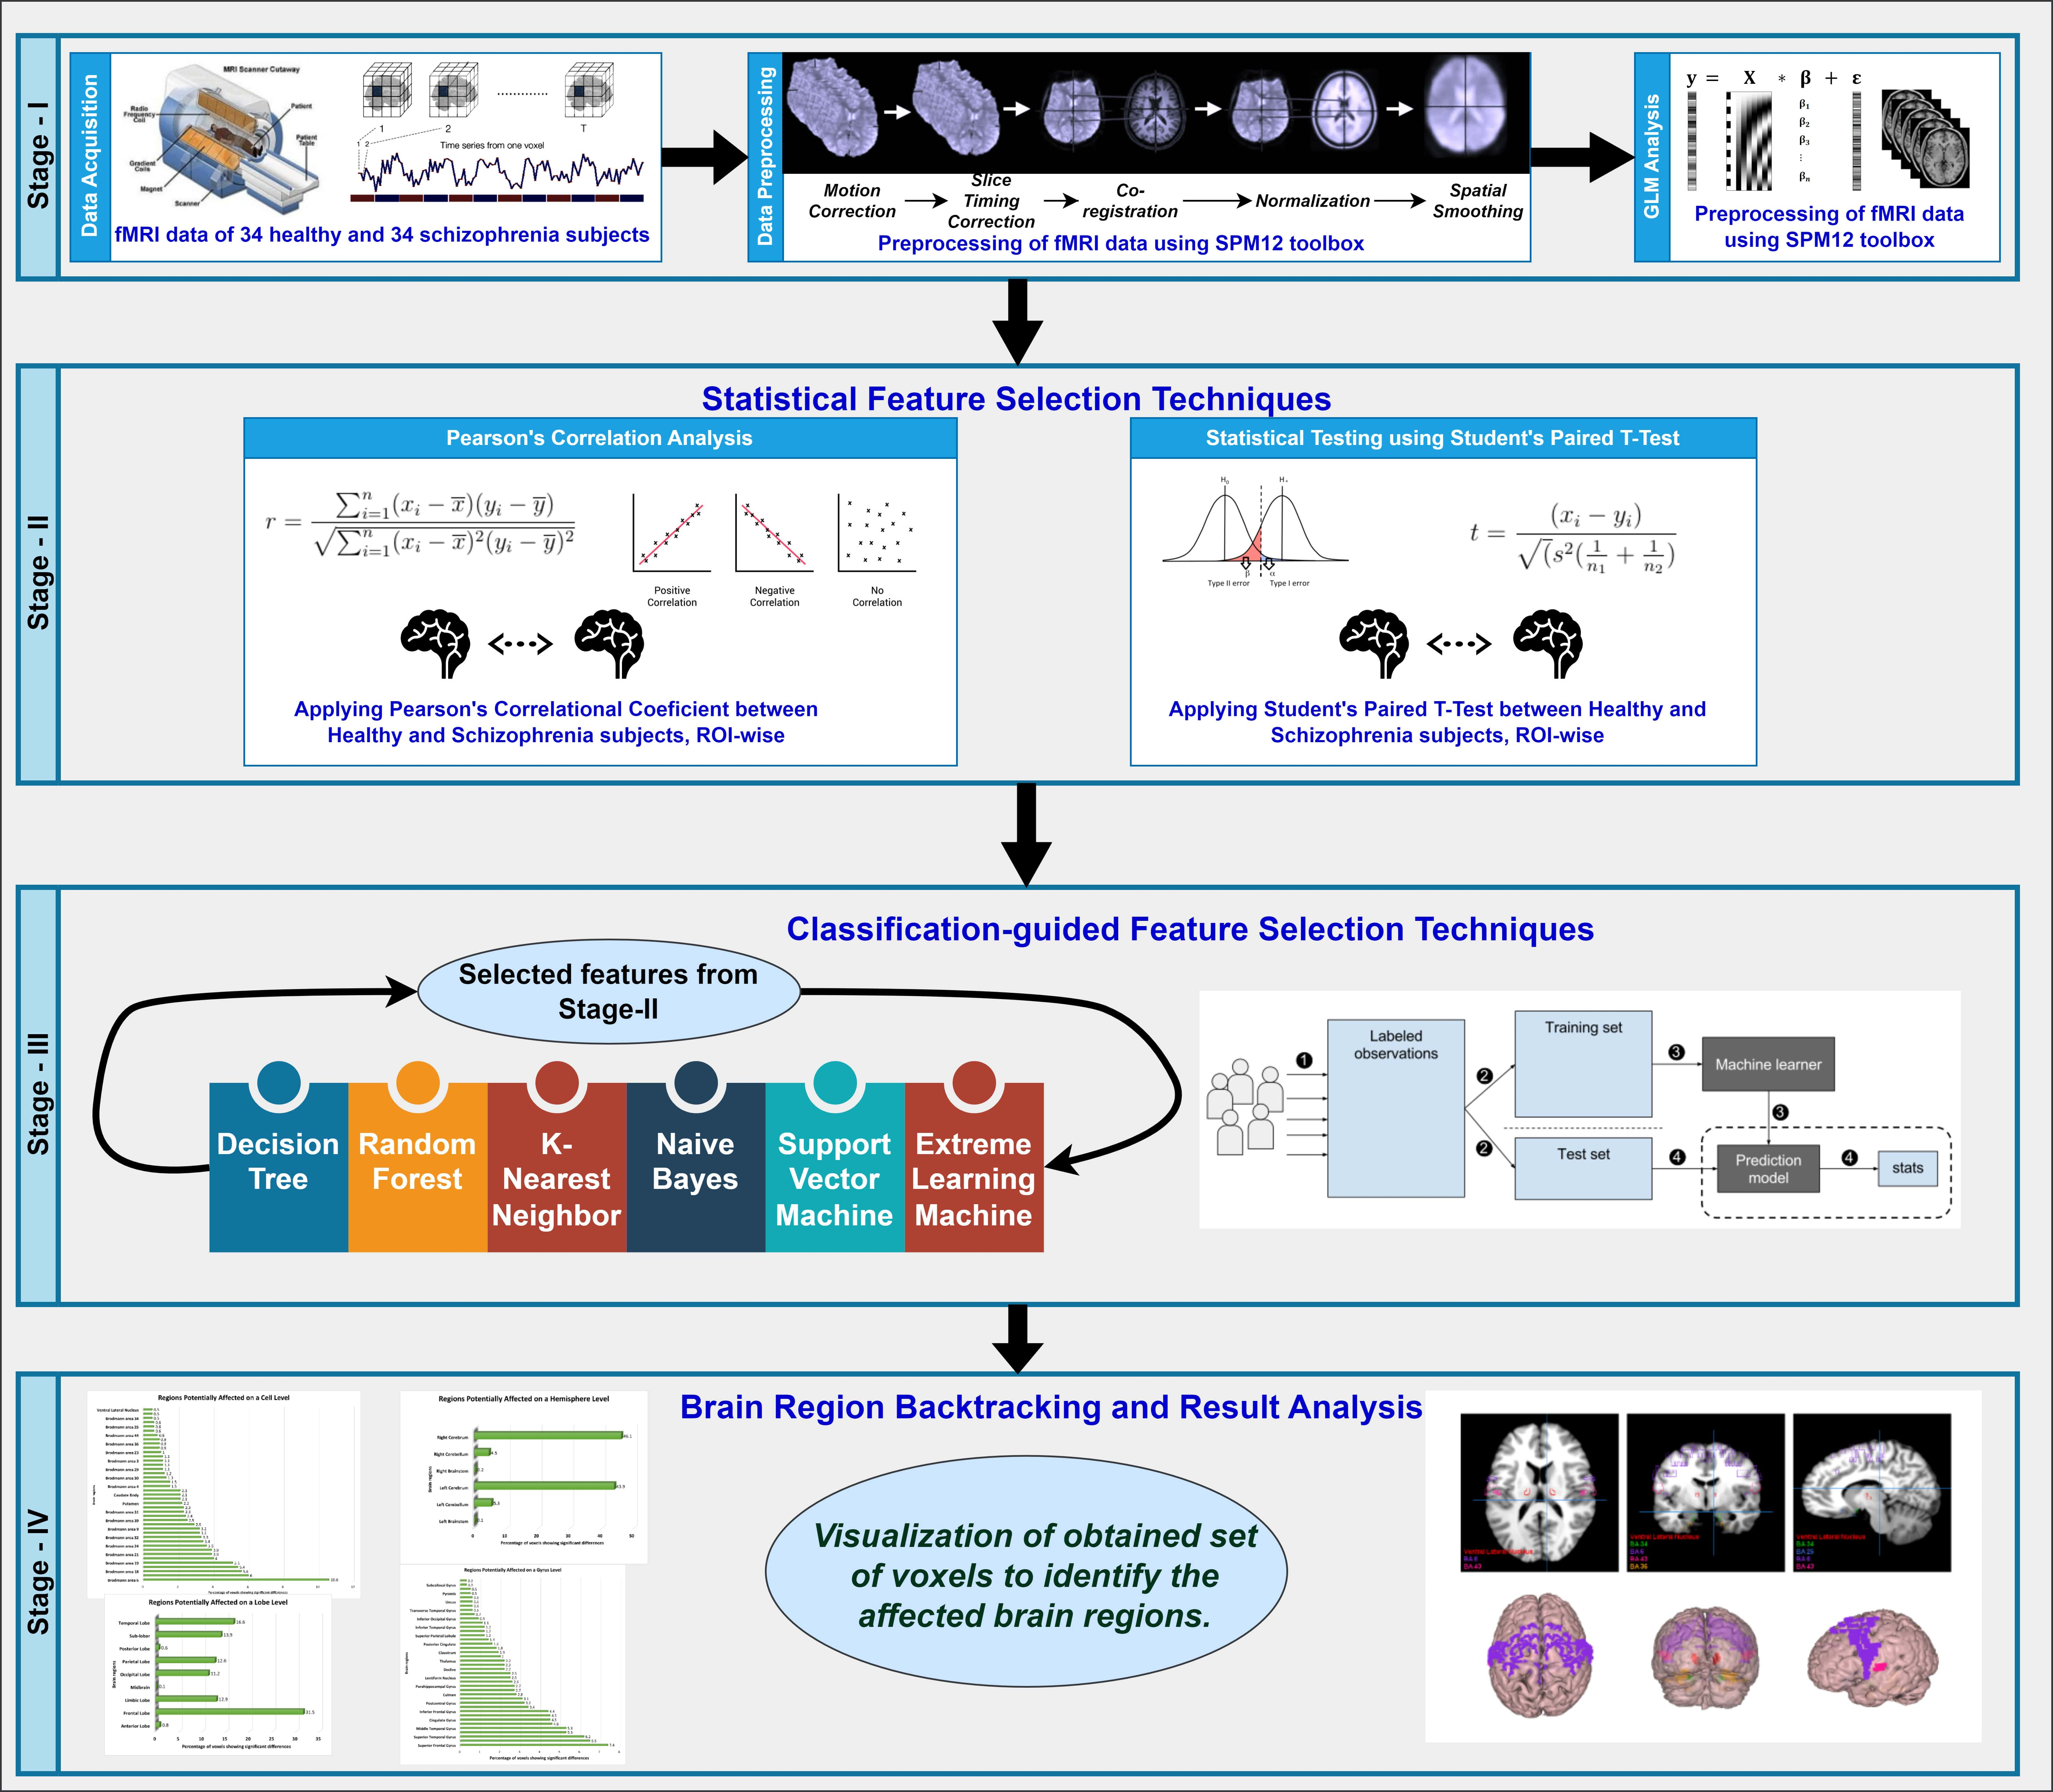 Fig. 1.
The entire workflow diagram of our proposed approach. fMRI, functional magnetic resonance imaging; SPM, Statistical Parametric Mapping; GLM, General Linear Model; ROI, regions of interests.
 |
In this study, we first tried to utilize a systematic theoretical framework to map out the brain regions to facilitate comparisons between regions that are more, less, or similarly activated in schizophrenic subjects. Secondly, the final set of features is the criterion to analyze the specific voxels or brain regions that contributed to the classification of schizophrenia patients. These voxels were then anatomically aligned into a Cartesian coordinate system which is normally used in image processing. After that, the Cartesian coordinates of these voxels are also mapped into the MNI space applying the simplest transformation equation. This transformation step is essential for aligning data acquired across subjects and studies because the MNI space is one of the stereotactic reference systems most commonly used in neuroimaging research. These coordinates are later transformed into Talairach space. Talairach coordinates can give the exact locations of the voxels in the equivalent brain areas. This conversion was accomplished using Talairach’s Daemon, which is a program that labels voxels by their corresponding brain region according to their Talairach coordinate. The tool provides names of brain regions categorized into four hierarchical levels: hemisphere, gyrus, lobes, and Brodmann’s areas. Finally, the MANGO toolbox (https://mangoviewer.com/mango.html) was utilized to visualize the identified brain regions. These tools allow implicated brain areas to be mapped onto a typical functional image, providing an enhanced and comprehensive view of the regions of interest. Therefore, following this systematic approach, it was possible to pinpoint and differentiate certain brain areas that show altered functional connectivity in schizophrenia patients.
In this study, we extracted features from each hierarchy level that achieved the highest classification accuracy using our proposed classification-guided filter-based feature selection techniques. The summarized results are presented in Table 4.
| No. of Selected Features | Hemisphere Level | Lobe Level | Gyrus Level | Brodmann Area Level | ||||
| 8613 (t-test) | 3971 (PC) | 8578 (t-test) | 3929 (PC) | 8214 (t-test) | 3869 (PC) | 4855 (t-test) | 2064 (PC) | |
| K-NN | 77.94% | 77.94% | 77.94% | 83.82% | 76.47% | 80.88% | 77.94% | 83.82% |
| NB | 52.94% | 52.94% | 52.94% | 73.53% | 54.41% | 51.47% | 67.65% | 73.53% |
| DT | 48.53% | 80.88% | 48.53% | 64.71% | 48.53% | 80.88% | 55.88% | 80.88% |
| SVM | 72.06% | 63.24% | 72.06% | 66.18% | 70.59% | 63.24% | 64.70% | 64.71% |
| RF | 57.35% | 60.29% | 57.35% | 54.41% | 52.94% | 57.34% | 64.70% | 51.47% |
| ELM | 64.26% | 62.06% | 63.85% | 62.15% | 65.59% | 62.38% | 61.44% | 62.12% |
K-NN, K-nearest Neighbor; NB, Naive Bayes; DT, Decision Tree; SVM, Support Vector Machine; RF, Random Forest; ELM, Extreme Learning Machine; PC, Pearson’s Correlation.
When we fed the selected significant features into various classifiers as an input, we achieved a maximum classification accuracy of approximately 84% across multiple hierarchy levels: hemispheric, gyrus, lobes, and Brodmann areas. The K-NN algorithm consistently delivered promising results, demonstrating the highest classification accuracy in most scenarios. For features selected via Pearson’s correlation, we attained the highest accuracy of around 84% for the Lobes and Brodmann area, and approximately 81% for the gyrus level using K-NN. At the hemisphere level, we obtained an accuracy of approximately 81% with the decision tree algorithm.
When utilizing the t-test selected features as input for the classifiers, we achieved an accuracy of around 78% at the hemisphere, lobe, and Brodmann area levels, and approximately 77% at the gyrus level, all using the K-NN algorithm.
Among the chosen machine learning techniques, the K-NN algorithm demonstrated the most robust performance in distinguishing between the two groups. Additionally, the decision tree algorithm exhibited exceptional performance compared to other classifiers (see Table 4).
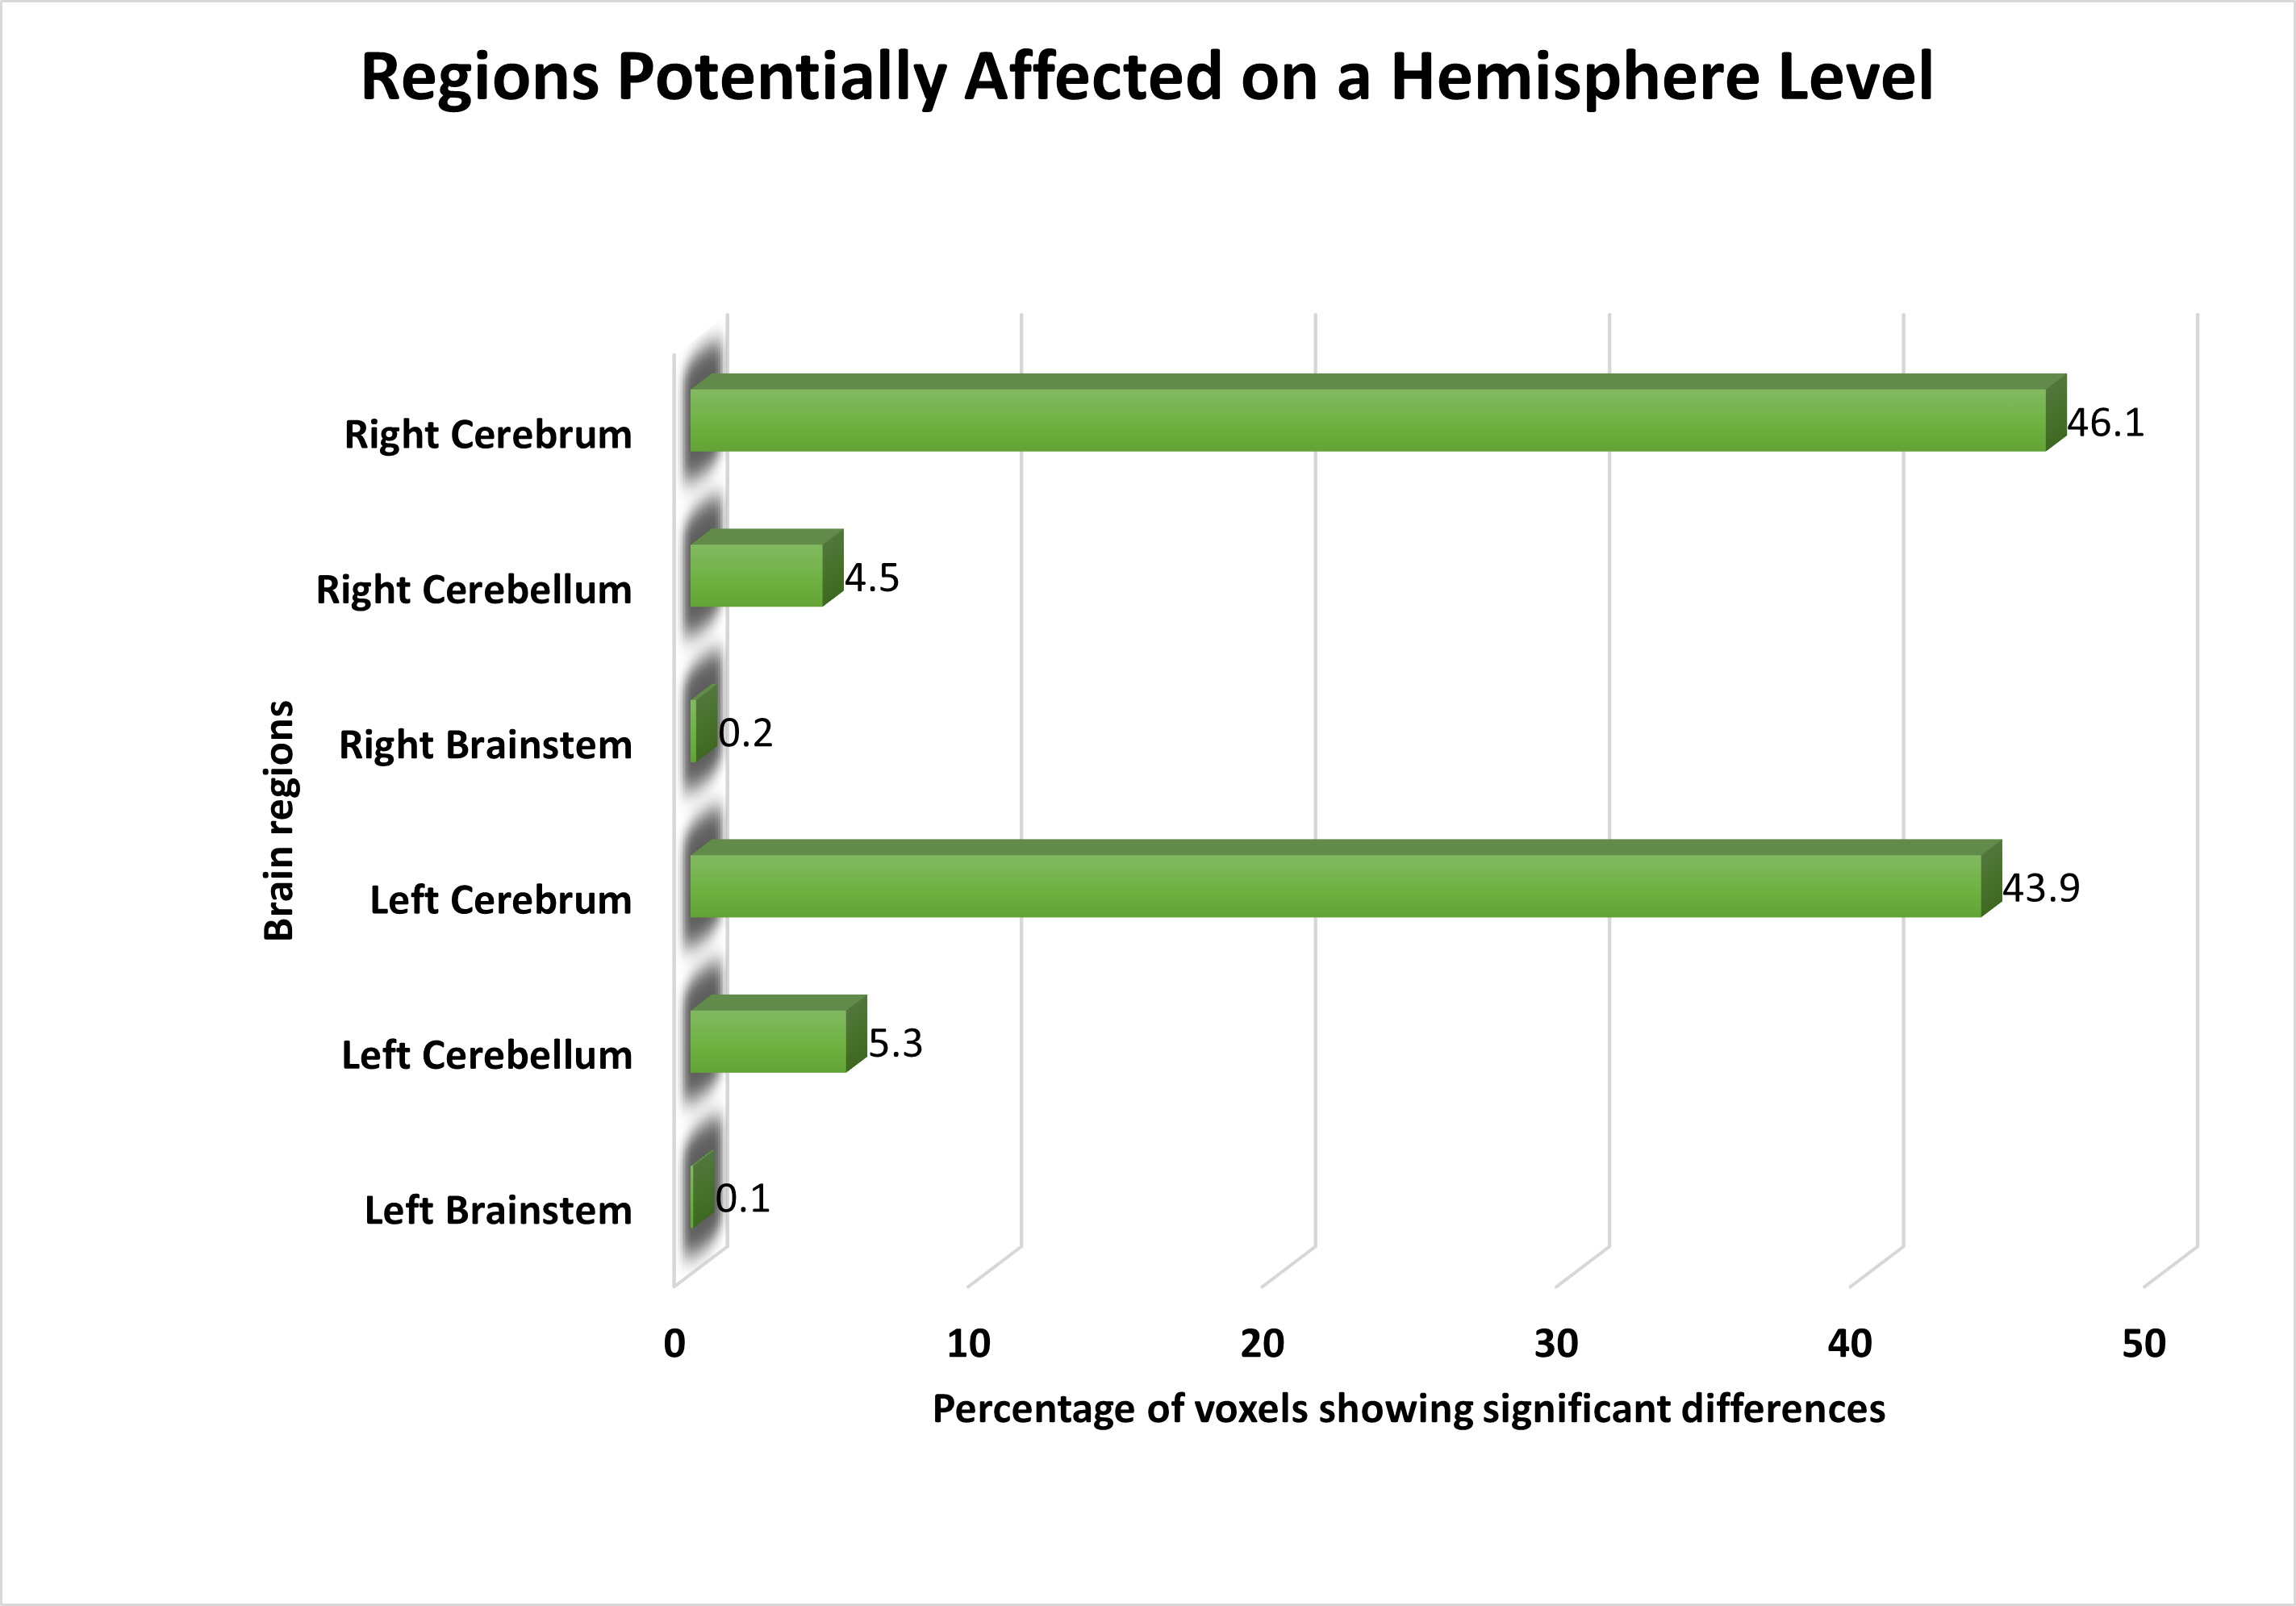
Following feature selection, we identified significant voxels and visualized them on a brain image to highlight the areas most relevant for distinguishing schizophrenia patients from healthy controls. At the hemisphere level, both the left and right cerebellum displayed voxels with distinct activities in schizophrenia patients compared to healthy controls. Furthermore, we observed subtle yet significant changes in functional activation in the left and right brainstem. An overview of the affected areas at the hemisphere level is presented in Fig. 2.
 Fig. 2.
The distribution of voxels identified in different brain regions at the Hemisphere level, expressed as a percentage.
On the lobe level, the frontal lobe exhibited the most significant voxels, followed by the temporal lobe, sub-lobar regions, limbic region, parietal lobe, and occipital lobe. We also noted minor functional alterations in the anterior and posterior lobes, with slight differences in functional activation observed in the midbrain. Fig. 3 illustrates the affected brain areas according to the lobe level.
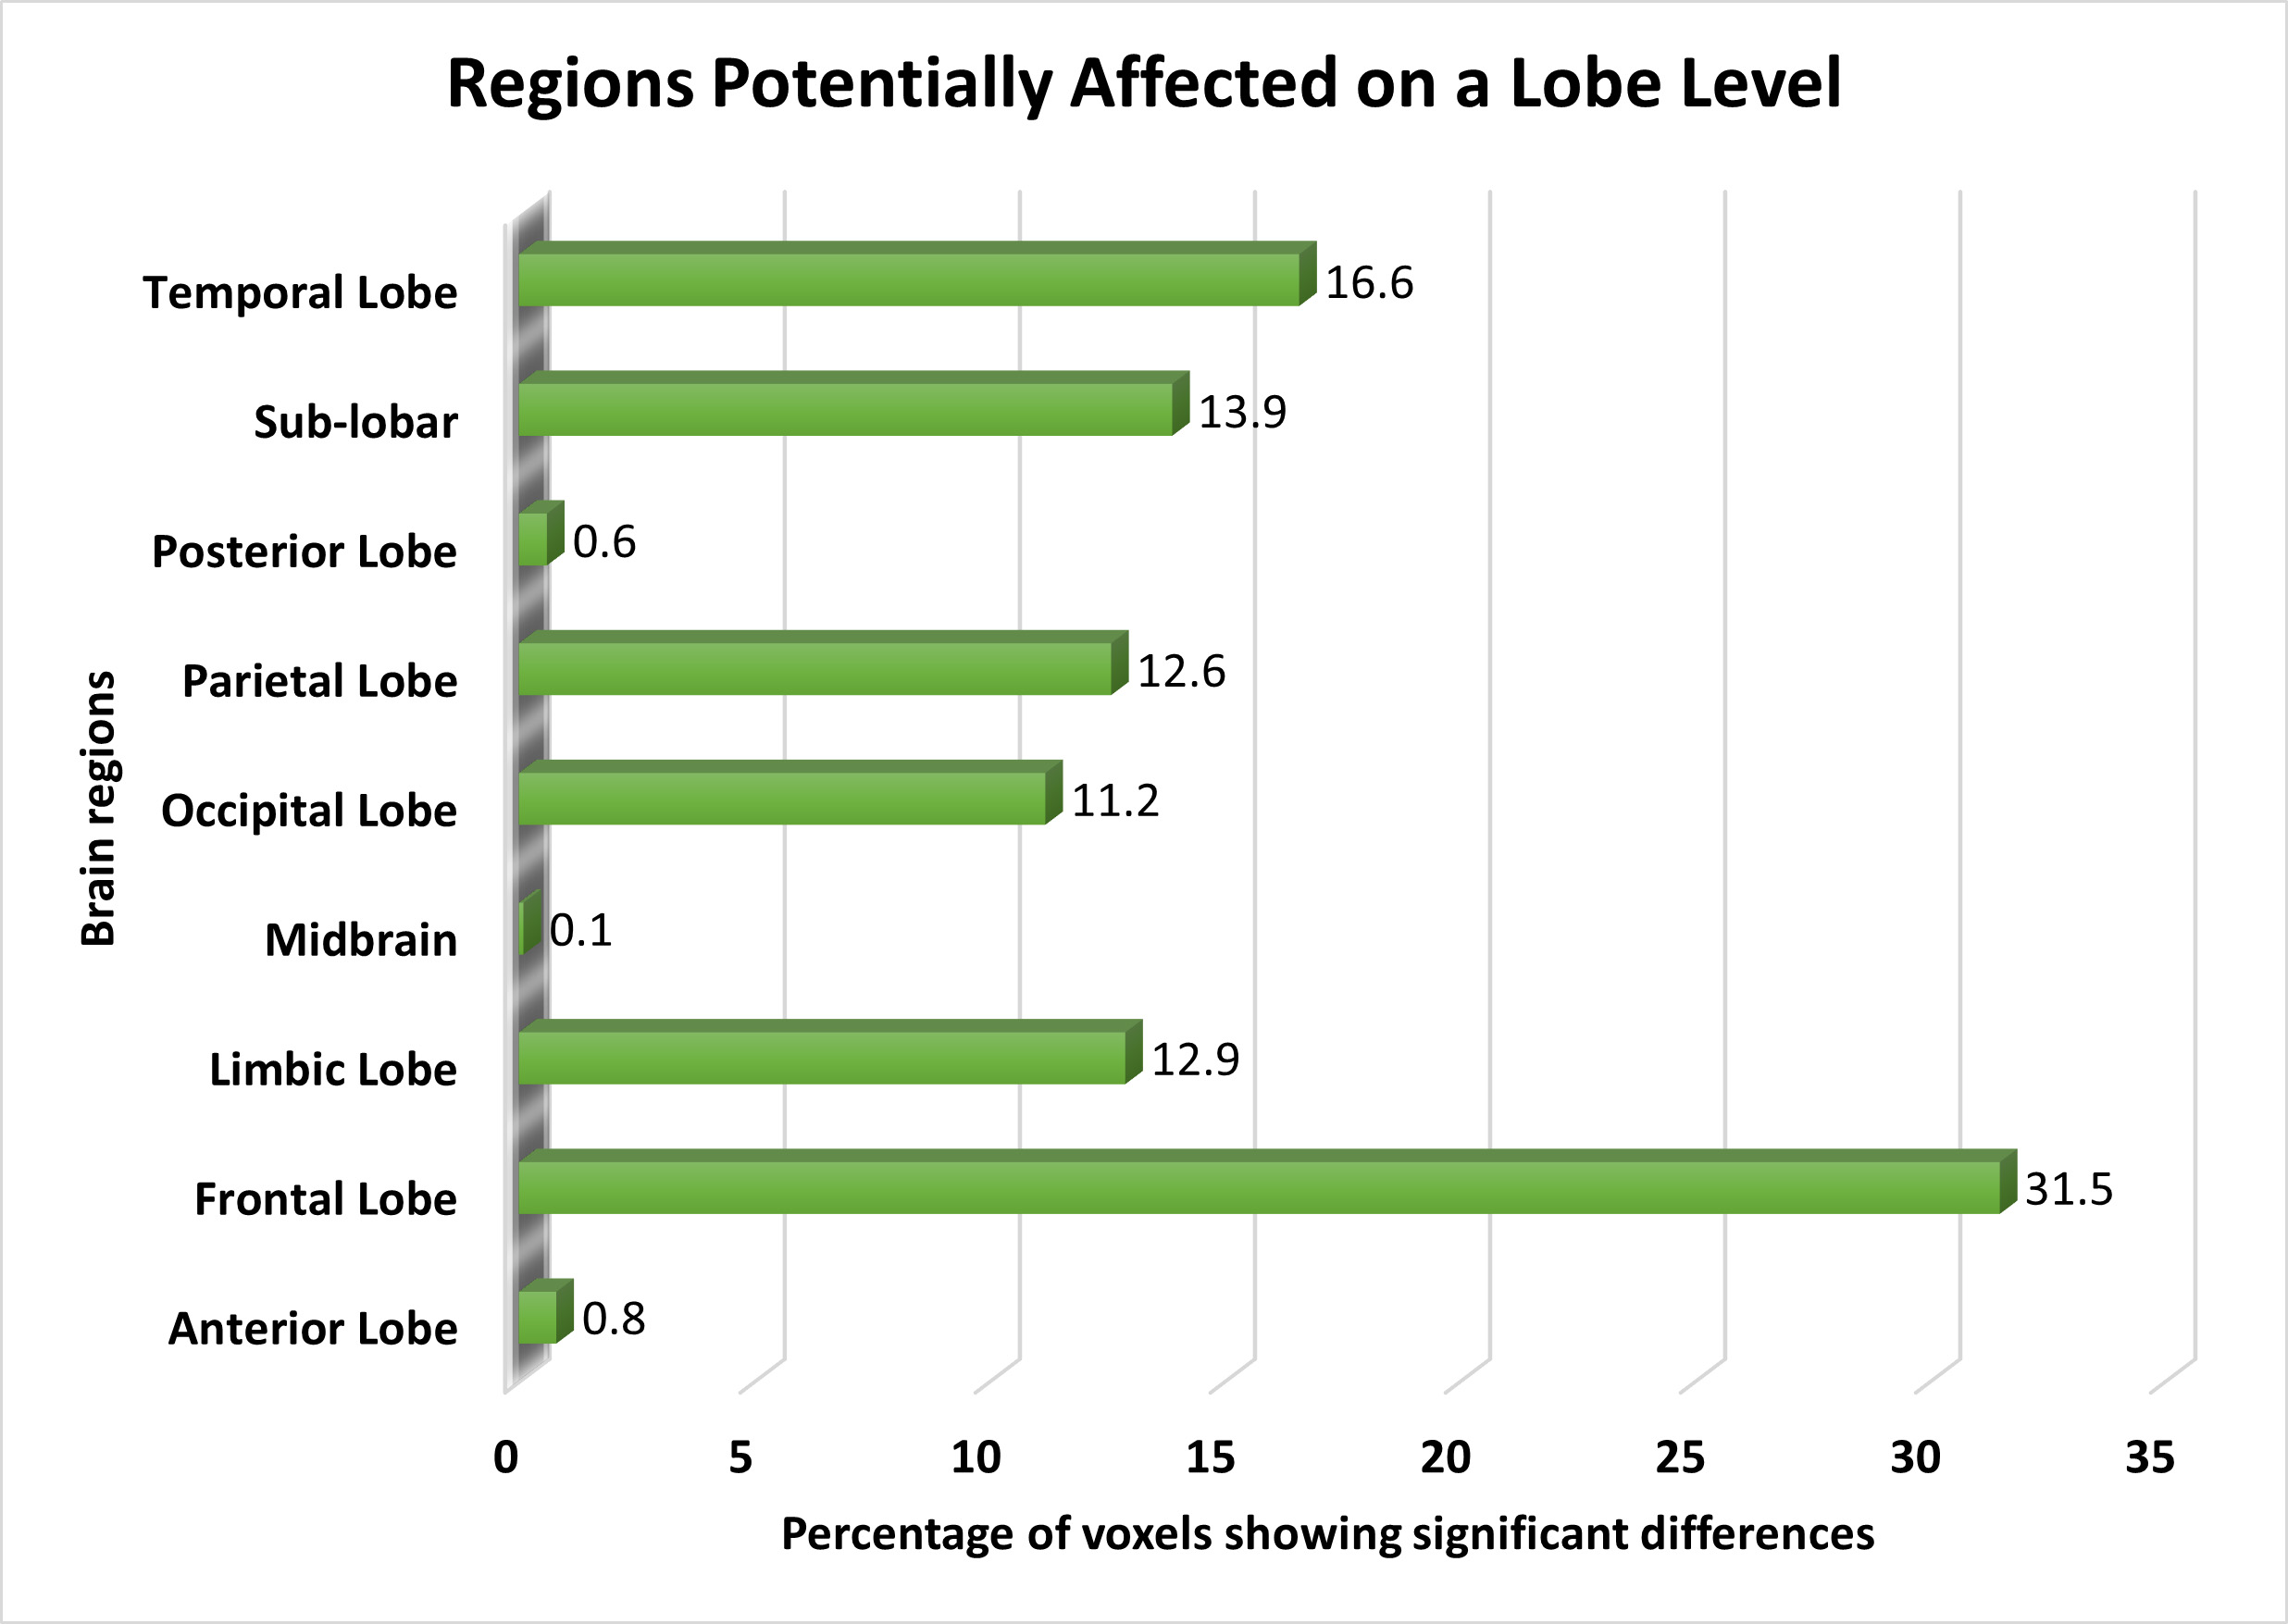 Fig. 3.
The distribution of voxels identified in different brain regions at the Lobe level, expressed as a percentage.
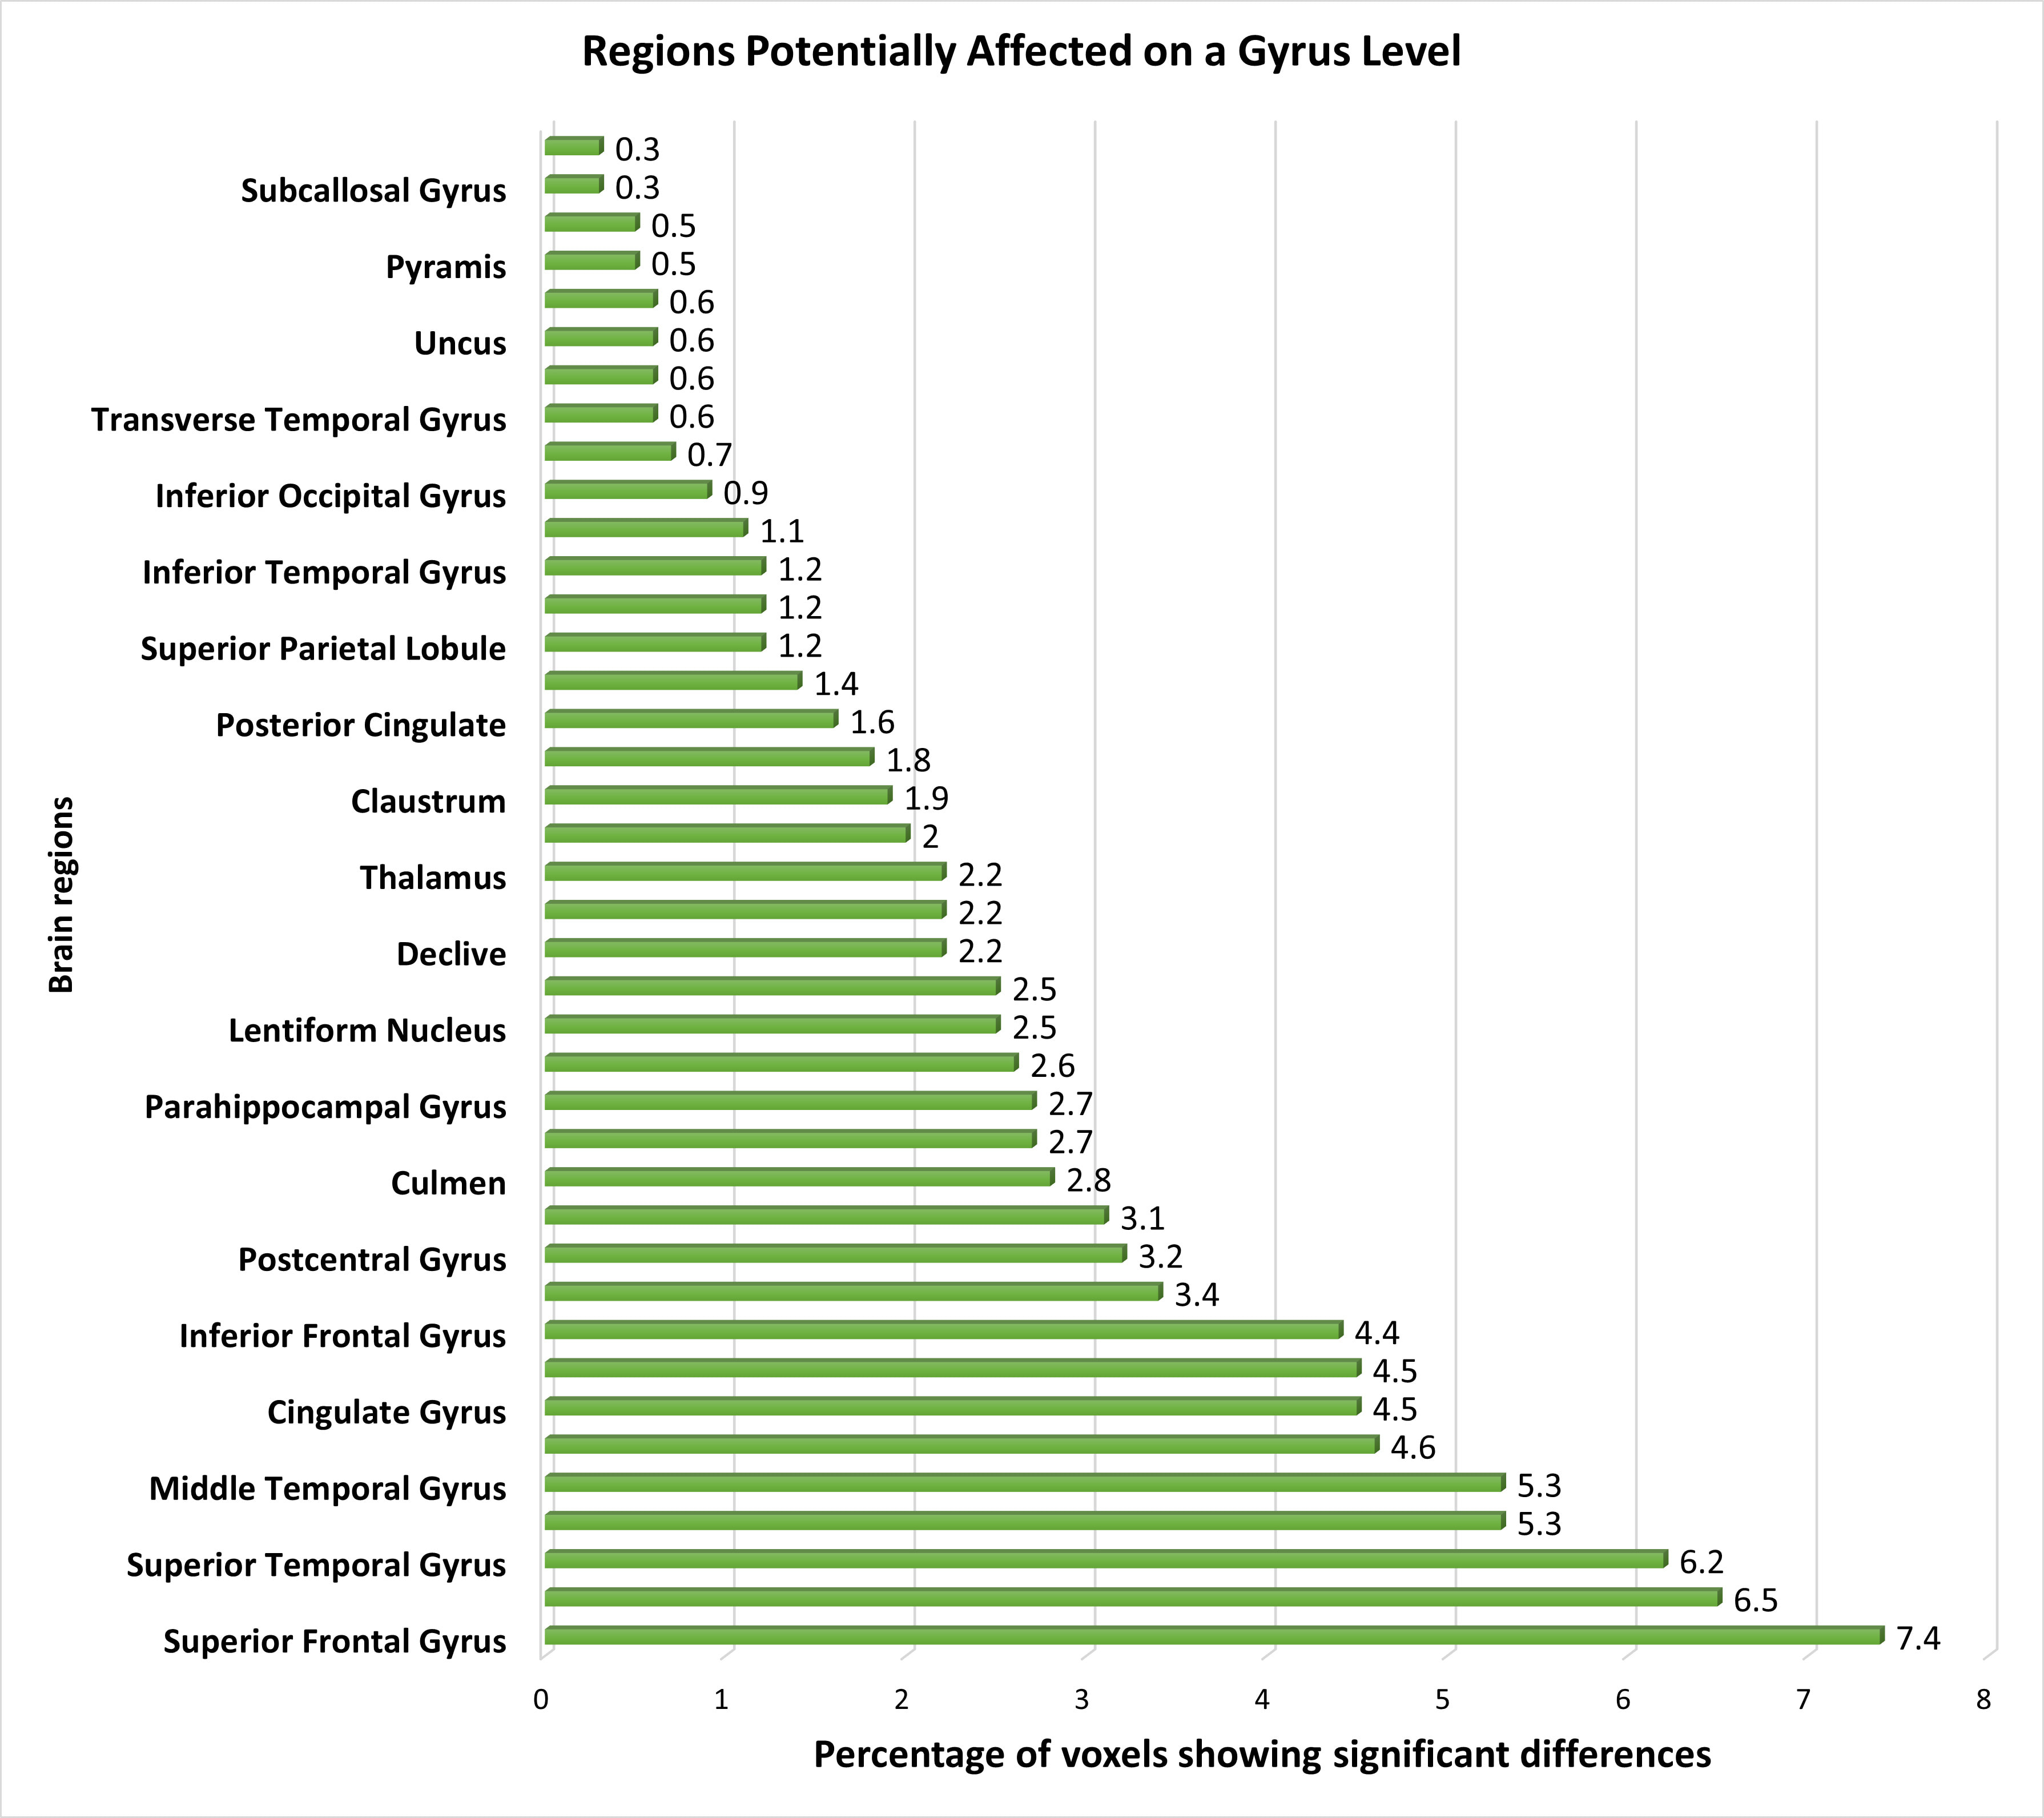
At the gyrus level, several pertinent brain regions showed dysfunction, with the superior frontal, middle frontal, and superior temporal gyrus displaying distinctive features, followed by the medial frontal and middle temporal gyrus. Additionally, the precuneus, cingulate gyrus, precentral gyrus, and inferior frontal gyrus exhibited distinguishable voxels, further supporting the differentiation between schizophrenia patients and healthy controls. Minimal changes in functional activation were observed in other regions such as the caudate, postcentral gyrus, cuneus, culmen, insula, parahippocampal gyrus, anterior cingulate, lentiform nucleus, inferior parietal lobule, declive, lingual gyrus, thalamus, middle occipital gyrus, claustrum, fusiform gyrus, posterior cingulate, sub-gyral areas, superior parietal lobule, cerebellar tonsil, inferior temporal gyrus, paracentral lobule, and inferior occipital gyrus. Additionally, we detected minor yet significant functional changes in regions including the transverse temporal gyrus, tuber, uncus, uvula, pyramis, rectal gyrus, subcallosal gyrus, and superior occipital gyrus. Fig. 4 provides a visualization of the affected brain regions at the gyrus level.
 Fig. 4.
The distribution of voxels identified in different brain regions at the Gyrus level, expressed as a percentage.
Our investigation explored the functional alterations occurring within multiple Brodmann Areas (BAs) and their associated regions in individuals with schizophrenia, using fMRI data. Notable deviations in brain function were discerned across an array of BAs, including BA 6, BA 10, BA 18, BA 7, BA 19, BA 40, BA 21, BA 8, BA 24, BA 22, BA 32, BA 13, BA 9, BA 11, BA 39, BA 37, BA 31, and BA 47, with BA 6 exhibiting the most prominent changes, followed by other BAs.
Furthermore, our analysis pinpointed discernible alterations in functional activations within regions such as the Putamen, Caudate body, BA 20, BA 38, BA 4, BA 41, BA 30, BA 17, BA 29, BA 45, BA 4, and the Caudate head, albeit to a slightly lesser degree compared to the highly affected BAs. Additionally, significant functional shifts were noted in select areas, such as BA 23, BA 43, BA 36, BA 46, BA 44, BA 42, BA 25, BA 34, Pulvinar, Lateral Globus Pallidus, and Ventral Lateral Nucleus, albeit with attenuated magnitudes.
To validate our findings, statistical analyses were conducted for each ROI, yielding p-values below 0.05, signifying statistical significance across all acquired regions. Further, T-statistics values were calculated for each ROI, elucidating the significance levels of the affected regions. Additionally, the percentage of voxel-space covered by significantly affected voxels within each ROI was determined, providing further insights into the extent of alterations. A concise summary of our statistical results is presented in Table 5.
| Hierarchy Level | Percentage of Voxel (in %) | T Stat | Mean p value | |
| Hemisphere | ||||
| 1. Right Cerebrum | 13 | 2.54 | 0.021 | |
| 2. Left Cerebrum | 13 | 2.52 | 0.021 | |
| 3. Left Cerebellum | 6 | 2.25 | 0.031 | |
| 4. Right Cerebellum | 7 | 2.34 | 0.028 | |
| Lobe | ||||
| 1. Frontal Lobe | 9 | 2.44 | 0.024 | |
| 2. Temporal Lobe | 10 | 2.60 | 0.020 | |
| 3. Sub-Lobar | 14 | 2.49 | 0.022 | |
| 4. Limbic Lobe | 20 | 2.62 | 0.018 | |
| 5. Parietal Lobe | 23 | 2.59 | 0.019 | |
| 6. Occipital Lobe | 13 | 2.45 | 0.022 | |
| Gyrus | ||||
| 1. Superior Frontal Gyrus | 11 | 2.49 | 0.022 | |
| 2. Middle Frontal Gyrus | 10 | 2.42 | 0.024 | |
| 3. Superior Temporal Gyrus | 14 | 2.71 | 0.017 | |
| 4. Medial Frontal Gyrus | 23 | 2.58 | 0.020 | |
| 5. Middle Temporal Gyrus | 13 | 2.62 | 0.019 | |
| 6. Precuneus | 25 | 2.52 | 0.021 | |
| 7. Cingulate Gyrus | 26 | 2.60 | 0.019 | |
| 8. Inferior Frontal Gyrus | 9 | 2.43 | 0.024 | |
| 9. Caudate | 10 | 2.44 | 0.023 | |
| 10. Subcallosal Gyrus | 18 | 2.57 | 0.018 | |
| Brodmann Area | ||||
| 1. BA 4 | 10 | 2.53 | 0.021 | |
| 2. BA 6 | 9 | 2.53 | 0.020 | |
| 3. BA 7 | 12 | 2.48 | 0.022 | |
| 4. BA 8 | 13 | 2.51 | 0.021 | |
| 5. BA 10 | 11 | 2.54 | 0.021 | |
| 6. BA 11 | 12 | 2.44 | 0.023 | |
| 7. BA 13 | 12 | 2.57 | 0.020 | |
| 8. BA 18 | 12 | 2.59 | 0.020 | |
| 9. BA 19 | 10 | 2.45 | 0.023 | |
| 10. BA 21 | 14 | 2.53 | 0.020 | |
| 11. BA 22 | 13 | 2.55 | 0.020 | |
| 12. BA 24 | 10 | 2.53 | 0.022 | |
| 13. BA 25 | 16 | 2.72 | 0.016 | |
| 14. BA 32 | 16 | 2.54 | 0.019 | |
| 15. BA 34 | 17 | 2.63 | 0.016 | |
| 16. BA 36 | 17 | 2.51 | 0.020 | |
| 17. BA 39 | 14 | 2.66 | 0.016 | |
| 18. BA 40 | 16 | 2.79 | 0.012 | |
| 19. Ventral Lateral Nucleus | 12 | 2.54 | 0.020 | |
It also shows the percentage of voxels that is found to be significant among the whole region.
Finally, the affected brain regions at the Brodmann Area level were visualized, as illustrated in Fig. 5. Our study thus furnishes a comprehensive comprehension of the functional aberrations across diverse BAs and their associated regions in individuals with schizophrenia, offering valuable insights for enhancing the diagnosis and treatment paradigms for this severe disorder.
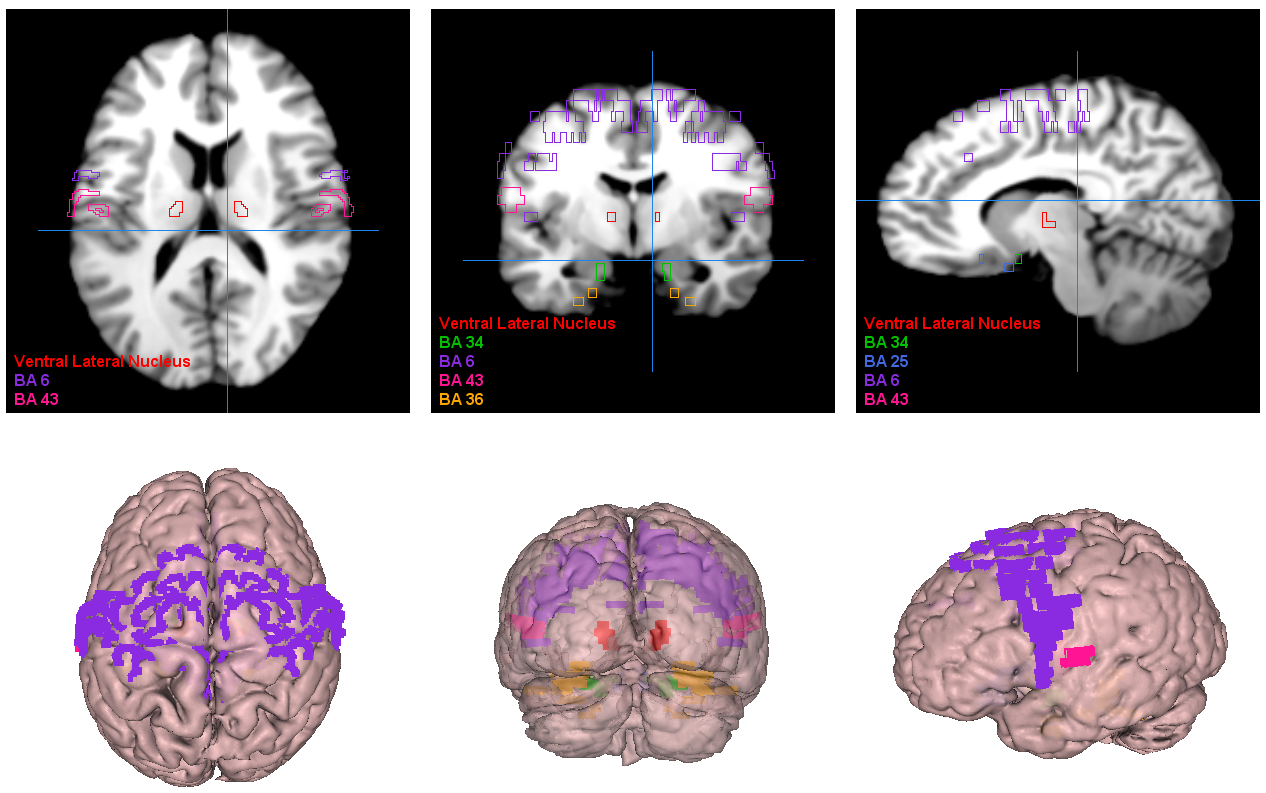 Fig. 5.
Visualization of the most significant brain regions as obtained by our proposed approach. BA6, supplementary motor area; BA43, cerebral cortex; BA36, perirhinal cortex; BA34, hippocampus and neocortex; BA25, amygdala-related region.
The etiology of schizophrenia remains elusive, with multiple factors implicated in its onset [62]. Brain structure and function contribute significantly to schizophrenia’s pathogenesis, as research has explored differences in brain connectomes, volumetric alterations in brain regions [47], and neurotransmitter interactions between schizophrenia patients and healthy controls. Identifying affected brain regions can aid in diagnosing patients and devising targeted therapeutic interventions.
Our use of the auditory oddball paradigm is significant because it engages neural circuits involved in attention and auditory processing, often disrupted in schizophrenia. Task-based fMRI findings, such as those from the oddball paradigm, can provide a deeper understanding of functional abnormalities associated with the disorder compared to resting-state fMRI, despite potential confounding effects due to task complexity. Notably, Javitt et al. (2000) [63] highlight the paradigm’s utility in identifying deficits in auditory context processing in schizophrenia, while Umbricht and Krljes (2005) [64] provide a comprehensive meta-analysis on mismatch negativity, further validating its effectiveness in exploring auditory processing abnormalities.
Our study identified significant brain areas exhibiting differential activity between schizophrenia patients and healthy individuals, potentially uncovering previously unrecognized regions. Notably, we identified the cerebellum as a highly significant brain region at the hemisphere level, as depicted in Fig. 2. This finding aligns with previous research [8, 9, 16, 17, 18, 19, 50].
A fMRI study in schizophrenia have centered on areas associated with working memory [65] or analyzed brain gray matter densities [47]. Some studies focused on medicated patients [66] or those experiencing their first episode [34]. Our findings on the relatively minor involvement of the brainstem in schizophrenia align with select fMRI studies [67, 68].
We highlighted the frontal lobe as the most significant brain region in schizophrenia patients, consistent with prior research [19, 46, 51]. We also observed subtle functional changes in the temporal lobe [40]. Alterations in the sub-lobar region have primarily been reported in studies focusing on gray matter [69] or brain network functionalities [70], with limited exploration into brain activities in these areas. We found significant changes in the limbic lobe [66], whereas the midbrain exhibited the smallest percentage of distinguishable activities. Previous studies identified the midbrain as an affected area in schizophrenia [28, 29], and our study provides unique insights due to its experimental methods. Additionally, we found alterations in the posterior lobe, a novel finding warranting further investigation.
At the gyrus level, the superior and middle frontal gyrus emerged as the most significantly affected brain regions in schizophrenia patients [71]. Differences in thalamus activation were also observed [19, 21, 46]. The Insula, a gyrus-level brain region implicated in schizophrenia, exhibited a small percentage of affected brain voxels, consistent with previous findings [72, 73]. The Pyramis showed relatively minor involvement, aligning with gray matter analyses [74, 75], with limited exploration in fMRI studies except in subjects with substance abuse history [76]. Furthermore, we identified the subcallosal gyrus as a less significantly affected brain region, a finding supported by only one previous study [30].
Our study aligns with earlier research, corroborating established knowledge while unveiling novel insights into unexplored brain areas. Our investigation at the lobe and gyrus levels underscores the importance of the frontal lobe and the involvement of the superior and middle frontal gyrus in schizophrenia. We also highlighted other affected brain regions, including the Insula, Pyramis, and subcallosal gyrus. These regions play crucial roles in emotional regulation, memory processing, and sensory integration, with dysfunction associated with schizophrenia symptoms like social withdrawal, auditory hallucinations, and delusions.
At the Brodmann area level, we identified several brain regions with altered activity patterns in schizophrenia patients. The supplementary motor area (BA 6) within the frontal cortex, as illustrated in Fig. 6, showed the highest percentage of altered brain activity compared to healthy controls, consistent with prior research [32, 77]. Significant alterations in the postcentral region of the cerebral cortex (BA 43) align with previous study focusing on visual or auditory stimuli [78]. These findings further support the involvement of these brain regions in schizophrenia pathophysiology.
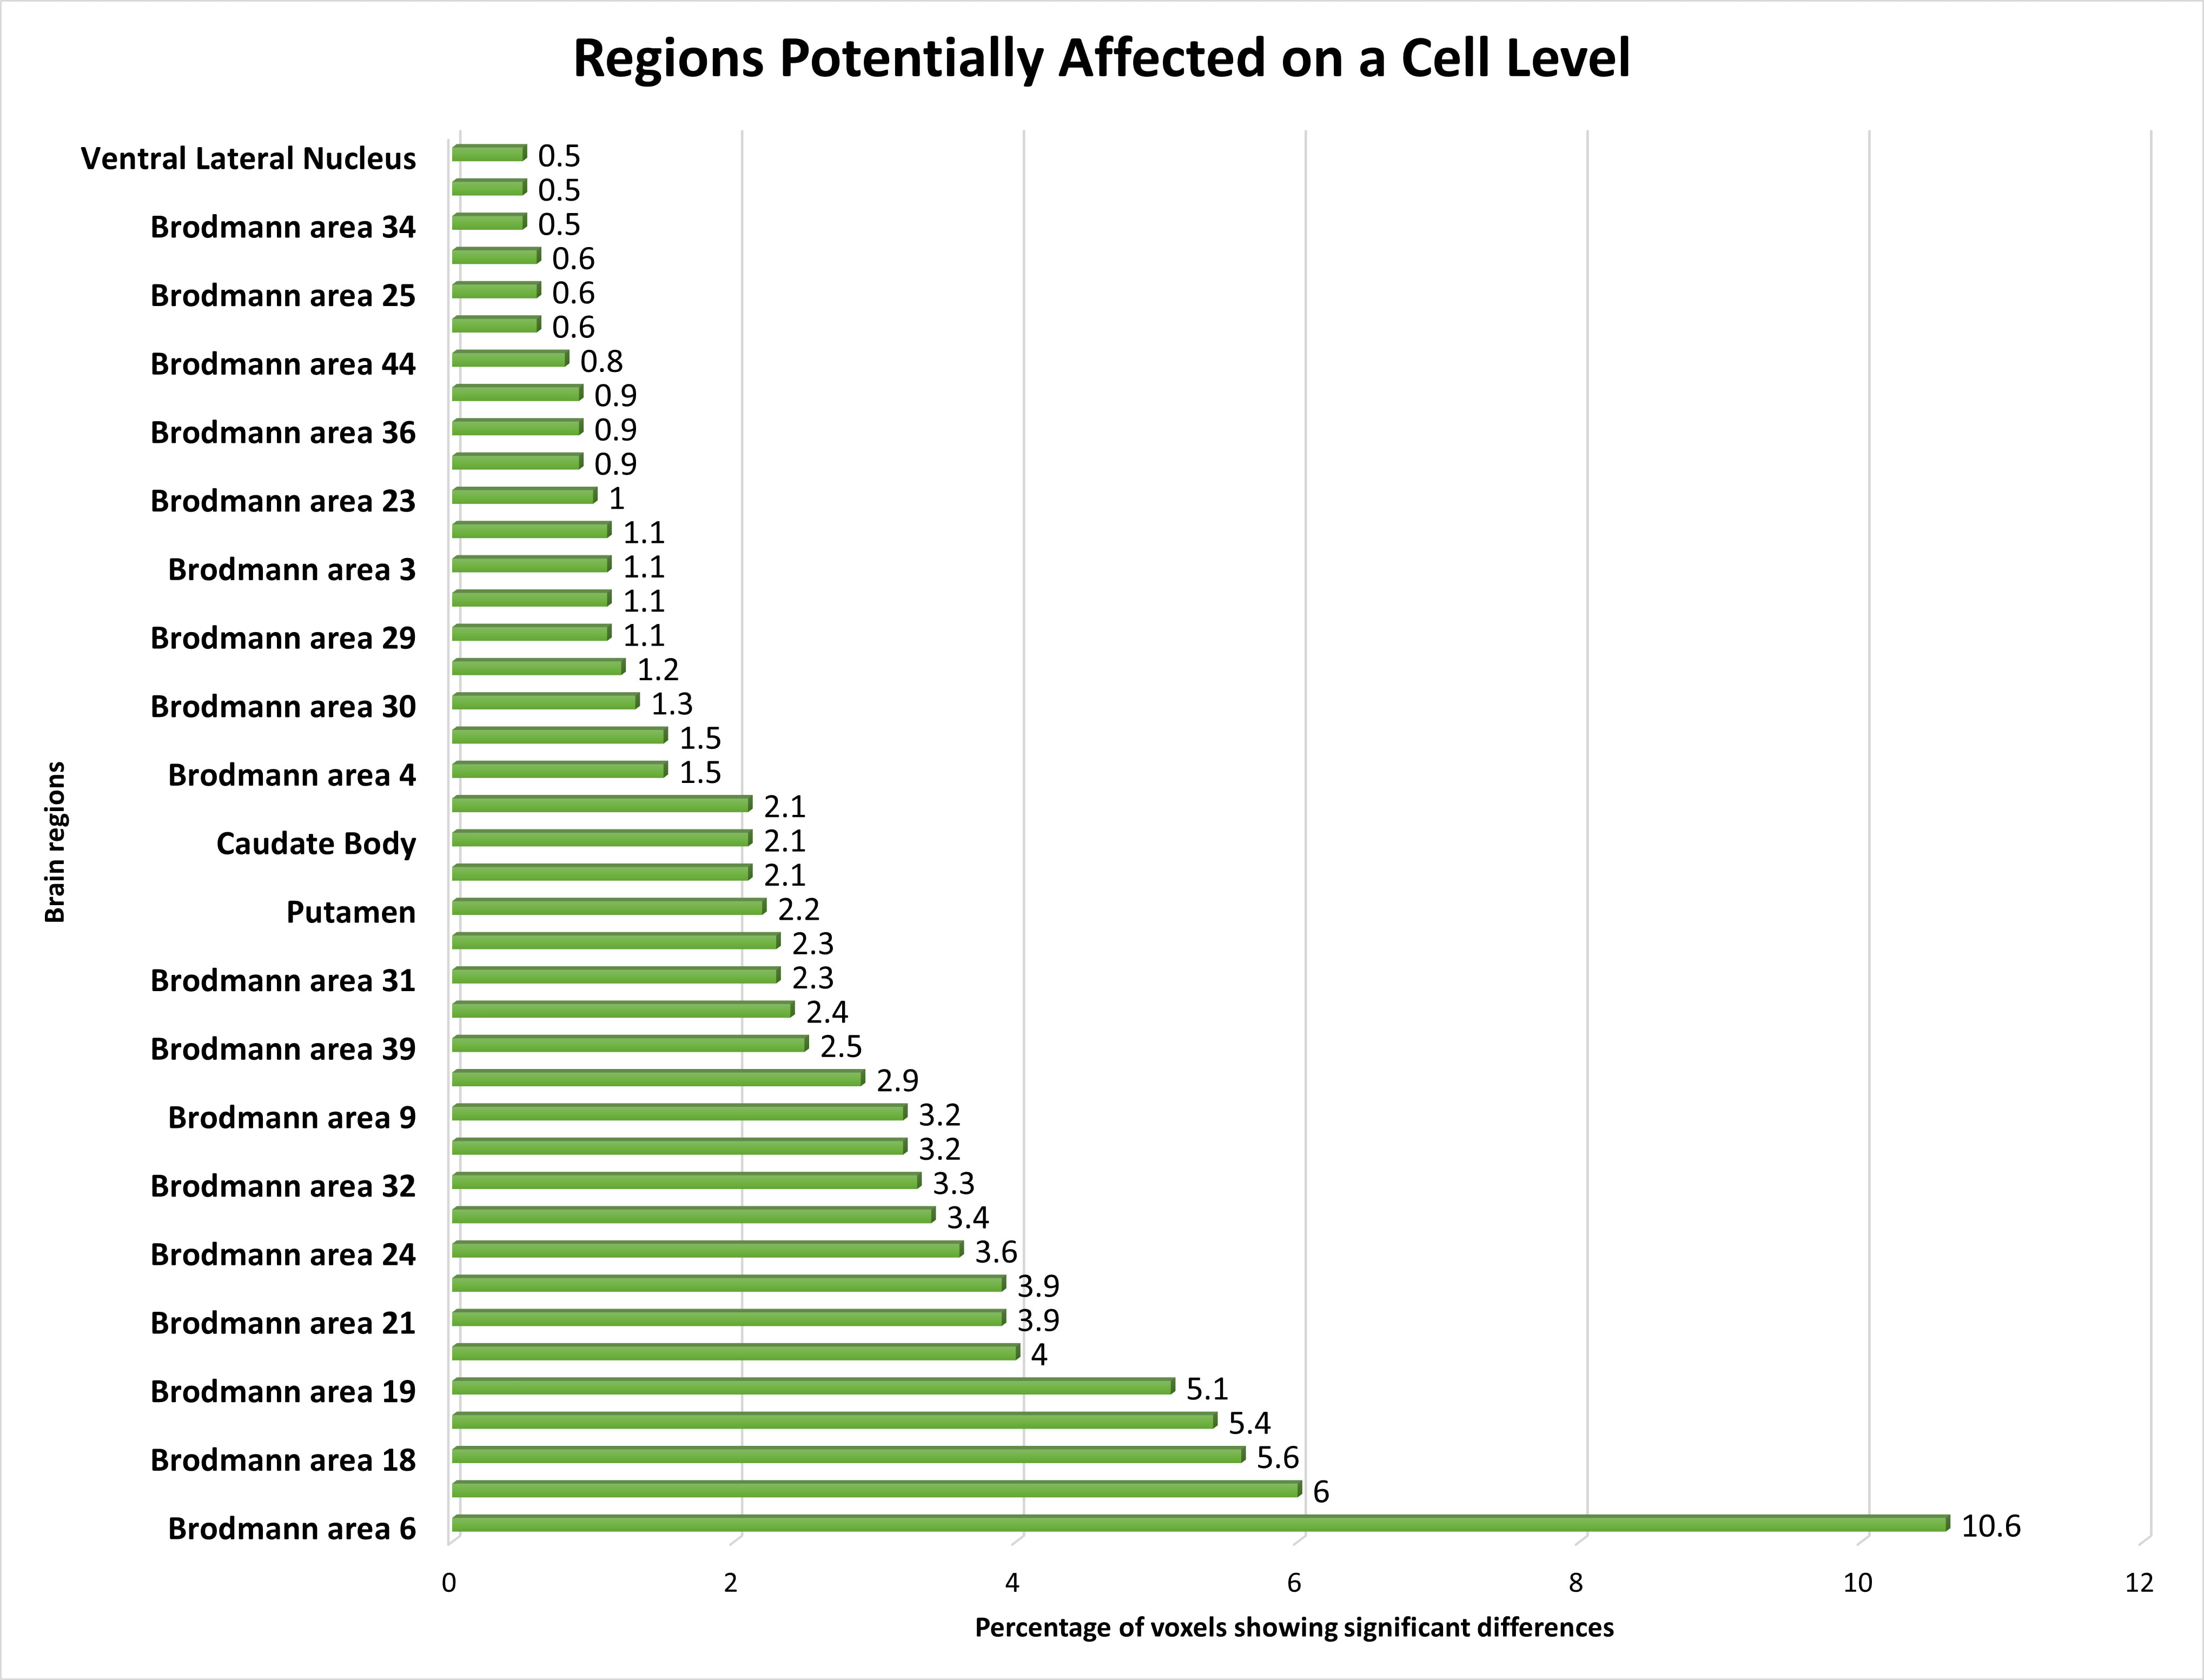 Fig. 6.
The distribution of voxels identified in different brain regions at the Cell level, expressed as a percentage.
We noted altered brain activity in the perirhinal cortex (BA 36), a region previously implicated in schizophrenia by a few studies [37, 38]. These studies did not use fMRI data, making our observation of altered brain activity in BA 36 using fMRI data a novel contribution. Similarly, we detected altered brain activity in the amygdala-related region (BA 25), linked to schizophrenia in certain non-fMRI study [36]. Our finding supports the involvement of this region in schizophrenia, particularly given our use of fMRI data.
Brodmann Area 4, located in the posterior portion of the frontal lobe, has only been sporadically implicated in schizophrenia, primarily in studies focusing on gray matter analysis. We also identified the orbitofrontal cortex (BA 11) as a region with altered brain activity in schizophrenia, consistent with findings from a few fMRI studies using different experimental conditions [79, 80]. These findings add to the body of evidence supporting the involvement of these regions in schizophrenia pathology.
We found the angular gyrus within the parietal cortex (BA 39) significantly affected in schizophrenia, a finding reported in only a limited number of studies [39, 81]. This highlights the importance of further research to elucidate the role of BA 39 in schizophrenia pathophysiology.
We also noted subtle changes in functional activations in the ventral lateral nucleus, previously identified as relevant in schizophrenia across studies with varied methodologies [41, 42, 82]. Our findings provide additional support for the involvement of this region in schizophrenia, particularly given our use of fMRI data.
Lastly, we identified the region between the hippocampus and neocortex (BA 34) as significantly affected in schizophrenia patients, a finding not previously reported in the literature [26, 83]. This discovery represents a novel contribution to the field and emphasizes the importance of further exploration into the role of this region in schizophrenia pathology.
The study of the areas of the brain that are involved in schizophrenia also holds effective information that can change the way this disorder is dealt with. The areas of the brain that we identified include the superior and middle frontal gyrus, Insula, Pyramis, and subcallosal gyrus, and hence our research presents a more complex neural architecture of schizophrenia.
Our study contributes to expanding the knowledge about the multiple aspects of schizophrenia, including emotion, memory, and particularly, sensory processing. Furthermore, by highlighting the supplementary motor area and identifying the postcentral region, we contribute to the literature that confirms that these regions are involved in motor and sensory states that are characteristic of schizophrenic patients. Besides, the fact that we identified the changes in the perirhinal cortex and the region related to the amygdala bears witness to the importance of these areas in the manifestation of the disorder.
However, we have to point out some limitations of this research that are as follows: Possible limitations include a limited sample size, which might compromise study validity. Our proposed method indeed provided high classification accuracy, therefore additional research with larger and different samples of patients and healthy controls is needed to confirm the obtained findings. Secondly, our experiment concerned task-based fMRI only and, in particular, auditory odd-ball tasks. Presumably, further studies of different cognitive tasks and the brain areas involved in schizophrenia might provide a more comprehensive understanding of the disorder. At the same time, it is crucial to acknowledge that the results of neuroimaging studies, including fMRI, do not establish causality and should be interpreted with caution. Apart from this, it is acknowledged that the modification of classifiers with the help of hyperparameter tuning in a trial-and-error manner is also disadvantageous because it may contribute to the increased accuracy rate. Moreover, we have explored several strategies concerning the ways to avoid this problem. The common method that we used in the experiments is cross-validation to make sure that the models are well trained. There was certainly an emphasis placed on the various performance measures and the models were later regularized to mitigate chances of overfitting.
Nevertheless, these outcomes portray the need for future investigations to develop individualized interventions to improve the quality of life and manage symptoms of schizophrenia. The findings provide potential directions for creating more targeted interventions. While our findings provide significant insight into the neural underpinnings of schizophrenia, our study focuses on the functional anomalies found by fMRI, which should be evaluated in the context of this form of imaging. Future research should include genetic aspects and biomarkers to provide a deeper understanding of the condition and its underlying causes.
This study presents an innovative and thorough method for analyzing schizophrenia disorder using the fMRI data. Our multi-stage feature selection model, which combines filter-based statistical methods and machine learning algorithms, achieved high classification accuracy and revealed significant differences in brain activation patterns between schizophrenia patients and healthy controls. Furthermore, we found additional brain areas that had not previously been mentioned in fMRI research on schizophrenia, which advanced our understanding of the disorder’s neurological underpinnings. These discoveries have far-reaching consequences, opening up new avenues for study and the creation of more effective diagnostic and therapeutic methods. By exposing previously undiscovered brain areas and functional differences, our research provides a pathway for customized treatment options to address these particular neurological disorders. This study underscores the importance of advanced technologies in fMRI analysis to get significant insights into the complicated nature of schizophrenia.
The MRI dataset utilized in this study is publicly available for download from (http://schizconnect.org/). The data subset used in this research can be shared with interested readers upon reasonable request. Requests for data access should be directed to the corresponding author, who will facilitate the provision of the dataset, ensuring compliance with ethical and legal requirements.
IC conceptualized the study, formulated the hypothesis, designed the research methodology and experiments. IC and LB performed the experiments together. LB and IC collaborated in writing the first draft of the manuscript. IC finalized the first draft and conducted subsequent revisions. Both authors read and approved the final manuscript. Both authors have participated sufficiently in the work and agreed to be accountable for all aspects of the work.
Not applicable.
The authors express their sincere gratitude to Dr. Daniela Dentico, a distinguished neuroscientist, for her invaluable review of the manuscript and insightful comments, which enhanced the quality of this work.
This research received no external funding.
The authors declare no conflict of interest.
References
Publisher’s Note: IMR Press stays neutral with regard to jurisdictional claims in published maps and institutional affiliations.