


1 Department of Pain Medicine, Affiliated Hospital of Jiaxing University, 314000 Jiaxing, Zhejiang, China
2 Department of Anesthesiology, Southwest Hospital, Army Medical University, 400038 Chongqing, China
3 School of Health Economics and Management, Nanjing University of Chinese Medicine, 210023 Nanjing, Jiangsu, China
4 Department of Radiology, Affiliated Hospital of Jiaxing University, 314000 Jiaxing, Zhejiang, China
5 Department of Basic Medicine, School of Health and Nursing, Wuxi Taihu University, 225009 Wuxi, Jiangsu, China
6 Department of Anesthesiology, Nanjing First Hospital Nanjing Medical University, 210006 Nanjing, Jiangsu, China
†These authors contributed equally.
Abstract
Background: Sepsis-associated encephalopathy (SAE) impairs hippocampal
microglial efferocytosis, causing cognitive deficits. Previous research found
that milk fat globule epidermal growth factor 8 protein (MFGE8) stimulates
efferocytosis, reducing hippocampal inflammation in SAE rats. In this study, we
explore MFGE8’s role in alleviating cognitive impairment and its impact on
neural activity using functional magnetic resonance imaging (fMRI).
Methods: Sixty male Sprague Dawley rats were divided into four groups:
Sham, cecal ligation and puncture (CLP), CLP+MFGE8, and CLP+MFGE8+CGT
(Cilengitide). After CLP, CLP+MFGE8 rats received intracerebroventricular MFGE8
(3.3 µg), while CLP+MFGE8+CGT rats received intraperitoneal Cilengitide (10
mg/kg). We assessed cognitive function with the Morris water maze and open field
test over five days. Eight days post-surgery, rats underwent T2-weighted magnetic
resonance imaging (MRI) and resting state (rs)-fMRI scans. Brain tissues were collected for
western blot, hematoxylin-eosin (HE) staining, and immunofluorescence. Statistical analysis employed
one-way analysis of variance (ANOVA) followed by Tukey’s post-test for multiple
comparisons. Results: MFGE8 improved neurobehavioral performance in open
field task (OFT) and morris water maze (MWM) tests. fMRI indicated a significant
reduction in abnormal neural activity in the right hippocampal CA1, CA3, and
dentate gyrus of SAE rats following MFGE8 treatment. Voxel-based
morphometry (VBM) analysis revealed decreased high-signal areas in the
hippocampus, along with reduced hippocampal volume due to alleviated neural
edema. Western blot analysis demonstrated that MFGE8 enhanced ras-related C3
botulinum toxin substrate 1 (Rac1) and microtubule-associated protein 1A/1B-light
chain 3 (LC3) expression in the rat hippocampus, while CGT reduced these protein
levels. Behavioral experiments and fMRI results confirmed that CGT reversed the
cognitive effects of MFGE8 by inhibiting microglial
Keywords
- microglial efferocytosis
- sepsis associated encephalopathy
- regional spontaneous neuronal activity
- milk fat globule EGF factor 8 protein
- functional magnetic resonance imaging
Sepsis is a life-threatening response to infection characterized by organ dysfunction and was responsible for approximately 11.0 million deaths worldwide [1]. Sepsis-associated encephalopathy (SAE) is a severe complication of sepsis characterized by significant neuronal damage and cognitive impairment. According to Chung et al. [2], more than 50% of sepsis survivors experience severe and long-lasting cognitive deficits. Recent studies, including research by Mengmeng Cai [3], have suggested that impaired microglial efferocytosis and neuroinflammation in the hippocampus may serve as potential pathological mechanisms underlying SAE. Functional magnetic resonance imaging (fMRI) provides a noninvasive and objective method in evaluating brain function of patients with encephalopathy. However, there is limited research on the brain function of patients with SAE using fMRI. Understanding cognitive impairment through fMRI is essential for the treatment of SAE. In this study, we aim to use fMRI as a objective method to evaluate the brain function of sepsis rat models with encephalopathy.
Microglial efferocytosis, as reported by Kawabe and Hall-Roberts [4, 5], is believed to contribute to neuronal protection in neurodegenerative diseases through the phagocytosis of apoptotic brain cells. A recent study found that microglial cells engaged apoptotic cells (ACs) by binding bridge molecules that interact with phosphoryl serine on the AC surface, and then the AC was internalized and degraded by the microglial cell [6]. Microglia may play a similar role in SAE. Milk fat globule epidermal growth factor 8 (MFGE8) protein, secreted from microglia and astrocytes in the central nervous system, is a typical binding bridge molecule in efferocytosis [7]. MFGE8 plays a multifaceted role in modulating immune responses and promoting efferocytosis in microglial cells. It possesses anti-inflammatory properties by facilitating the clearance of apoptotic cells and debris, thereby dampening excessive inflammation. Previous studies have shown that MFGE8 expression decreased in the spleen and liver of cecal ligation and puncture (CLP) induced sepsis model. And the neural protective effect of MFGE8 in the central nervous system was confirmed in alcoholic encephalopathy [8, 9]. Given that systemic inflammation and neuroinflammation play critical roles in the pathogenesis of SAE, targeting MFGE8 may help mitigate the inflammatory response and protect against neuronal damage. Therefore, investigating the specific mechanism of MFGE8 in the rat model of SAE is of great research significance.
In terms of molecular mechanism, the signaling pathways that MFGE8 mediated the
microglial efferocytosis appear to involve migration and phagocytosis. Recent
studies show that phagocytosis in microglial cells is a ras-related C3 botulinum
toxin substrate 1 (Rac1) mediated process that utilizes an integrin
While behavioral tests like the open field task (OFT) and morris water maze (MWM) have been commonly used to assess cognitive function in SAE rats over the past decade [15], noninvasive and objective methods for evaluating brain function in SAE have been less frequently employed. fMRI provides a tool for immediately detecting the excitability of neurons and evaluating their function in brain regions [16], but research in the cognitive function of SAE patients utilizing fMRI has been limited. Amplitude of low-frequency fluctuations (ALFF) is a common way to measure regional spontaneous neuronal activity, which can be used to evaluate function in brain regions [17]. Therefore, we used a noninvasive method, resting state (rs)-fMRI with the ALFF, to assess the value of MFGE8 in promoting brain cognitive function in SAE rats in our study.
In this study, we administered MFGE8 and CGT to SAE rat models induced by CLP surgery. We used behavioral tests and rs-fMRI to assess cognitive impairment in the SAE rats. Additionally, we investigated microglial efferocytosis-related proteins, including Rac1, MFGE8, and LC3, using western blot analysis, and assessed pathological changes in the brains through immunofluorescence staining. The primary objective of this study was to examine the protective effect of MFGE8 in SAE rats and to explore the underlying mechanisms of its action. Our findings may offer new insights into the role and mechanism of MFGE8 in SAE.
All animal procedures were approved by the Institutional Animal Care and Use Committee of Nanjing Medical University (IACUC: 2103051) under animal use permit number SYXK(Su)2020-0022. A total of 60 adult male Sprague-Dawley rats (Jiangsu Laboratory Animal Center, Nanjing, Jiangsu, China), 8 weeks old and weighing 280–320 g, were housed under a 12/12 h light/dark cycle at 22–24 °C with 50%–60% humidity. They had unlimited access to standard rodent chow and water.
The comprehensive experimental design is outlined in Fig. 1. A total of 60
Sprague-Dawley (SD) rats (Jiangsu Laboratory Animal Center, Nanjing, Jiangsu, China; 8 weeks, 280–320 g) were divided into four groups: Sham operation group
(n = 15), CLP group (n = 15), CLP+MFGE8 group (n =
15), and CLP+MFGE8+CGT group (n = 15). Sepsis rat models were induced by
CLP surgery [18]. Extrinsic MFGE8 (LMAI Bio, Shanghai, China; ICA286Hu01, 3.3 µg)
was injected intracerebroventricularly (ICV) 24 h post CLP surgery [19], while 10
mg/kg CGT (MedChemExpress, Monmouth Junction, NJ, USA; HY-16141) was injected
intraperitoneally (IP) 1 h post-CLP surgery to the CLP+MFGE8+CGT group [20].
Behavioral experiments using MWM and OFT tests were performed 3 days after CLP.
The MWM test involved four consecutive days of training sessions, followed by a
probe test session on the seventh day (n = 8 per group). After
behavioral experiments, the animals underwent fMRI scans to detect brain changes
in structure and function on day 7 post-CLP surgery (n = 8 per group).
The rats were then euthanatized by deep isoflurane anesthesia. The hippocampus
was removed to determine the level of the inflammatory cytokines interleukin
(IL)-1
 Fig. 1.
Schematic illustration of the experimental design. All rats underwent either CLP or sham surgery. In the CLP+MFGE8+CGT group, CGT was administered via intraperitoneal injection (IP) 1 hour after CLP surgery, while MFGE8 was administered via ICV 24 hours post-CLP surgery. Cognitive function was assessed 3 days after CLP using open field task (OFT) and the 5-day Morris water maze (MWM) tests. T2 MRI scans and fMRI scans were conducted 7 days post-CLP, after which the animals were euthanatized for histological and biochemical assessments. CLP, cecal ligation and puncture; CGT, cilengitide; MFGE8, Milk fat globule EGF factor 8 protein; ICV, intracerebroventricular injection; IP, intraperitoneal injection; OFT, open field task; MWM, Morris water maze; fMRI, functional magnetic resonance imaging; MRI, magnetic resonance imaging; ELISA, Enzyme-linked immunosorbent assay.
The sepsis rat models were established by CLP surgery in male SD rats. After fasting for 6 h, rats were anesthetized with an intraperitoneal injection of 35 mg/kg pentobarbital sodium (Sigma, 11715, Darmstadt, Germany) following the protocol by Rittirsch et al. [21]. A 2 cm incision was made on the lower quadrant of the abdominal wall under aseptic conditions. The mesentery and cecum were then dissociated. The mesentery and cecum were exposed, and the cecum was ligated 3 cm distal to the ileocecal valve using 4-0 non-absorbable suture. Perforation was induced by puncturing the cecum twice with a 22-gauge needle, leading to the extrusion of a small amount of feces. Immediately after the CLP surgery, rats were subcutaneously injected with saline solution (5 mL/100 g) for fluid resuscitation. Rats were then allowed free access to food and water post-surgery. In the sham group, all surgical procedures were performed except for cecum ligation and perforation. After successfully establishing the sepsis model, a total of 20 rats experienced acute respiratory failure or renal failure and died post CLP surgery. No antibiotics were administered to the experimental rats at any time during the study. The survival rate was monitored every 24 hours for 7 days, and a survival curve was constructed.
Magnetic resonance imaging (MRI) scans were performed in a 7-Tesla horizontal
bore magnet (Bruker Biospec 7 T/20 USR; Bruker, Karlsruhe, Germany). Using a rat
head volume coil, we acquired blood oxygen level-dependent (BOLD) fMRI responses
[17]. Eight rats in each group were included in imaging examinations. Fast
spin-echo T2 weighted MRI was obtained to visualize the structure of the rats’
brains. The rats were anesthetized by 2% isoflurane (792632, Sigma, Shanghai, China), and then the head was fixed
in a capsule with a tooth-bar to limit movement. Inhaling 2% isoflurane and 2
L/min oxygen, the rats breathed at a rate of 60 times per minute. Fast spin-echo
T2-weighted MRI was obtained with the following parameters: slice = 25,
repetition time (TR) = 3000 ms, echo time (TE) = 11 ms, scan time = 4 min 48 s,
Flip angle = 90°, SI = 1.00/1.00 mm, field of view (FOV) = 3.17/2.50 cm,
Matrix = 256. The scan parameters of BOLD were slice = 18, TR = 2000 ms, TE = 25
ms, scan time = 5 min 0 s, Flip angle = 90°, slice thickness = 1 mm, FOV
= 2.88/1.8 cm, Matrix = 128. We used SPM8 (https://www.fil.ion.ucl.ac.uk/spm/)
and DPABI (http://rfmri.org/dpabi) for pre-processing, including slice timing,
correction, realignment, motion correction, co-registration of T2 images to a rat
brain atlas and spatial normalization of functional data. Images in which the
head moved by more than 0.2 mm and 2 degrees were excluded. After the images were
smoothed with a Gaussian kernel of 0.4 mm
The total hippocampus is composed of the following subfields: cornu ammonis (CA1, CA2, and CA3), dentate gyrus (DG) and the subiculum, which was based on T2-MRI scan. The segmentation of total hippocampus and its subfields was implemented using voxel-based morphometry (VBM) with statistical parametric mapping (SPM) 12 (https://www.fil.ion.ucl.ac.uk/spm/). The relevant hippocampal areas were determined according to the functional Waxholm space atlas of the rat brain. Hippocampal volume was calculated and analyzed by MATLAB 2013b (MathWorks Inc., Torrance, CA, USA) and SPSS 22.0 (IBM, Armonk, NY, USA).
Motor function and anxiety were assessed by OFT. The open field apparatus was a
black square (100
For the MWM, cognitive functions related to spatial learning and memory were evaluated according to the methods of Wang [22]. The apparatus consisted of a circular pool (diameter 180 cm; height 45 cm) filled with opaque water (22–24 °C) and a submerged platform (diameter 4 cm, smooth-faced) located at a fixed position in the target quadrant. The pool was divided into four quadrants, and the tests were recorded by a camera above the pool and analyzed using the ANY-maze Video Tracking System. The MWM test comprised navigation and probe tests. Navigation tests were conducted from the third to sixth day post-CLP, with each rat trained four times from every quadrant each day to find the hidden platform. On the seventh day, the platform was removed for the probe test, during which the time spent in the target quadrant and the number of times crossing the platform location were recorded.
The rats were injected intraperitoneally with pentobarbital sodium (11715, Sigma, Shanghai, China) 50 mg/kg on day 8 post-CLP surgery, and the brain tissues were fixed, cut into slices, dehydrated, cleared, and embedded in paraffin. Sections were then subjected to immunohistochemistry with primary antibodies against ionized calcium-binding adapter molecule 1 (Iba-1) (1:100; Abcam, ab178846, Cambridge, UK), and then incubated with goat anti-rabbit goat anti-rabbit immunoglobulin G heavy and light chains (IgG H&L) (Cy3, 1:100, Abcam, ab6939, Cambridge, UK) and secondary antibodies. Images were captured and analyzed using a fluorescence microscope and ImageJ software (ImageJ 1.0, NIH, Bethesda, MD, USA).
ELISA was performed to determine the levels
of IL-1
The hippocampus on both sides was lysed and immediately homogenized in radio immunoprecipitation assay (RIPA) lysis buffer containing phenylmethylsulfonyl fluoride (n = 5). After protein concentration was assayed with a bicinchoninic acid (BCA) kit (Solarbio, Beijing, China), total protein samples were separated by 12% sodium dodecyl sulfate-polyacrylamide gel electrophoresis and transferred to polyvinylidene difluoride filters. Membranes were incubated overnight at 4 °C with anti-rat monoclonal antibodies raised against MFGE8 (1:2000, Abcam, ab200649, Cambridge, UK), Rac1 (1:2000, Abcam, ab155938) and LC3 (1:2000, Abcam, 192890). On the second day, the membranes were washed three times using phosphate buffer saline (PBS) with 0.1% Tween-20, then reacted with horseradish peroxidase-conjugated rabbit anti-rat IgG (H+L) (1:5000, Abcam, ab6734) for 2 h at 22–25 °C. The integral optical density of each band was measured using ImageJ software.
Data are presented as means
CLP surgery induced rat deaths from sepsis with serious systemic inflammatory response and multiple organ failure. Totally 20 rats suffered acute organs failure and died post CLP surgery. The post-CLP 7-day survival rates indicated the severity of sepsis in the different groups, which were 100% in the sham group, 50.79% in the CLP group, 63.03% in the CLP+MFGE8 group, and 38.96% in the CLP+MFGE8+CGT group (Fig. 2A). We ensured that each group will get at least 8 rats during 7 day post CLP surgery.
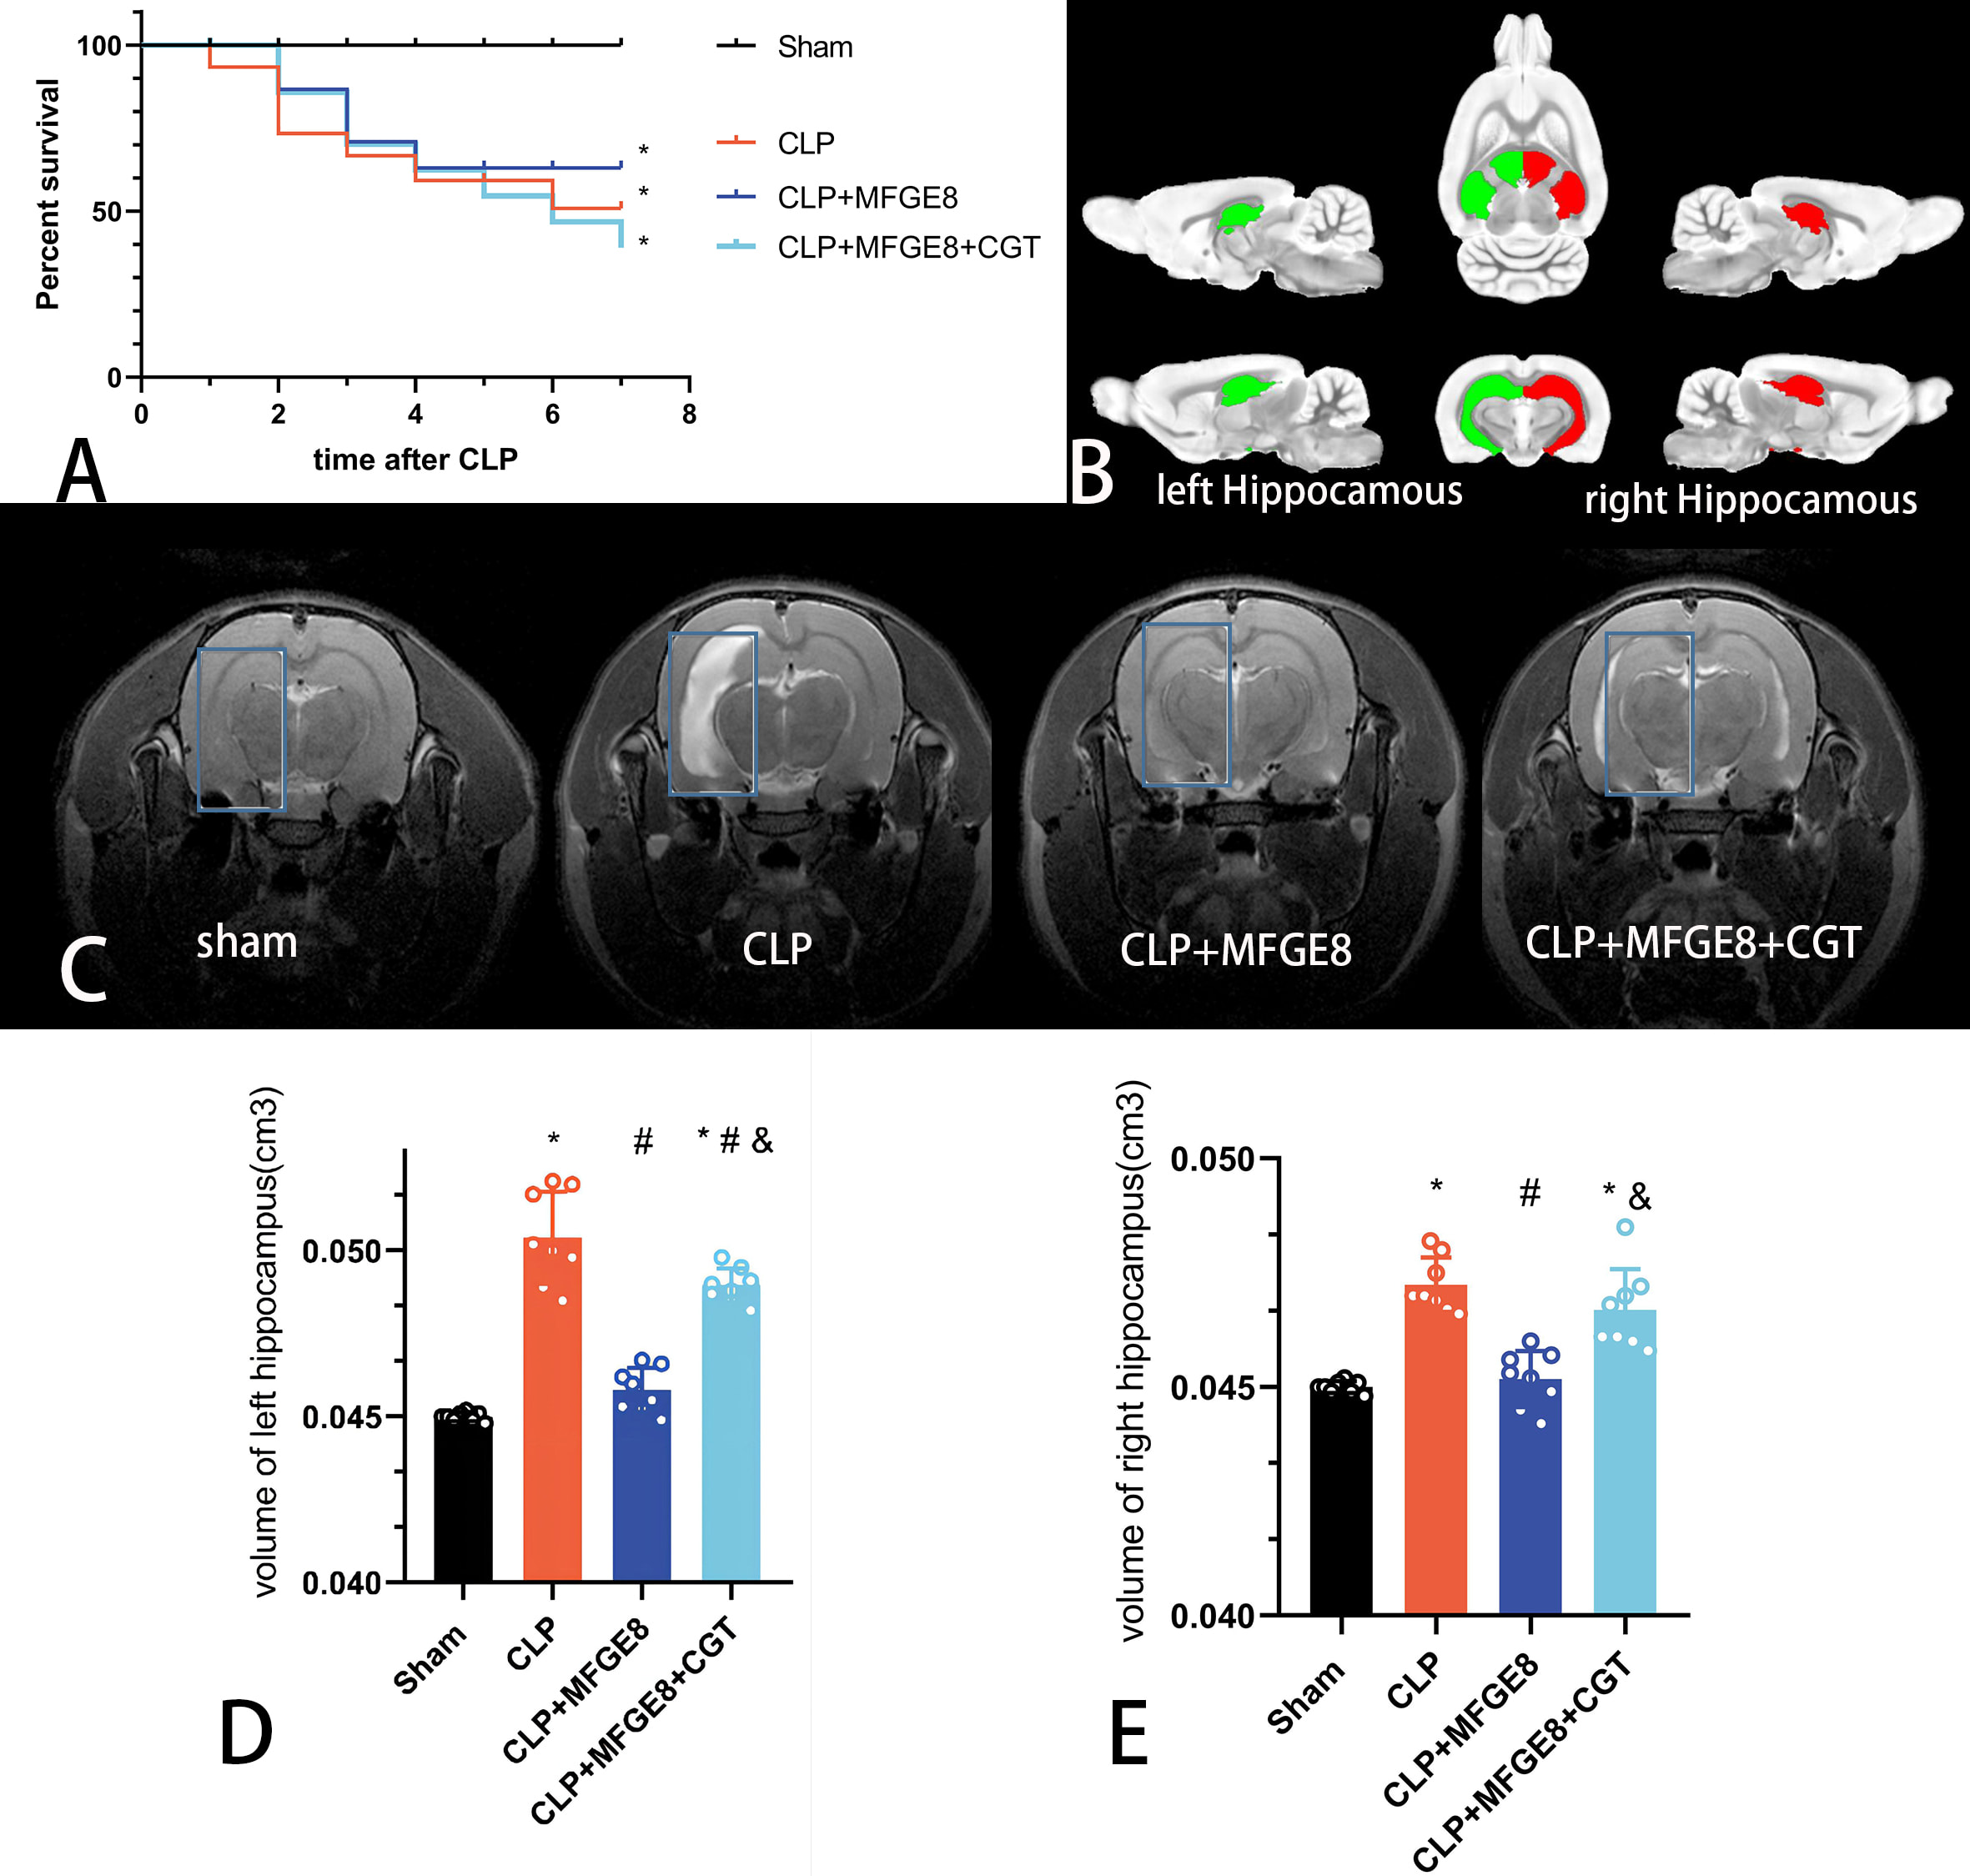 Fig. 2.
T2-MRI tracking of structural damage in the hippocampus of rats
from the four groups. (A) Survival rates after CLP surgery. The 7-day survival
proportions in the sham group, CLP group, CLP+MFGE8 group and CLP+MFGE8+CGT group
were 100%, 50.79%, 63.03% and 38.96%, respectively. (B) The bilateral
hippocampal areas were extracted according to the functional Waxholm space atlas
of the rat brain. (C) T2-MRI scans showed a regional signal increased
significantly in the hippocampus of rats after CLP surgery. However, this
abnormal signal was reduced in the CLP+MFGE8 group. In the CLP+MFGE8+CGT group,
the hyperintense focus in the region of the hippocampus, and the extent of
damaged areas was milder than in the CLP group. (D) Volume of the left
hippocampus (F [3,28] = 78, ANOVA, n = 8). (E) Volume of the right
hippocampus (F [3,28] = 25, ANOVA, n = 8). *p
T2-MRI detected structural changes in rat brains after CLP surgery. We extracted bilateral hippocampal areas based on the Waxholm space atlas of the rat brain, and compared the volume of hippocampus in the four groups (Fig. 2B). Compared with the sham group, signals in the hippocampus and external capsule were increased in the CLP group (Fig. 2C). The hyperintense focus in the region of the hippocampus indicated the brain cells were experiencing edema post-CLP surgery. In the CLP+MFGE8 group, the hyperintense region was significantly decreased in the hippocampus. The volumes of the bilateral hippocampus were decreased in the CLP+MFGE8 group compared with CLP group, suggesting that treatment with MFGE8 could reduce brain damage in the SAE rats (Fig. 2D,E). The serious damage to the hippocampus was observed in the CLP+MFGE8+CGT group. CGT inhibited the therapeutic function of MFGE8, and increased the high signal regions in the left hippocampus (Fig. 2D).
The REST software was used to analyze the ALFF with BOLD signals among the four
groups using one-way ANOVA analysis. The results indicated that the significant
difference among the four groups was only in the molecular layer of right
cerebellum (montreal neurological institute (MNI) coordinates: x = –1, y =
–86.05, z = 21.2; Voxel size 10 voxel, voxel significance p = 0.005).
There were no significant findings in the cerebral cortex. Therefore, a
two-sample t test was used to compare each two groups. The results
revealed that, in comparison to the sham group, the ALFF value increased in the
left hypothalamic region (HR) and right cornu ammonis 3 (CA3) of the hippocampus
in rats from the CLP group (p
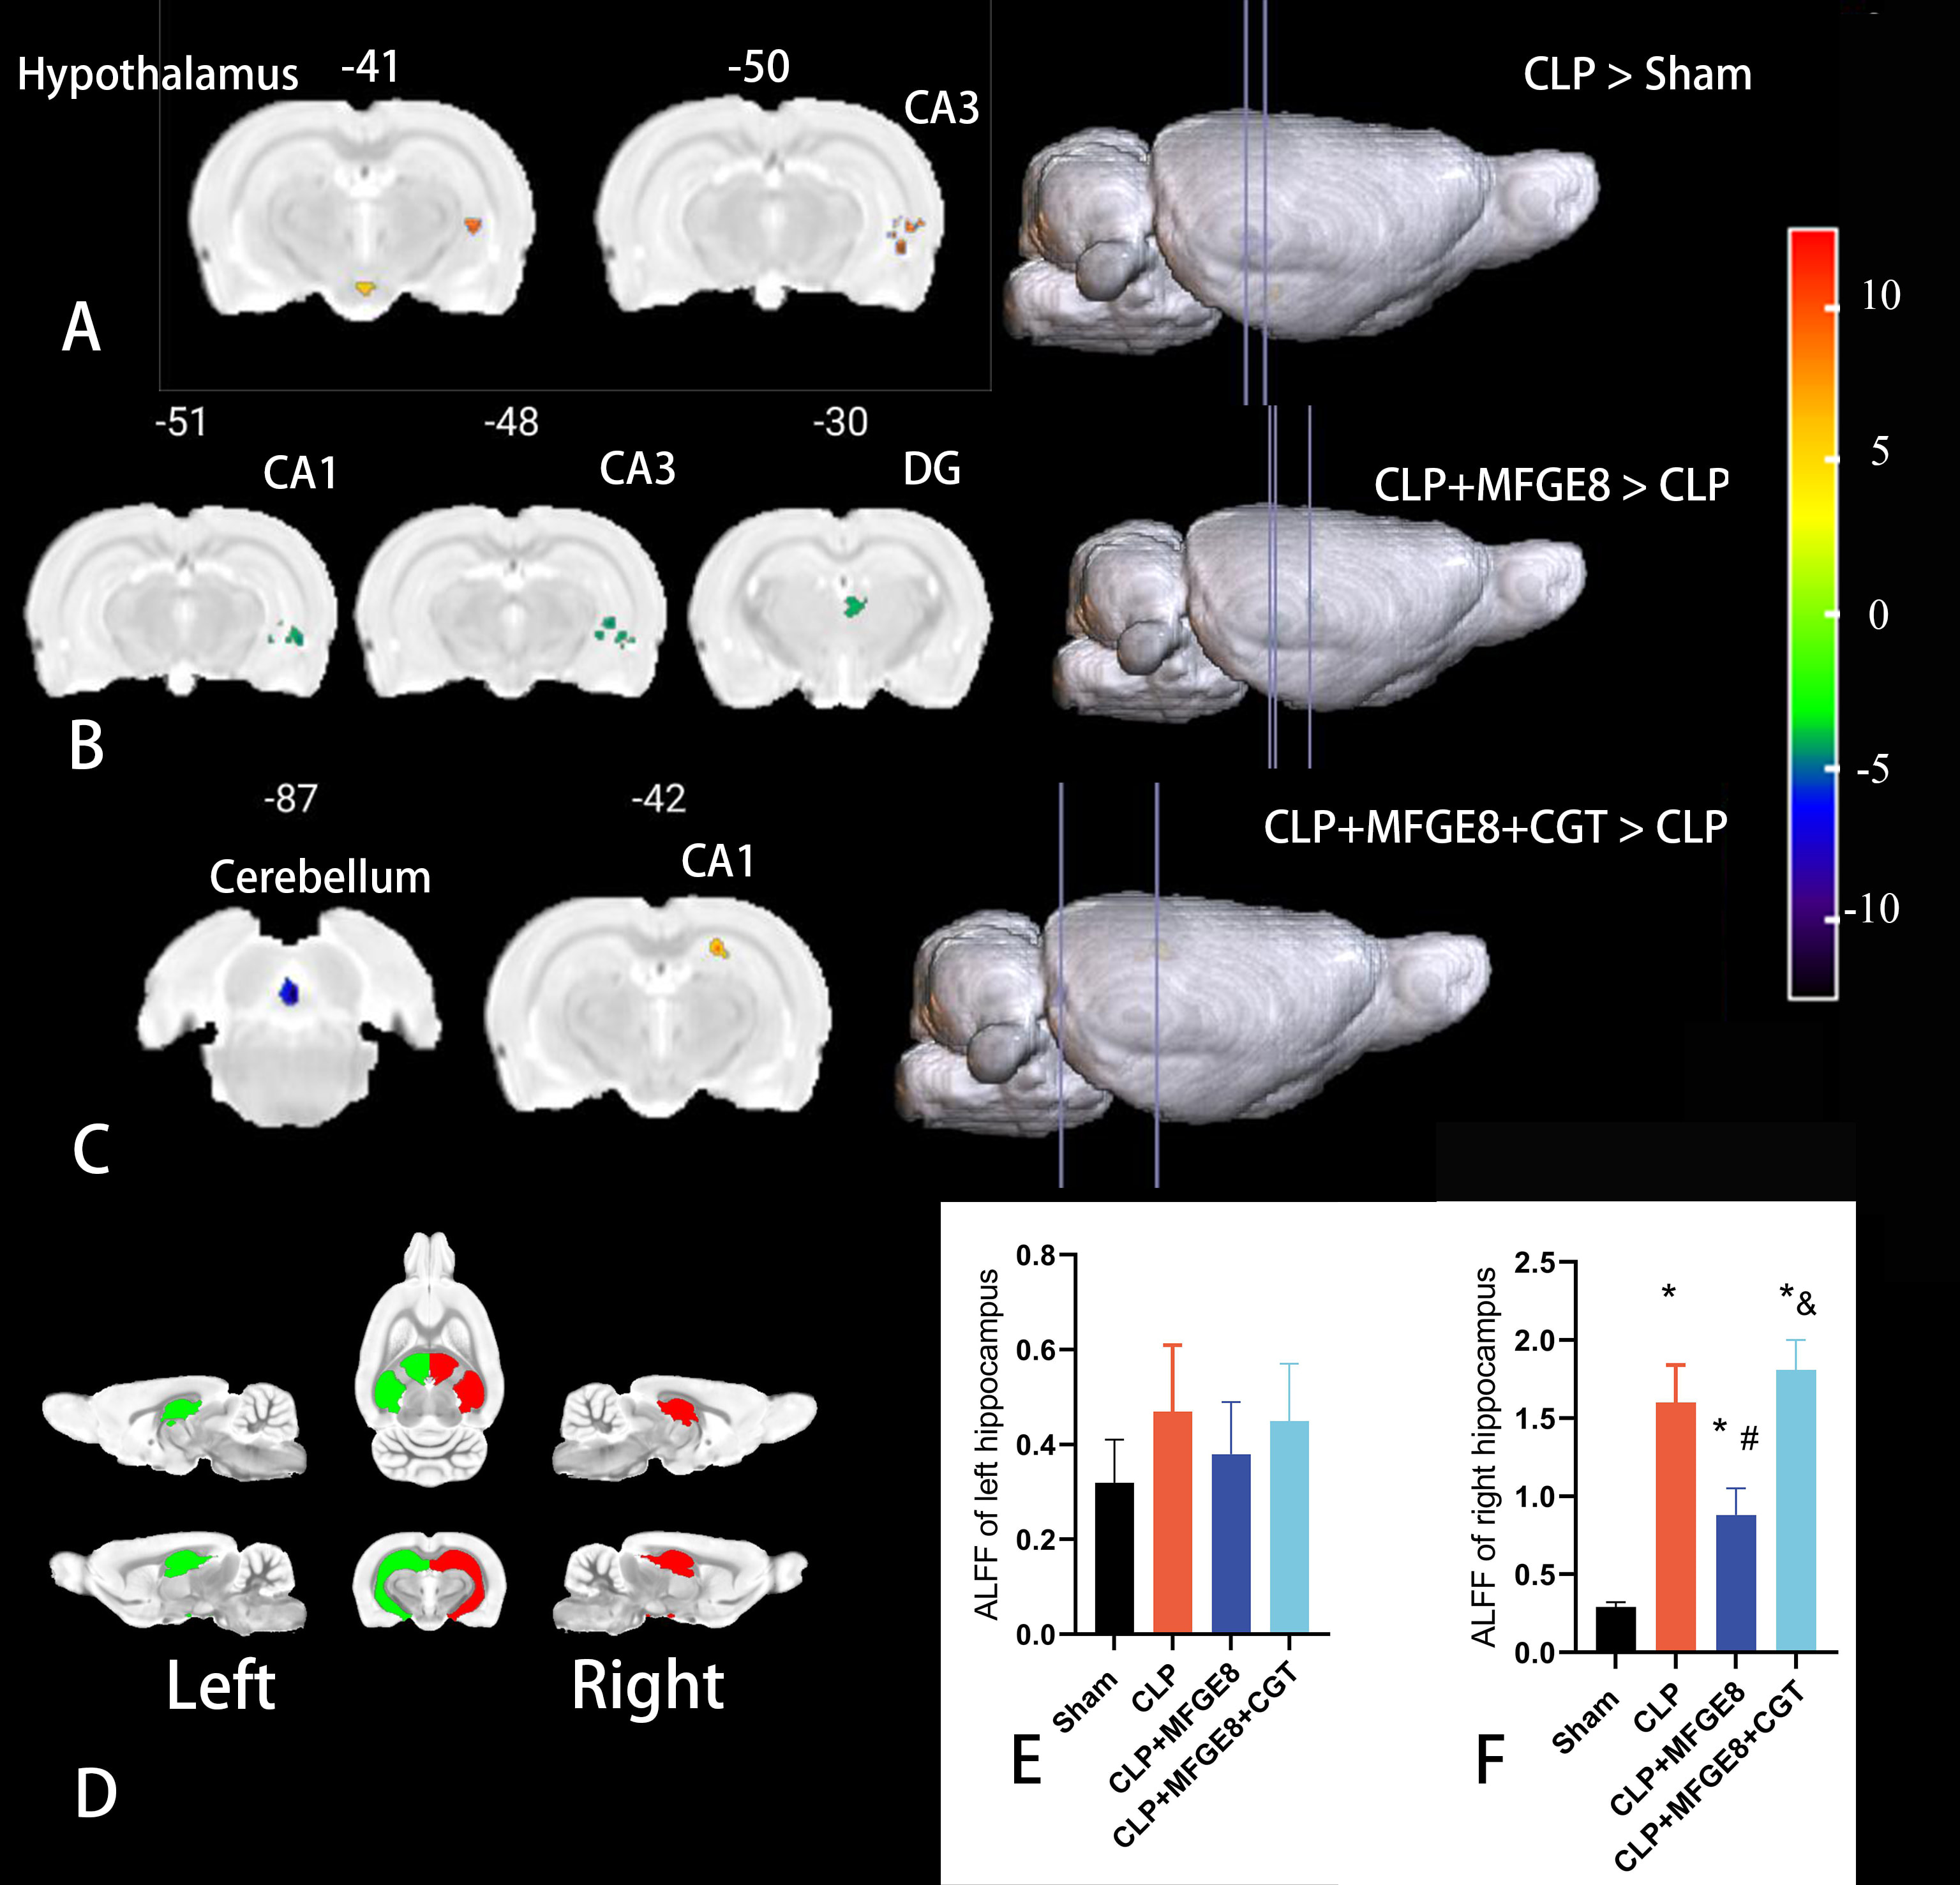 Fig. 3.
fMRI detected brain functional changes in the four groups. (A)
Compared with the sham group, the ALFF values increased in the left hypothalamic
region and right CA3 of the hippocampus (yellow areas) in the CLP group
(p
| Compared groups | Location Cluster (AAL) | MNI coordinates | Number of voxels | Peak F | ||
| x | y | z | ||||
| CLP |
Left Hypothalamic Region | –1.00 | –41.10 | –17.80 | 12.00 | 7.50 |
| Right Cornu Ammonis 3 | 61.00 | –50.10 | 0.20 | 24.00 | 18.00 | |
| CLP+MFGE8 |
Right Cornu Ammonis 1 | 52.00 | –47.05 | 9.20 | 13.00 | –14.20 |
| Right Cornu Ammonis 3 | 61.00 | –50.05 | 0.20 | 12.00 | –15.49 | |
| Right Dentate Gyrus | 10.00 | –29.05 | 18.20 | 29.10 | –8.18 | |
| CLP+MFGE8+CGT |
Left Molecular Layer of the Cerebellum | –1.00 | –86.05 | 24.20 | 13.00 | –14.10 |
| Right Cornu Ammonis 1 | 28.00 | –41.05 | 45.20 | 18.00 | 10.60 | |
The brain coordinates are from the Montreal Neurological Institute (MNI) space.
The voxel level threshold was set at p
In this study, the average ALFF value in the bilateral hippocampal region of
rats among the four groups was extracted for further analysis (Fig. 3D). The
results indicated that there was no significant difference in the functional
activities in the left hippocampus among four groups (Fig. 3E, p
| Brain regions | Sham | CLP | CLP+MFGE8 | CLP+MFGE8+CGT | ||||
| mean | std | mean | std | mean | std | mean | std | |
| Left hippocampus | 0.32 | 0.09 | 0.47 | 0.14 | 0.38 | 0.11 | 0.45 | 0.12 |
| Right hippocampus | 0.29 | 0.03 | 1.61* | 0.24 | 0.88*# | 0.17 | 1.81*& | 0.19 |
*p
To test the motor function and anxiety level of rats in the four groups, we
recorded the total running distance and duration of time spent in the central
area by OFT (Fig. 4A). To evaluate cognitive dysfunction among rats in the four
groups, we tested the rats by MWM (Fig. 4B). The results showed no significant
difference in the total running distance among the four groups (Fig. 4C;
p
 Fig. 4.
MFGE8 improved the performance of neurobehavioral tests in SAE
rats. (A) The tracks of rats in OFT test among four groups. (B) The tracks of
rats in probe tests of MWM. (C) The total distance rats traveled in 10 min of OFT
test (F [3,28] = 1.122, p
We examined the expression of IL-1
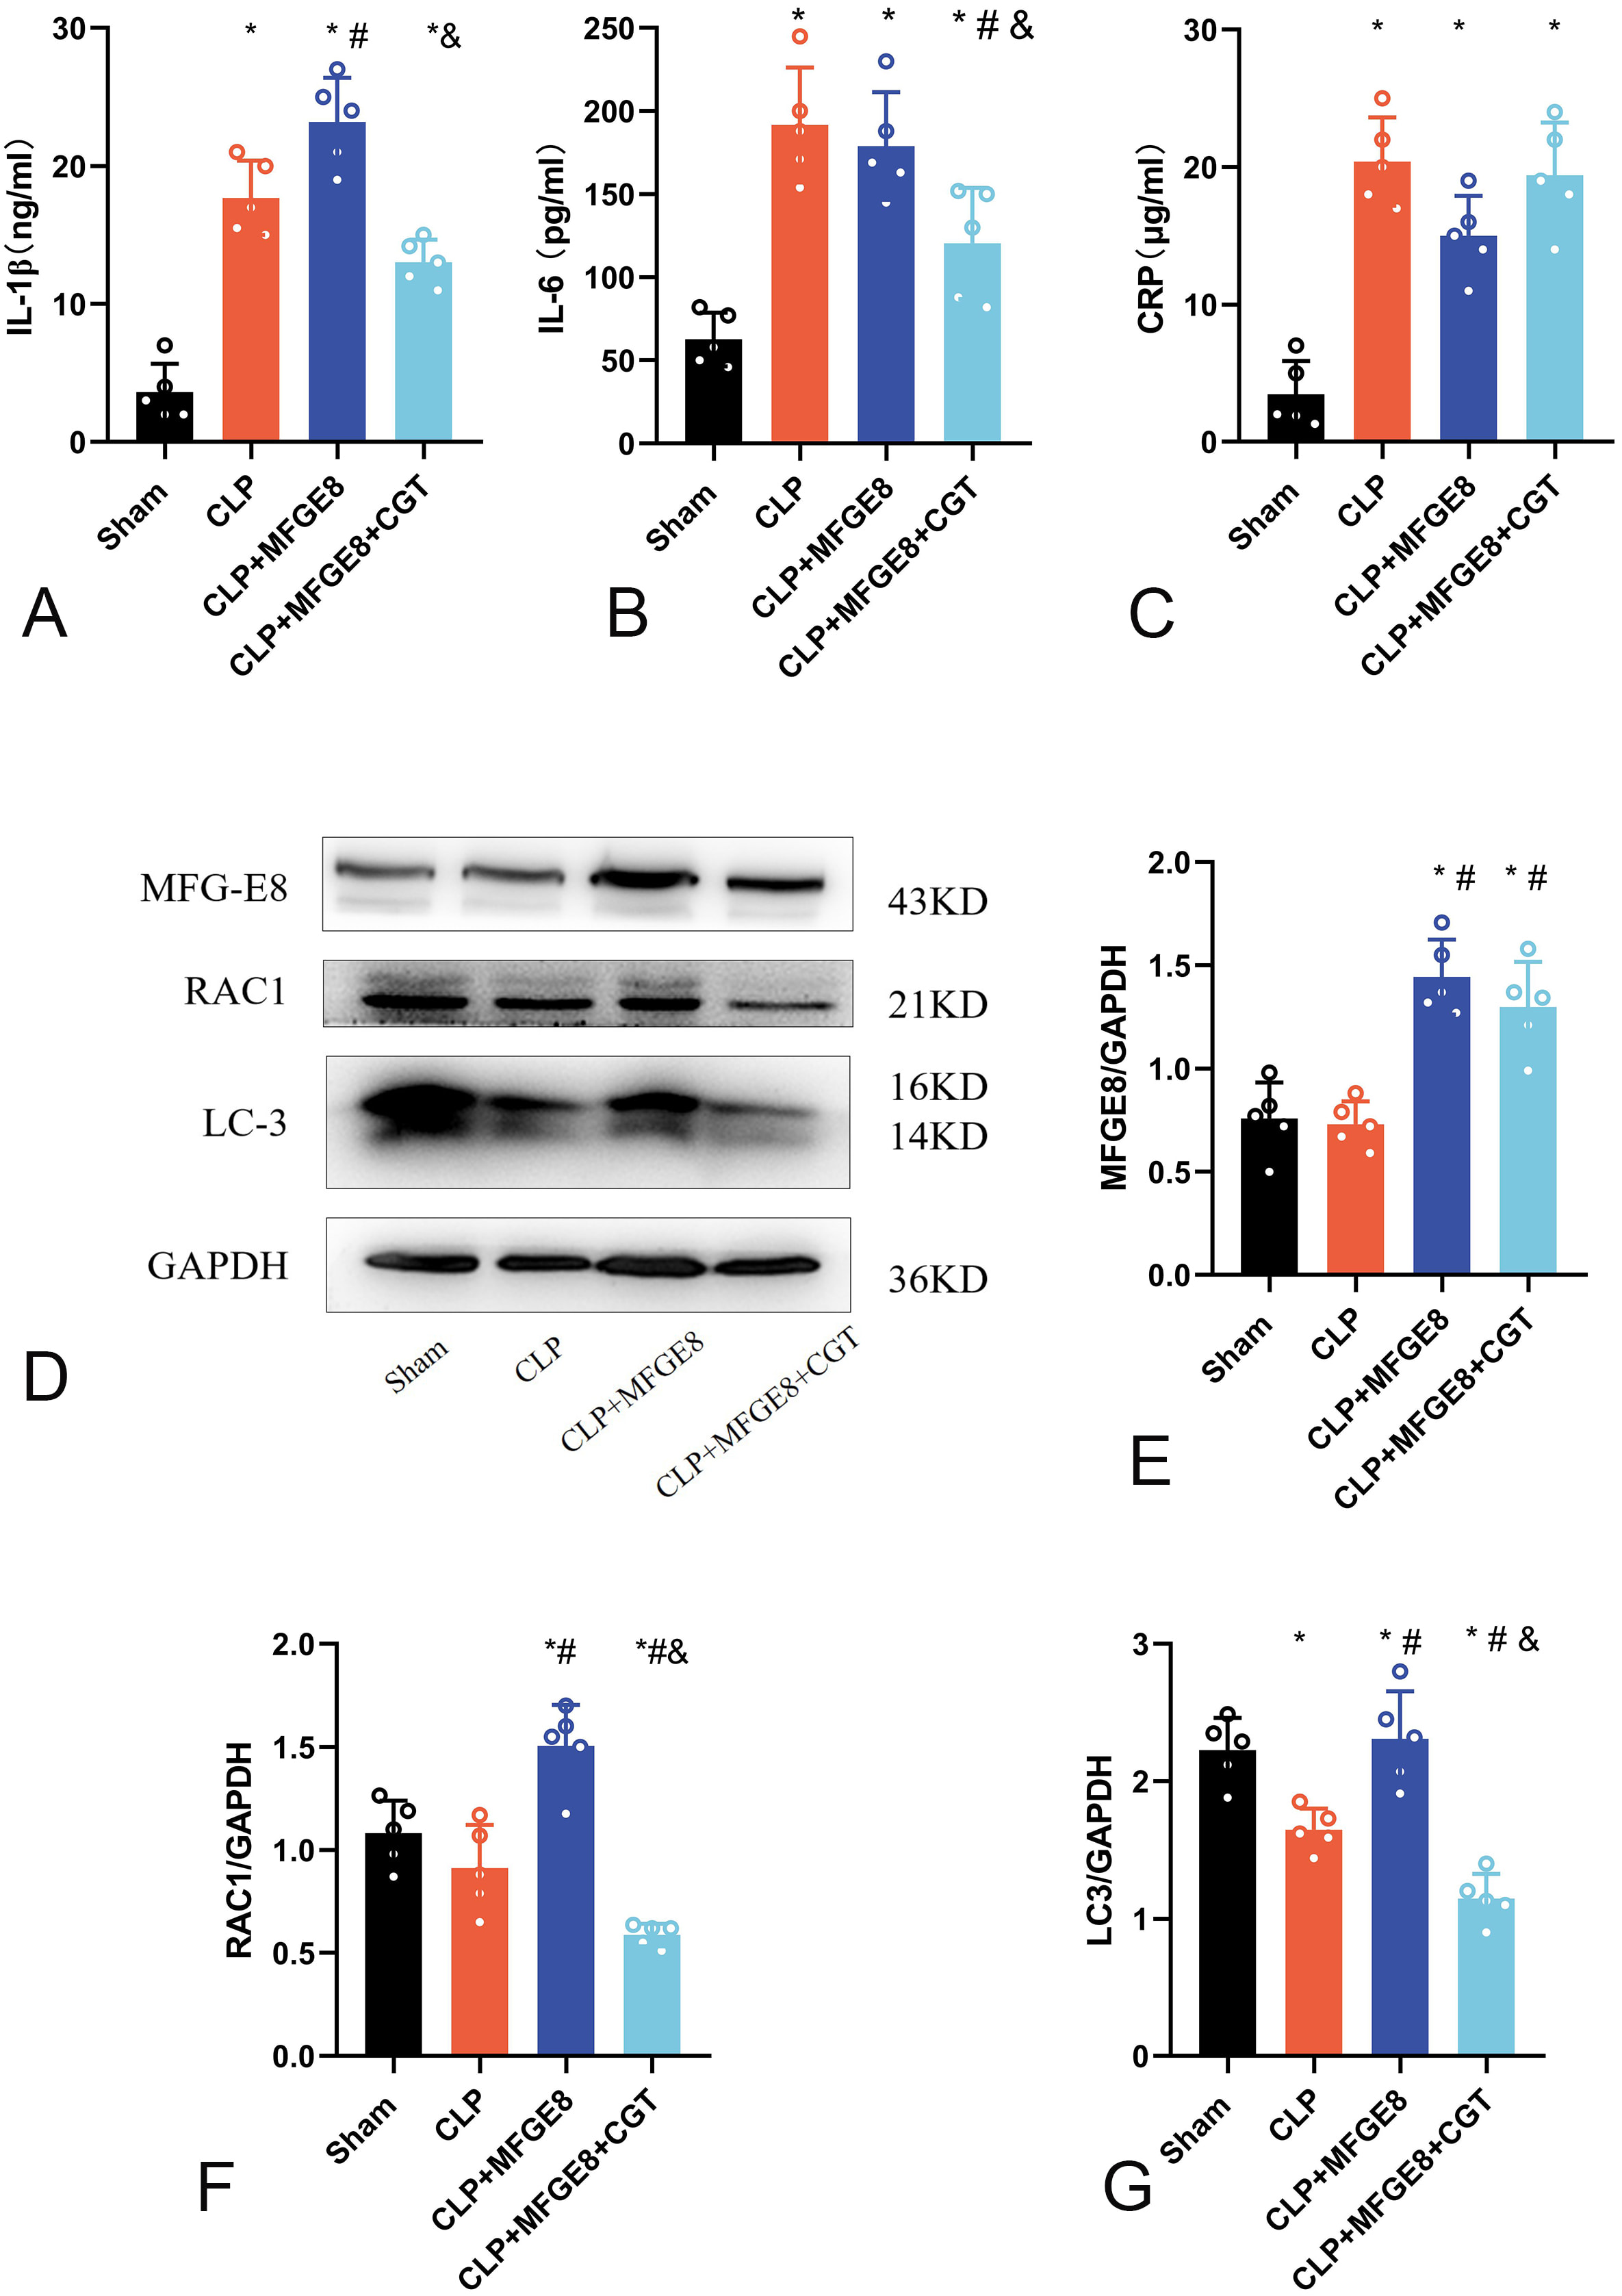 Fig. 5.
Inflammatory factors and efferocytosis-related proteins in rat
hippocampus. (A) Expression of IL-1
We examined the expression of efferocytosis-related proteins in the hippocampus
of the four groups (Fig. 5D, n = 5) on day 8 post-CLP using western
blot. The concentration of MFGE8 in the CLP+MFGE8 and CLP+MFGE8+CGT groups was
increased (Fig. 5E; p
To investigate effect of MFGE8 on microglial efferocytosis in the hippocampus, we performed immunofluorescence staining of hippocampal sections (Fig. 6A). The results indicated that CLP surgery significantly increased Iba-1 expression in the hippocampal region. However, treatment with MFGE8 dramatically promote the expression of Iba-1 in microglial cells compared with CLP-treated rats (Fig. 6B). Additionally, there were significantly more Iba1-positive cells in the hippocampus of rats in the CLP+MFGE8 group. In contrast, the Iba-1 level in the hippocampus was significantly decreased in the CLP+MFGE8+CGT group, and CGT also reduced the density of microglial cell in the hippocampal region (Fig. 6C).
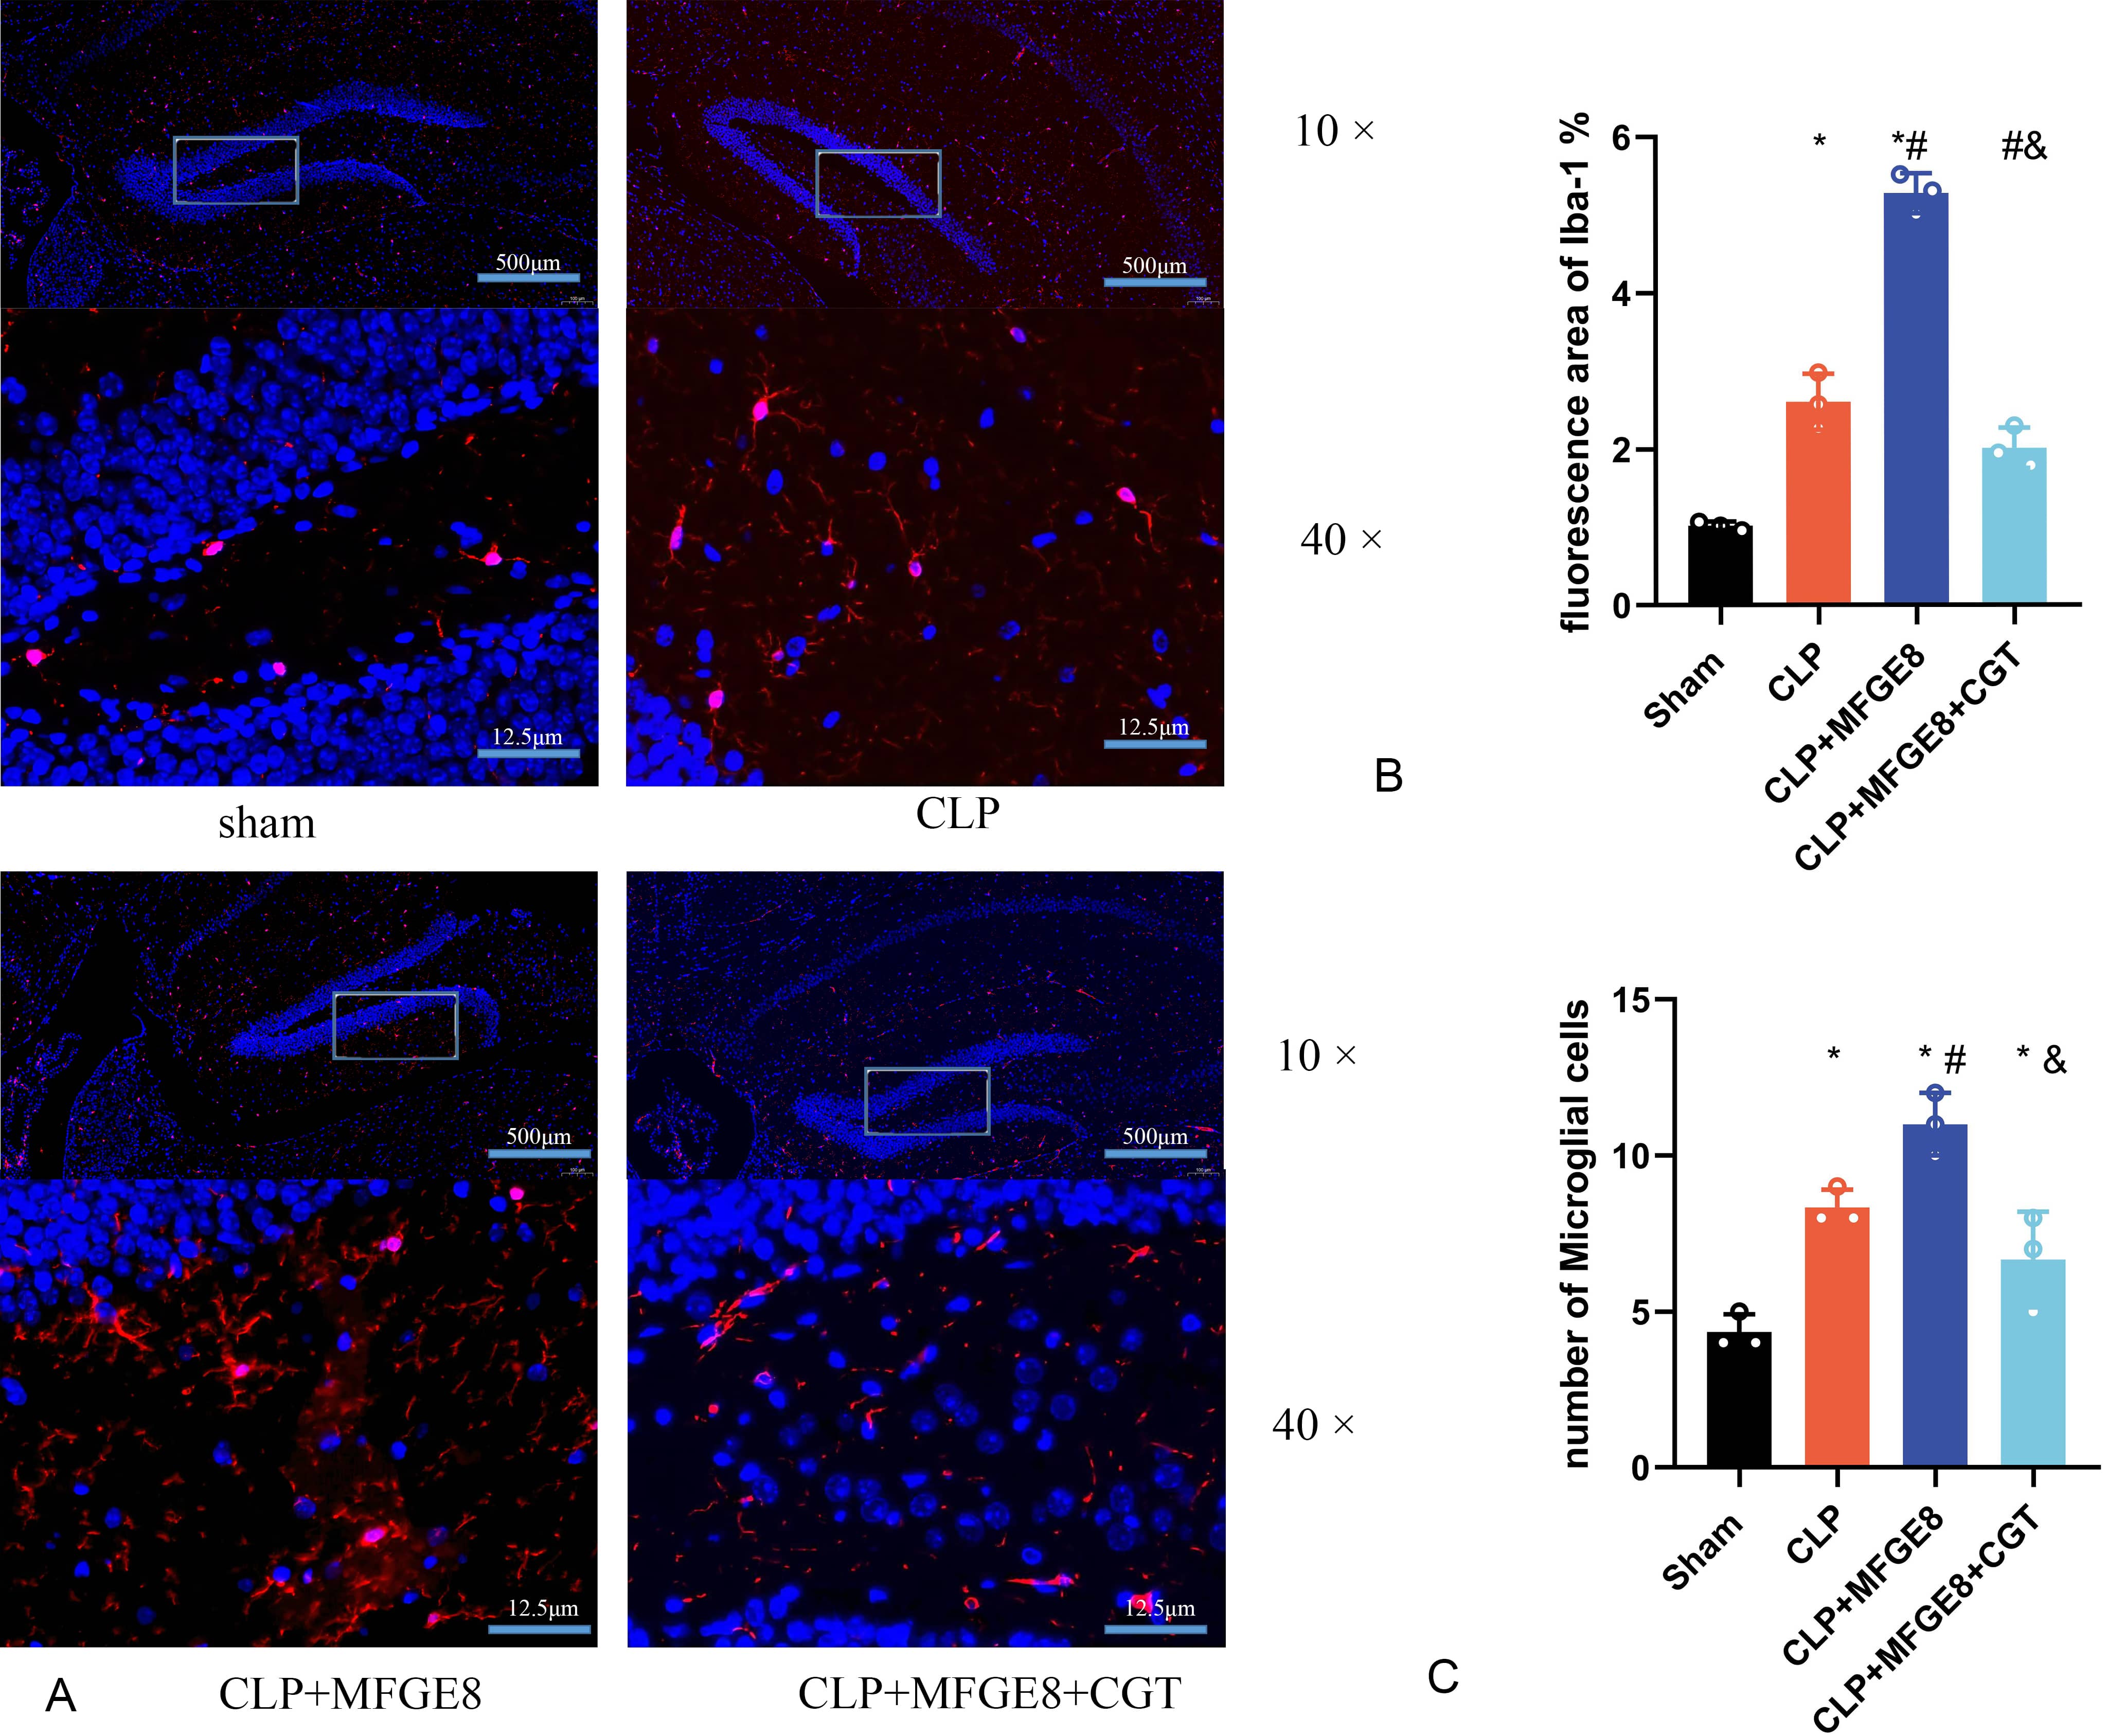 Fig. 6.
MFGE8 treatment activated microglial aggregation in the
hippocampus. Hippocampal sections were stained with Iba-1 as the microglial
marker (red), with nuclear staining by DAPI (blue). (A) Hippocampal sections
stained with Iba-1 were visualized by immunofluorescence to localize and assess
microglial activation. (B) The increase in Iba-1-stained areas induced by MFGE8
was reduced after CGT treatment. (C) The number of activated microglia was
increased in CLP+MFGE8 group. The number of activated microglia was reduced by
CGT treatment. *p
In this study, we investigated potential of MFGE8 in mitigating cognitive
impairment in rat models with SAE. Our investigation utilized fMRI to examine the
effects of MFGE8 on cognitive function. We found that MFGE8 enhanced microglial
efferocytosis in the hippocampus of SAE rats, leading to improvements in
behavioral performance. Notably, fMRI revealed significant decreases in
spontaneous neuronal activity in the right CA1, CA3 and DG of the hippocampus
following MFGE8 administration. Furthermore, MFGE8 exhibited anti-inflammatory
effects in the hippocampus and upregulated the expression of
efferocytosis-related proteins, including Rac1 and LC3. Notably, the protective
effects of MFGE8 were found to be mediated by the activation of
To induce sepsis-associated encephalopathy, we performed CLP surgery in our rat models, resulting in a persistent cognitive functional deficit that persisted for two weeks post-surgery [23]. In this study, we used MWM tests to assess the cognitive function of rats undergoing CLP surgery. Consistent with a previous study [24], the CLP group displayed clear deficiencies in learning and memory on the navigation test of the MWM, with increased latency and decreased time spent in the target quadrant, as well as decreased number of target area crossings. We also used the OFT to evaluate the motor ability and anxiety level of SAE rats. We found that there was no significant difference in the total running distance among the four groups, but the duration of time spent in the central area by the CLP group was less than that of the sham group. These results indicated that CLP had little impact on the motor function of SAE rats, but increased anxiety in SAE rats as described in previous studies [25].
Structural and functional changes in the brain were examined using MRI. We observed significant increases in hippocampal signals and left hippocampal volume in the CLP group, consistent with previous studies indicating cell swelling in early SAE stages [26]. Subsequent rs-fMRI analyses revealed altered regional spontaneous neuronal activity in the hippocampus, with increases in the right hypothalamic region and right CA3 in the CLP group. These changes in neuronal activity were associated with impaired cognitive function [27].
We utilized rs-fMRI with ALFF analysis to evaluate the excitability of
hippocampal neurons in rats that underwent MFGE8 administration. MFGE8
significantly decreased neuronal excitability in the hippocampus, as reflected by
decreased ALFF value in the right CA1, CA3, and DG. Furthermore, decreases in
ALFF indicate lower spontaneous fluctuations in local brain regions [28]. These
results indicated that MFGE8 reversed the heightened activity of hippocampal
neurons observed in the CLP group. Interestingly, the protective effects of MFGE8
were compromised in the presence of CGT, a blocker of
Neuroinflammation and accumulation of apoptotic neurons are thought to play a sustaining pathogenic role in SAE [29]. In particular, microglial cells participate in the process of generating inflammatory factors and eliminating ACs in SAE rats [30]. Therefore, regulating the phagocytosis of microglial cells may hold promise as a therapeutic approach for early SAE management [31]. MFGE8, a typical bridging molecule, regulates microglial cell cytophagy and is secreted from microglia and astrocytes in the central nervous system [32].
Prior studies have indicated a decrease in MFGE8 expression in the spleen and
liver of CLP-induced sepsis models [8]. However, in our results, the difference
in MFGE8 expression between the CLP group and the sham group in the hippocampus
was not significant. This variation in MFGE8 expression may be attributed to a
weaker inflammatory response in the brain compared to the spleen and liver.
Several researchers have confirmed the anti-apoptotic effect of MFGE8 in central
nervous system diseases, such as alcoholic encephalopathy and subarachnoid
hemorrhage [9]. Nevertheless, the therapeutic effect of MFGE8 in activating
microglia in SAE has not been previously established. In our present study, we
confirmed that the administration of exogenous MFGE8 enhanced microglial
efferocytosis in the hippocampus of SAE rats. After the ICV of MFGE8, the levels
of IL-1
The mechanisms underlying the stimulation of microglial efferocytosis in the
hippocampus of SAE rats by MFGE8 remain unknown. Previous studies reported that
MFGE8 attaches to the
In our study, CGT was employed to block the
There are some limitations to our study. First, we chose the CLP induced SAE rat model to mimic human SAE in rodents. This animal model better simulates sepsis caused by abdominal injury or surgery. Compared to the SAE model induced by intraperitoneal injection of lipopolysaccharide (LPS), animals in the CLP surgery group experience persistent inflammatory responses. We believe that the CLP surgery model more closely mimics the clinical characteristics of SAE. However, this CLP surgical method is more difficult to control for homogenization of individual inflammatory responses. Second, we administered only 3.3 µg of extrinsic MFGE8 in the brains of SAE rats, following the methodology of Liu et al. [19]. However, the effect of MFGE8 should be evaluated at different doses and routes of administration in further studies. Second, this study evaluated pathological changes and protein changes in the hippocampus. Given that brain function requires coordination among multiple brain regions, including the prefrontal cortex and hypothalamic region, other brain regions should be included in future studies.
In summary, our study demonstrated that MFGE8 promotes efferocytosis by
activating
ALFF, amplitude of low frequency fluctuations; CGT, clengitide; CLP, cecal ligation and puncture; ELISA, enzyme-linked immunosorbent assay; fMRI, functional magnetic resonance imaging; MFGE8, milk fat globule-EGF factor 8; MNI, Montreal neurological Institute; MWM, Morris water maze; SAE, sepsis associated encephalopathy.
The datasets used and/or analyzed during the current study are available from the corresponding author on reasonable request.
HJL and HB designed the research study. HSL, LS, DC and BH performed the research. DC, YF and BH provided help and advice on this research. MY, YF, XG and SS analyzed the data. HJL, HSL, LS wrote the manuscript. All authors contributed to editorial changes in the manuscript. All authors read and approved the final manuscript. All authors have participated sufficiently in the work and agreed to be accountable for all aspects of the work.
The animal study protocol was approved by the Institutional Animal Care and Use Committee of Nanjing Medical University (IACUC: 2103051) under animal use permit number SYXK(Su)2020-0022.
We thank Dandan Liang for her help with the MRI scan and Jing Xiao for his critical comments on the manuscript.
This research was funded by the National Natural Science Foundation of China, grant numbers 81971872 and Qi mingxing Foundation of Affiliated Hospital of Jiaxing University, grant number 2023-QMX-002.
The authors declare no conflict of interest.
References
Publisher’s Note: IMR Press stays neutral with regard to jurisdictional claims in published maps and institutional affiliations.