
 , Cailing Shi 2, Dingcai Rao 1, Wenjun Yue 1,*
1 Department of Radiology, Affiliated Hospital of North Sichuan Medical College, 637000 Nanchong, Sichuan, China
2 Department of Radiology, Qionglai Medical Centre Hospital, 611530 Chengdu, Sichuan, China
Abstract
The relationship between subregion atrophy in the entire temporal lobe and subcortical nuclei and cognitive decline at various stages of Alzheimer’s disease (AD) is unclear.
We selected 711 participants from the AD Neuroimaging Initiative (ADNI) database, which included 195 cases of cognitively normal (CN), 271 cases of early Mild cognitive impairment (MCI) (EMCI), 132 cases of late MCI (LMCI), and 113 cases of AD. we looked at how subregion atrophy in the temporal lobe and subcortical nuclei correlated with cognition at different stages of AD. The volume of the subregions was measured from the human Brainnetome atlas (BNA-246) using voxel-based morphometry and discriminant and correlation analyses were performed.
Only the left premotor thalamus demonstrated significant shrinkage in individuals with EMCI (p = 0.012). Discriminant analysis revealed that the left rostral Brodmann area 20 has the highest discriminatory ability among all temporal subregions to distinguish patients with AD from CN. While the left caudal hippocampus can efficiently distinguish patients with LMCI from EMCI. While the right rostral Brodmann area 20 was the most effective in distinguishing AD from LMCI. Correlation analysis revealed that the left nucleus accumbens, left caudal area 35/36, and left sensory thalamus had a mild correlation with cognitive scores measured using the Alzheimer’s Disease Assessment Scale-Cognitive (ADAS-cog) 13 and Mini-Mental State Examination (MMSE) scores.
Our findings show that the right rostral area 20 in the inferior temporal gyrus plays a significant role in cognitive impairment in AD.
Keywords
- Alzheimer’s disease
- neuroimaging
- temporal lobe
- subcortical nuclei
- brain subregion
- cognitive impairment
To facilitate an accurate and early diagnosis of Alzheimer’s disease (AD), numerous neuroimaging studies have been carried out to identify biomarkers in the prodromal phase of the disorder [1, 2, 3, 4]. Mild cognitive impairment (MCI) is the first stage of the AD progression. Patients with MCI experience mild memory decline that does not interfere with daily activities. Based on cognitive tests, MCI is divided into two types: early MCI (EMCI) and late MCI (LMCI) [5]. LMCI causes more severe memory disturbances.
Neurofibrillary tangles form in the medial temporal lobe (MTL) long before clinical symptoms of AD appear [6]. In addition to pathological and autopsy variations, structural atrophy, particularly in the entorhinal cortex (ERC), hippocampus, and amygdala, has been identified as a reliable biomarker of cognitive decline in AD [7, 8]. Furthermore, a large sample study found that thalamus volume loss is a sign of cognitive impairment in patients with AD [9]. These brain areas play critical roles in memory processes and multiple cognition. It is worth noting that individuals with AD exhibit more cognitive domain anomalies, including attention, judgment, visual-spatial orientation, and language skills [10]. Critically, these domains involve other temporal lobe cortex and subcortical regions. For example, the superior temporal gyrus (STG) is the core of the auditory cortex [11], the middle temporal gyrus (MTG) is primarily involved in semantic and verbal cognition [12], the inferior temporal gyrus (ITG) is thought to process visual information [13], and the fusiform gyrus (FuG) is involved in face recognition [14]. Subcortical structures, including the thalamus, play an important role in processing speed and memory [15, 16]. Subregional study has shown that anterior and superior thalamic atrophy leads to slower processing speeds [15]. The basal ganglia is associated with both learning and apathy [17]. Briefly, the temporal lobe cortices and subcortical nuclei are critical for cognition. Nonetheless, an approach that looks at the brain region as a whole and homogeneous structure, ignores the structural and functional diversity of its subregional components. A large number of studies have been conducted to investigate changes in subcortical subregions in AD [18, 19]. Recent research suggests that specific subregions of the hippocampus, amygdala, and thalamus can modulate the clinical processes associated with MCI [20, 21]. Exploring precise and nuanced subregions capable of distinguishing between different stages of AD may aid in providing a more comprehensive understanding of the neuropathological changes in AD. Meanwhile, few studies have examined the relationship between temporal lobe subregion volume and subcortical nuclei and cognition in patients with AD or MCI.
The human Brainnetome (BNA-246) is a cross-validated atlas with detailed anatomical and functional connection patterns for each area, as well as 246 subregions in both hemispheres [22, 23]. Therefore, in this study, we aimed to evaluate correlation between the cognitive impairment and volume change of the temporal lobe and subcortical nuclei subregions segmented by the BNA-246 over various phases of AD using a cohort of individuals with AD, LMCI, EMCI, and cognitively normal (CN). We compared the subregion volumes of CN and AD, LMCI and EMCI, LMCI and AD, and CN and EMCI. To determine the best subregion for distinguishing between the aforementioned groups, a receiver operating characteristic (ROC) curve was used. Furthermore, we investigated the relationship between cognitive impairment and the volume of subregions in AD, EMCI, and LMCI. We hypothesized that: first, volumetric atrophy of specific subregions of the thalamus may occur in EMCI; second, some volumes of subregions may distinguish disease and healthy groups as well as within disease groups; and third, there may be a link between cognitive impairment and certain volumes of subregions.
The data were downloaded from the AD Neuroimaging Initiative (ADNI) database (http://adni.loni.usc.edu), which was established in 2003 and is led by Principal Investigator Michael W. Weiner. ADNI combines information, such as positron emission tomography, demographics, cognitive scores, neuroimaging, genetic data, and serial magnetic resonance imaging (MRI), to track disease progression in patients with (probable) AD. The most recent information is available at (https://adni.loni.usc.edu/news-publications/news/). The study was carried out in accordance with the guidelines of the Declaration of Helsinki. This study was authorized by the participating institutions, and written informed consent was provided by all participants at each study site.
Individuals in the ADNI database were diagnosed according to the following: (1)
CN participants: had no memory concerns, a Clinical Dementia Rating (CDR) of 0,
and Mini-Mental State Examination (MMSE) scores ranging from 24 to 30. (2) MCI
participants: objective memory loss and further categorized as EMCI and LMCI
based on scores on the Wechsler Memory Scale Logical Memory II with a maximum
value of 25 (EMCI: a score of 9–11
 Fig. 1.
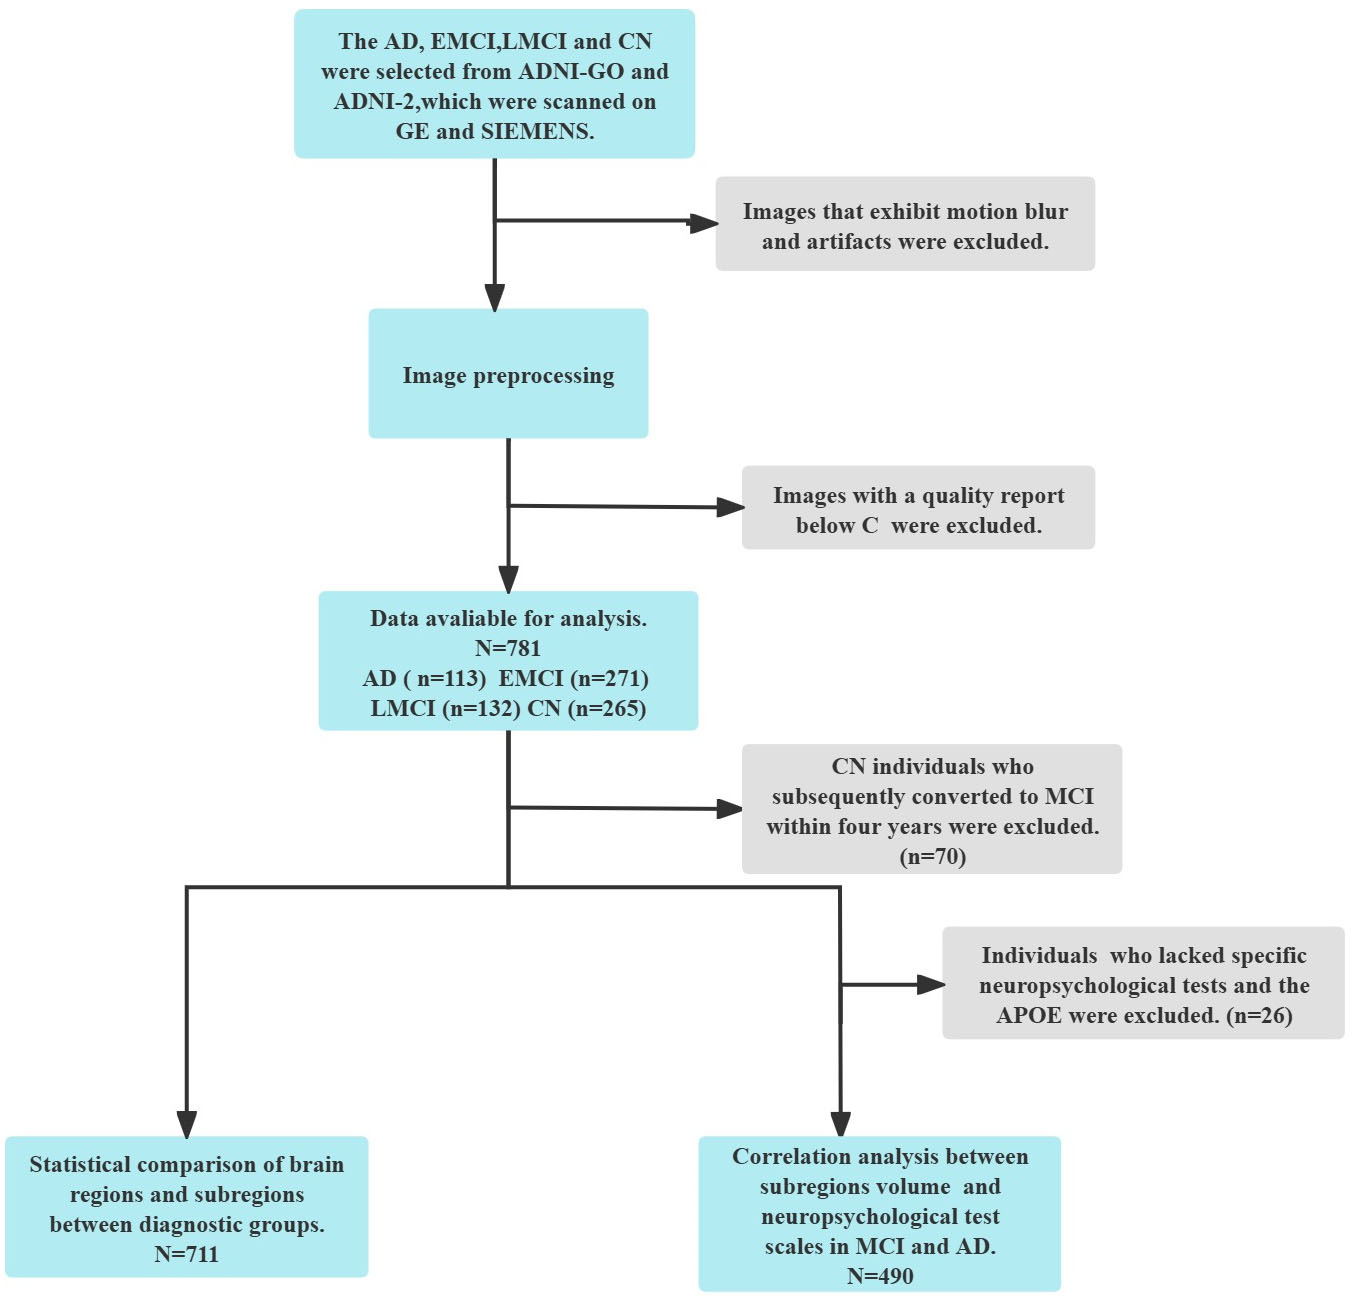
Flowchart of participants inclusion. EMCI, early mild cognitive impairment; LMCI, late mild cognitive impairment; AD, Alzheimer’s disease; CN, cognitively normal; MCI, mild cognitive impairment; APOE, apolipoprotein E; GE, General Electric; SIMENS, Siemens AG; ADNI-GO, Alzheimer’s Disease Neuroimaging Initiative GO.
In this study, we included 711 people (195 CN, 271 EMCI, 132 LMCI, and 113 AD cases) who had a 3-Tesla brain MRI using ADNI/GO/2. All participants had clinical demographic information (age, gender, education), apolipoprotein E (APOE) genotyping data, T1-weighted MRI, and neuropsychological measures such as the CDR, MMSE, and Alzheimer’s Disease Assessment Scale-Cognitive (ADAS-cog) 13. APOE ε4 is the most important risk gene for AD [25]. The MMSE is one of the most widely used neuropsychological tools for assessing cognitive function [26, 27] and predicting disease prognosis [28]. shows detailed demographic data and neuropsychological scores.
All T1-weighted structural MRI neuroimaging sequences for each MRI model and
scanner were acquired using the ADNI protocol
(https://adni.loni.usc.edu/help-faqs/adni-documentation/). The downloaded scans
had already been preprocessed with B1 correction, N3 correction, and gradwarping
correction for the current analyses, resulting in significantly reduced
neuroimage artifacts. Neuroimaging data was processed using Statistical
Parametric Mapping software version 12 (SPM12; Wellcome Trust Center for
Neuroimaging, London, UK; http://www.fil.ion.ucl.ac.uk/spm/software/spm12/)
running on MATLAB R2022b (MathWorks, Natick, MA, USA, [29]). First, manually set
the MRI T1 images’ origin position to the anterior commissure. After unifying
segmentation in the toolbox CAT12 (Computational Anatomy Toolbox;
http://dbm.neuro.uni-jena.de/cat/,
[30]), the MRI images were classified into bone, white matter, gray matter (GM),
and cerebrospinal fluid. The estimated total intracranial volume (eTIV) was
computed. Then, the GM images were normalized to 1.5 mm Montreal Neurological
Institute norm space using the DARTEL algorithm before being registered in the
identical stereotactic space. The normalized GM images were then scaled using
Jacobian matrices to eliminate distortions. Finally, to enhance image quality and
reduce random noise, the GM images were smoothed using a
full-width-at-half-maximum 8
The processed GM images were used to calculate the subregion volume. The BNA-246 was used to separate the temporal lobe and subcortical nuclei [31]. The temporal lobe cortex is divided into six regions: STG, MTG, ITG, FuG, posterior superior temporal sulcus (pSTS), and Parahippocampal Gyrus (PhG). Furthermore, these six regions were subdivided into multiple subregions: STG was divided into six functional subregions, MTG into four, ITG into seven, FuG into three, PhG into six, and pSTS into two. As a result, the temporal lobe cortex was divided into 28 subregions in each hemisphere. The subcortical nuclei include the amygdala, basal ganglia, hippocampus, and thalamus. The amygdala, hippocampus, basal ganglia, and thalamus were classified as two, two, six, and eight functional subregions, respectively. In total, subcortical nuclei were classified into 18 subregions in each hemisphere (Table 1) [22].
| The names of temporal lobe and subcortical nuclei subregions in the Brainnetome atlas | Anatomical and modified Cyto-architectonic descriptions | |
|---|---|---|
| Subregions of the temporal lobe | ||
| STG, Superior Temporal Gyrus | ||
| STG_L(R)_6_1* | A38m, medial area 38 | |
| STG_L(R)_6_2 | A41/42, area 41/42 | |
| STG_L(R)_6_3 | TE1.0 and TE1.2 | |
| STG_L(R)_6_4 | A22c, caudal area 22 | |
| STG_L(R)_6_5 | A38l, lateral area 38 | |
| STG_L(R)_6_6 | A22r, rostral area 22 | |
| MTG, Middle Temporal Gyrus | ||
| MTG_L(R)_4_1 | A21c, caudal area 21 | |
| MTG_L(R)_4_2 | A21r, rostral area 21 | |
| MTG_L(R)_4_3 | A37dl, dorsolateral area37 | |
| MTG_L(R)_4_4 | aSTS, anterior superior temporal sulcus | |
| ITG, Inferior Temporal Gyrus | ||
| ITG_L(R)_7_1 | A20iv, intermediate ventral area 20 | |
| ITG_L(R)_7_2 | A37elv, extreme lateroventral area37 | |
| ITG_L(R)_7_3 | A20r, rostral area 20 | |
| ITG_L(R)_7_4 | A20il, intermediate lateral area 20 | |
| ITG_L(R)_7_5 | A37vl, ventrolateral area 37 | |
| ITG_L(R)_7_6 | A20cl, caudolateral of area 20 | |
| ITG_L(R)_7_7 | A20cv, caudoventral of area 20 | |
| FuG, Fusiform Gyrus | ||
| FuG_L(R)_3_1 | A20rv, rostroventral area 20 | |
| FuG_L(R)_3_2 | A37mv, medioventral area37 | |
| FuG_L(R)_3_3 | A37lv, lateroventral area37 | |
| PhG, Parahippocampal Gyrus | ||
| PhG_L(R)_6_1 | A35/36r, rostral area 35/36 | |
| PhG_L(R)_6_2 | A35/36c, caudal area 35/36 | |
| PhG_L(R)_6_3 | TL, area TL (lateral PPHC, posterior parahippocampal gyrus) | |
| PhG_L(R)_6_4 | A28/34, area 28/34 (EC, entorhinal cortex) | |
| PhG_L(R)_6_5 | TI, area TI (temporal agranular insular cortex) | |
| PhG_L(R)_6_6 | TH, area TH (medial PPHC) | |
| pSTS, Posterior Superior Temporal Sulcusp | ||
| STS_L(R)_2_1 | rpSTS, rostroposterior superior temporal sulcus | |
| pSTS_L(R)_2_2 | cpSTS, caudoposterior superior temporal sulcus | |
| Subregions of the subcortical nuclei | ||
| Amyg, Amygdala | ||
| Amyg_L(R)_2_1 | mAmyg, medial amygdala | |
| Amyg_L(R)_2_2 | lAmyg, lateral amygdala | |
| Hipp, Hippocampus | ||
| Hipp_L(R)_2_1 | rHipp, rostral hippocampus | |
| Hipp_L(R)_2_2 | cHipp, caudal hippocampus | |
| BG, Basal Ganglia | ||
| BG_L(R)_6_1 | vCa, ventral caudate | |
| BG_L(R)_6_2 | GP, globus pallidus | |
| BG_L(R)_6_3 | NAC, nucleus accumbens | |
| BG_L(R)_6_4 | vmPu, ventromedial putamen | |
| BG_L(R)_6_5 | dCa, dorsal caudate | |
| BG_L(R)_6_6 | dlPu, dorsolateral putamen | |
| Tha, Thalamus | ||
| Tha_L(R)_8_1 | mPFtha, medial pre-frontal thalamus | |
| Tha_L(R)_8_2 | mPMtha, pre-motor thalamus | |
| Tha_L(R)_8_3 | Stha, sensory thalamus | |
| Tha_L(R)_8_4 | rTtha, rostral temporal thalamus | |
| Tha_L(R)_8_5 | PPtha, posterior parietal thalamus | |
| Tha_L(R)_8_6 | Otha, occipital thalamus | |
| Tha_L(R)_8_7 | cTtha, caudal temporal thalamus | |
| Tha_L(R)_8_8 | lPFtha, lateral pre-frontal thalamus | |
*STG_L(R)_6_1, STG_6_1 in left hemisphere or STG_6_1 in right hemisphere. BNA-246, the human Brainnetome Atlas.
Data were analyzed with the IBM Statistical Package for the Social Sciences
software version 25 (IBM Corp., Armonk, NY, USA, [32]). Individual demographics
(age, and education) and cognitive scores were analyzed using the non-parametric
Kruskal–Wallis test. Multiple comparisons were performed with family-wise error
correction. Differences in sex and APOE genotyping across groups were
compared using the Chi-square test. The difference in the volume of the temporal
lobe and subcortical nuclei, as well as their subregions between the groups was
statistically analyzed using analysis of covariance (ANCOVA), with age, gender,
education, and eTIV controls. Given that MMSE scores were found
to be associated with partial brain volume in a previous study [33], they were
used as covariates in the current study. A previous study also used the MMSE as a
covariate [9]. The Bonferroni correction was applied to multiple comparisons.
Furthermore, the area under the curve (AUC) of the receiver operating
characteristic (ROC) curve was calculated as a differentiating indicator to
evaluate the ability of subregions to distinguish between the four groups.
Finally, we assessed the potential relationship between subregion volume and
cognitive score using partial correlation analysis with sex, age, education,
APOE, and eTIV as covariates. p
Table 2 summarizes the demographic and cognitive data of the 781 participants in
the four groups. The study found no significant differences in sex (X2 =
4.657, p = 0.20) among the four groups. Although we found significant
differences among the four groups in education level (H = 8.583, p =
0.035), after correction for Bonferroni, post hoc analyses did not reveal
significant differences. Significant age differences were observed between CN and
EMCI, EMCI and AD (H = 38.943, p
| CN (n = 195) | EMCI (n = 271) | LMCI (n = 132) | AD (n = 113) | p-value | |
| Age (years) | 76 |
71 |
74 |
77 |
|
| Gender (F/M) | 100/95 | 118/153 | 65/67 | 46/67 | 0.2 |
| Education (years) | 16 |
16 |
16 |
16 |
0.035 |
| APOE4* (Carries/no-carries) | 48/141 | 104/151 | 77/48 | 73/38 | |
| MMSE | 30 |
28.5 |
27 |
22 |
|
| ADAS-cog 13** | 8 |
12 |
21 |
31 |
|
| CDR*** | 0 |
0.5 |
0.5 |
1 |
The data was presented as median
*Individuals who had the Apolipoprotein E genotyping information: 189 CN, 255 EMCI, 125 LMCI, 111 AD.
**Individuals who had the ADAS-cog 13 scores: 259 CN, 259 EMCI, 126 LMCI, 113 AD.
***Individuals who had the CDR scores: 264 CN, 269 EMCI, 132 LMCI, 112 AD.
Abbreviations: CN, cognitively normals; EMCI, early mild cognitive impairment; LMCI, late mild cognitive impairment; AD, Alzheimer’s disease; F, Female; M, Male; APOE, apolipoprotein E gene; MMSE, Mini-Mental State Examination; ADAS-cog, Alzheimer’s Disease Assessment Scale-Cognitive Behavior section; CDR, Clinical Dementia Rating.
ANCOVA was used to compare the temporal lobe and subcortical nuclei between the four groups, with age, gender, eTIV, education, and MMSE scores serving as covariates. Table 3 shows the results from multiple comparisons. When the volumes of temporal lobe regions and amygdala, hippocampus, basal ganglia, and thalamus were compared in four groups, to CN, volume increase was observed in pSTS in EMCI. When compared to CN, all regions of the temporal lobe, amygdala, hippocampus, and basal ganglia showed volume reduction in AD. Compared to EMCI, LMCI showed volume reduction in all regions of the temporal lobe, hippocampus, amygdala, and thalamus. When compared to LMCI, volume was reduced in all regions of the temporal lobe, as well as the hippocampus, amygdala, and basal ganglia in AD.
| Brain regions | CN (n = 195) | EMCI (n = 271) | LMCI (n = 132) | AD (n = 113) | p-value | ||||
| EMCI VS CN | AD VS CN | EMCI VS LMCI | LMCI VS AD | ||||||
| Temporal lobe | |||||||||
| STG | 23.45 |
24.31 |
22.96 |
21.60 |
1 | 0.008* | |||
| MTG | 21.05 |
21.81 |
20.25 |
18.62 |
1 | ||||
| ITG | 19.86 |
20.42 |
19.02 |
17.31 |
1 | ||||
| FuG | 20.82 |
21.83 |
20.43 |
19.09 |
0.262 | ||||
| PhG | 7.32 |
7.57 |
7.03 |
6.58 |
1 | 0.002* | |||
| pSTS | 3.91 |
4.13 |
3.75 |
3.54 |
0.043* | 0.048* | |||
| Subcortical nuclei | |||||||||
| Amyg | 2.57 |
2.64 |
2.35 |
2.13 |
1 | 0.001* | |||
| Hipp | 16.6 |
9.26 |
8.25 |
7.54 |
1 | 0.001* | |||
| BG | 16.6 |
16.80 |
16.30 |
15.8 |
1 | 0.004* | 0.112 | 0.021* | |
| Tha | 9.67 |
9.90 |
9.42 |
9.19 |
1 | 0.225 | 0.003* | 1 | |
Abbreviations: *p
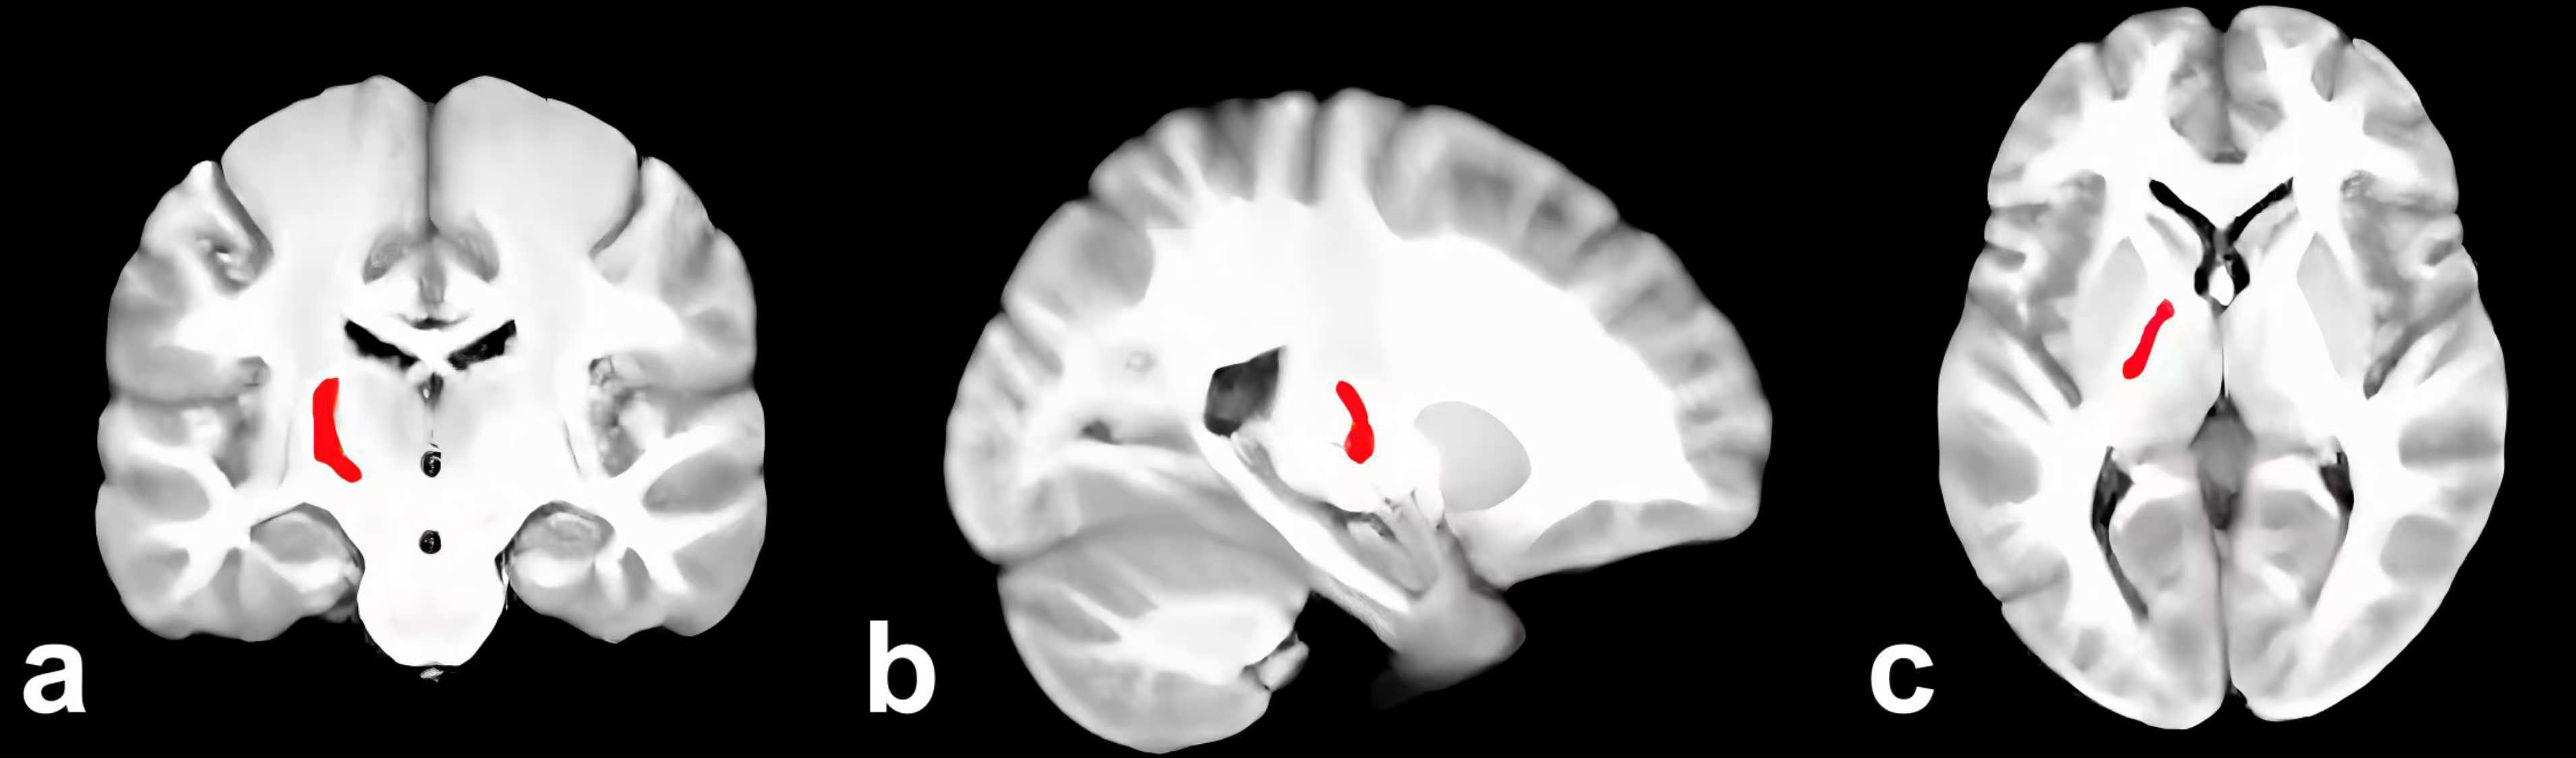
Supplementary Table 1 showed the results of the subregion volume comparisons that revealed a significant volume increase in 1 subregion and a decrease in the left Tha_L_8_2 (Fig. 2) and FuG_L_3_2 in EMCI versus CN. When compared to CN, 60 AD subregions showed a significant volume reduction. In comparison to EMCI, there is a significant volume reduction in 65 subregions of LMCI. When compared to LMCI, 50 subregions showed a significant volume reduction in AD.
 Fig. 2.
Left Tha_L_8_2 in the brain (red). (a) Coronal. (b) Sagittal. (c) Axial.
Table 4 shows the AUC value of functional subregions used to differentiate the
four groups (subregions with an AUC value
| Subregion | EMCI VS CN | AD VS CN | EMCI VS LMCI | LMCI VS AD |
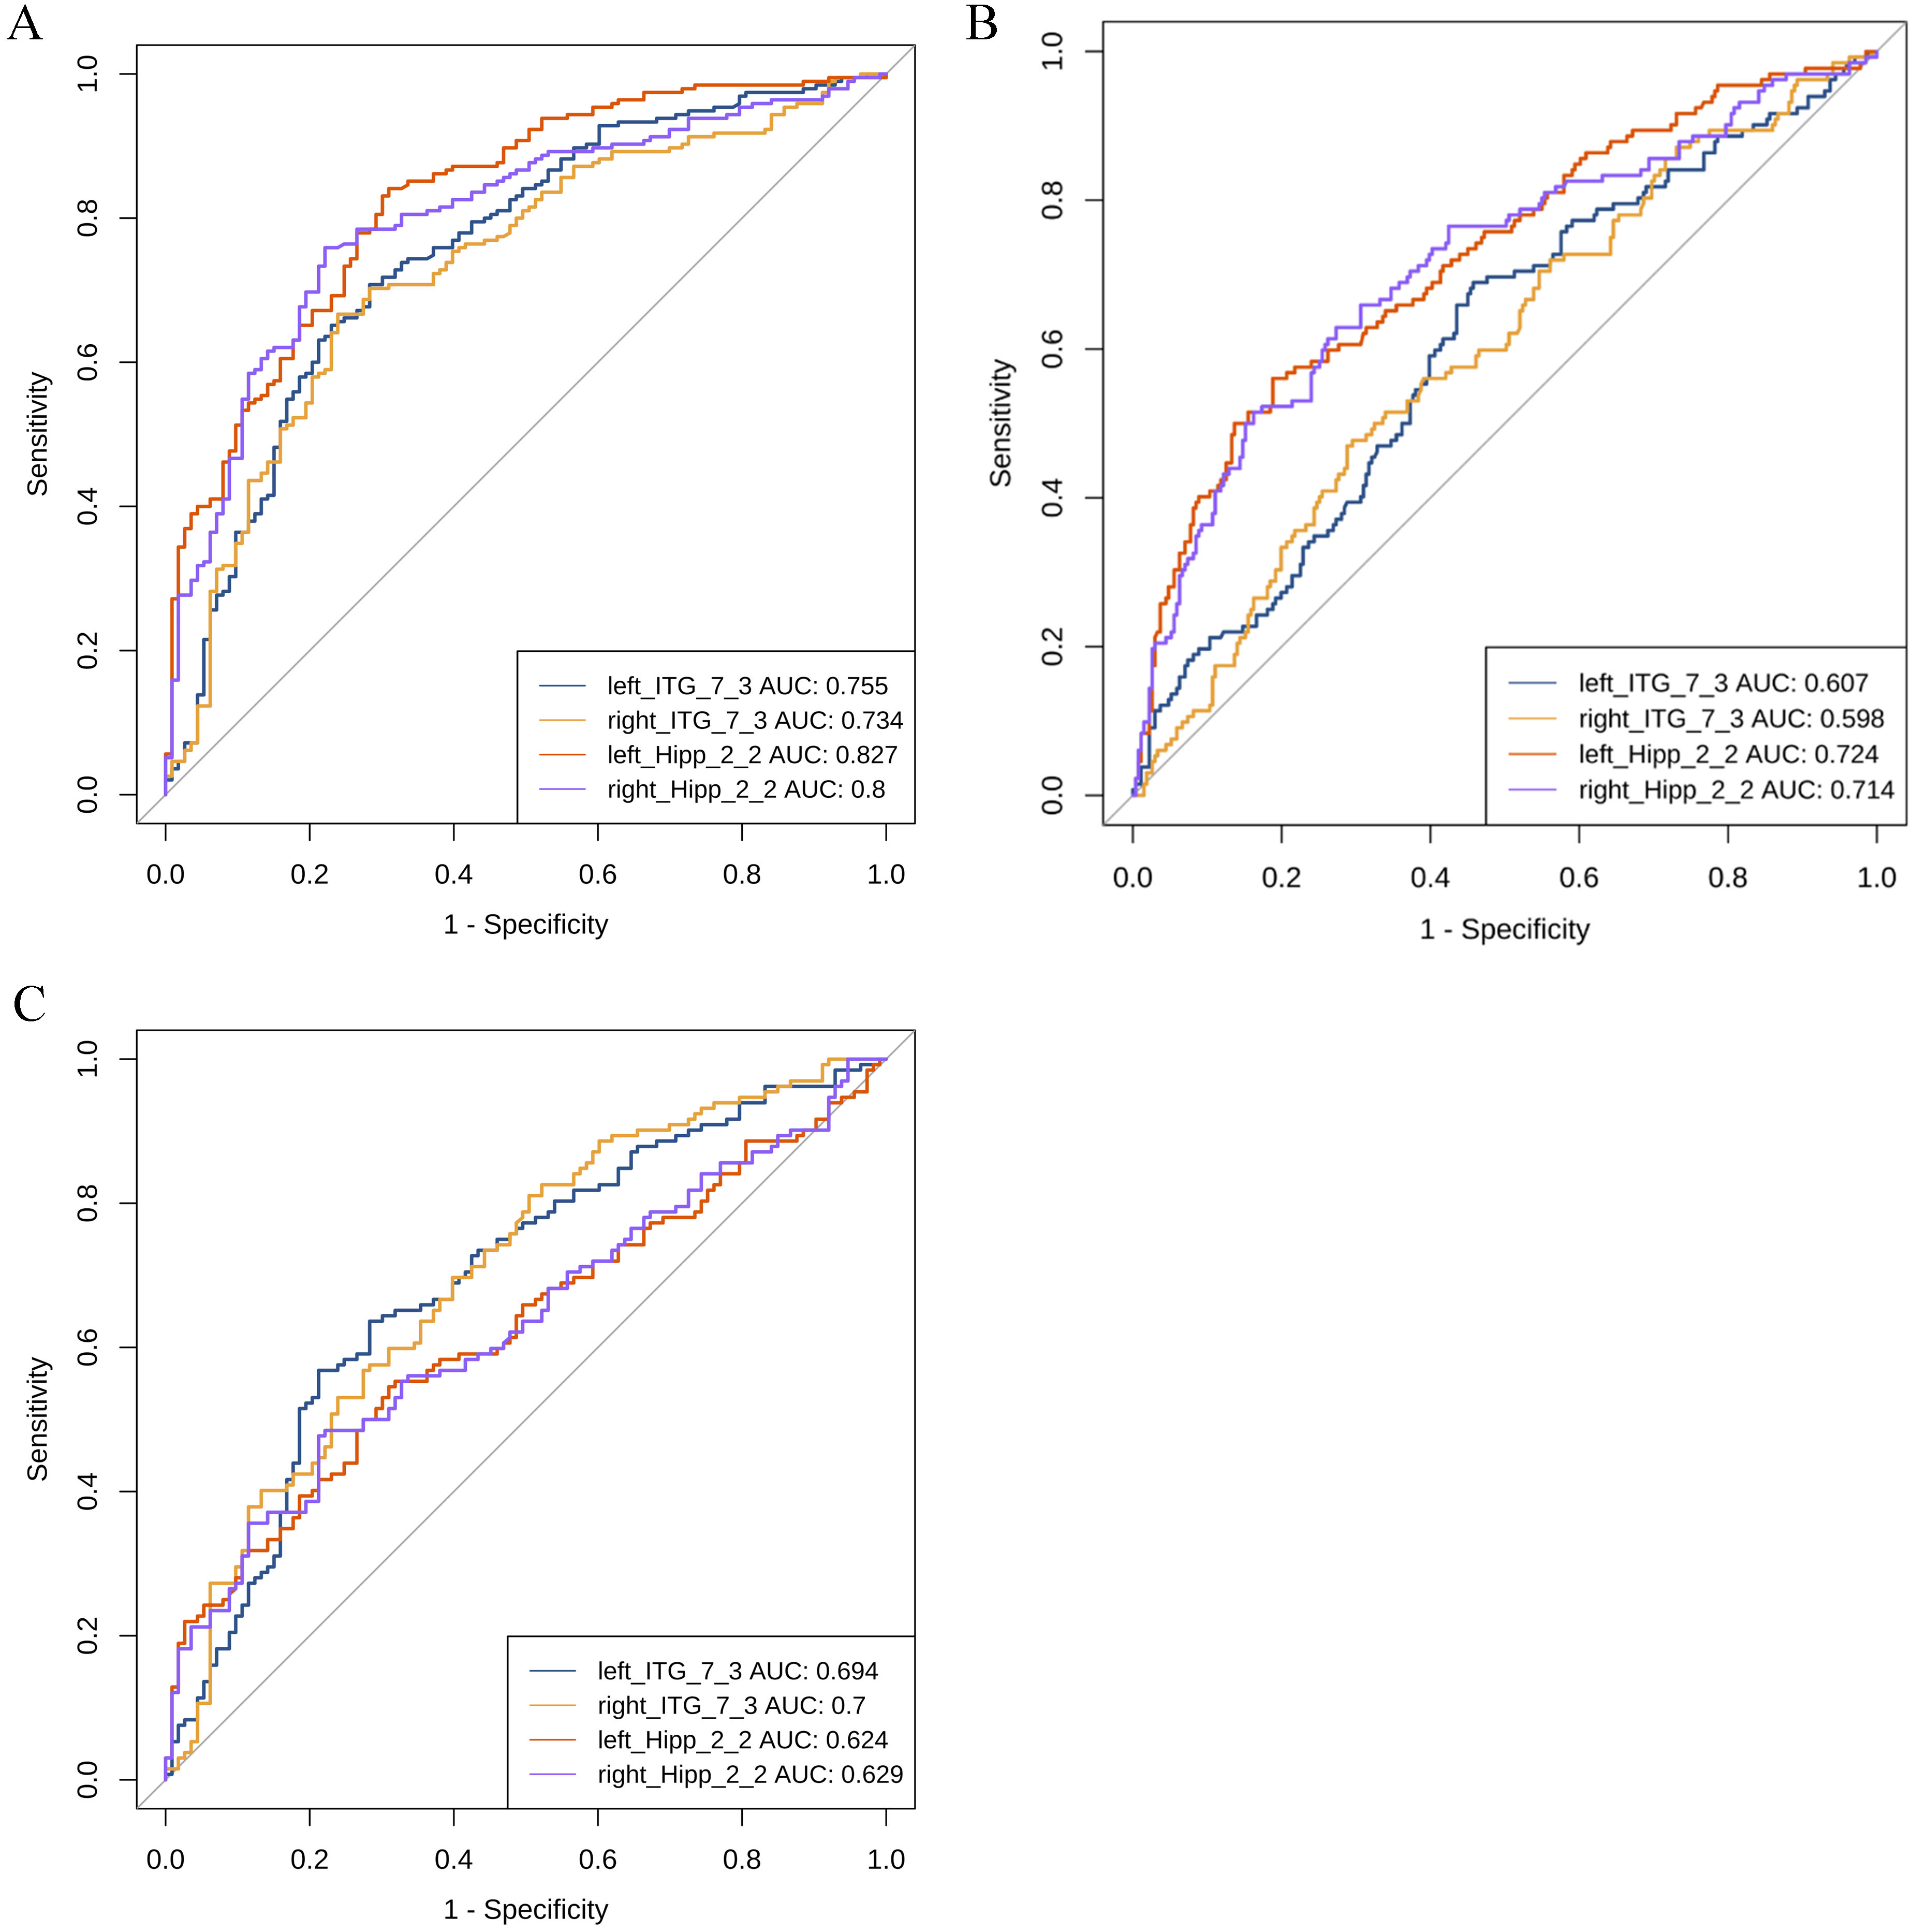
| Hipp_L_2_2 | 0.556 | 0.827* | 0.724* | 0.624 |
| Hipp_R_2_2 | 0.579 | 0.8* | 0.714* | 0.629 |
| Amyg_L_2_1 | 0.533 | 0.79* | 0.677 | 0.64 |
| Amyg_R_2_1 | 0.552 | 0.786* | 0.697 | 0.647 |
| Hipp_L_2_1 | 0.54 | 0.774* | 0.67 | 0.66 |
| Amyg_L_2_2 | 0.538 | 0.771* | 0.676 | 0.644 |
| Amyg_R_2_2 | 0.57 | 0.762* | 0.67 | 0.647 |
| Hipp_R_2_1 | 0.567 | 0.756* | 0.679 | 0.645 |
| ITG_L_7_3 | 0.53 | 0.755* | 0.607 | 0.694 |
| ITG_L_7_4 | 0.512 | 0.754* | 0.637 | 0.648 |
| PhG_L_6_5 | 0.511 | 0.752* | 0.646 | 0.646 |
| MTG_L_4_4 | 0.579 | 0.747* | 0.681 | 0.652 |
| ITG_L_7_1 | 0.546 | 0.746* | 0.66 | 0.626 |
| ITG_R_7_4 | 0.535 | 0.745* | 0.606 | 0.684 |
| ITG_L_7_6 | 0.571 | 0.742* | 0.652 | 0.645 |
| FuG_R_3_1 | 0.586 | 0.742* | 0.667 | 0.665 |
| STG_L_6_1 | 0.526 | 0.737* | 0.614 | 0.666 |
| STG_R_6_1 | 0.552 | 0.735* | 0.627 | 0.66 |
| ITG_R_7_3 | 0.547 | 0.734* | 0.598 | 0.700* |
| MTG_L_4_2 | 0.523 | 0.731* | 0.611 | 0.669 |
| MTG_R_4_4 | 0.591 | 0.731* | 0.644 | 0.666 |
| FuG_L_3_1 | 0.566 | 0.723* | 0.629 | 0.66 |
| MTG_L_4_1 | 0.56 | 0.721* | 0.644 | 0.644 |
| PhG_R_6_1 | 0.553 | 0.72* | 0.627 | 0.645 |
| PhG_L_6_3 | 0.573 | 0.72* | 0.626 | 0.653 |
| PhG_L_6_1 | 0.52 | 0.719* | 0.609 | 0.653 |
| PhG_R_6_2 | 0.551 | 0.717* | 0.633 | 0.639 |
| ITG_R_7_6 | 0.584 | 0.713* | 0.639 | 0.654 |
| ITG_L_7_7 | 0.508 | 0.711* | 0.612 | 0.614 |
| ITG_R_7_7 | 0.546 | 0.7* | 0.613 | 0.629 |
Abbreviations: *the value of area under the curve (AUC)
 Fig. 3.
ROC analysis between the groups. (A) ROC curve between CN and AD. (B) ROC curve between EMCI and LMCI. (C) ROC curve between LMCI and AD. AUC, area under the curve; ROC, receiver operating characteristic; CN, cognitively normals; EMCI, early mild cognitive impairment; LMCI, late mild cognitive impairment; AD, Alzheimer’s disease; Hipp, Hippocampus; ITG, Inferior Temporal Gyrus.
 Fig. 4.
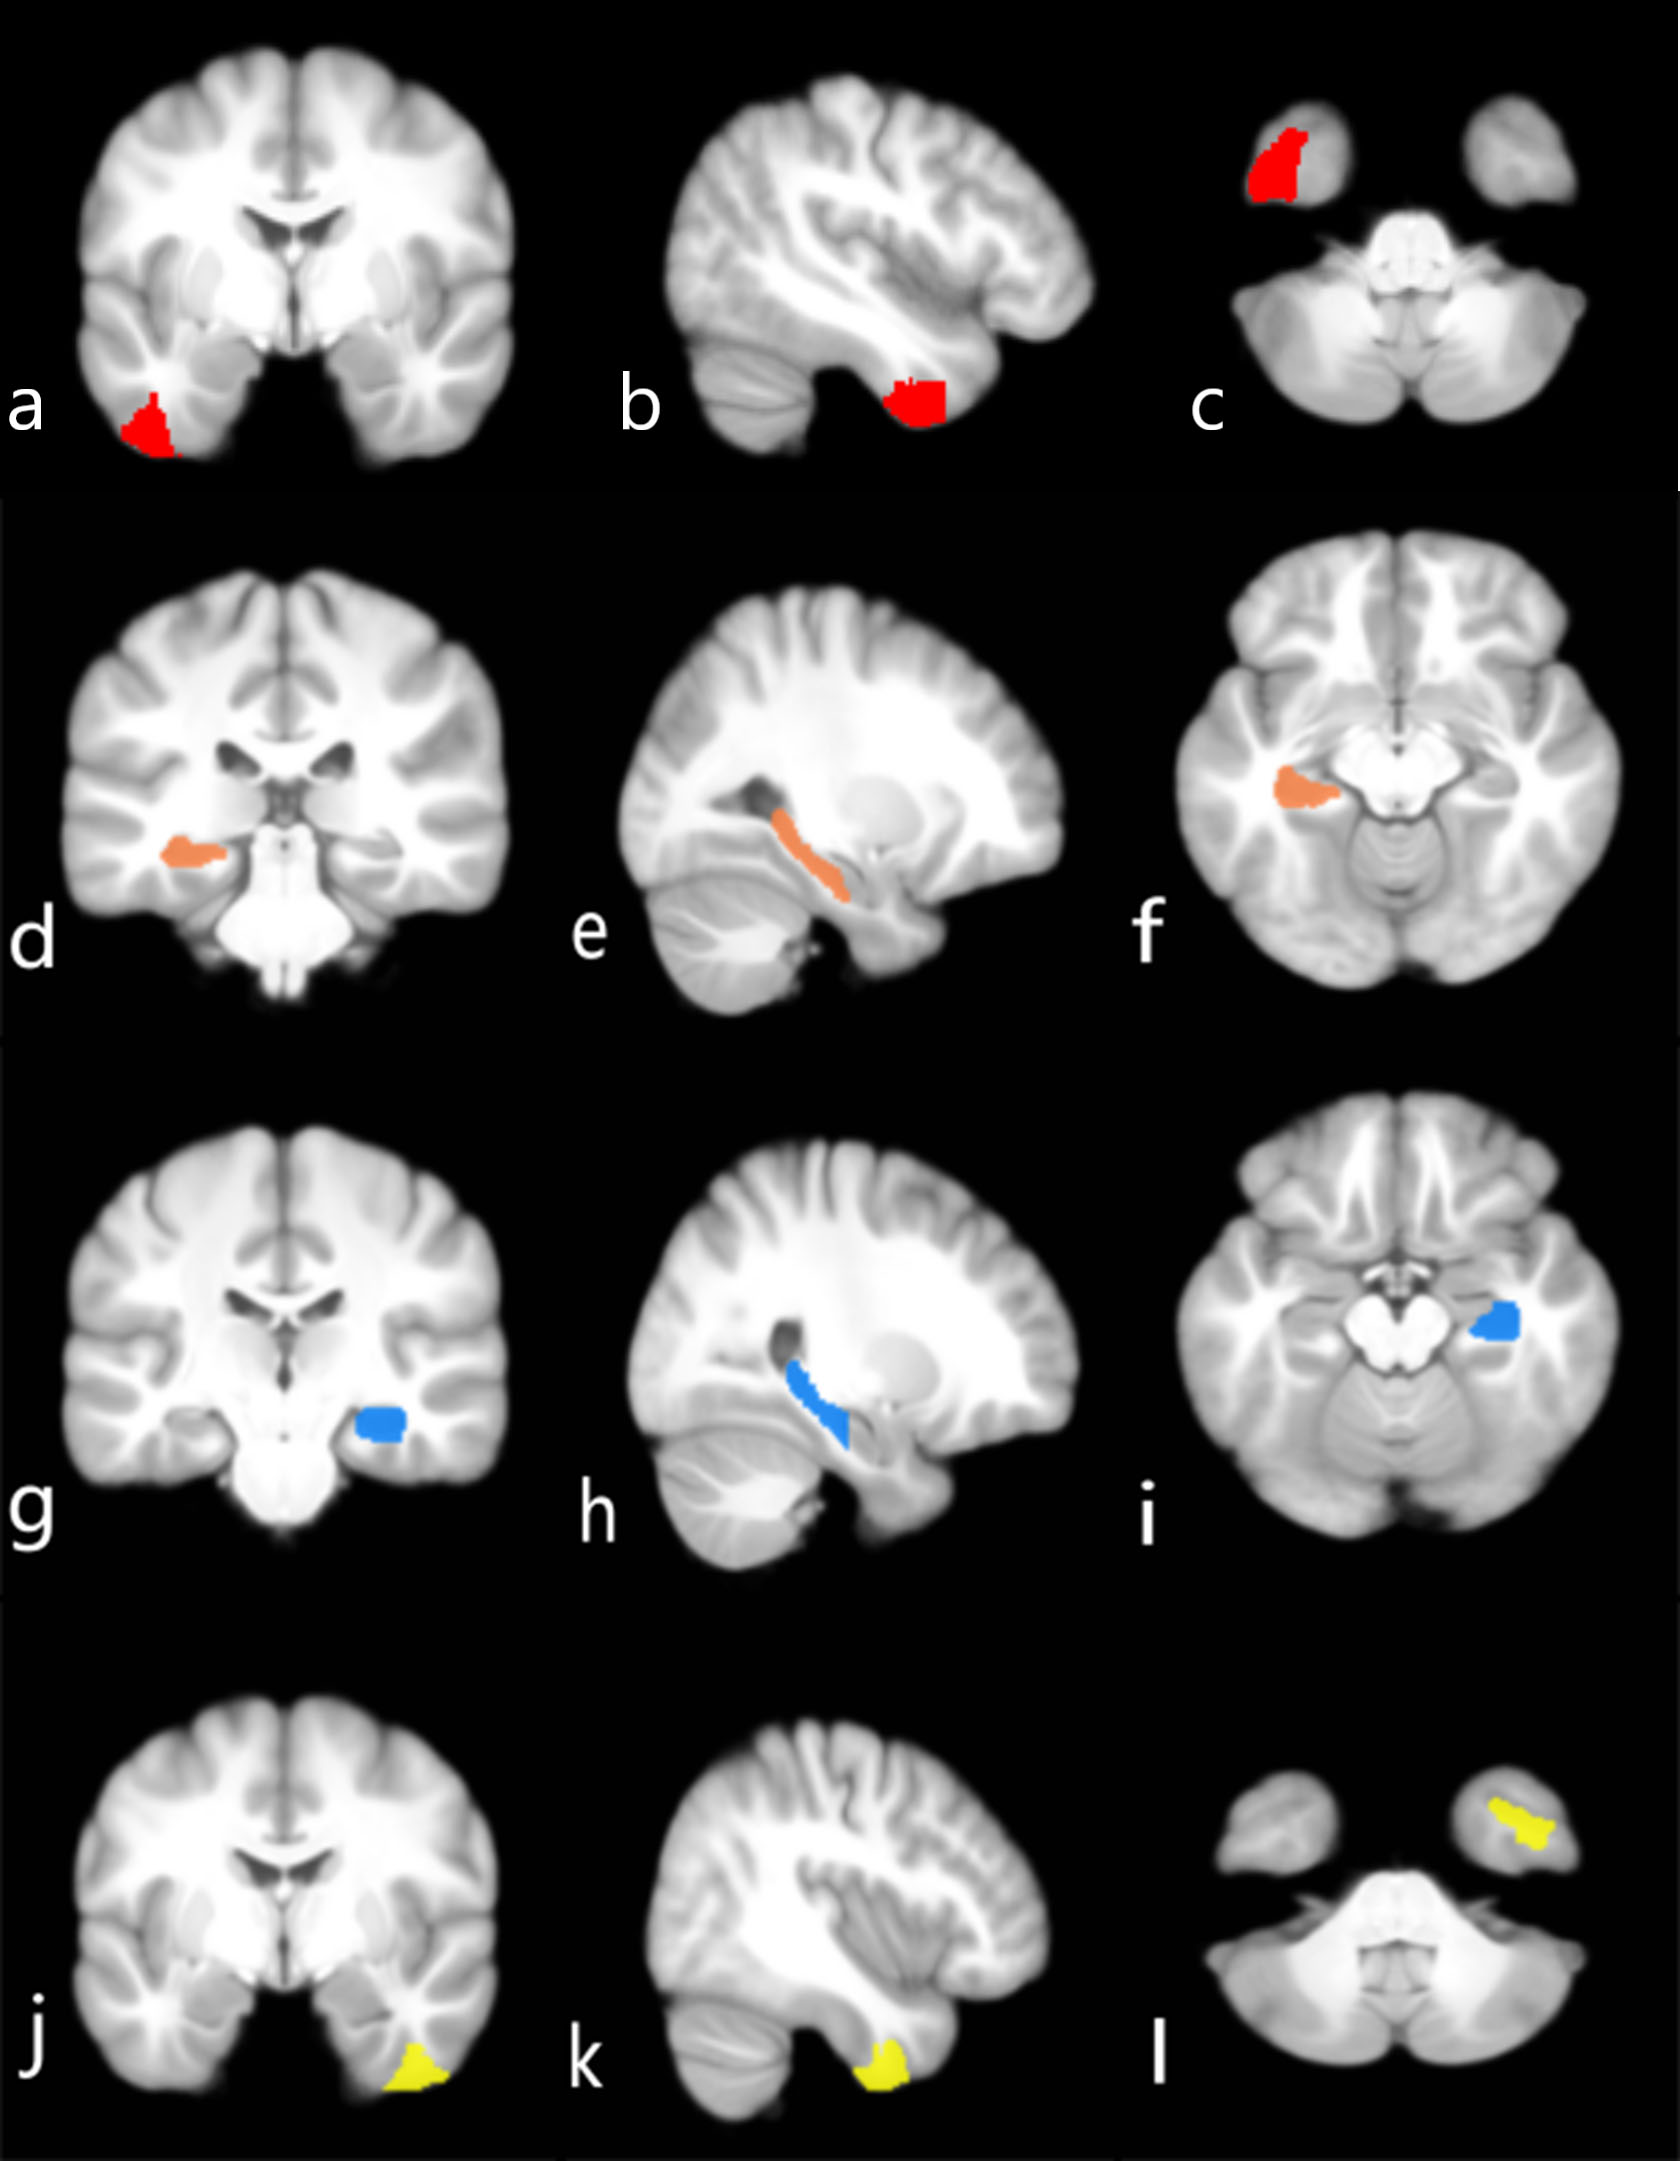
Brain regions that can differentiate between diagnostic groups. (a–c) Left ITG_7_3 in the brain (red) distinguishes AD from CN. (d–f) Left Hipp_2_2 in the brain (orange) distinguishes LMCI from EMCI. (g–i) Right Hipp_2_2 in the brain (blue) may distinguish LMCI from EMCI. (j–l) Right ITG_7_3 in the brain (yellow) has the best ability to distinguish between LMCI and AD. (a,d,g,j) Coronal. (b,e,h,k) Sagittal. (c,f,i,l) Axial.
Supplementary Table 3 shows brain subregions that have a mild
association with ADAS-cog 13 and MMSE scores in AD, LMCI, and EMCI (p
The goal of this study was to examine the relationship between cognitive impairment and subregion atrophy of the temporal lobe and subcortical nuclei in individuals at various clinical stages of AD to better understand the patterns of subregion atrophy and cognitive decline. A comparison of subregion volumes in AD, EMCL, LMCI, and CN. At the start of cognitive impairment, we discovered that the left Tha_8_2 (mPMtha, premotor thalamus) showed significant volume loss in individuals with EMCI, although the AUC value of this region was low when compared to the MCI and CN groups. Many previous studies have identified the hippocampus, ERC, and amygdala as the first sites of cognitive impairment in preclinical AD [34, 35]. An increasing body of evidence suggests that thalamic atrophy occurs at the early clinical stages of AD, possibly before hippocampal atrophy [9, 36]. Furthermore, the thalamic subregion mPMtha encompasses portions of the ventral anterior (VA) nucleus [37]. Volume loss of the VA has been reported in LMCI [38], but atrophy of the mPMtha was observed earlier in the current study, which is required for action [22]. The mPMtha atrophy results supported our previous hypothesis. With more severe cognitive impairment, the volume of all temporal lobe regions, as well as the hippocampus and amygdala decreased. It is worth noting that in subcortical structures, the thalamus showed significant atrophy in LMCI patients compared to EMCI, whereas the basal ganglia showed significant atrophy in AD patients compared to both LMCI and CN. Volume loss of the thalamus occurs primarily early in AD, which is consistent with previous research [9].
MTL volumetric atrophy was most commonly used to distinguish AD patients from those with CN [39]. As expected, we found that all subregions of the hippocampus and amygdala had high AUC values for distinguishing between AD and CN. Of these, the left caudal hippocampus (Hipp_L_2_2) demonstrated the best discrimination ability. Meanwhile, the left Hipp_2_2 also distinguishes between EMCI and LMCI. The hippocampal subregional structures, the cornu ammonis 1 (CA1), and the subiculum of the caudal hippocampus have been widely reported to experience significant volume shrinkage [19]. In the temporal lobe and subcortical nuclei, volume abnormalities in hippocampal and amygdala subregions were most evident in AD and MCI. Our findings are consistent with previous research indicating that have shown that volume abnormalities in the hippocampus and amygdala play a role in the early stages of AD [7].
Brodmann area (BA) 20 is a language association area thought to be an extension of Wernicke’s area that plays a role in semantic processing [40]. Atrophy of BA 20 has been observed in semantic dementia in the left hemisphere [41]. A functional MRI study found a decrease in the amplitude of low-frequency fluctuations in the right BA20 in MCI [42]. In our study, BA 20 was divided into segments: intermediate ventral (ITG_7_1), intermediate lateral (ITG_7_4), caudolateral (ITG_7_6), caudoventral (ITG_7_7), rostroventral (FuG_3_1), and rostral (ITG_7_3) segments. In addition to the amygdala and hippocampus, the left ITG_7_3 in the BA 20 could clearly distinguish between people with AD and CN. The right ITG_7_3 demonstrated the best ability to distinguish patients with LMCI from AD, with an AUC value greater than both the hippocampus and the amygdala. Previous studies of AD have seldom emphasized BA 20, yet the present study demonstrated that rostral BA 20 is a valuable differentiating marker between the various cognitive stages of AD [43]. Furthermore, ITG_7_3 was linked to MMSE scores in patients with MCI. Severe shrinkage of the ITG_7_3 volume in the late stages of MCI may be associated with poor performance on language tests in patients with AD [44]. A more detailed segmentation of temporal lobe volumes complements and validates regions involved in AD neurological changes.
In this study, the correlation analysis revealed that the left BG_6_3 and left PhG_6_2 were mildly correlated with the MMSE scores in the three disease groups. Furthermore, the left Tha_8_3 showed a slight correlation with the ADAS-cog 13 score.
The nucleus accumbens (BG_6_3) is a part of the ventral striatum, that participates in execution, specifically in the selection and execution of particular motivated behaviors [45]. The nucleus accumbens can help to improve operational efficiency when there are ambiguities [46]. Recent research has found that executive subregions of the striatum are impaired in patients with AD, which is linked to abnormal connections between the dorsolateral prefrontal cortex and the striatum [47]. Another study found that the nucleus accumbens plays a broader role in the cognitive decline of mild Parkinson’s disease, particularly in attention, working memory, and language [48]. Furthermore, loss of nucleus accumbens volume may predict cognitive decline in older adults [49], whereas increased volume may prevent cognitive decline [50]. The nucleus accumbens undoubtedly plays an important role in AD cognition. As part of the striatum, the putamen demonstrated significant volume loss and abnormalities on neuroimaging indices in probable AD, multiple system atrophy with MCI, and major depressive disorder, and correlation analyses with various kinds of neuropsychological tests confirmed that atrophy in this region was linked to cognitive decline and depression symptoms [51, 52, 53]. In the current study, this region is divided into ventromedial and dorsolateral parts. There is significant volume loss in the bilateral ventromedial and right dorsolateral of the putamen, but there is no significant correlation with cognitive performance. It is worth noting that the putamen is associated with both cognition and neuropsychiatric symptoms, such as apathy in AD [17]. Emotional apathy is also strongly associated with poor cognition and a risk factor for developing AD [54, 55]. Apathy may influence the relationship between cognition and the putamen. Unfortunately, the assessment of apathy was not included in this study. Future research could look into how cognition and other neuropsychiatric symptoms relate to neuropathology in AD.
In our study, BA 35 and BA 36, which are parts of the perirhinal cortex, were divided into rostral area 35/36 and caudal area 35/36, and PhG_6_2 corresponding to the caudal area 35/36. The perirhinal cortex is a region of the brain located between the hippocampus and the neocortex that is involved in spatial memory [56]. Furthermore, the perirhinal cortex plays an undeniably important role in familiarity-based object recognition memory [57]. Caudal areas 35/36 could respond to novel stimuli, and novel object exposure may cause a change in the expression of immediate early genes in caudal areas 35/36. Furthermore, BA 35 is linked to semantic memory [58]. Patients with AD suffer from impaired perceptual integration and global discrimination memory [59]. The role of rostral area 35/36 in recognition memory in AD should be investigated further. The sensory thalamus of the left hemisphere (Tha_L_8_3) is responsible for action and executive functions [22]. Patients with AD have impaired executive function [60]. Furthermore, limited life-space mobility of patients with AD has been reported [61].
In this study, although the volume of the neurodegenerative lesion-vulnerable temporal lobe and subcortical subregions was measured to obtain the most discriminatory subregions of these two major regions in the comparison of various phases of AD, some other subcortical structures, such as the basal forebrain (BF) cholinergic system, were not included. And there is growing evidence that the BF, like the Nucleus basalis of Meynert, may be the first subcortical area to be affected by neurodegeneration and that this structure is critical in the cognitive domains of learning and attention [62]. Therefore, the choice of brain regions limits the interpretation of the findings in this study in some ways.
The advantages of this study include the large sample size and the division of MCI into early and late phases, which allows for more detailed differences in the trajectory of subregion volume atrophy along the AD continuum. However, the study has some limitations. First, the BNA-246 atlas was used based on the Chinese population examined in this study; thus, the results must be further validated in Chinese patient groups. Second, sex differences have been linked to cognition and neuropathology in AD [63, 64]. Volume differences in the temporal lobe and subcortical subregions between sexes at various stages of AD require further investigation. Third, alcohol abuse increases the risk factor of AD, and chronic alcohol use causes cognitive decline and affects related brain regions [65]. This study did not control for alcohol consumption; therefore, more attention should be paid to this factor in neurological changes in AD. Furthermore, BNA-246 segmented the hippocampus and amygdala relatively coarsely. In future studies, a more precise subcortical segmentation atlas or accurate software, such as FreeSufer [20], should be used to validate the subregions discovered in this study. Future research may not be limited to measurements of GM volume, as abnormalities in thickness and density have been observed in MCI and AD [66]. Longitudinal experiments are required to demonstrate volume atrophy in this study’s AD continuum subregion.
We wanted to see how subregions of the temporal lobe and subcortical nuclei correlated with cognition at different stages of AD. We discovered that the right rostral area 20 in the inferior temporal gyrus can correctly distinguish individuals with AD from LMCI, outperforming the subregions of the hippocampus and amygdala. The caudal area 35/36, nucleus accumbens, and sensory thalamus are all significantly associated with cognitive scores measured by the ADAS-cog 13 and MMSE. The application of cognitive correlation analyses at the subregional level offers a more nuanced understanding of the influence of AD neurological alterations on clinical manifestations.
MCI, mild cognitive impairment; EMCI, early mild cognitive impairment; LMCI, late mild cognitive impairment; MTL, medial temporal lobe; ERC, entorhinal cortex; STG, superior temporal gyrus; MTG, middle temporal gyrus; ITG, inferior temporal gyrus; FuG, fusiform gyrus; CN, cognitively normal; ADNI, Alzheimer’s Disease Neuroimaging Initiative; CDR, clinical dementia rating; ADRDA, Alzheimer’s Disease and Related Disorders Association; MMSE, Mini-Mental State Examination; ADSC-cog, Alzheimer’s Disease Assessment Scale-Cognitive; GM, gray matter; PhG, parahippocampal gyrus; pSTS, posterior superior temporal sulcus; VA, ventral anterior.
All data reported in this paper will also be shared by the lead contact upon request under reasonable cause.
FL designed the research study, performed the research, and wrote the manuscript. CS provided help and advice on software, investigation, and methodology. DR provided help and advice on data analysis. WY conceptualized and designed the study and conducted a review of the manuscript. All authors contributed to editorial changes in the manuscript. All authors read and approved the final manuscript. All authors have participated sufficiently in the work and agreed to be accountable for all aspects of the work.
The protocol was approved by the Ethics Committee of Affiliated Hospital of North Sichuan Medical College (approval number: 2022ER452-1). The study was carried out in accordance with the guidelines of the Declaration of Helsinki. Written informed consent was provided for the patients or their families/legal guardians.
Data collection and sharing for this study was funded by the Alzheimer’s Disease Neuroimaging Initiative (ADNI) database (http://adni.loni.usc.edu). We would like to thank all of the investigators (http://adni.loni.usc.edu/wp-content/uploads/how_to_apply/ADNI_Acknowledgement_List.pdf) of ADNI.
This research received no external funding.
The authors declare no conflict of interest.
Supplementary material associated with this article can be found, in the online version, at https://doi.org/10.31083/j.jin2312220.
References
Publisher’s Note: IMR Press stays neutral with regard to jurisdictional claims in published maps and institutional affiliations.