


1 Department of Neurology, First Affiliated Hospital of Hainan Medical University, 570102 Haikou, Hainan, China
2 Department of Neurology, Hainan West Central Hospital, 571799 Danzhou, Hainan, China
Abstract
Ischemic stroke (IS) is the leading cause of mortality worldwide. Herein, we aimed to identify novel biomarkers and explore the role of C-type lectin domain family 7 member A (CLEC7A) in IS.
Differentially expressed genes (DEGs) were screened using the GSE106680, GSE97537, and GSE61616 datasets, and hub genes were identified through construction of protein-protein interaction networks. An IS model was established by middle cerebral artery occlusion and reperfusion (MCAO/R). Neural function was assessed using triphenyl tetrazolium chloride, hematoxylin-eosin, and terminal deoxynucleotidyl transferase-mediated nick-end labeling. A cell counting kit was used to detect cell viability following oxygen-glucose deprivation/reperfusion (OGD/R). Inflammatory factors were detected using enzyme-linked immunosorbent assay. The mRNA and protein expression levels were detected using reverse transcription-quantitative polymerase chain reaction and western blotting, respectively.
Fc fragment of Immunoglobulin G (IgG) receptor IIIa (FCGR3A), Fc fragment of Immunoglobulin E (IgE) receptor Ig (FCER1G), Complement component 5a receptor 1 (C5AR1), CLEC7A, Plasminogen activator, urokinase (PLAU), and C-C motif chemokine ligand 6 (CCL6) were identified as important hub genes, from which CLEC7A was selected as the primary subject of this study. The activation of microglia and pyroptosis were observed in MCAO/R model with increased levels of interleukin (IL)-1β, IL-18, tumor necrosis factor-α, and lactate dehydrogenase. CLEC7A knockdown was found to promote cell viability in BV2 cells and inhibiting pyroptosis in HT22 cells. CLEC7A knockdown in microglia also decreased infarct volume and neurological deficit scores, and alleviated injury and neuronal apoptosis in IS rats. CLEC7A knockdown inhibited pyroptosis and microglial activation in the MCAO/R model. A pyroptosis activator reversed the effect of CLEC7A knockdown on the viability of OGD/R-treated HT22 cells.
CLEC7A is a promising biomarker of IS. CLEC7A knockdown alleviates IS by inhibiting pyroptosis and microglial activation.
Keywords
- ischemic stroke
- CLEC7A
- differential expression genes
- pyroptosis
- microglia
Stroke is the third most common cause of mortality and disability worldwide [1], and can be classified into two phenotypes: ischemic and hemorrhagic [2]. Ischemic stroke (IS) is caused by vascular obstruction, whereas hemorrhagic stroke is caused by vessel rupture [3]. Notably, IS is the most prevalent type of stroke, accounting for approximately 85% of all stroke cases, and is associated with high rates of death, morbidity, and recurrence, along with a poor recovery rate [4, 5]. The primary therapeutic objective for IS is to swiftly restore blood flow following symptom onset, while the treatment for hemorrhagic stroke involves the invasive surgical removal of intracranial clots or ventricular blood, and control of intracranial pressure to effectively reduce mortality rates [6, 7]. The two primary methods to achieve reperfusion, intravenous thrombolysis and endovascular intracranial thrombectomy, both have narrow effective time windows [8, 9]. Furthermore, in IS, revascularization invariably induces ischemia-reperfusion injury, increasing inflammation and the production of reactive oxygen species (ROS), which may result in malignant edema or hemorrhagic transformation [10]. As such, more effective substances for the treatment of IS need to be actively explored.
The C-type lectin domain family 7 member A (CLEC7A, also known as Dectin-1) is a pattern recognition receptor that induces intracellular effects after recognizing pathogen-associated molecules, including antimicrobials, adaptive immune development, and inflammatory response activation [11]. CLEC7A is produced by macrophages and immune cells, and regulates phagocytosis and ROS generation to control innate immune responses to pathogens and phagocytic characteristics [12, 13, 14]. Moreover, CLEC7A is instrumental in the development of several central nervous system (CNS) diseases [15]. The existing knowledge suggests that CLEC7A exerts a dual effect on neuropathology; on the one hand, CLEC7A has beneficial effects on autoimmune neuroinflammation, while on the other hand, it exerts deleterious effects on neuropathic pain and Alzheimer’s disease [16, 17, 18]. CLEC7A plays a crucial role in inflammatory activation following IS, and that CLEC7A antagonists can reduce the volume of cerebral infarction and improve neurological function [19]. Therefore, a thorough investigation into the role and mechanism of CLEC7A in IS is important for its treatment.
Microglia, which are derivatives of macrophages, represent a distinct subset of innate immune cells within the CNS, and act as principal mediators of neuroinflammation [20]. Upon activation, microglia secrete a repertoire of factors that can exert either proinflammatory or antiinflammatory effects [21, 22]. Activated microglia further undergo polarization into M1 and M2 subtypes, of which the former is distinguished by its involvement in the initiation and perpetuation of inflammatory responses, whereas the latter exerts neuroprotective properties [23, 24]. The microglia-mediated neuroinflammatory response constitutes a critical nexus in IS [25]. Microglia represent one of the earliest responders to IS, exhibiting rapid activation in response to endogenous danger signals, and achieving a peak within the lesioned CNS parenchyma within a temporal window of 2–3 days post-insult, with sustained engagement over subsequent weeks [26]. As such, uncovering the mechanisms by which microglial activation modulates neuroinflammatory responses and ameliorates IS outcomes could illuminate novel avenues for the treatment of IS.
Inflammasome-mediated cell death and pyroptosis are crucial mechanisms
underlying inflammation-induced neuronal cell death in the IS [27]. The Nod-like
receptor protein 3 (NLRP3) inflammasome recruits an adaptor protein containing
caspase recruitment domain (ASC), an apoptosis-associated speck-like protein that
interacts with the effector pro-caspase-1. Subsequently, pro-caspase-1 is
cleaved, triggering the engagement of caspase-1, which can subsequently mediate
the release of the inflammatory mediators interleukin-1
In this study, we aimed to identify potential biomarkers of IS based on an analysis of the GSE106680, GSE97537, and GSE61616 datasets. Our study focused on validating the impact of CLEC7A as a pivotal gene associated with IS. Currently, numerous cell death pathways, including necroptosis and ferroptosis, have been identified as active in stroke [30, 31]. Using the GSE106680, GSE97537, and GSE61616 datasets, we explored the mechanisms by which CLEC7A influences IS progression, specifically through microglial activation and pyroptosis, using both animal and cellular models. The objective of this study was to thereby establish a theoretical foundation and identify possible therapeutic targets for IS treatment.
The transcriptomic data in this investigation were sourced from the Gene
Expression Omnibus (GEO) repository, hosted by the National Center for
Biotechnology Information (NCBI; https://www.ncbi.nlm.nih.gov/geo/). The related
datasets were retrieved from the GEO database by searching for “Ischemic
stroke”, from which the GSE106680, GSE97537, and GSE61616 datasets were
screened. GEO2R (https://www.ncbi.nlm.nih.gov/geo/geo2r/) was used to analyze the
datasets. Within these three datasets, differentially expressed genes (DEGs)
between the IS and Control groups were identified using the following filtering
criteria: adjusted p-value (adj. p)
The selected overlapping DEGs were analyzed by Gene ontology (GO) functional
enrichment analysis, including the molecular function (MF), biological process
(BP), and cellular component (CC) categories. Kyoto Encyclopedia of Genes and
Genomes (KEGG) pathway analysis was performed using the Database for Annotation,
Visualization, and Integrated Discovery (DAVID,
https://david.ncifcrf.gov/summary.jsp). The p value
The Search Tool for the Retrieval of Interacting Genes (STRING, https://cn.string-db.org/) database was employed to generate protein-protein interaction (PPI) networks based on the identified DEGs, with a confidence score threshold set to 0.4 as an indicator of significance. The topology of the PPI network was visualized using the Cytoscape software, version 3.8.2 (Cytoscape Consortium, Institute for Systems Biology, Seattle, WA, USA). Within Cytoscape, the CytoHubba plugin, version 0.1, was used to calculate the degree of centrality of the protein nodes, facilitating the identification of central hub genes. An enrichment chord diagram was further generated to show the enrichment pathways of the hub genes, and an expression ridgeline map was plotted to display the distribution of hub genes in different sample data using the R package ggplot2. A matrix heat map was created to show the association between the hub genes in the datasets.
Sixty male Sprague-Dawley rats, with ages between 6–8 weeks and body weights
ranging from 230–250 g, were procured from SPF Biotechnology Co. (Beijing,
China). The animals were housed under controlled conditions with a 12-hour
light/dark cycle, and a temperature maintained at 24
This study was designed to minimize any potential harm or distress to the animals involved by adhering to the highest standards of animal welfare and ethical conduct. All animal procedures were conducted in strict accordance with the ARRIVE guidelines. The experimental protocol was carefully reviewed and approved by the Ethics Committee of Hainan Medical University (ethics number: HYLL-2020-140).
We used microglia-specific adeno-associated virus (AAV) vectors (Genechem Co., Ltd. Shanghai, China) for targeted gene manipulation in the microglia. The sequences of the AAV vectors are listed in Supplementary Table 1. The viral vectors were delivered via stereotactic surgery. In brief, rats were anesthetized with 4–5% isoflurane (R510-22-10, RWD Life Sciences, Shenzhen, Guangdong, China) sustained with a concentration of 1–2% isoflurane, and fixed to a stereotactic instrument (51600, Stoelting, Mount Vernon, IL, USA).
The MCAO/R ischemic rat model was constructed as previously described [32]. Anesthesia was induced with 4–5% isoflurane and sustained with a concentration–1–2% isoflurane. After exposing the right carotid bifurcation, an 8-0 silicone-coated filament was gently pushed (9.0–10.0 mm) through the common carotid artery to occlude the middle cerebral artery. Removal of the nylon suture allowed the cerebral blood flow to resume after 1 h of temporary blockage. Rats in the sham group underwent surgical exposure of the common carotid arteries without MCAO/R. Neurobehavioral function and infarct volume were assessed 24 h after reperfusion. Neurological function was assessed using the Zea Longa scoring method, as described previously [33]. According to this scale, the animals were scored as follows: 0, no deficits; 1, inability to fully extend the left forepaw; 2, circling behavior to the left; 3, incapacity to support weight on the left side; and 4, lack of spontaneous ambulation coupled with reduced consciousness. Following neurobehavioral assessment, the rats were anesthetized with 4–5% isoflurane and subsequently euthanized via cervical dislocation to collect brain tissues for further experimental analysis.
The brain tissues were sliced into 1-mm-thick sections using a vibration
microtome (YD-31S, YIDI Medical Appliance CO., Ltd., Jinhua, Zhejiang, China) and
fixed with 4% paraformaldehyde (441244, Sigma, Saint Louis, MO, USA) for 30 min
after being submerged in 2% Triphenyl Tetrazolium Chloride (TTC; PM10798,
CANSPECCHINA, Shanghai, China ) solution for 30 min at 37 °C. Brain
slices were then photographed using a microscope (Leica, Wetzlar, Germany) and
images were analyzed using ImageJ software (version 8.0, the National Institutes
of Health, Bethesda, MD, USA). A red hue denotes live tissues, whereas a pale
color denotes infarcted tissue. The white infarct area/whole slice area
The brain water content was measured using the wet/dry weight method [34]. Brain
slices (3 mm thick) of were cut and divided into ischemic and
non-ischemic hemispheres. The ischemic hemisphere samples were weighed (wet
weight), dried in a vacuum oven at 100 °C for 48 h, and then reweighed
(dry weight). The brain water content (%) was calculated as [(wet weight – dry
weight)/wet weight]
The brain tissue was fixed in 4% paraformaldehyde. Following dehydration and hyalinization, tissues were embedded in paraffin to prepare sections. The sections were subsequently dehydrated using a gradient of 50%–70%–80%–90%–95%-absolute ethanol. After dehydration, the tissues were placed in a 1:1 solution of anhydrous ethanol and xylene for 30 min, and permeated in a pure xylene solution. Subsequently, paraffin sections were stained with hematoxylin (H3136-25G, Sigma, Saint Louis, MO, USA) and alcoholic eosin (E4009, Sigma, Saint Louis, MO, USA). The HE-stained images were examined using an optical microscope (Leica).
Immunofluorescence staining was performed to detect the expression of Iba-1. The paraffin-embedded brain tissue sections were deparaffinized in xylene and rehydrated using a graded ethanol series. Subsequently, ethylenediaminetetraacetic acid (pH 8.0) was used for antigen retrieval, and the sections were washed with phosphate buffered saline (PBS). Subsequently, the sections were incubated in an autofluorescence quencher reagent for 5 min, rinsed with running water for 10 min, and incubated with 5% bovine serum albumin for 30 min to block nonspecific reactions. Next, the sections were incubated with anti-Iba-1 (1:400; ab283319, Abcam, Cambridge, UK) antibody for 15 h at 4 °C. The sections were then washed three times with PBS and incubated with the appropriate secondary antibody (1:200; Abcam) for 90 min. Finally, the sections were covered with a sealer containing 4′,6-diamidino-2-phenylindole (DAPI), imaged, and analyzed using ImageJ software, version 1.53t (Wayne Rasband, U.S. National Institutes of Health, Bethesda, MD, USA).
Terminal Deoxynucleotidyl Transferase-mediated Nick End Labeling (TUNEL) staining was performed using a commercial in situ cell death detection kit (Roche, Basel, Switzerland). Tissue sections were deparaffinized and rehydrated, followed by a 15-minute digestion with Proteinase K at 10 mmol/L. The treated slides were then incubated in the TUNEL reaction mix for 6 minutes at 37 °C, shielded from light. After staining with DAPI (P36931, Invitrogen, Carlsbad, CA, USA), the cell nuclei were observed under a fluorescence microscope (LWP300-38LFT, CEWEI OPTOELECTRONIC TECHNOLOGY Co., Ltd., Shanghai, China). Nuclei appeared blue under a microscope, whereas green fluorescence indicates the presence of apoptotic cells. The apoptosis index of TUNEL-stained tissues was assessed using the TUNEL index (%), which was calculated as the ratio of TUNEL-positive cells to total cells.
HT22 mouse hippocampal neurons and BV2 mouse microglia cells were obtained from iCell Bioscience, Inc. (Shanghai, China). Both cell lines used in this study were authenticated using Short Tandem Repeat (STR) profiling to confirm species identification prior to commencing the experiments. The authentication confirmed the genetic identity of these cell lines. Upon receipt, the cells were immediately amplified and used for experiments within a short timeframe to ensure stability. All cell lines were tested for mycoplasma contamination prior to use to guarantee the accuracy of the experimental results. The test results were negative, indicating that the cells were free of contamination. Regular testing was conducted throughout the experiments to maintain cleanliness of the cell lines.
The cells were maintained in Dulbecco’s modified Eagle’s medium (DMEM; Gibco, New York, NY, USA) containing 10% fetal bovine serum (FBS; A5670701, Gibco) and 1% penicillin-streptomycin. Cells were incubated at 37 °C with 5% CO2. CLEC7A was knocked down in BV2 cells using three small interfering RNAs (siRNAs; GenePharma Co., Ltd., Shanghai, China) targeting the coding sequence of CLEC7A. Transfection was carried out using the Lipofectamine 3000 liposome transfection kit in accordance with the manufacturer’s instructions (L3000008, Thermo Fisher Scientific, Wilmington, DE, USA). Neuron-microglia co-cultures were seeded in 24-well plates and incubated for 3 days. BV-2 microglia were seeded into the Transwell inserts with a pore size of 0.4 µm at a density that maintained a microglia-to-neuron ratio of 1:2. HT22 and BV2 cells were co-cultured for 2 days before oxygen-glucose deprivation/reperfusion (OGD/R) treatment.
The cells were divided into Control, OGD/R, OGD/R+si-CLEC7A, and OGD/R+si-CLEC7A+nigericin groups. HT22 cells in the OGD/R+si-CLEC7A+Nigericin group were treated with Nigericin (HY-127019, pyroptosis activator,10 µM; MedChemExpress, Shanghai, China) for 1 h. An in vitro model for reperfusion after IS was established, as previously described [33]. In brief, the cells were maintained in DMEM without glucose and transferred to a modular incubation chamber. Subsequently, the cells were exposed to a gas mixture of 95% N2 and 5% CO2 at a flow rate of 3 L/min for 15 min. The chamber was subsequently sealed and transferred to an incubator maintained at 37 °C. The OGD/R treatment was performed for 4 h. After OGD/R, the cells were incubated under normal conditions in regular culture medium for 12 h.
Cell viability was assessed using the Cell Counting Kit-8 (CCK-8) (521942,
Biosharp, Beijing, China) according to the manufacturer’s protocol. For each
treatment group, the cells (1
RNA was isolated using TRIZOL reagent (Invitrogen). Subsequently, the RNA concentration and absorbance at wavelengths of 260 and 280 nm were precisely measured using a spectrophotometer (OSE-260-03, TIANGEN, Beijing, China) after dilution in RNase-free ultrapure water. cDNA was synthesized using Hiscript II QRT Supermix for the qPCR Reverse Transcription Kit (R222-01, Vazyme, Nanjing, Jiangsu, China). The process of reverse transcription for the synthesis of cDNA templates was carried out using a Polymerase Chain Reaction amplifier (T100, BIO-RAD, Hercules, CA, USA), with the following reaction conditions: 25 °C for 5 minutes; 42 °C for 30 minutes; and 85 °C for 5 seconds. Reverse Transcription-Polymerase Chain Reaction (RT-qPCR) was performed on an ABI7500 quantitative PCR instrument (Applied Biosystems, Foster City, CA, USA). The PCR reaction conditions were set as an initial denaturation step at 95 °C for 30 seconds, followed by 40 cycles consisting of denaturation at 95 °C for 10 seconds, and annealing at 60 °C for 30 seconds. The glyceraldehyde-3-phosphate dehydrogenase (GAPDH) served as an internal control. The Ct values were quantified using the 2-ΔΔCt method, and each assay was triplicated. The primer sequences are listed in Supplementary Table 2.
Total protein was fractionated using 10% sodium dodecyl sulfate-polyacrylamide
gel electrophoresis (SDS-PAGE) and subsequently transferred onto Polyvinylidene
Difluoride (PVDF) membranes (1620177, BIO-RAD). Membranes were blocked with 5%
non-fat milk for 2 h. The primary antibodies (Abcam): anti-CLEC7A
(1:2000); anti-Caspase-1 (1:2000), anti-GSDMD (1:2000), anti-NLRP3 (1:2000),
anti-Iba-1 (1:2000), and anti-
To detect the concentrations of IL-1
Data analysis was performed using GraphPad Prism software (version 9.0,
Dotmatics, Boston, MA, USA), and the results were expressed as mean values
From the GSE106680 dataset, we selected three control and three IS samples for analysis. From these, we identified 4558 DEGs, including 2557 upregulated and 2001 downregulated genes. From the GSE97537 dataset, which included 5 control and 7 IS samples, we identified 250 DEGs, of which 240 were upregulated and 10 were downregulated. The GSE61616 dataset comprised five control and five IS samples, from which we screened 2463 DEGs, including 1809 upregulated and 654 downregulated genes. DEGs from both datasets were subjected to clustering analysis to create a volcano plot illustrating notable up- and down-regulated genes between the control and IS samples (Fig. 1A). We selected the top 10 upregulated and downregulated DEGs from each dataset to create a heat map for visualization (Fig. 1B). A Venn diagram showed 140 overlapping DEGs across the three datasets, with 138 upregulated and two downregulated genes, was finally created (Fig. 1C).
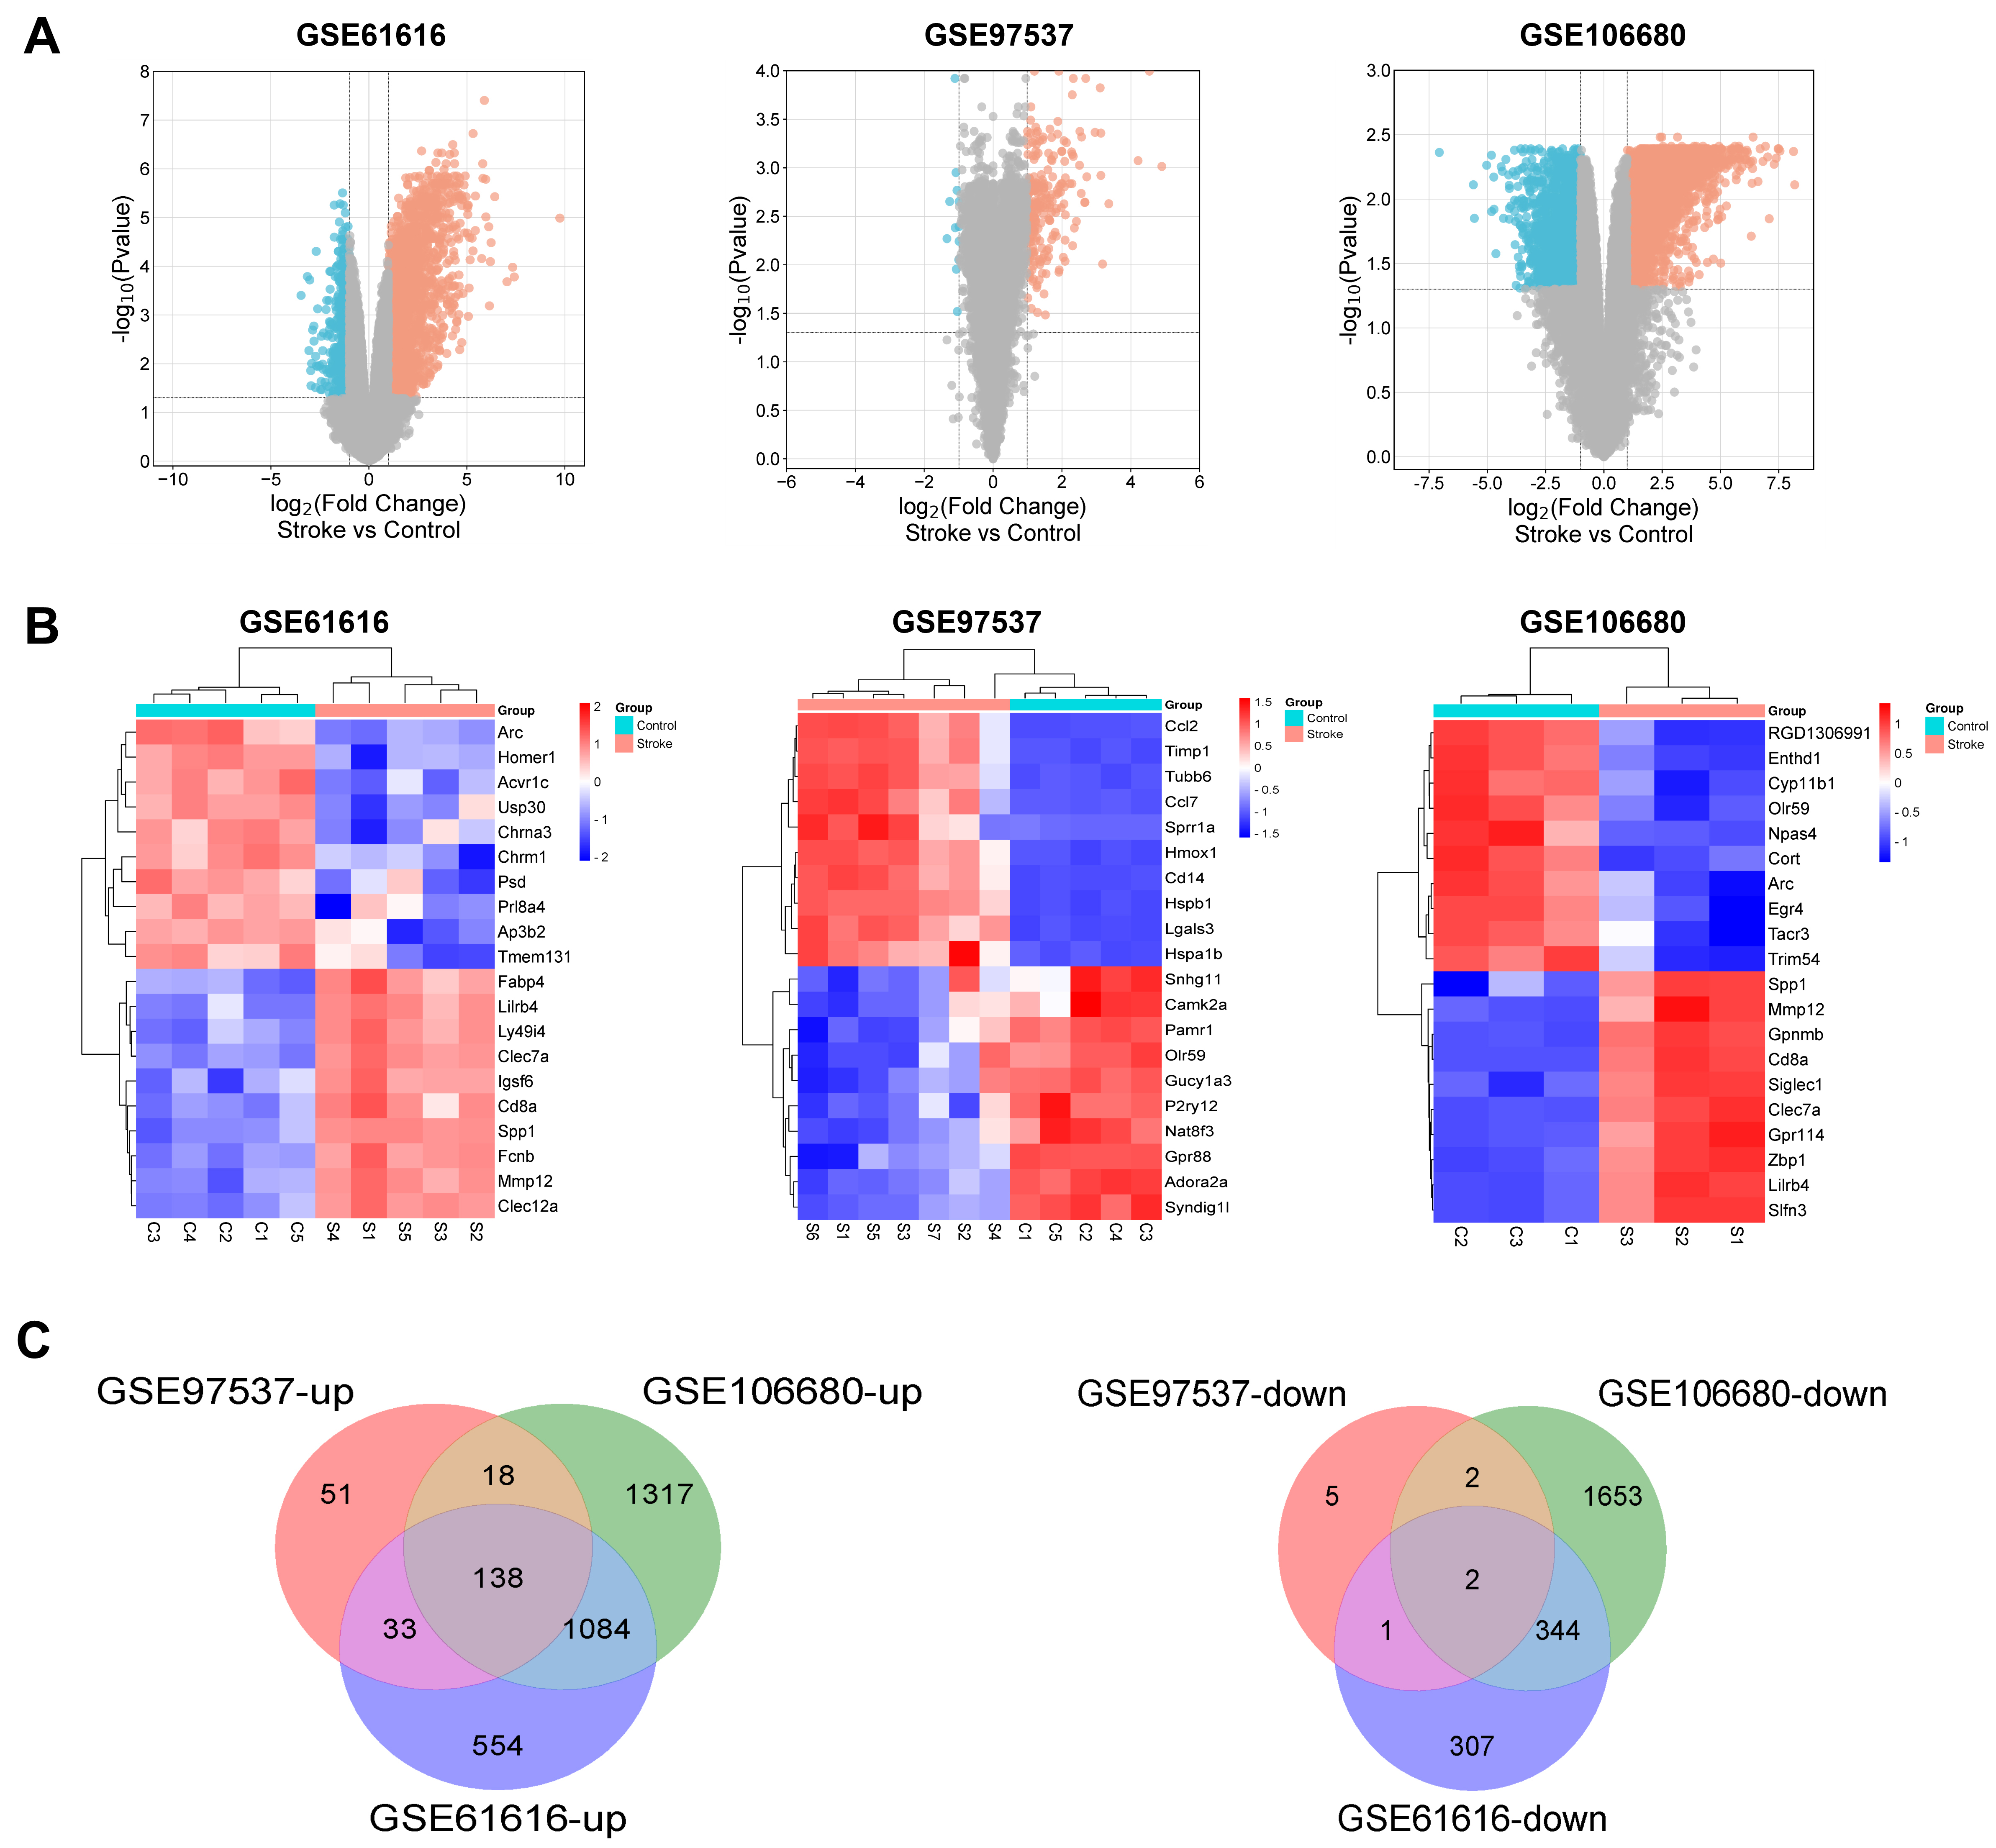 Fig. 1.
Differentially expressed genes (DEGs) identification. (A) Volcano plots of DEGs in GSE106680, GSE97537, and GSE61616 datasets; The x-axis represents log2FoldChange, while the y-axis corresponds to –log10. Red dots denote genes with increased expression (up-regulated DEGs), and blue dots denote genes with decreased expression (down-regulated DEGs). (B) Heat map of DEGs in GSE106680, GSE97537, and GSE61616 datasets. (C) Venn diagram of DEGs. The number in each circle represents the number of DEGs in the dataset. The overlapping area between circles indicates the common DEGs found in all three datasets: GSE106680, GSE97537, and GSE61616.
Functional analysis was performed on the 140 common DEGs. The GO enrichment results for these DEGs were organized into categories. For each category, the six GO terms with the most significant enrichment, indicated by the lowest p-values, were identified and illustrated in the GO enrichment dot plot (Fig. 2A). Furthermore, KEGG pathway analysis of the DEGs revealed the 10 most significantly enriched pathways based on the lowest p-values, which are shown in the KEGG pathway enrichment dot plot (Fig. 2B).
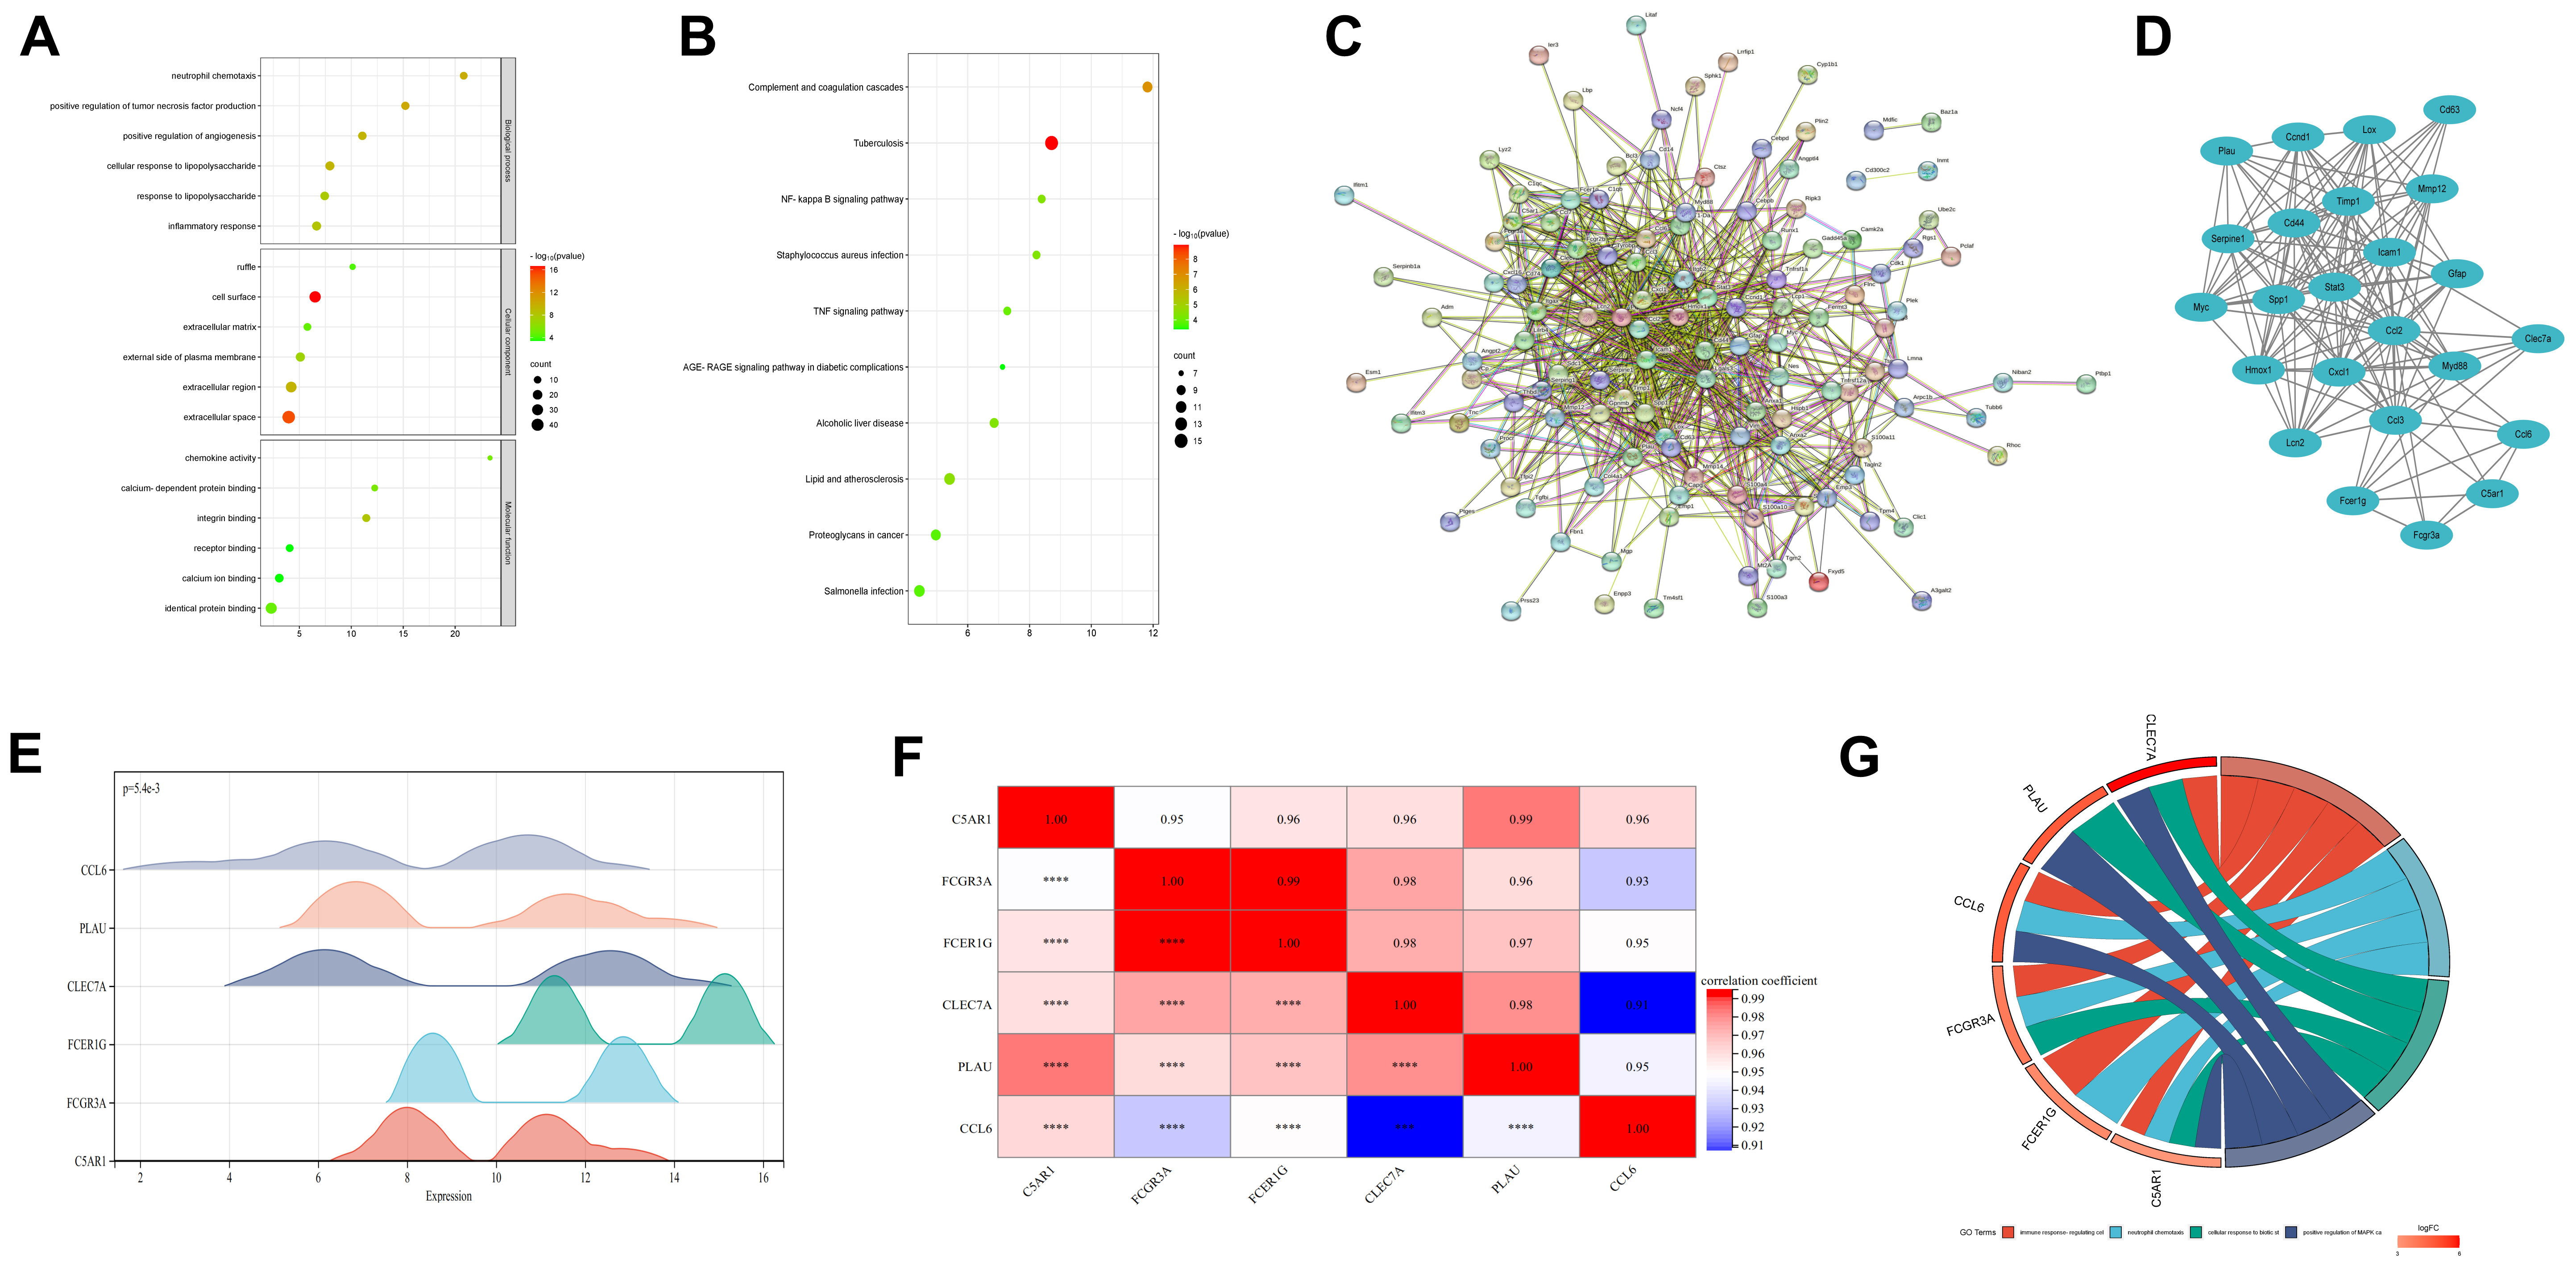 Fig. 2.
Enrichment analysis and hub genes analysis. (A) Gene Ontology enrichment dot plot. (B) Kyoto Encyclopedia of Genes and Genome pathway enrichment dot plot. (C) Protein-protein interaction (PPI) network of DEGs. (D) Key modules containing hub genes. (E) Gene expression ridgeline plot of hub genes. The x-axis displays gene expression levels, while the ridge shape illustrates the data distribution within each group. The height of the ridge indicates the number of samples corresponding to that particular gene expression level. (F) The matrix heatmap of GSE61616 dataset. (G) Gene Ontology enrichment chord diagram, consisting of three parts: genes, LogFold Change (representing the fold change of genes for sorting and color-coding gene blocks), and Gene ontology (GO) terms. Different connections between genes indicate their involvement in specific GO terms. NF, nuclear factor; TNF, tumor necrosis factor; AGE-RAGE, advanced glycosylation end-product specific receptor. *** indicates that the p-value is less than 0.001. **** indicates that the p-value is less than 0.0001.
A PPI network was constructed (Fig. 2C), and the PPI network model was visualized using the Cytoscape software, while the Molecular Complex Detection (MCODE) plugin from the CytoHubba plugin suite was used to identify the highest-scoring functional complexes related to the IS within the PPI network. We selected the top-rated Module 1 (24 nodes and 152 edges). Subsequently, we selected hub genes of interest from the top-rated module 1 (Fig. 2D). Fc fragment of Immunoglobulin G (IgG) receptor IIIa (FCGR3A), Fc fragment of Immunoglobulin E (IgE) receptor Ig (FCER1G), Complement component 5a receptor 1 (C5AR1), CLEC7A, Plasminogen activator, urokinase (PLAU), and C-C motif chemokine ligand 6 (CCL6) were screened for subsequent analysis. We finally plotted a ridgeline map using the hub gene expression in the GSE61616 dataset (Fig. 2E). The shape of the ridgelines indicates dispersion within the GSE61616 dataset, with the height of each line representing the number of samples at the corresponding gene expression level, providing an intuitive understanding of both the central tendency and variability in gene expression across the sample population. The matrix heatmap of the expression profile data from GSE61616 revealed the correlation of hub genes across different sample datasets (Fig. 2F). An enrichment chord diagram was further generated to display the relationship between proteins and pathways, as well as to indicate changes in pathway function, which comprised three main components: genes, the fold change in gene expression used for sorting and color-coding of gene blocks, and columns representing GO terms (Fig. 2G).
The brain tissue of rats in the MCAO/R group showed a considerable infarction
(34.11
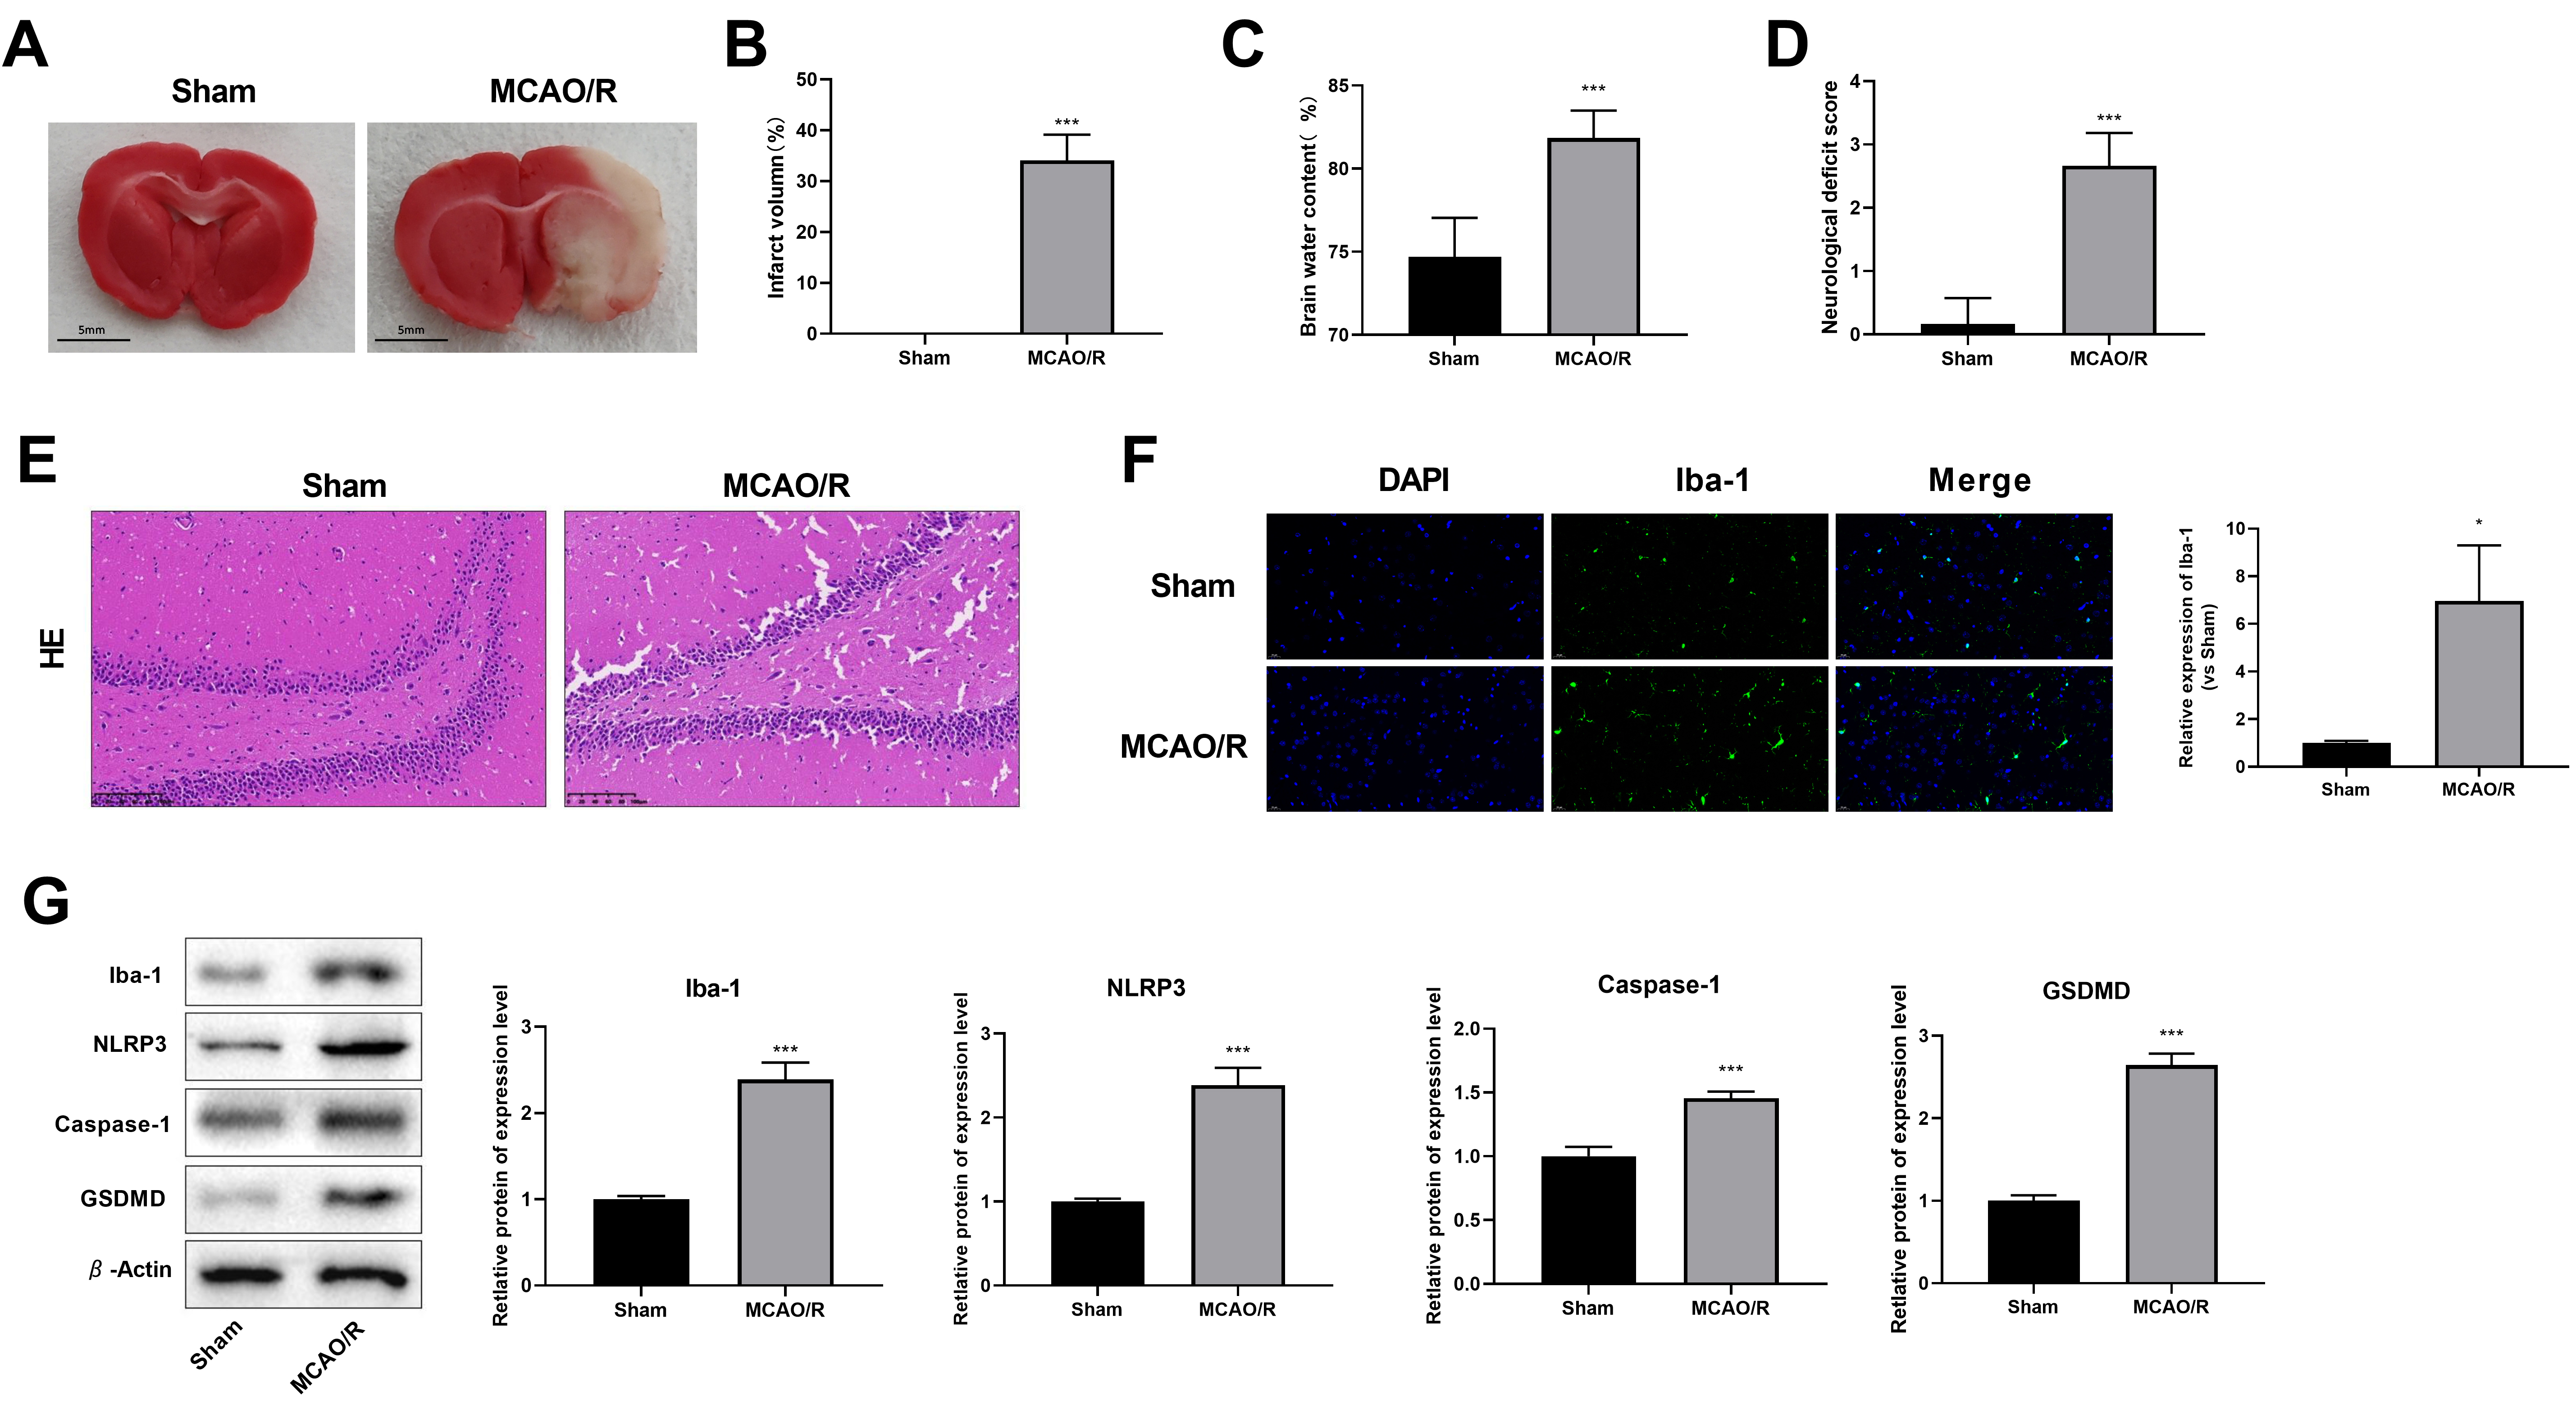 Fig. 3.
The expression levels of Iba-1, GSDMD, Caspase-1, and NLRP3 were
evaluated in rats after middle cerebral artery occlusion and reperfusion
(MCAO/R). (A) Triphenyl Tetrazolium Chloride (TTC) staining. Scale: 5 mm. (B) Infarct volume.
(C) Brain water content. (D) Neurological deficit score. (E) Representative
images of hematoxylin & eosin (HE) staining (Amplification:
200
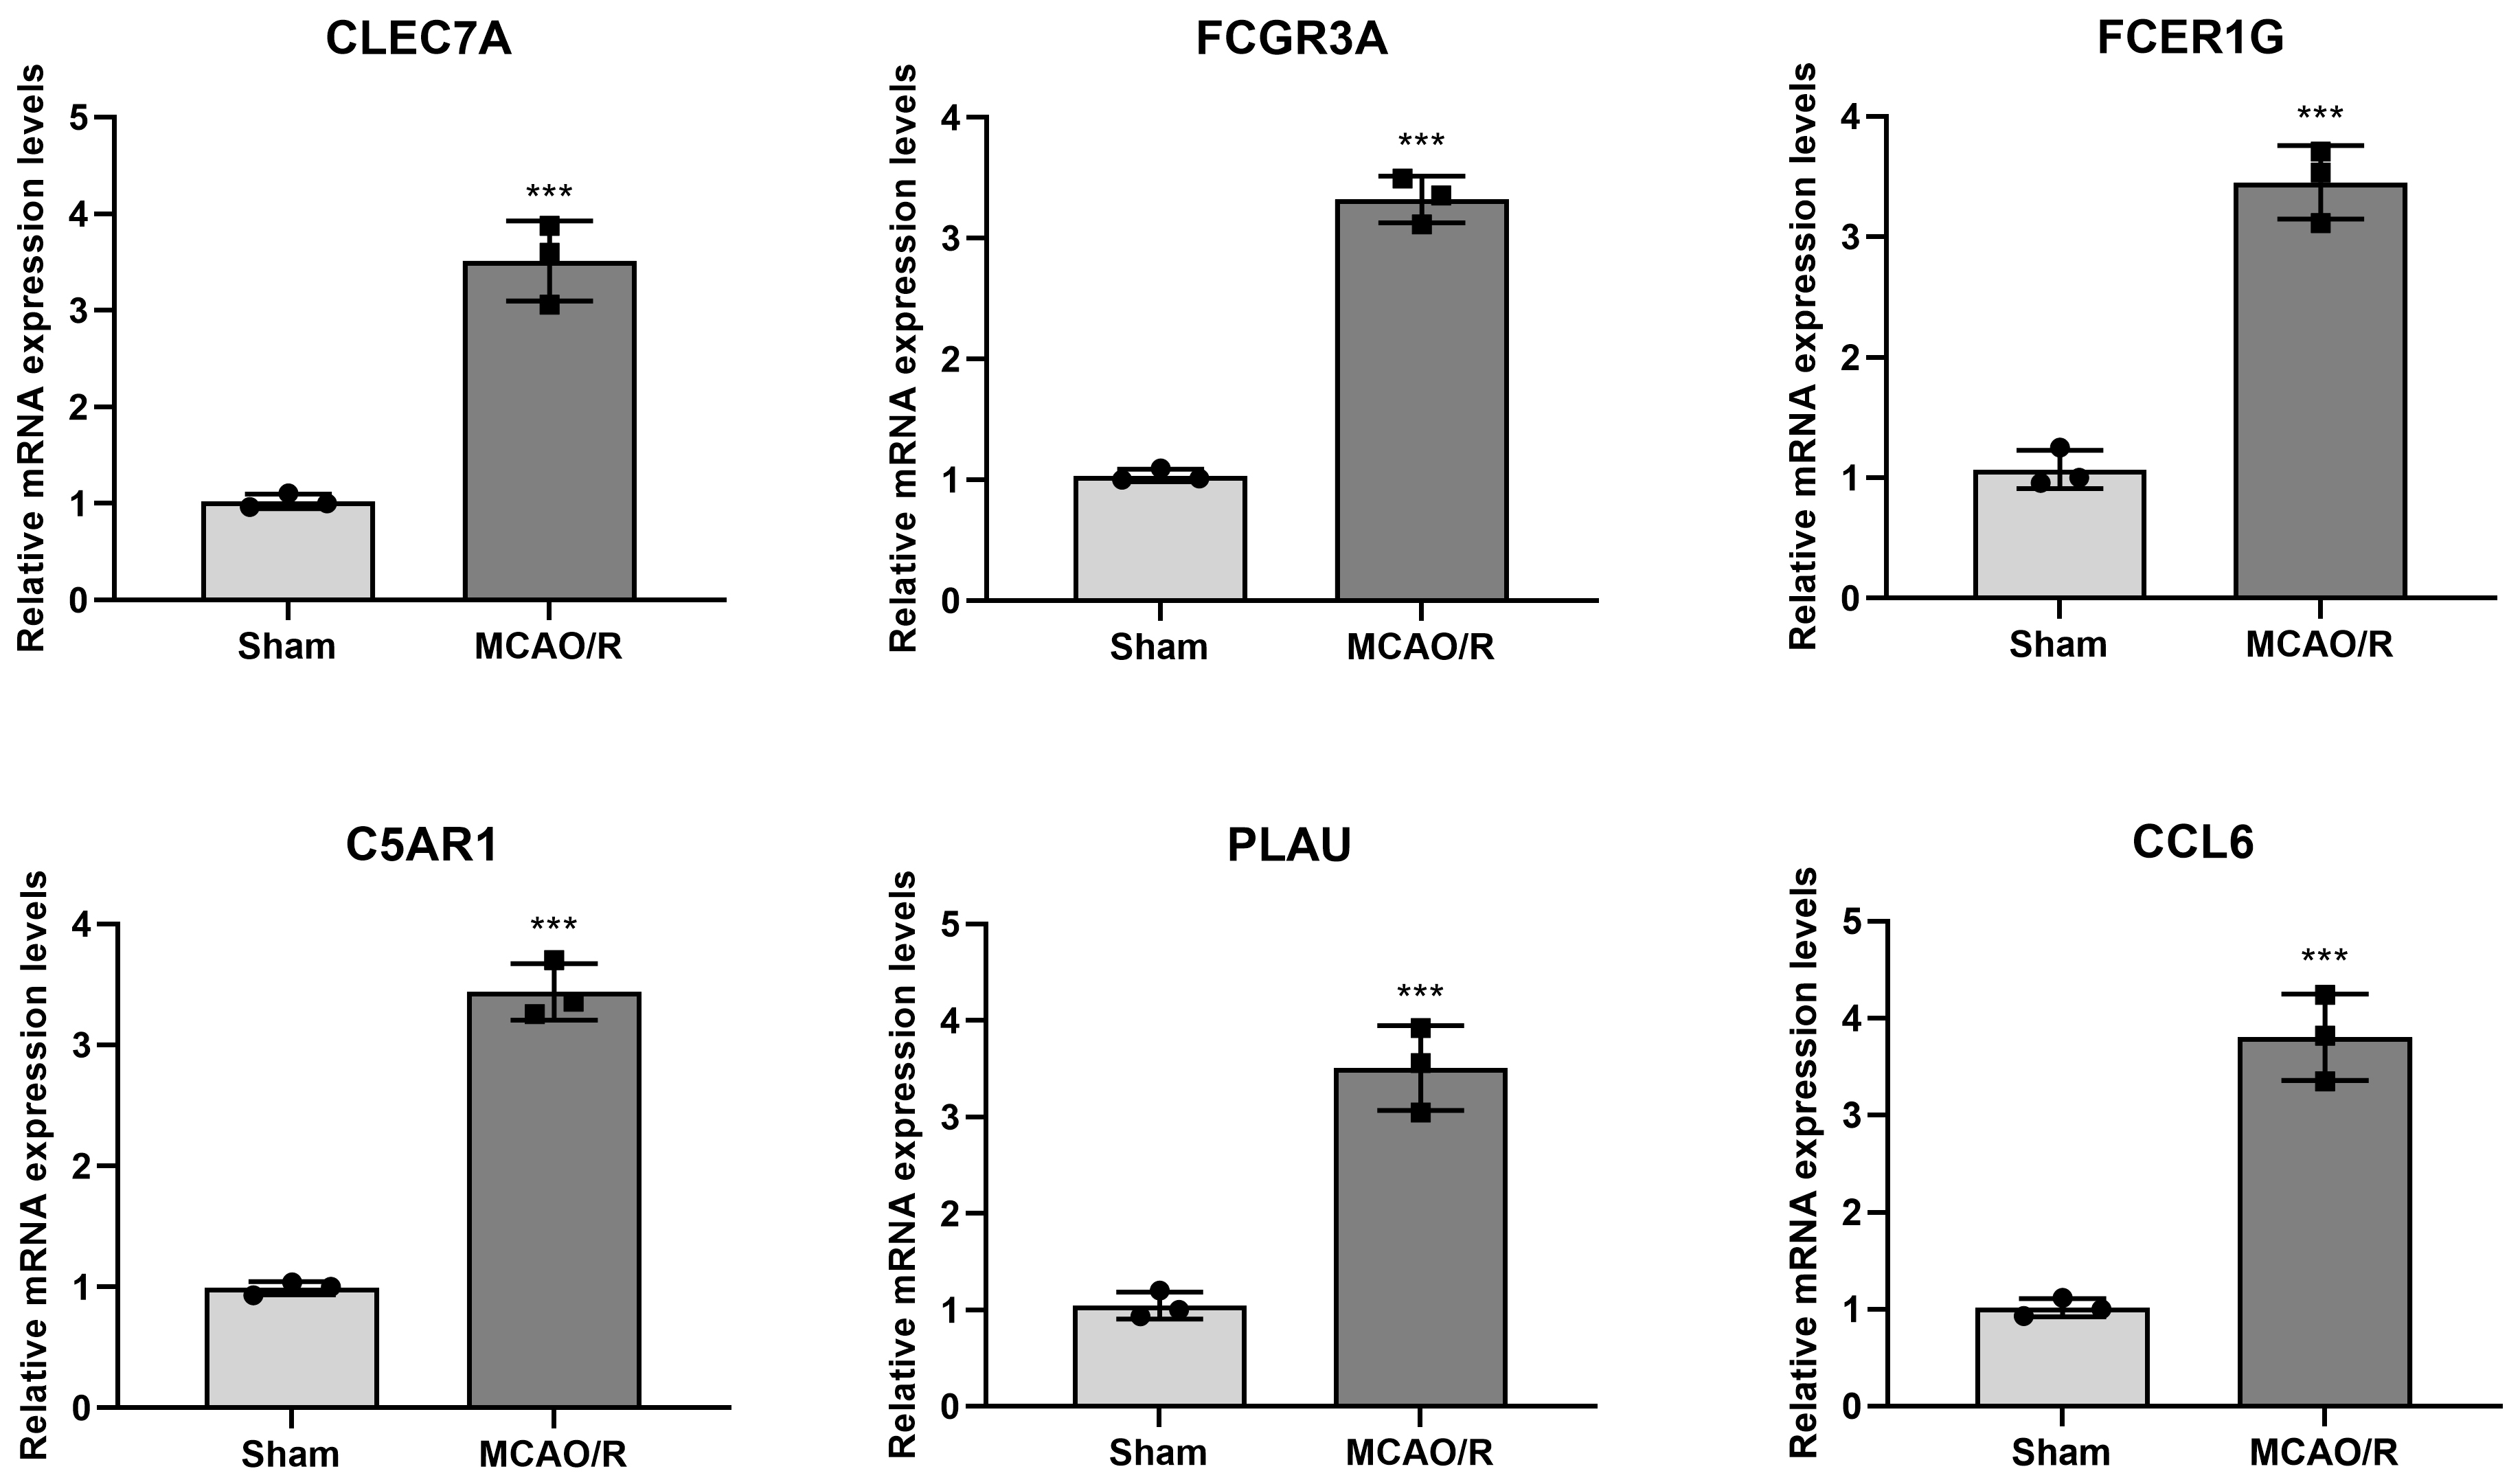
The mRNA expression levels of hub genes (FCGR3A, FCER1G,
C5AR1, CLEC7A, PLAU, and CCL6) in the brain
tissue (N = 6) were determined by RT-qPCR. The results indicated that the relative mRNA expression
levels of FCGR3A (3.32
 Fig. 4.
The mRNA expression levels of FCGR3A, FCER1G, C5AR1,
CLEC7A, PLAU, and CCL6 in brain tissues were detected by
reverse transcription-quantitative polymerase chain reaction
(RT-qPCR). ***p
A comprehensive literature review revealed that the roles of FCGR3A,
FCER1G, C5AR1, PLAU, and CCL6 in IS and other central nervous system
disorders have all been extensively studied [35, 36, 37, 38, 39]. Consequently,
CLEC7A was deliberately chosen as the research object for IS in this
study. For CLEC7A siRNA transfection, si-CLEC7A-1 (0.28
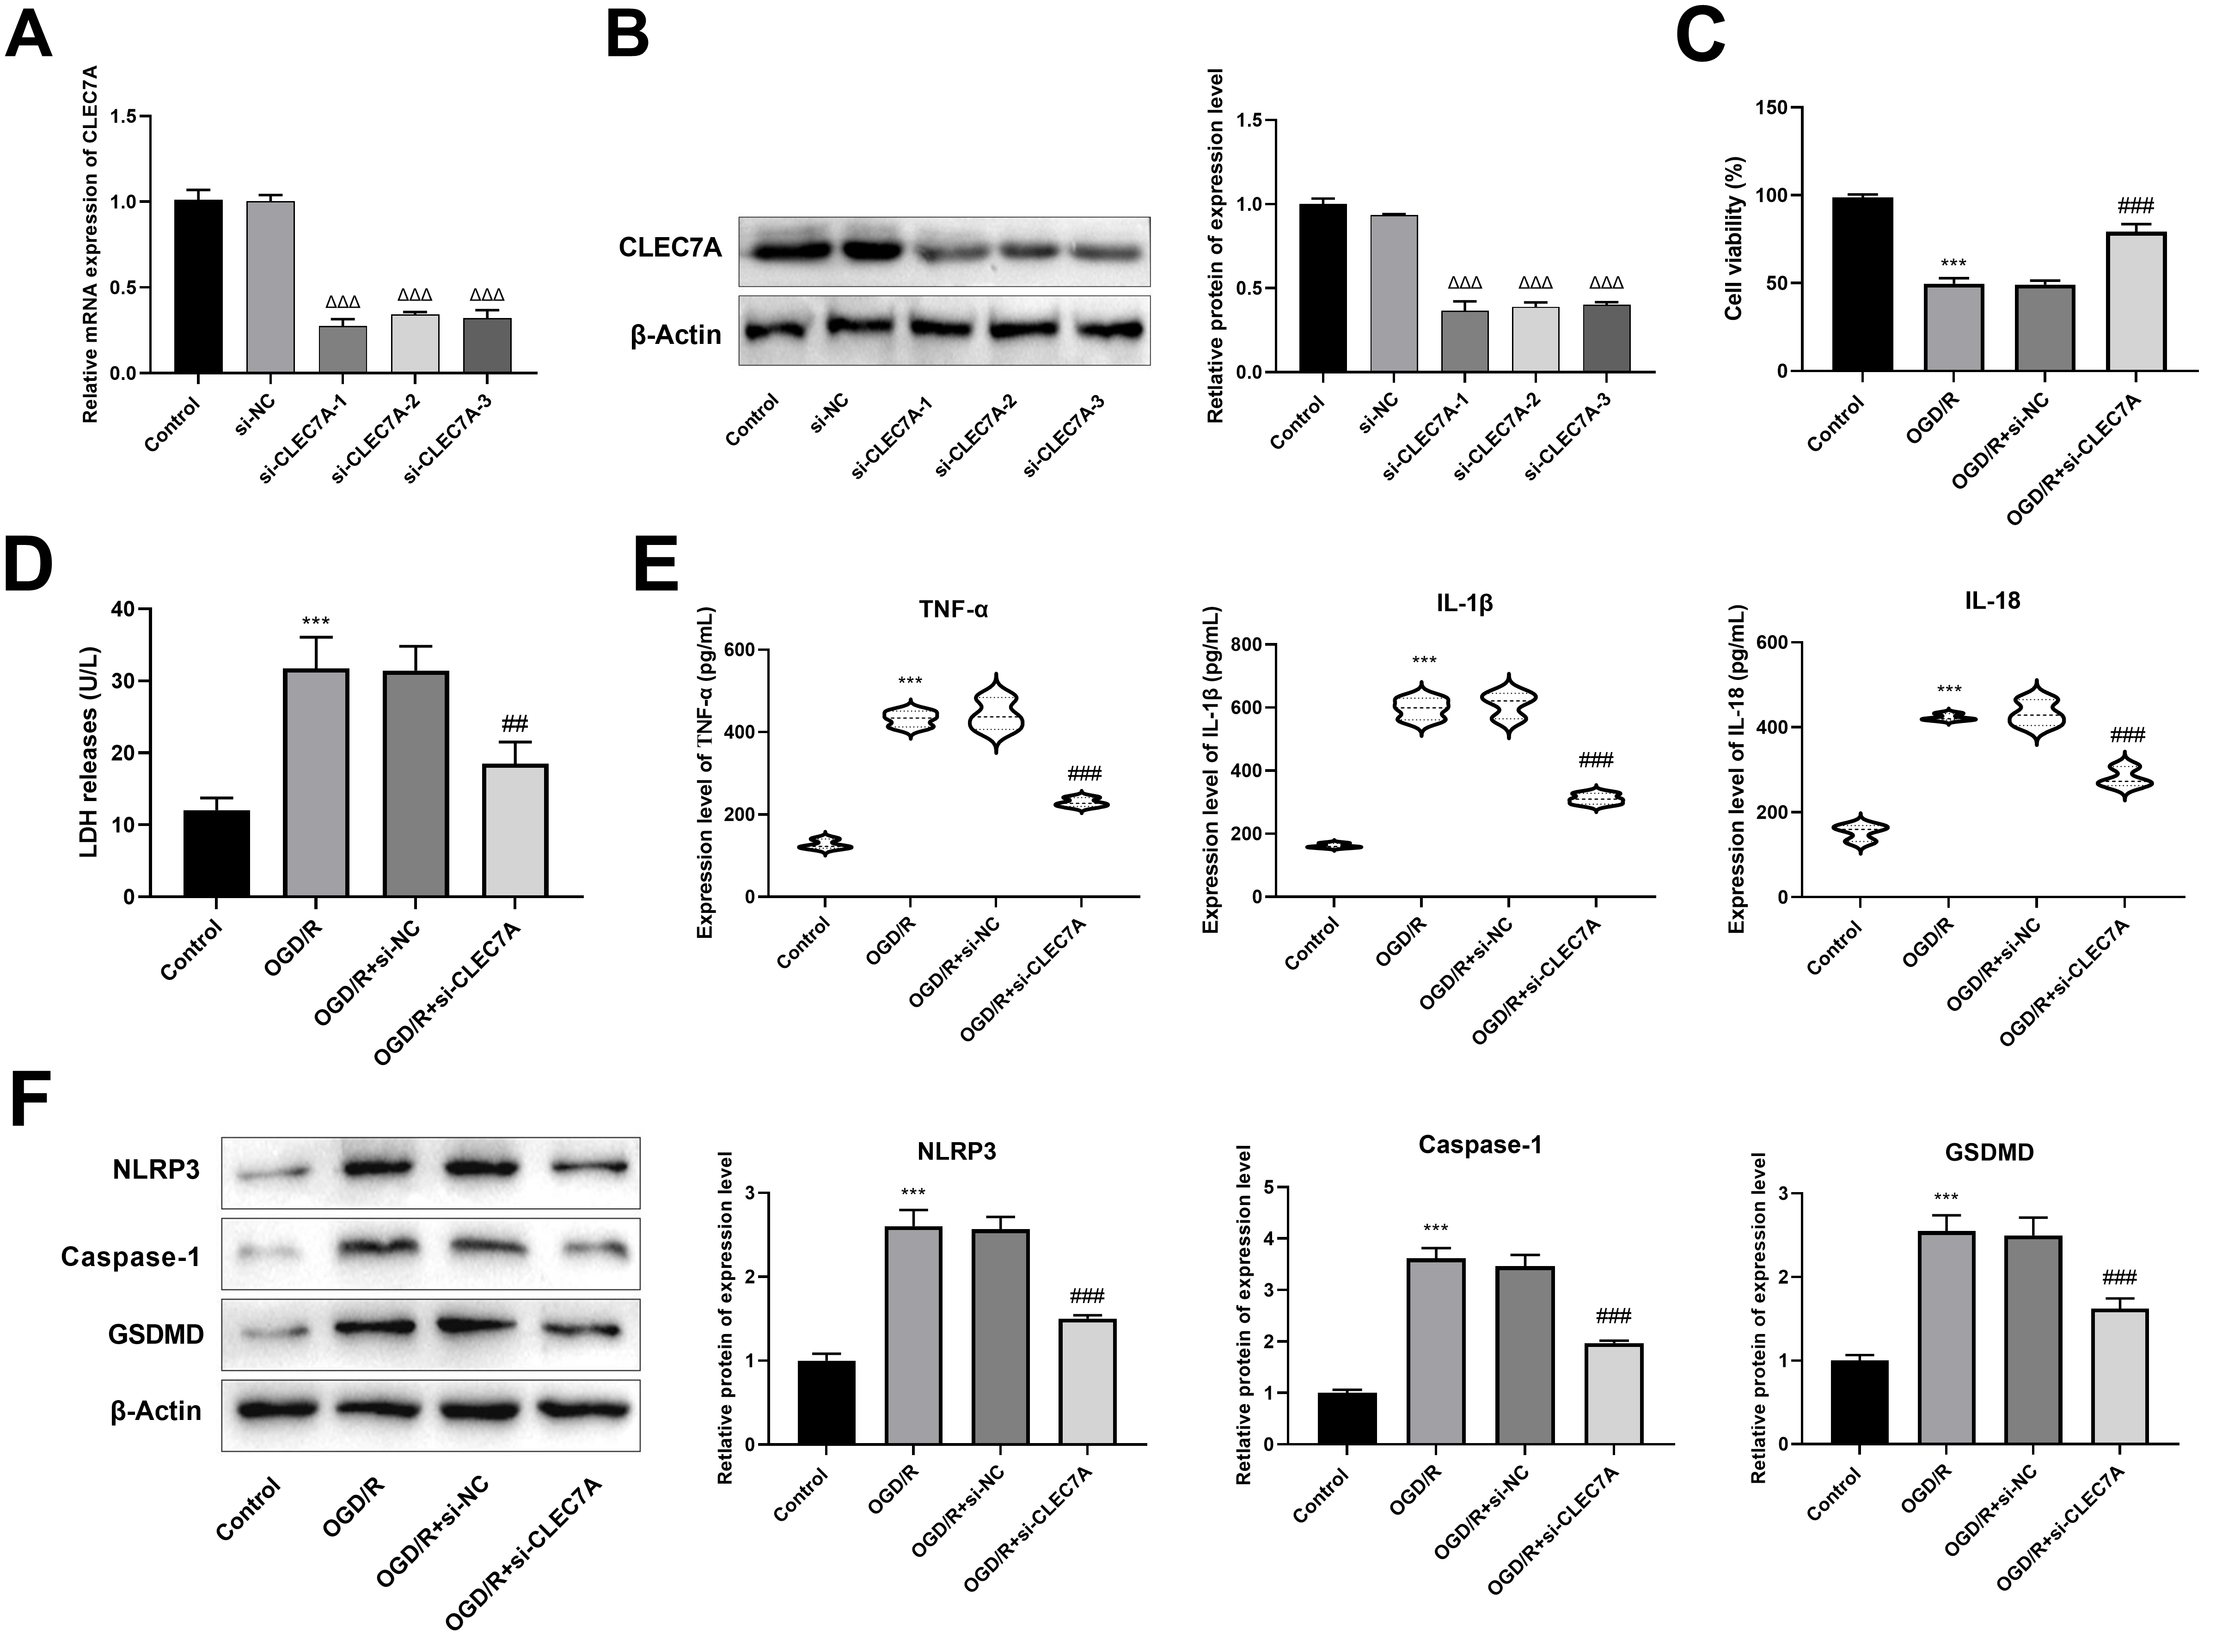 Fig. 5.
CLEC7A knockdown in BV cells promotes viability and
inhibits pyroptosis of HT22 cells after oxygen-glucose deprivation/reperfusion
(OGD/R) model. (A) The transfection efficiency was detected by RT-qPCR. (B) The
transfection efficiency was detected by western blot. (C) Cell
counting kit-8 (CCK-8) was used to detect cell viability of HT22 cells. (D) The
level of lactate dehydrogenase (LDH) was detected by enzyme-linked immunosorbent
assay (ELISA). (E) The levels of interleukin (IL)-1
TTC staining revealed that CLEC7A knockdown significantly reduced the
infarction caused by cerebral ischemia (N = 6, 15.00
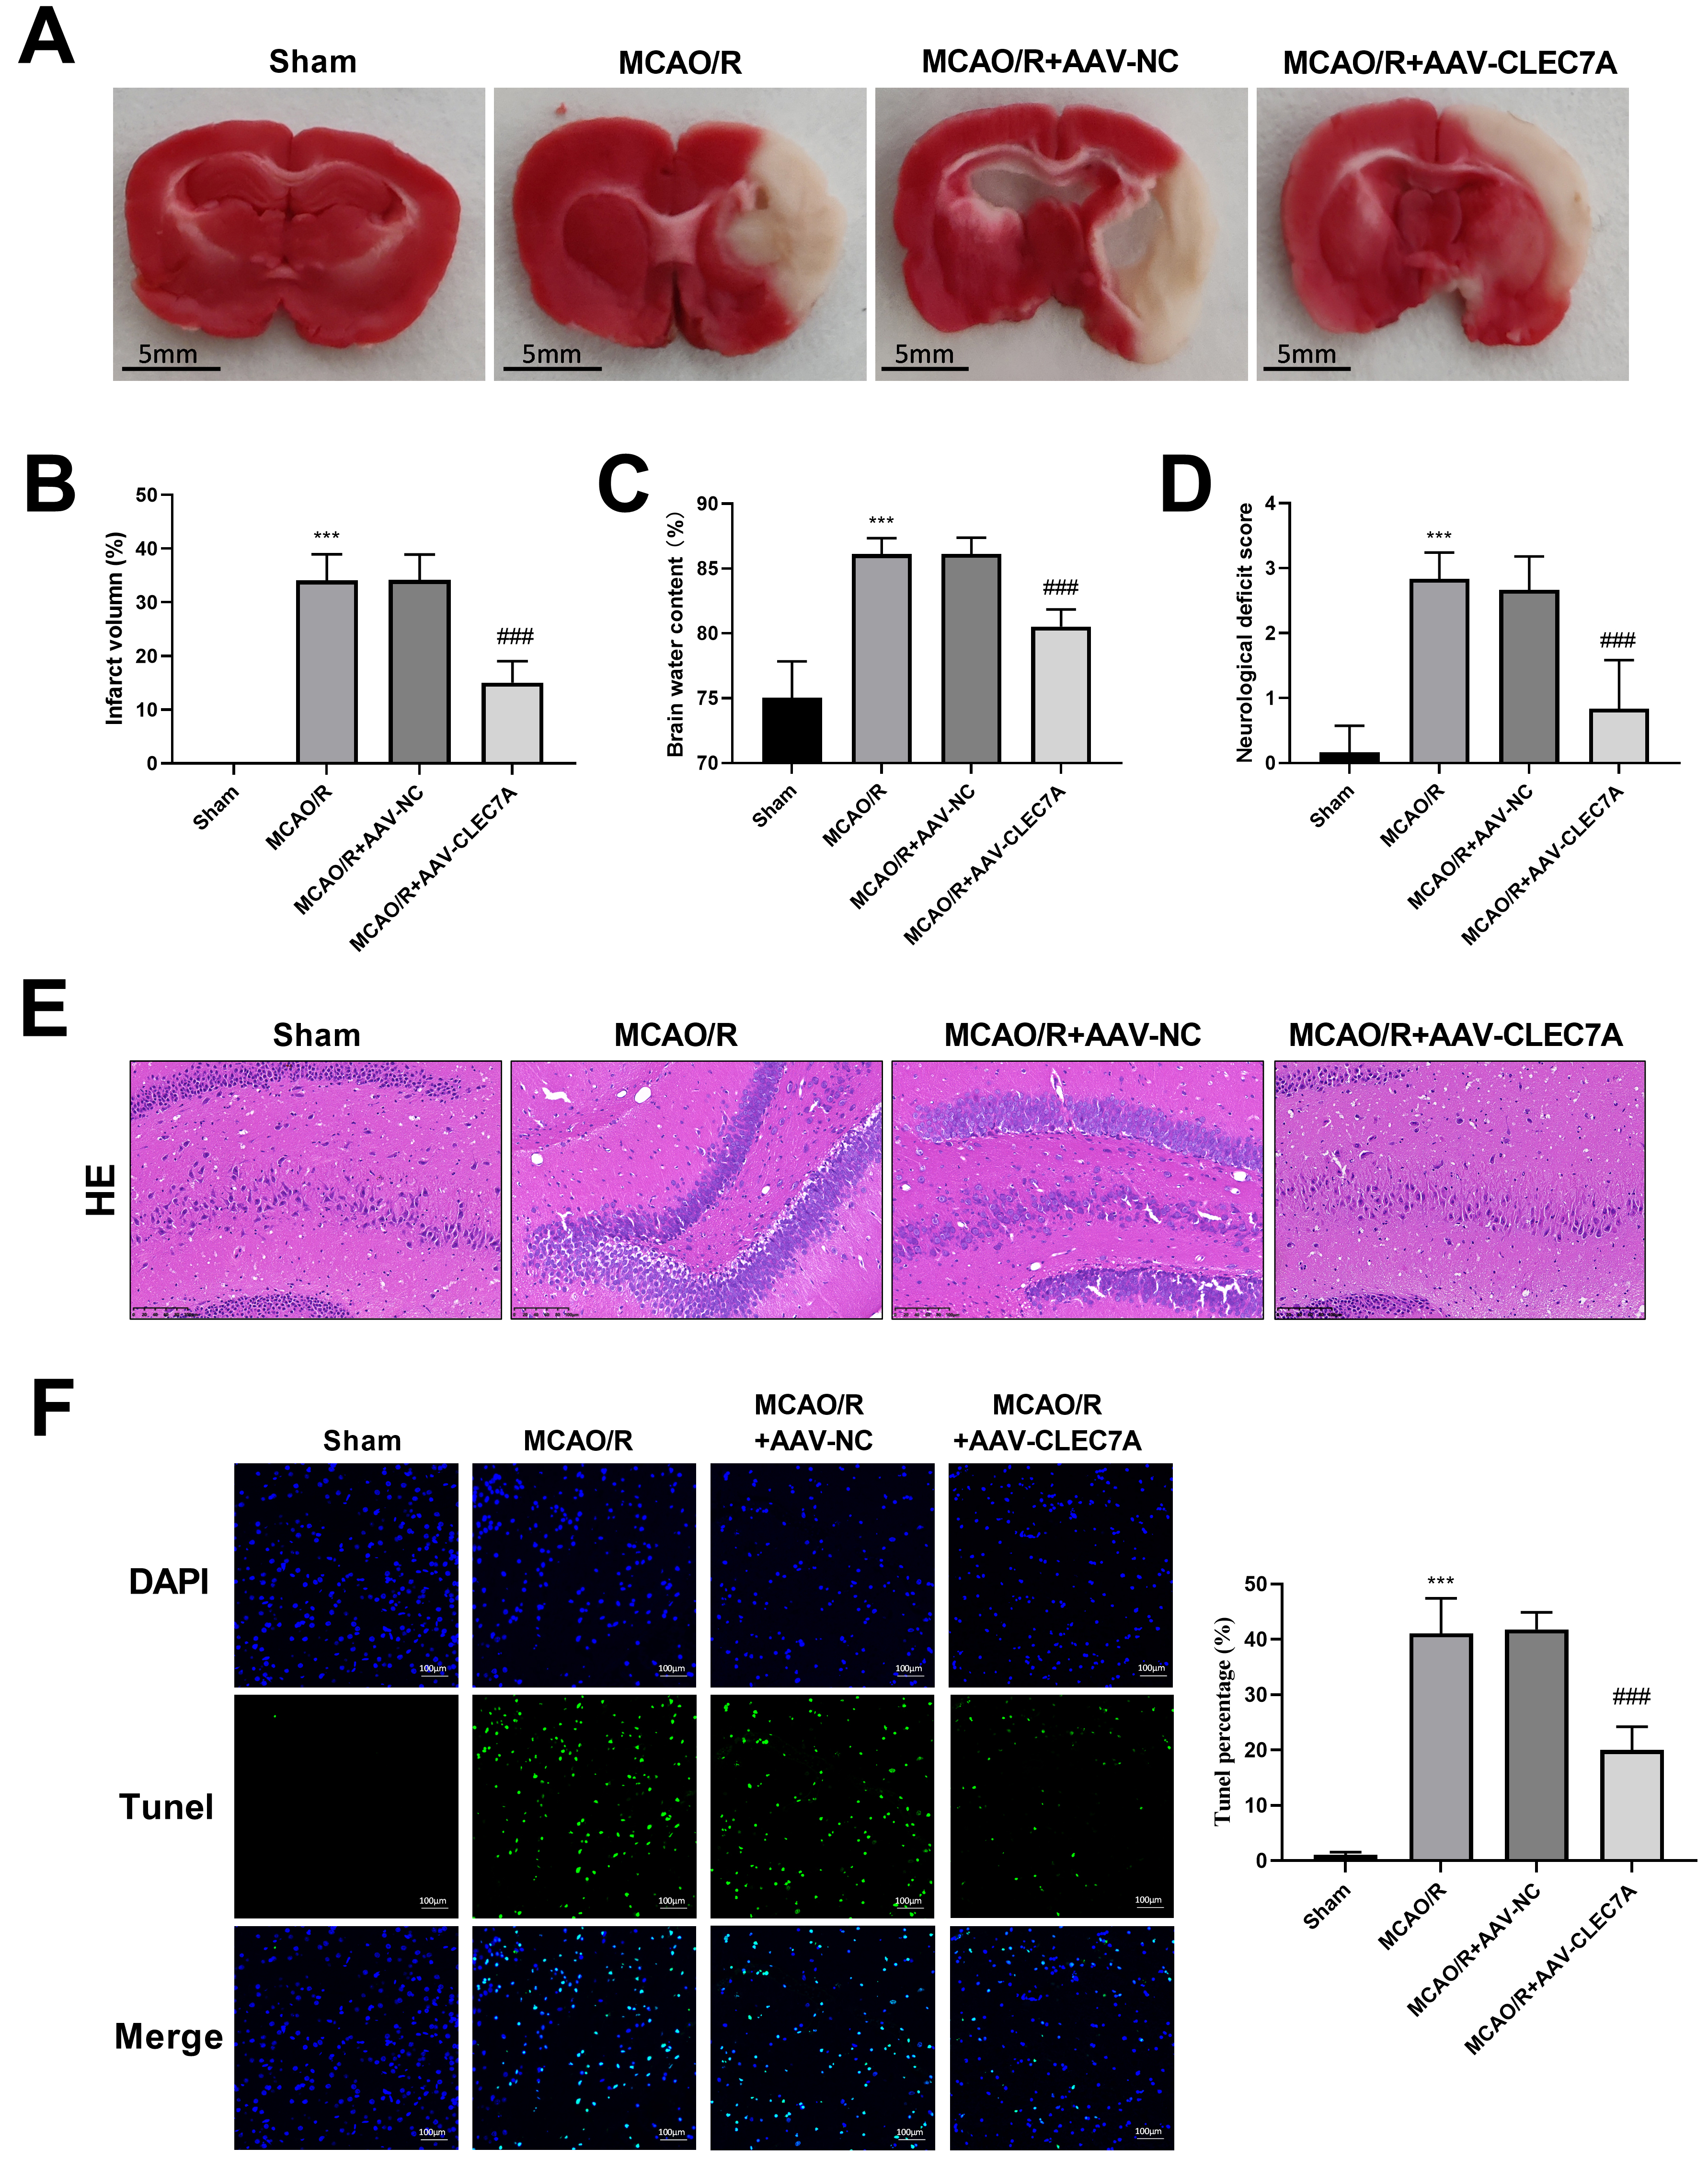 Fig. 6.
Knockdown of CLEC7A alleviates ischemic stroke in
MCAO/R model. (A) TTC staining. Scale: 5 mm. (B) Infarct volume. (C) Brain water content. (D)
Neurological deficit score. (E) Representative images of HE staining
(Amplification: 200
The concentrations of IL-1
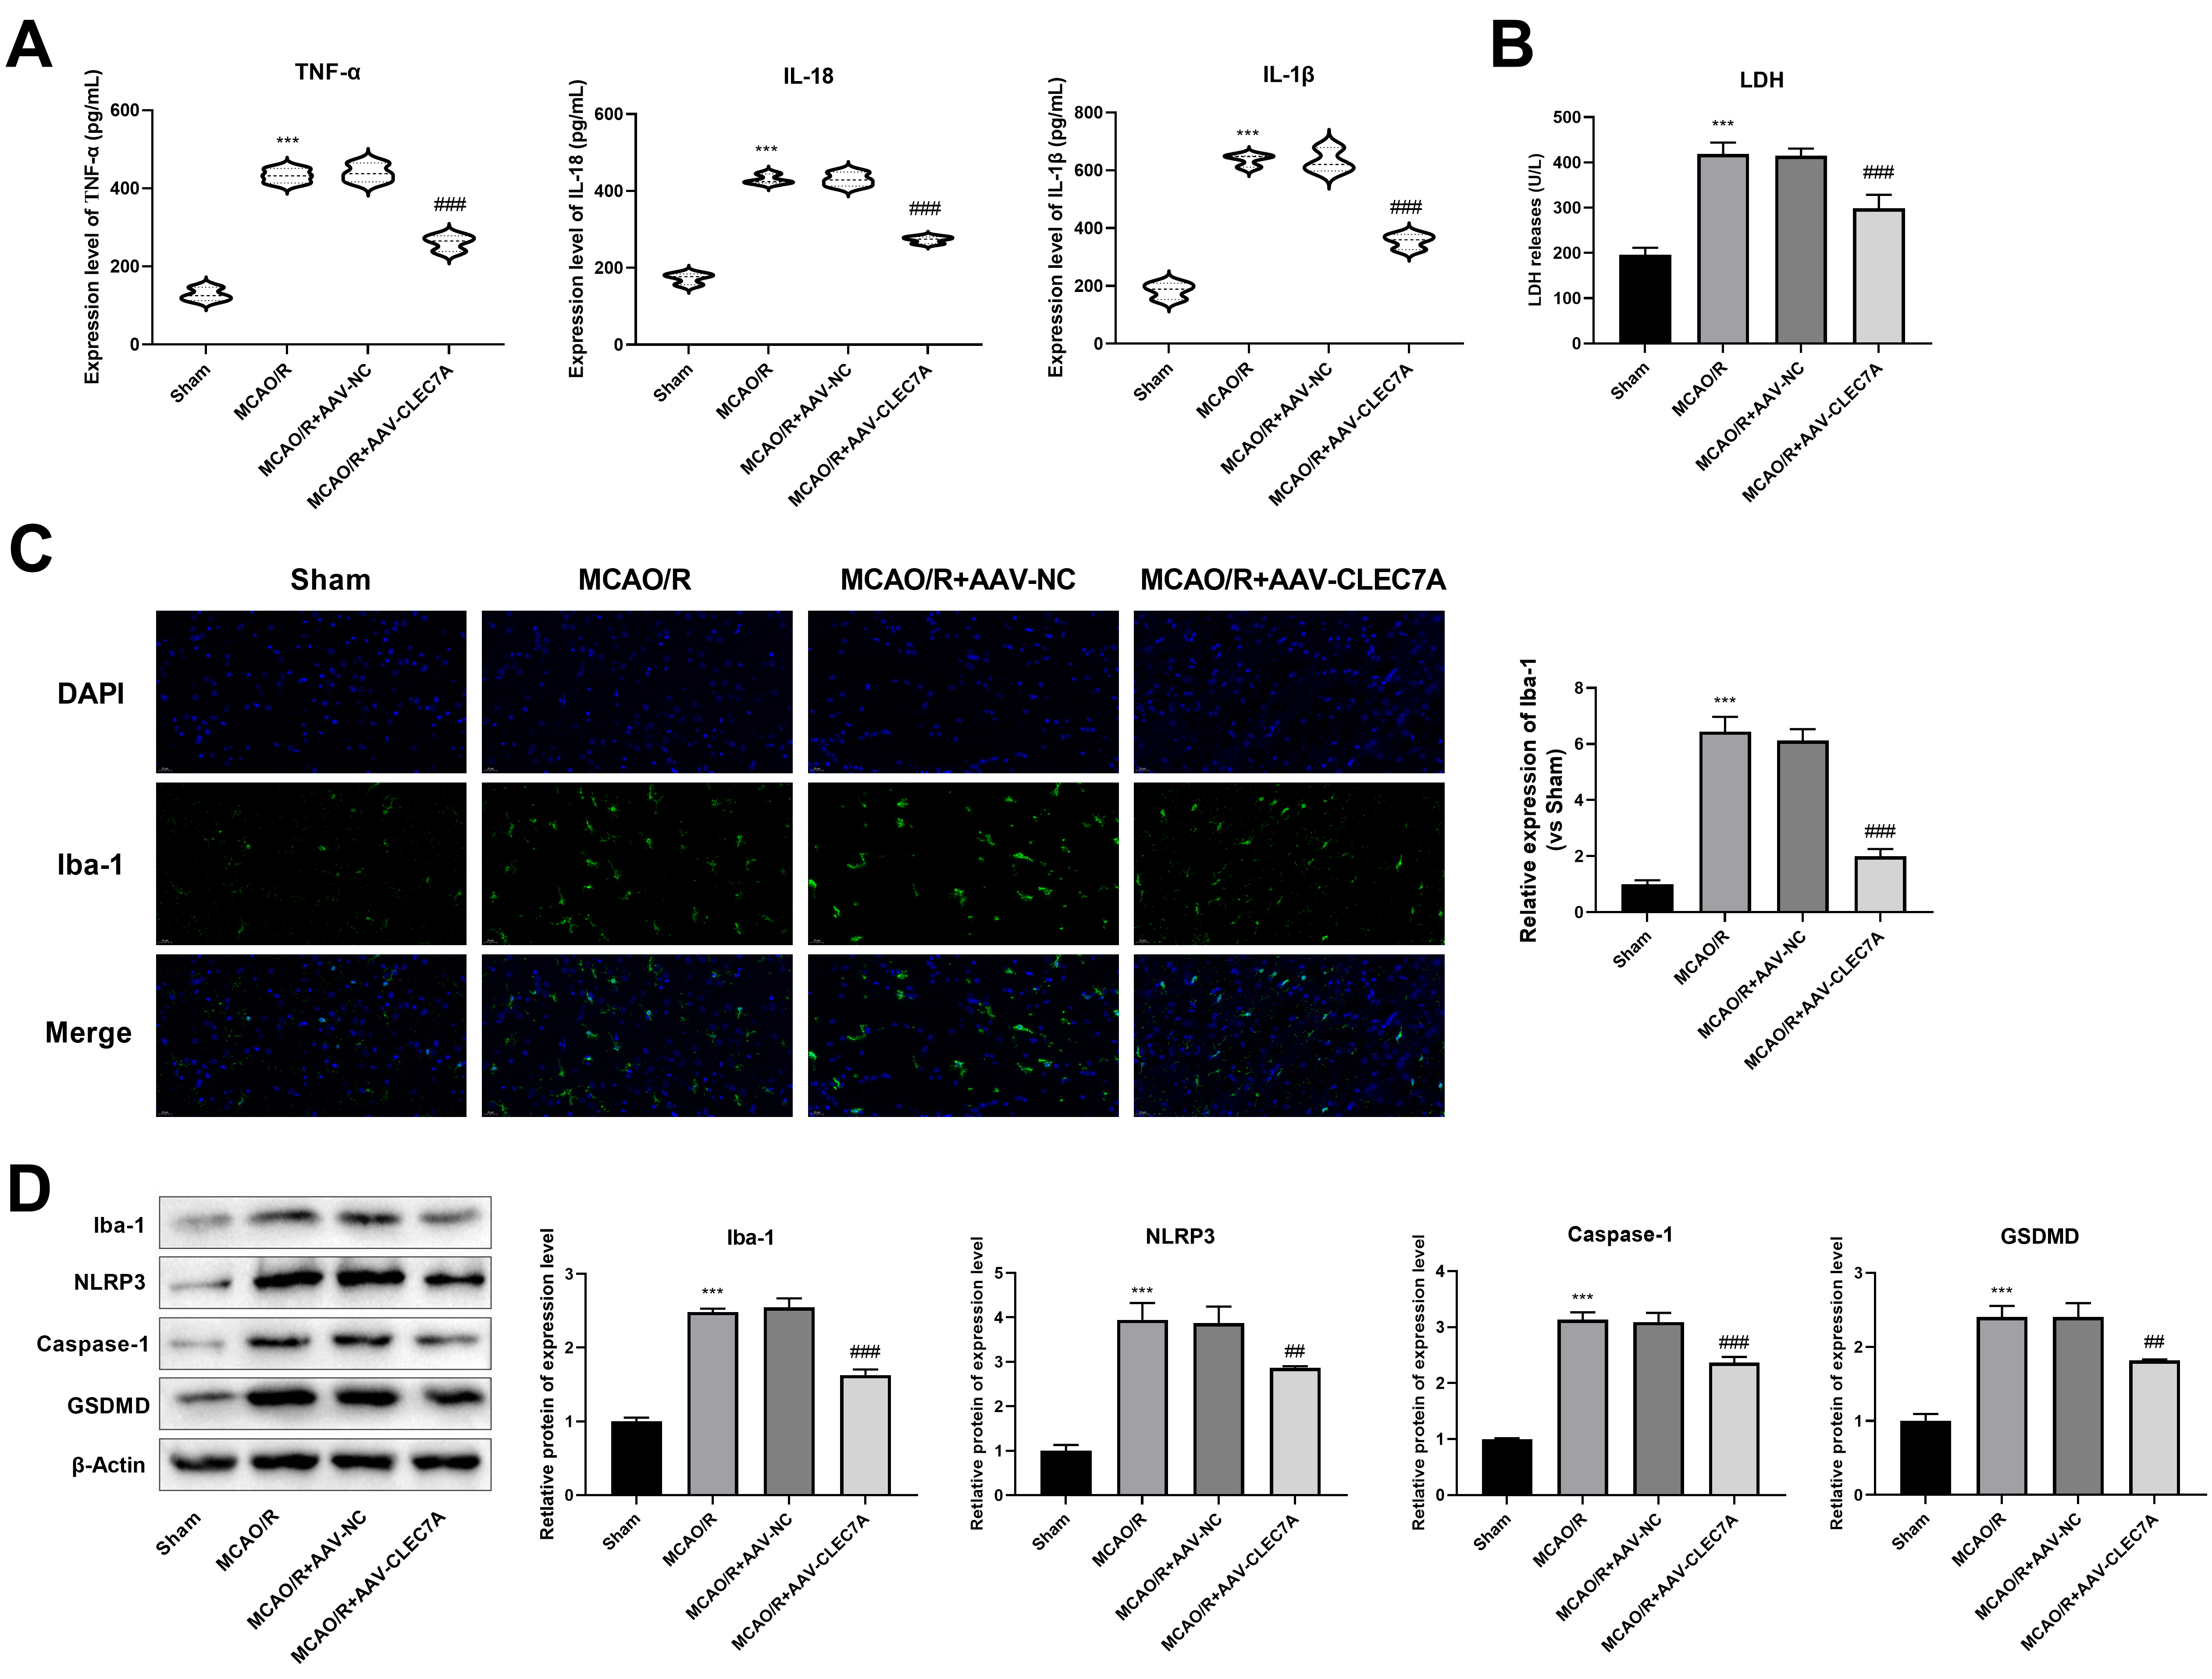 Fig. 7.
Knockdown of CLEC7A inhibits pyroptosis and microglia
activation in MCAO/R model. (A) The levels of IL-1
The CCK-8 assay results showed a significant promotion of viability of HT22
cells in the OGD/R+si-CLEC7A group (83.08
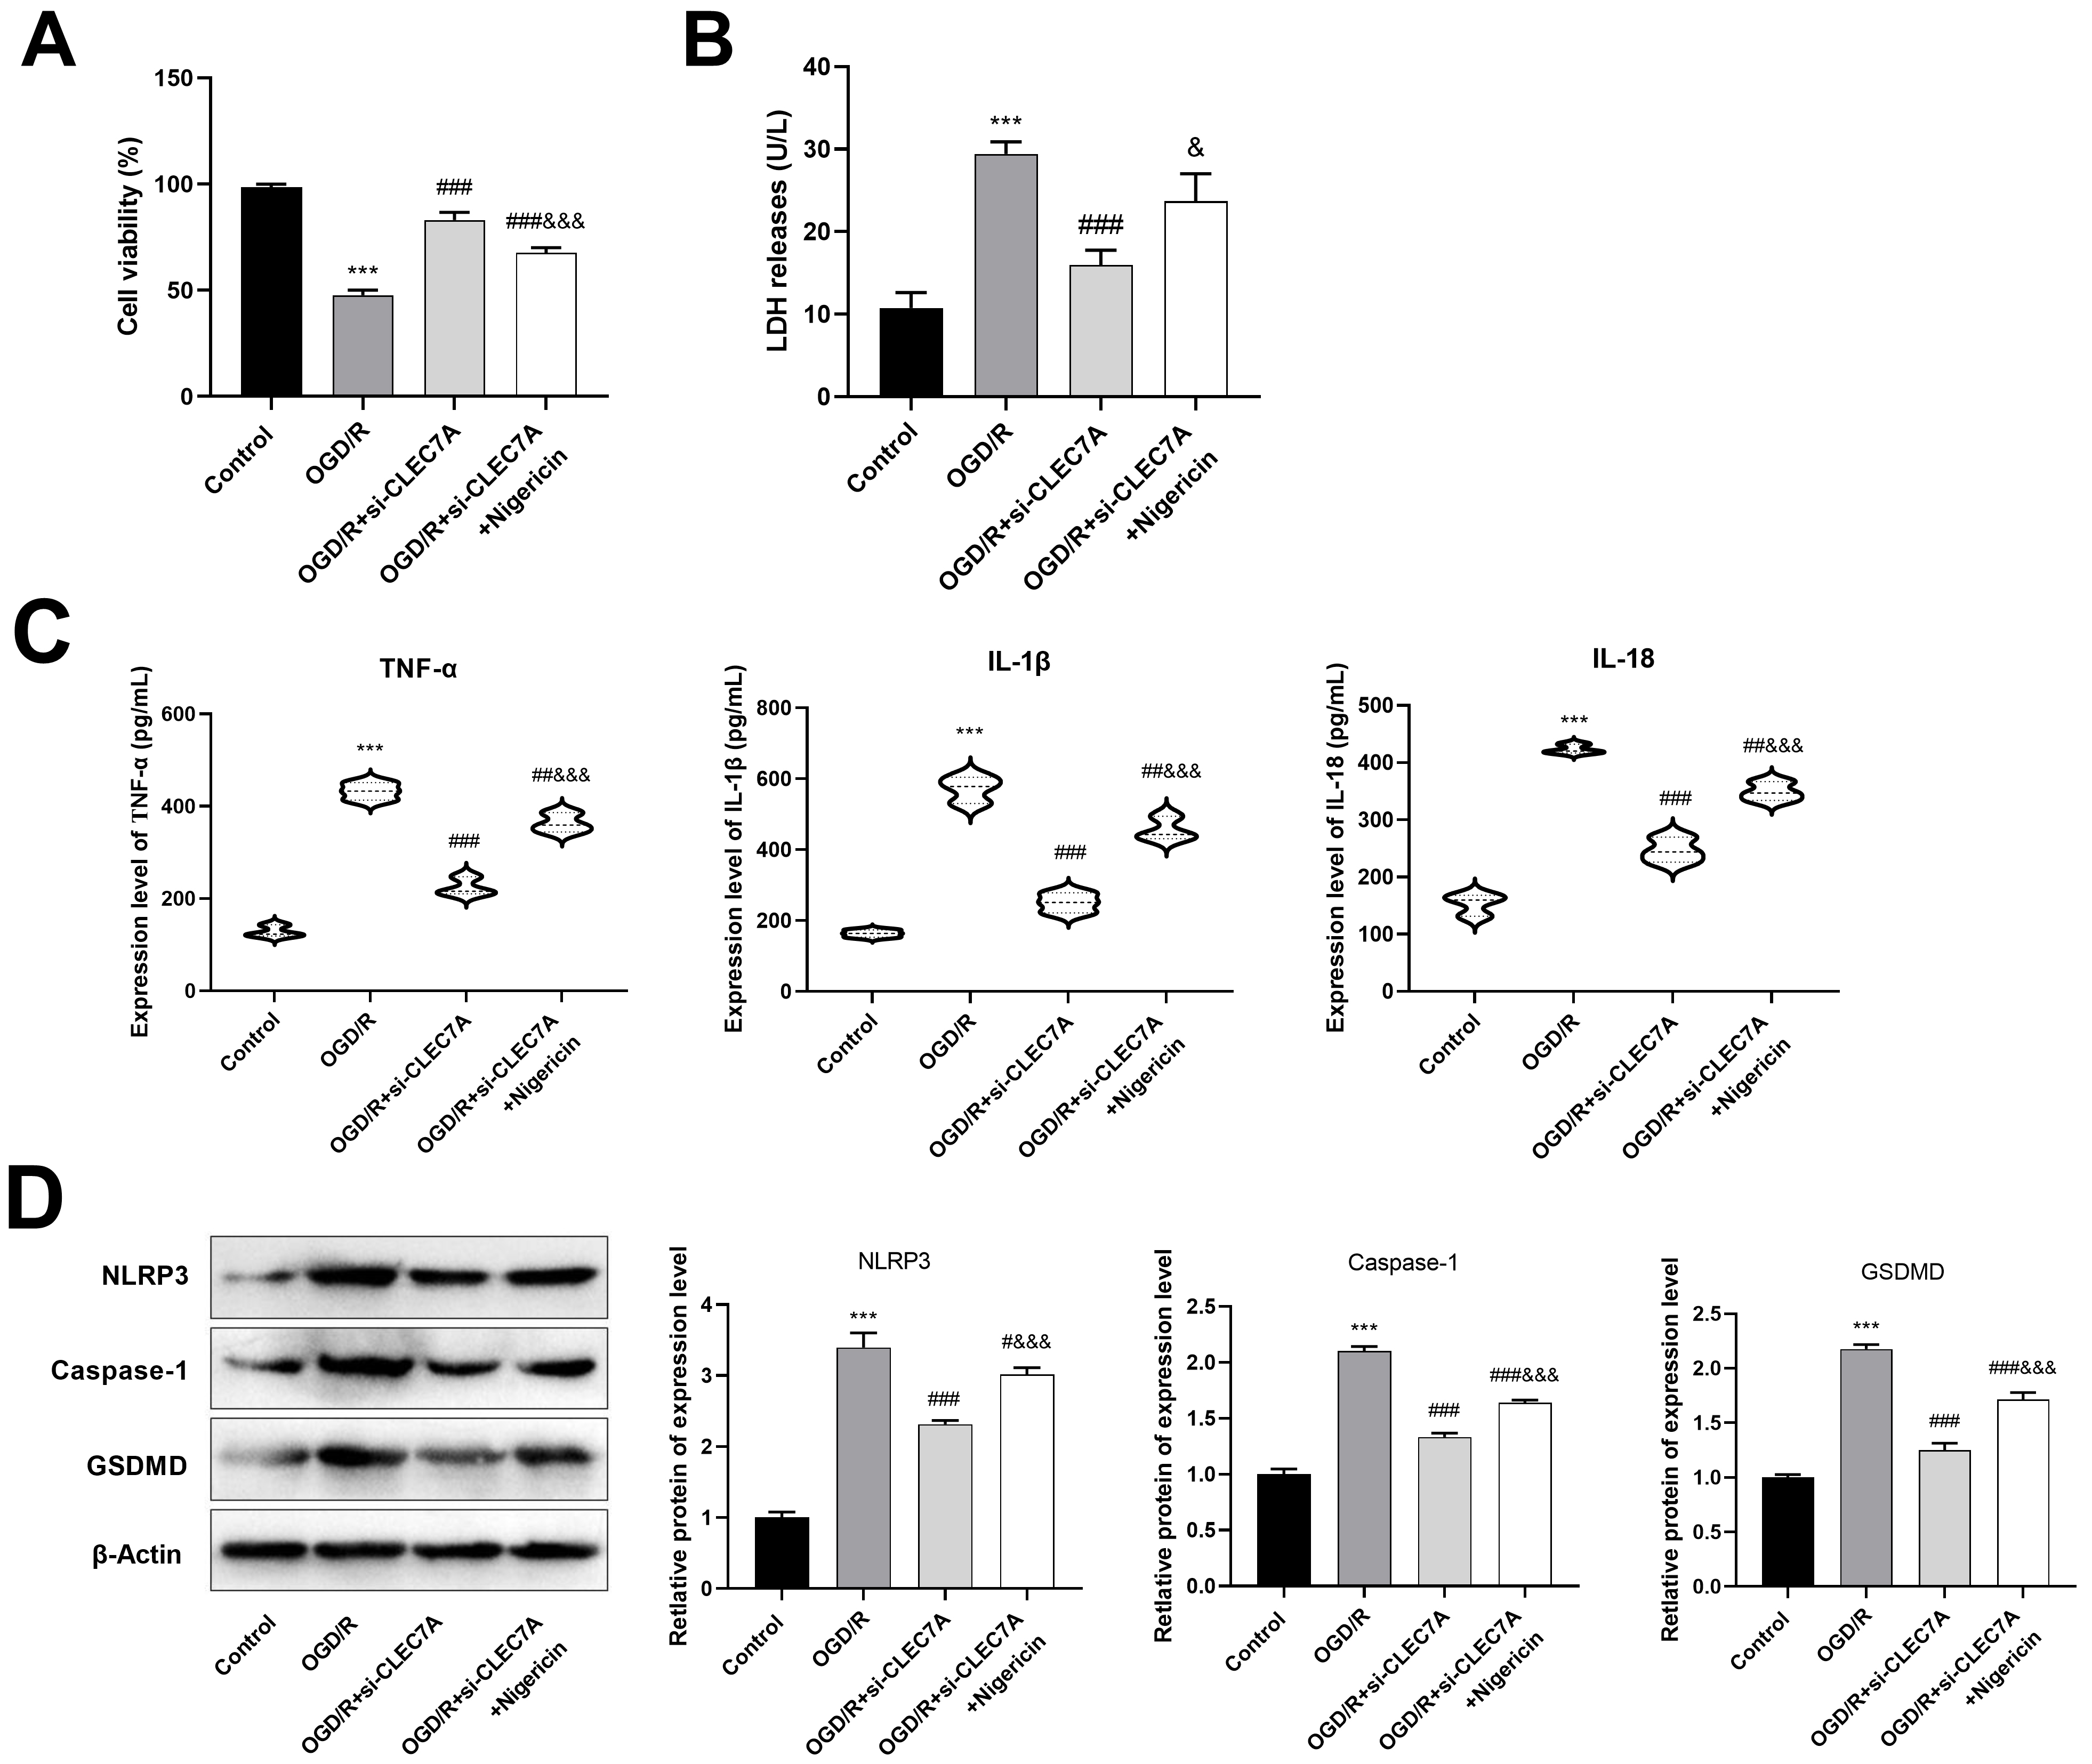 Fig. 8.
CLEC7A knockdown in BV cells promotes viability of HT22
cells after OGD/R by inhibiting pyroptosis. (A) CCK-8 was used to detect cell
viability of HT22 cells. (B) The level of LDH was detected by ELISA. (C) The
levels of IL-1
Activated microglia engage in post-stroke pathological processes through a range of mechanisms including polarization, autophagy, phagocytosis, pyroptosis, ferroptosis, apoptosis, and necrosis, which influence the extent of damage and subsequent repair after stroke, thereby presenting potential therapeutic approaches for IS [40]. Herein, we identified six hub genes, FCGR3A, FCER1G, C5AR1, CLEC7A, PLAU, and CCL6, upregulated in MCAO/R rats based on datasets from the GEO database and PPI network. From these, CLEC7A was selected as the target for this study. In the MCAO/R model, the expression levels of the microglial biomarker Iba-1 and pyroptosis-related proteins NLRP3, Caspase-1, and GSDMD were found to be increased. Furthermore, we found that the knockdown of CLEC7A in BV2 cells promoted viability while reducing the expression of NLRP3, Caspase-1, and GSDMD in OGD/R-treated neurons. CLEC7A knockdown of CLEC7A alleviates IS and reduces expression of pyroptosis-related proteins and Iba-1 in rats. Moreover, nigericin reversed the effect of CLEC7A knockdown on the viability of OGD/R-treated neurons in BV cells.
Bioinformatic analysis has been extensively utilized to investigate crucial pathogenic elements and prospective therapeutic targets in IS [41, 42, 43]. In the present study, we identified FCGR3A, FCER1G, C5AR1, CLEC7A, PLAU, and CCL6 as hub genes highly expressed in IS with high predictive values. FCGR3A has previously been identified as a stable diagnostic m6A-related gene that plays a significant role in the formation of diverse and complex immunological microenvironments in IS [35]. In addition, single-cell RNA sequencing of CD45 high immune cells obtained from the ischemic hemisphere during both the subacute and chronic phases post-IS revealed that FCER1G is highly expressed in IS and plays a crucial role in tissue remodeling, myelin formation regulation, wound healing, and anti-neuroinflammatory processes [36]. Another study using bioinformatics to characterize the immune responses during stroke progression following human cord blood mesenchymal stem cell therapy and to predict prognostic biomarkers that may contribute to sex differences, identified C5AR1 (one of our key genes) as a promising therapeutic target for the treatment of IS through immune regulation [44]. RNA sequencing analysis of purified microglia from the hemispheres of adult and aged mice following distal arterial occlusion further revealed significant upregulation of CLEC7A in aged microglia compared to their younger counterparts [45]. By collecting immune-related genes via the ImmPort website, and identifying DEGs based on the GEO database, pLAU was identified as a candidate for cerebral ischemia-reperfusion injury treatment, with higher expression levels in cerebral ischemia-reperfusion injured tissues [38]. Based on the RNA sequencing results of a mouse model of focal cerebral ischemia, CCL6 was found to be highly expressed during stroke recovery phase [39]. Taken together, these results indicate that FCGR3A, FCER1G, C5AR1, CLEC7A, PLAU, and CCL6 are key genes involved in the pathological processes of IS.
Microglia are sensitive to the cerebral microcirculation, and play a crucial
role in pathological processes, serving as the primary target cells for the
treatment of many CNS diseases [46]. One study using a rat MCAO/R model found
that the Signal Transducer and Activator of Transcription 3 (STAT3) pathway was
crucial for microglial activation and neuroinflammatory responses induced by
homocysteine, while Janus kinase 2 - Signal Transducer and Activator of
Transcription 3 (JAK2-STAT3) inhibitors ameliorated the exacerbation of IS
associated with homocysteine [47]. Echinacea treatment has also been shown to
effectively reduce infarct size and damage to the blood-brain barrier, inhibit
microglial activation, and reduce inflammation [48]. Similarly, in the present
study, we found that the expression of the microglial biomarker Iba-1 was
increased in MCAO/R rats, indicating an increase in microglia. Furthermore,
CLEC7A knockdown decreased the expression of Iba-1 in MCAO/R rats,
reducing the number of activated microglia. Study has shown that injection of
apoptotic neurons into the brains of naïve adult mice can induce
CLEC7A expression in microglia, indicating a role of CLEC7A in
cellular damage sensing [49]. Although microglia in naïve adult mice
typically do not express CLEC7A, subsets of microglia in the brain can
significantly upregulate CLEC7A expression during postnatal development
[15]. The direct binding of
CLEC7A interfered with neuroinflammation by regulating pyroptosis.
L-tetrahydropalmatine can significantly reduce the overexpression of
CLEC7A, markedly inhibit CLEC7A a-triggered phosphorylation of
mitogen-activated protein kinase (MAPK) and NF-
One limitation of this study is that we did not explore the consequences of CLEC7A overexpression in microglia on neurons due to resource constraints, including, but not limited to, the limited sample size. Furthermore, we exclusively focused on the effects of CLEC7A knockdown. As such, it remains to be determined whether CLEC7A exclusively induces pyroptosis or triggers other forms of cell death. Future studies should aim to elucidate the comprehensive role of CLEC7A in neuronal cell death, including its potential involvement in additional cell death pathways.
In conclusion, our comprehensive analysis firmly established CLEC7A as a pivotal gene signature with significant potential for diagnosis and therapeutic intervention in IS. Through targeted knockdown of CLEC7A, we observed marked alleviation of IS pathology in rat models, underscoring the pivotal role of CLEC7A in the manifestation of IS. Additionally, the knockdown of CLEC7A emerged as a crucial modulator, effectively curbing pyroptosis and microglial activation, two critical cellular processes implicated in IS exacerbation. Our results offer novel insights into the pathophysiology of IS and contribute to a deeper understanding of the molecular mechanisms that can provide initial evidence for more effective molecular therapeutic targets.
The transcriptomic data in this research were sourced from the Gene Expression Omnibus (GEO) repository. GSE106680, GSE97537, and GSE61616 datasets were screened out from the GEO database for analysis.
Conceptualization, WL, XLF and MYZ; Methodology, WL; Investigation, KMW, KLH and ZQZ; Formal Analysis, KMW, KLH, ZQZ and MX; Writing - Original Draft, WL, XLF and MYZ; Writing - Review & Editing: KMW, KLH, ZQZ and MX. All authors read and approved the final manuscript. All authors have participated sufficiently in the work and agreed to be accountable for all aspects of the work.
The animal experimental protocols employed were meticulously reviewed and approved by the Ethical Committee of Hainan Medical University (Approval No. HYLL-2020-140) in accordance with the ARRIVE guidelines.
Not applicable.
This study was supported by Hainan Provincial Natural Science Foundation of China (823RC586).
The authors declare no conflict of interest.
Supplementary material associated with this article can be found, in the online version, at https://doi.org/10.31083/j.jin2312219.
References
Publisher’s Note: IMR Press stays neutral with regard to jurisdictional claims in published maps and institutional affiliations.