


 , Denis E. Gurtovoy 1, Alexey V. Polonikov 2,3, Vladimir M. Pokrovsky 4, Evgeny A. Patrakhanov 4, Olga Y. Bushueva 1,3,*
1 Laboratory of Genomic Research, Research Institute for Genetic and Molecular Epidemiology, Kursk State Medical University, 305041 Kursk, Russia
2 Laboratory of Statistical Genetics and Bioinformatics, Research Institute for Genetic and Molecular Epidemiology, Kursk State Medical University, 305041 Kursk, Russia
3 Department of Biology, Medical Genetics and Ecology, Kursk State Medical University, 305041 Kursk, Russia
4 Laboratory of Genetic Technologies and Gene Editing for Biomedicine and Veterinary Medicine, Belgorod State National Research University, 308015 Belgorod, Russia
Abstract
Heat shock proteins (HSPs) play a critical role in the molecular mechanisms of ischemic stroke (IS). A possible role for HSP40 family proteins in atherosclerosis progression has already been revealed; however, to date, molecular genetic studies on the involvement of genes encoding proteins of the HSP40 family in IS have not yet been carried out.
We sought to determine whether nine single nucleotide polymorphisms (SNPs) in genes encoding HSP40 family proteins (DNAJB1, DNAJB2, DNAJA1, DNAJA2, DNAJA3 and DNAJC7) are associated with the risk and clinical features of IS.
Using TaqMan-based polymerase chain reaction (PCR) and the MassArray-4 system, DNA samples of 2551 Russians — 1306 IS patients and 1245 healthy individuals — were genotyped.
SNP rs2034598 DNAJA2 decreased the risk of IS exclusively in male patients (odds ratio = 0.81, 95% confidence interval 0.78–0.98, p = 0.028); rs7189628 DNAJA2 increased the brain infarct size (p = 0.04); and rs6500605 DNAJA3 lowered the age of onset of IS (p = 0.03). SNPs rs10448231 DNAJA1, rs7189628 DNAJA2, rs4926222 DNAJB1 and rs2034598 DNAJA2 were involved in the strongest epistatic interactions linked to IS; SNP rs10448231 DNAJA1 is characterised by the most essential mono-effect (2.96% of IS entropy); all of the top SNP–SNP interaction models included the pairwise combination rs7189628 DNAJA2×rs4926222 DNAJB1, which was found to be a key factor determining susceptibility to IS. In interactions with the studied SNPs, smoking was found to have multidirectional effects (synergism, antagonism or additive effect) and the strongest mono-effect (3.47% of IS entropy), exceeding the mono-effects of rs6500605 DNAJA3, rs10448231 DNAJA1, rs2034598 DNAJA2, rs7189628 DNAJA2 and rs4926222 DNAJB1, involved in the best G×E models and determining 0.03%–0.73% of IS entropy.
We are the first to discover polymorphisms in genes encoding HSP40 family proteins as a major risk factor for IS and its clinical manifestations. The comprehensive bioinformatics analysis revealed molecular mechanisms, underscoring their significance in the pathogenesis of IS, primarily reflecting the regulation of heat stress, proteostasis and cellular signalling.
Keywords
- stroke
- chaperone
- HSP
- DNAJA2
- DNAJA3
- rs2034598
- rs7189628
- rs6500605
- gene-gene interaction
- gene-environment interaction
Ischemic stroke (IS) poses a substantial threat to human health worldwide, ranking among leading causes of disability and death [1]. IS occurs when an atherosclerotic plaque or thrombus obstructs an artery in cerebral vessels, thereby leading to brain tissue ischemia [2]. This occlusion deprives the affected brain region of oxygen and nutrients, resulting in hypoxia, oxidative stress, excitotoxicity and ultimately neuronal death [3, 4]. Heat shock proteins (HSPs) and other proteins with chaperone-like activity [5, 6] play a crucial part in the mitigation of these processes to ensure cell survival [7].
HSPs are a highly conserved superfamily of chaperones involved in protein folding, quality control and transport [8]. Among various HSP families, roles of HSP90 [9], HSP70 [10, 11, 12], HSP60 [13, 14] and HSP27 [15] are well established in both IS progression and neuroprotection. Of note, despite extensive global research on HSPs in relation to IS, the role of the HSP40 family remains virtually uninvestigated and poorly understood.
Essential and functionally conserved HSP40s, characterised by the presence of the J-domain, are also known as J-domain–containing proteins [16]. HSP40s accelerate ATP hydrolysis by HSP70s, and many HSP40s directly bind unfolded or partially folded polypeptides, thereby delivering these substrates to HSP70s for proper folding and stabilisation [17, 18, 19]. This intricate cooperation between HSP70 and HSP40 is vital for proteostasis, particularly under stressful conditions such as those induced by IS.
Thus, we aimed to investigate whether HSP40 polymorphisms are related to IS risk, to assess their association with the risk of IS in terms of inter-gene and gene–environment interactions and to determine their influence on clinical manifestations of IS. Additionally, we sought to analyse molecular mechanisms of involvement of HSP40 family genes’ SNPs in the development of IS through comprehensive bioinformatic analysis.
The scheme of the study design is presented in Fig. 1.
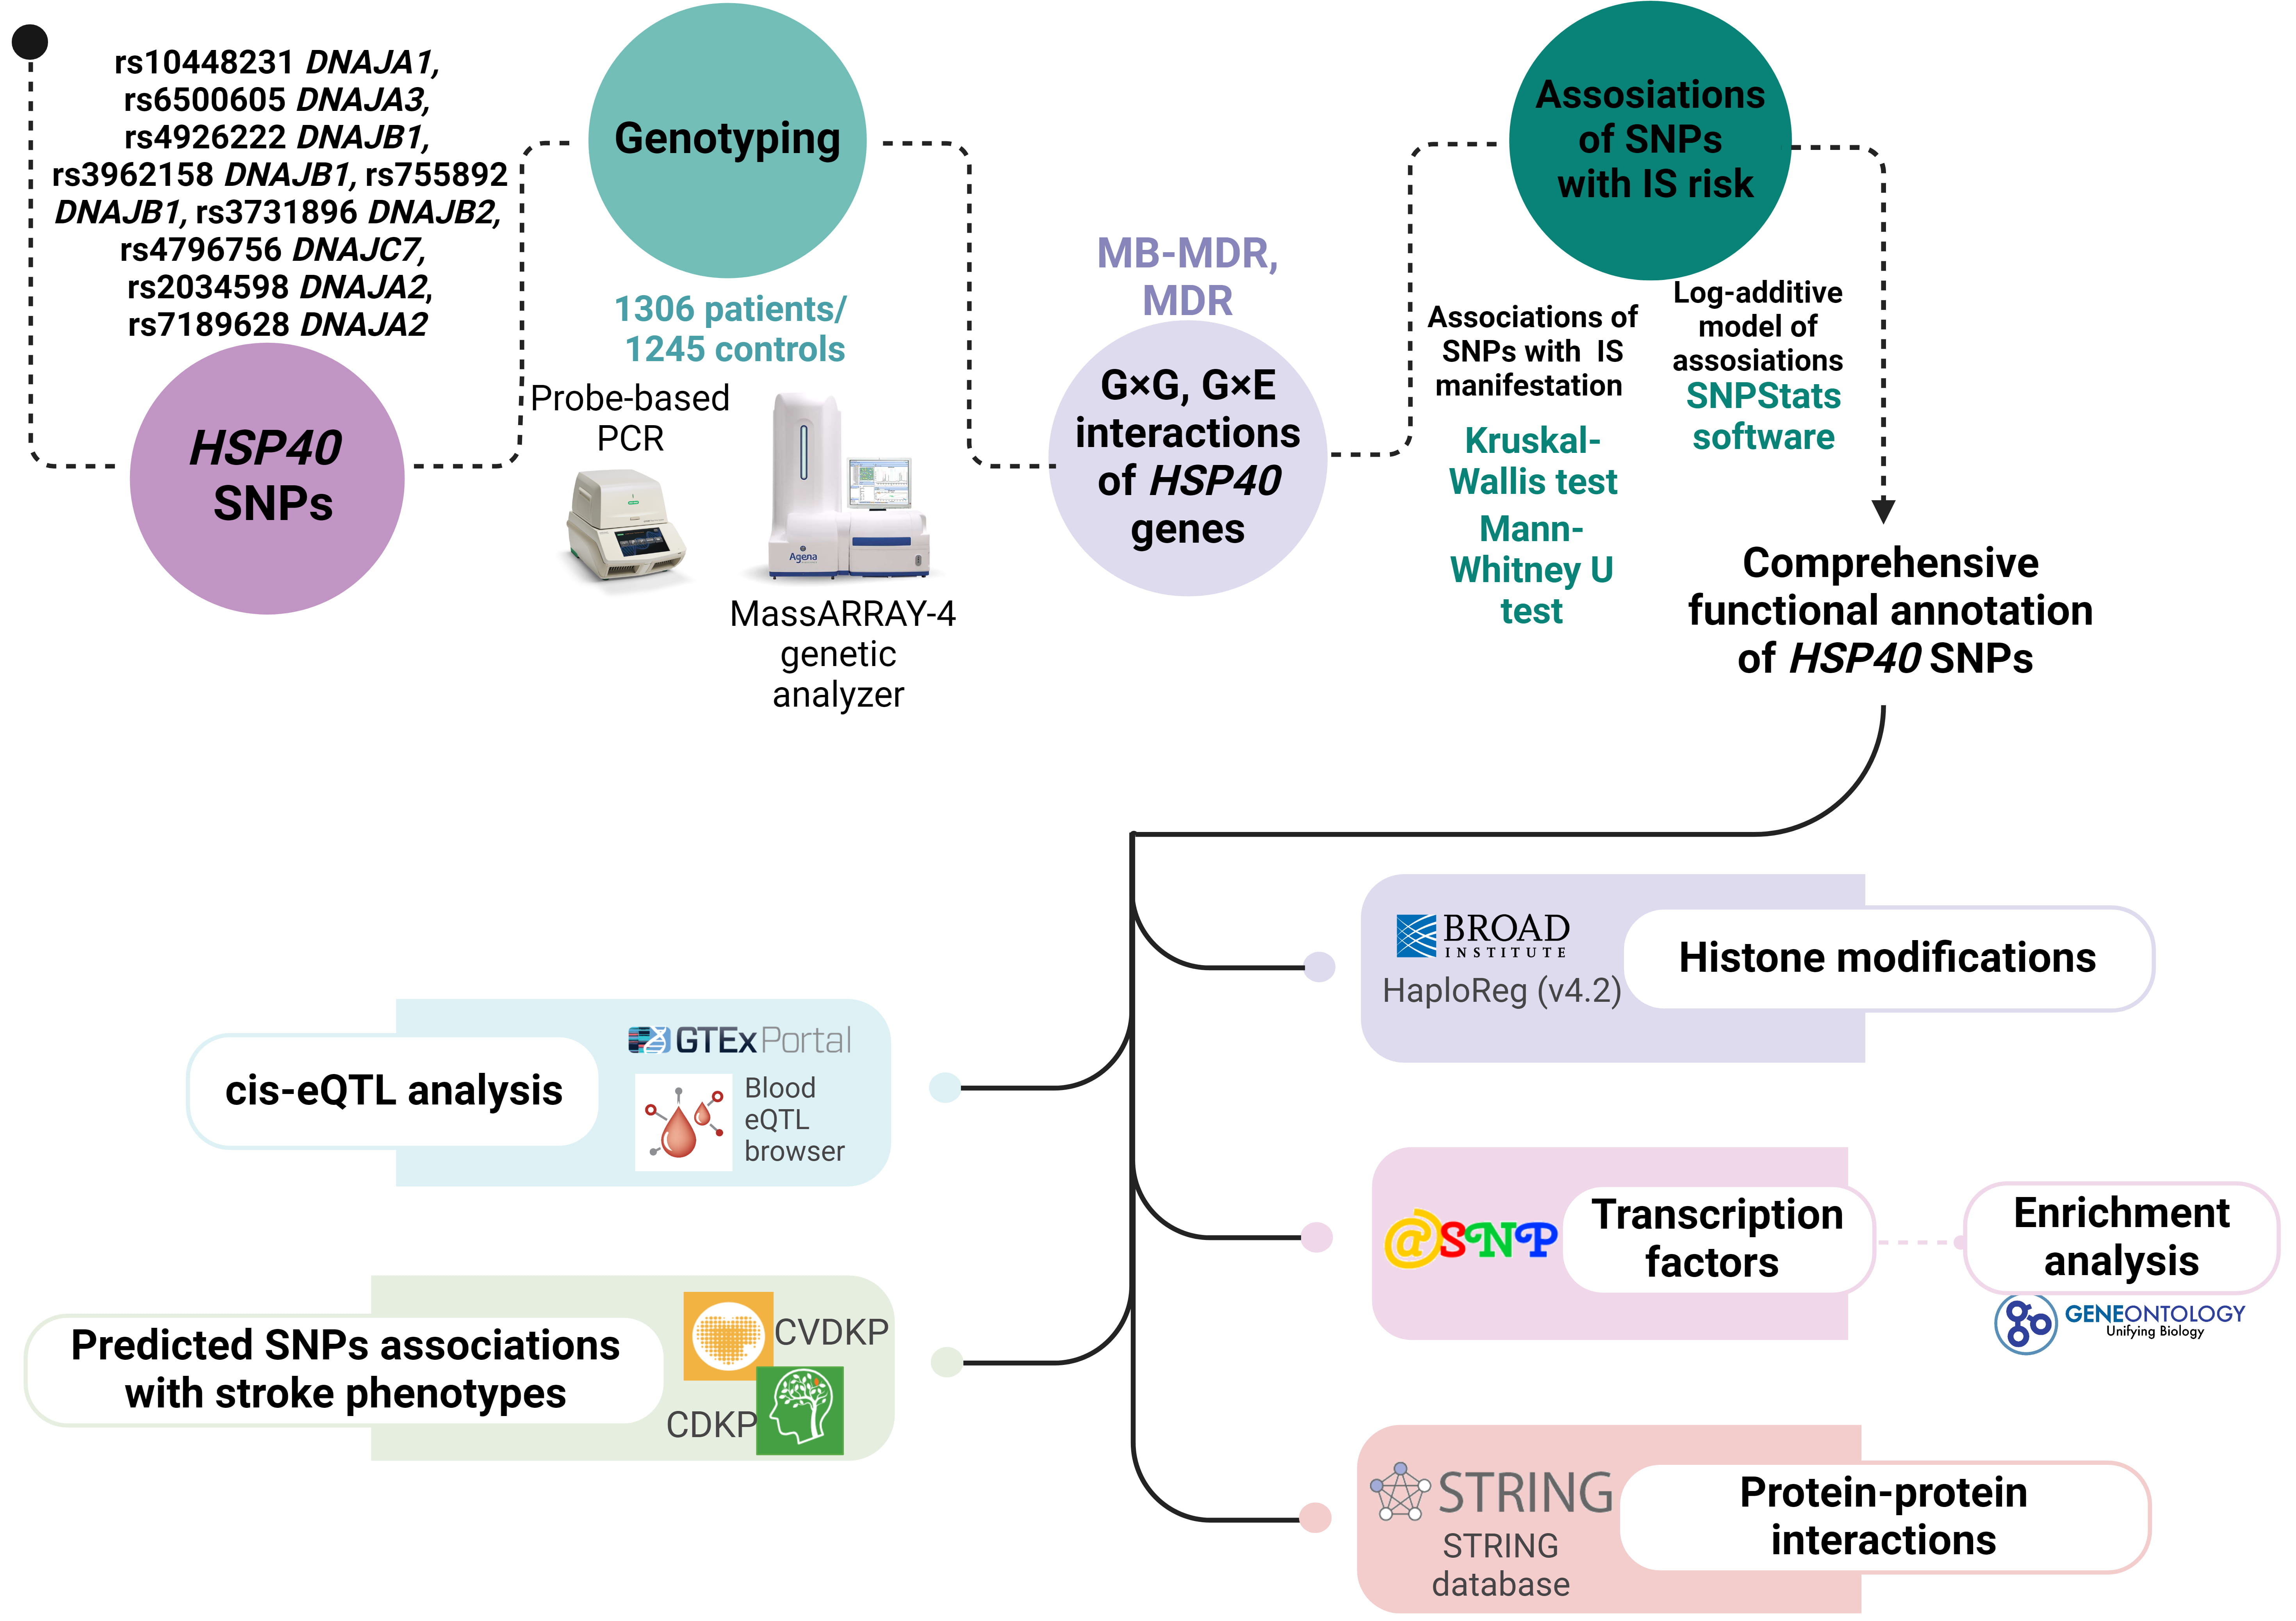 Fig. 1.
The basic outline of our study design. HSP, heat shock protein; SNPs, single nucleotide polymorphisms; MDR, multifactor dimensionality reduction; MB-MDR, model-based MDR; CVDKP, Cardiovascular Disease Knowledge Portal; CDKP, Cerebrovascular Disease Knowledge Portal; PCR, polymerase chain reaction; IS, ischemic stroke; eQTL, expression Quantitative Trait Loci.
A total of 2551 unrelated individuals of Russian ancestry (1306 IS patients and 1245 healthy controls) from Central Russia participated in this study. The study received ethical approval. Participants had to be born in Central Russia and self-identify as being of Russian descent in order to be eligible. Supplementary Table 1 lists the study cohort’s baseline and clinical characteristics.
The study involved two separate enrolment periods: the first took place in the neurology clinics of Kursk Emergency Medicine Hospital [20], and the second one took place in the Regional Vascular Centre of Kursk Regional Clinical Hospital [21] between 2015 and 2017. A group of skilled neurologists evaluated every case. Using the results of brain computed tomography and/or magnetic resonance imaging, the diagnosis of IS during the acute phase of stroke was verified. The vertebrobasilar arteries and the middle cerebral arteries on the left or right were among the impacted regions. The following exclusion criteria were applied when recruiting patients: traumatic brain injury, hepatic or renal failure, cancer, autoimmune diseases, cerebral ischemia of haematological origin, intracerebral haemorrhage, haemodynamic or dissection-related stroke and other conditions that could result in acute cerebrovascular events. Every patient with IS had a medical history of hypertension and was taking antihypertensive drugs.
Low fruit and vegetable intake was defined as per WHO guidelines [22]. During routine medical examinations at governmental institutions and in industrial settings, controls were chosen from Kursk hospitals [23, 24]. They were chosen at the same time and from the same group of people as the IS patients. Healthy volunteers in the control group had normal blood pressure, did not take antihypertensive medication and did not exhibit any clinical signs of major disorders such as cardiovascular or cerebrovascular.
Genotyping was conducted by the Laboratory of Genomic Research at the Research Institute for Genetic and Molecular Epidemiology of Kursk State Medical University (Kursk, Russia). Each participant’s venous blood samples were stored at –20 °C in tubes coated with EDTA until processing. From thawed blood samples, genomic DNA was isolated using phenol/chloroform extraction and ethanol precipitation techniques. The extracted DNA was assessed for purity, quality and concentration using a Nanodrop spectrophotometer (Thermo Fisher Scientific, Waltham, MA, USA).
Genotyping of two SNPs (rs2034598 DNAJA2 and rs7189628 DNAJA2)
was performed using allele-specific probe-based polymerase chain reaction (PCR) in accordance with our
protocols. For the primer design, Primer3 software version 4.1.0
(https://primer3.ut.ee/) was utilised. SNPs were excluded if we faced challenges
in designing allele-specific TaqMan probes owing to methodological issues,
including a low CG content in the DNA region flanking an SNP, the presence of GC
clamps, runs of identical nucleotides and difficulties with optimising primer
annealing conditions. The PCR reaction solution (25 µL) consisted of
~10 ng of DNA, 1.5 units of Hot Start Taq DNA polymerase
(Biolabmix, Novosibirsk, Russia) and the following reagent concentrations: 0.25
µM each primer; 0.1 µM each probe; 250 µM each dNTP; 3.5
mM MgCl2 for rs2034598, 5.5 mM MgCl2 for rs7189628; 1
Agena Bioscience’s (San Diego, CA, USA) MassARRAY-4 genetic analyser was used to genotype rs10448231 DNAJA1, rs6500605 DNAJA3, rs4926222 DNAJB1, rs3962158 DNAJB1, rs755892 DNAJB1, rs3731896 DNAJB2 and rs4796756 DNAJC7. The methodology of the genotyping was described in detail in our previous study [25].
To ensure quality control, 10% of the DNA samples were genotyped twice, with the case-control status blinded. The results showed over 99% concordance between the repeated tests.
We used the STATISTICA software (version 13.3, Informer Technologies, Inc., Santa Clara, CA, USA) for the statistical analysis. Because most of continuous variables were characterised by a non-normal distribution, we present these parameters as medians with first and third quartiles [Q1, Q3] and used the Mann–Whitney test for intergroup comparison of continuous variables. Using Pearson’s chi-squared test and Yates’s correction for continuity, categorical variables were examined for statistical significance.
Using Fisher’s exact test, genotype distributions were examined for Hardy–Weinberg equilibrium. The SNPStats software was used to analyse genotype frequencies and their relationships to IS risk [26]. In the analysis of genotype association, the log-additive model was employed. Covariates, which comprised factors indicating variations in the overall biological characteristics of the studied groups, were taken into account when adjusting associations in the entire group of patients and controls.
Two-, three- and four-level genotype combinations (G
The multifactor dimensionality reduction (MDR) approach was used to further analyse the most significant G
Utilising the following tools, functional implications of the studied SNPs were examined:
• Genotype-Tissue Expression (GTEx) Portal: this tool was used to analyse the expression quantitative trait loci (eQTLs) effects of the studied SNPs in peripheral blood, vessels and brain [27].
• eQTLGen (https://www.eqtlgen.org/; accessed on May 10, 2024): This resource was used to examine associations of the HSP40 family gene SNPs with eQTLs in peripheral blood [28].
• HaploReg (v4.2), a bioinformatics tool available at https://pubs.broadinstitute.org/mammals/haploreg/haploreg.php (accessed on May 10, 2024) was employed to assess histone modifications associated with HSP40 family gene SNPs. Histone H3 protein lysine residues at positions 27 and 9 (H3K27ac and H3K9ac, respectively) as well as mono- and tri-methylation at position 4 (H3K4me1) and position 4 (H3K4me3) were among the alterations that were examined [29].
• atSNP Function Prediction (http://atsnp.biostat.wisc.edu/search; accessed on May 10, 2024): We used this Web-based tool to evaluate how the presence of reference or alternative alleles affected the effects of SNPs of the HSP40 family genes on DNA affinity to transcription factors (TFs) [30].
• Gene Ontology (GO, https://geneontology.org/): This tool enabled the analysis of joint involvement of TFs linked to the reference or SNP alleles in overrepresented biological processes directly related to the pathogenesis of IS [31]. Biological functions controlled by TFs associated with HSP40 family genes’ SNPs were used as functional groups.
• The STRING database’s bioinformatic tools were utilised to analyse the main functional partners of DNAJA2 and DNAJA3 (https://string-db.org/, accessed on May 11, 2023) [32]. Additionally, the STRING database was utilised to analyse biological processes and molecular functions, focusing on protein–protein interactions between DNAJA2 and DNAJA3 as well as their functionally significant partner proteins.
• Cerebrovascular Disease Knowledge Portal (CDKP, https://cd.hugeamp.org/, accessed on May 11, 2023) was employed to analyse associations of the HSP40 family gene SNPs with IS and IS-associated phenotypes, such as heart rate, hypertension and coronary artery disease [33].
Every SNP under study in the control group had genotype frequencies that were in line with Hardy–Weinberg equilibrium, except for rs3731896 DNAJB2, rs3962158 DNAJB1 and rs755892 DNAJB1, which were excluded from the further analysis.
No associations were found with IS in the entire study population (Table 1).
| Genetic variant | Effect allele | Other allele | N | OR [95% CI] | p |
| rs4926222 DNAJB1 | G | A | 2030 | 1.08 [0.89–1.30] | 0.45 |
| rs2034598 DNAJA2 | A | G | 2065 | 0.94 [0.82–1.09] | 0.41 |
| rs7189628 DNAJA2 | T | C | 1991 | 1.00 [0.72–1.40] | 0.98 |
| rs10448231 DNAJA1 | G | A | 1487 | 1.06 [0.88–1.27] | 0.54 |
| rs4796756 DNAJC7 | C | T | 1513 | 0.82 [0.66–1.02] | 0.075 |
| rs6500605 DNAJA3 | G | A | 1519 | 0.87 [0.74–1.03] | 0.12 |
All calculations were performed relative to the minor alleles (Effect allele) with adjustment for sex, age and smoking status; statistically significant differences are marked in bold. OR, odds ratio; 95% CI, 95% confidence interval; SNPs, single nucleotide polymorphisms; IS, ischemic stroke; HSP, heat shock protein.
Further analysis stratified by sex revealed that rs2034598 DNAJA2 lowered the risk of IS exclusively in males (odds ratio [OR] = 0.81, 95% confidence interval [CI] 0.78–0.98, p = 0.028) (Table 2).
| Genetic variant | Effect allele | Other allele | N | OR [95% CI]1 | p2 | N | OR [95% CI]1 | p2 |
| Males | Females | |||||||
| rs4926222 DNAJB1 | G | A | 1025 | 1.13 [0.88–1.46] | 0.34 | 1032 | 1.04 [0.80–1.35] | 0.75 |
| rs2034598 DNAJA2 | A | G | 1048 | 0.81 [0.67–0.98] | 0.028 | 1040 | 1.13 [0.92–1.37] | 0.24 |
| rs7189628 DNAJA2 | T | C | 997 | 1.24 [0.78–1.96] | 0.36 | 1018 | 0.76 [0.48–1.20] | 0.23 |
| rs10448231 DNAJA1 | G | A | 719 | 1.00 [0.79–1.28] | 0.99 | 793 | 1.09 [0.86–1.37] | 0.49 |
| rs4796756 DNAJC7 | C | T | 729 | 0.92 [0.69–1.24] | 0.59 | 807 | 0.82 [0.62–1.11] | 0.19 |
| rs6500605 DNAJA3 | G | A | 732 | 0.81 [0.65–1.02] | 0.072 | 812 | 0.88 [0.70–1.10] | 0.27 |
1: odds ratio and 95% confidence interval; 2: p value; differences that are statistically significant are indicated in bold.
Additionally, to exclude the influence of smoking on the association between rs2034598 DNAJA2 and IS in males, we performed an analysis in subgroups of smoking/non-smoking males and females (Supplementary Table 2). Thus, we found that rs2034598 DNAJA2 lowered the risk of IS exclusively in non-smoking males (OR = 0.60, 95% CI 0.42–0.86, p = 0.004). This suggests that the male sex specifically influences the association between SNP rs2034598 DNAJA2 and IS.
Furthermore, we analysed the association between HSP40 SNPs and stroke localisation. Our findings revealed that the rs2034598 DNAJA2 reduced the risk of stroke in the vertebrobasilar system (OR = 0.74, 95% CI 0.55–0.99, p = 0.04) (Supplementary Table 3).
The next step of our study was to analyse the influence of SNPs on clinical and biochemical parameters. We found that rs7189628 DNAJA2 affected the brain infarct size (pKruskal-Wallis = 0.04; the largest brain infarct size was observed in carriers of the T/T genotype) (Fig. 2A), while rs6500605 DNAJA3 influenced the age of onset of IS (pKruskal-Wallis = 0.03; a later age of manifestation of IS was observed in carriers of the A/A genotype) (Fig. 2B).
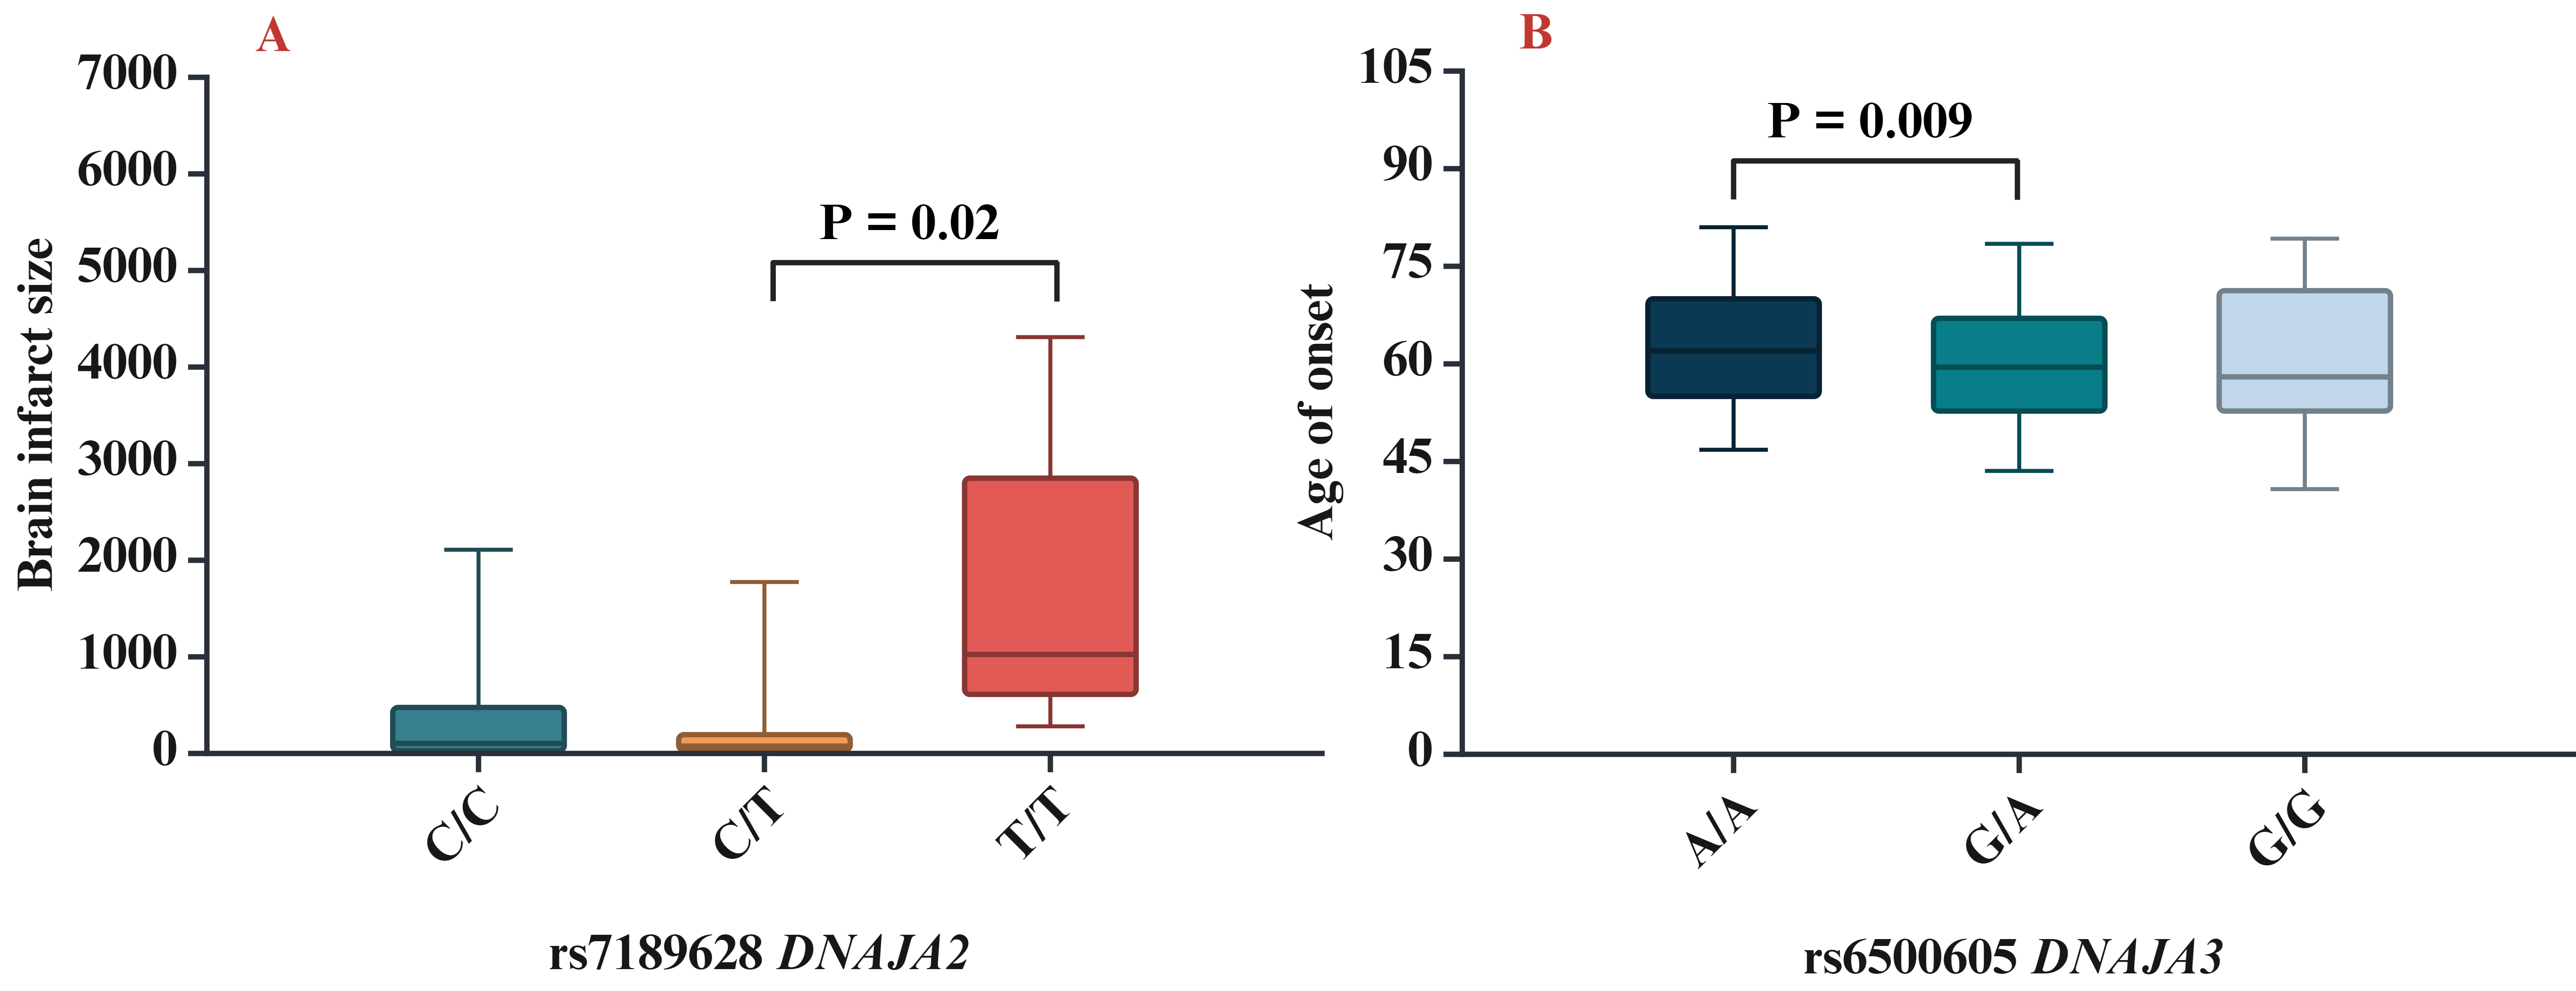 Fig. 2.
Association of HSP40 SNPs with clinical characteristics. (A) Brain infarct size for rs7189628 DNAJA2 (p = 0.02 in Mann–Whitney test: C/T vs T/T genotypes), (B) age of onset for rs6500605 DNAJA3 (p = 0.009 in Mann–Whitney test: A/A vs G/A genotypes). SNPs, single nucleotide polymorphisms.
Applying the MB-MDR methodology, three most important gene–gene interactions
associated with the risk of IS were identified (pperm
| Gene-gene interaction models | NH | beta H | WH | NL | beta L | WL | Wmax | pperm |
| The best three-locus models of intergenic interactions (for G | ||||||||
| rs10448231 DNAJA1 |
1 | 0.2696 | 7.423 | 1 | –0.1990 | 10.62 | 10.62 | 0.021 |
| rs7189628 DNAJA2 |
2 | 0.2429 | 10.661 | 0 | NA | NA | 10.66 | 0.037 |
| The best four-locus models of gene-gene interactions (for G | ||||||||
| rs10448231 DNAJA1 |
1 | 0.38158 | 12.375 | 1 | –0.2228 | 8.732 | 12.375 | 0.048 |
NH, the quantity of interacting high-risk genotypes; beta H, regression coefficient for interactions with high risk; WH, Wald statistics for interactions with high risk; NL, quantity of interacting low-risk genotypes; beta L, regression coefficient for interactions with low risk; WL, Wald statistics for interactions with low risk; NA, not applicable; pperm, permutational significance levels (with adjustment for sex, age and smoking). Loci involved in at least two best models of intergenic interactions are highlighted in bold.
The MDR method (Fig. 3), first, revealed that SNPs in the best G
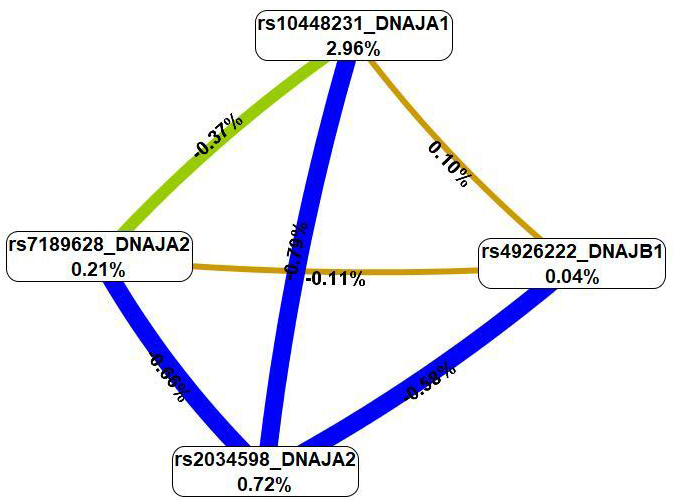 Fig. 3.
A graph of the most significant G
The four most important models of gene–environment interactions connected to IS
were identified using the MB-MDR methodology (Table 4). Overall, smoking in
combination with five SNPs (rs6500605 DNAJA3, rs10448231
DNAJA1, rs2034598 DNAJA2, rs7189628 DNAJA2 and
rs4926222 DNAJB1) was present in the best models of G
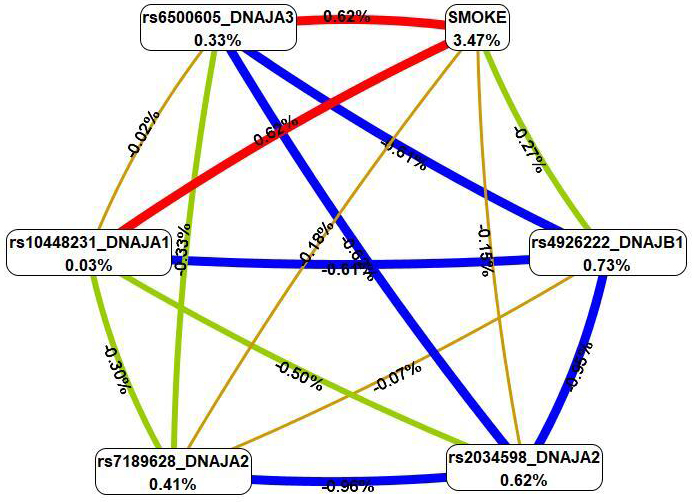 Fig. 4.
The graph of the most significant G
| Gene-gene interaction models | NH | beta H | WH | NL | beta L | WL | Wmax | pperm |
| The best two-factor models of gene-smoking interactions (for G | ||||||||
| SMOKE |
2 | 0.2543 | 101.93 | 2 | –0.2230 | 84.44 | 101.93 | |
| SMOKE |
2 | 0.2506 | 101.28 | 2 | –0.2506 | 101.28 | 101.28 | |
| The best three-factor models of gene- interactions (for G | ||||||||
| SMOKE |
5 | 0.2545 | 102.37 | 6 | –0.2573 | 105.86 | 105.86 | |
| The best four-factor models of gene- interactions (for G | ||||||||
| SMOKE |
7 | 0.2696 | 111.6 | 5 | –0.2293 | 86.37 | 111.6 | |
pperm, permutational significance levels (with adjustment for sex, age and smoking); Loci involved in at least two best models of intergenic interactions are highlighted in bold.
First, MDR revealed that smoking had the most pronounced single effect (3.47%
contribution to IS entropy), exceeding mono-effects of SNPs involved in the best
of G
The summary of the effects of HSP40 family SNPs on the contribution to IS is provided in Table 5.
| SNP | G |
G | ||
| Mono-effect | GG-effect | Mono-effect | SNP-smoking-effect | |
| rs10448231 DNAJA1 | 2.96% | 1.26% | 0.03% | 0.62% |
| rs7189628 DNAJA2 | 0.21% | 1.14% | 0.41% | 0.18% |
| rs2034598 DNAJA2 | 0.72% | 2.03% | 0.62% | 0.15% |
| rs4926222 DNAJB1 | 0.04% | 0.79% | 0.73% | 0.27% |
| rs6500605 DNAJA3 | - | 0.33% | 0.62% | |
MB-MDR, model-based multifactor dimensionality reduction; MDR, multifactor dimensionality reduction.
Data from the eQTLGen Browser revealed that the C allele of rs7189628 DNAJA2 lowers the expression levels of RP11-169E6.1, DNAJA2 and PHKB while increasing the expression levels of NETO2 and GPT2 in whole blood (Table 6). The A allele of s6500605 DNAJA3 increases the expression of NMRAL1, DNAJA3, HMOX2 and CDIP1 and lowers the expression of PAM16, MGRN1, CORO7, ROGDI and C16orf96 in whole blood (Table 6).
| SNP | Effect Allele | Gene expressed | Z-score | p-value |
| rs7189628 DNAJA2(C/T) | C | RP11-169E6.1 | 2.51 | |
| NETO2 | 1.96 | |||
| DNAJA2 | 1.31 | |||
| PHKB | 5.88 | |||
| GPT2 | 6.7507 | |||
| rs6500605 DNAJA3(A/G) | A | NMRAL1 | 4.82 | |
| DNAJA3 | 8.29 | |||
| PAM16 | 7.91 | |||
| MGRN1 | 1.11 | |||
| HMOX2 | 1.35 | |||
| CORO7 | 6.97 | |||
| ROGDI | 3 | |||
| CDIP1 | 3.4173 | |||
| C16orf96 | 4.82 |
eQTL, expression quantitative trait loci.
Additionally, data from the GTEx portal (Supplementary Table 5) revealed that allele A of rs6500605 DNAJA3 affects expression levels of eight genes. Specifically, CDIP1 has lower expression in brain tissues but increased expression in arteries and whole blood. CORO7 shows increased expression in brain tissues, while HMOX2 has lower expression in arteries and brain. NMRAL1 has lower expression in arteries, brain and whole blood. MGRN1 and PAM16 exhibit increased expression in whole blood. RP11-295D4.3 shows increased expression in the aorta, pituitary and blood, and VASN has increased expression in the brain (Supplementary Table 6).
Interestingly, rs2034598 DNAJA2 did not show any cis-eQTL effects in blood, brain tissues or vessels.
Allele A of rs2034598 DNAJA2 creates DNA-binding sites for 20 TFs involved in artery morphogenesis (GO:0048844), while allele G of rs2034598 DNAJA2 generates DNA-binding sites for 44 TFs involved in five biological processes: interleukin-9-mediated signaling pathway (GO:0038113), cellular response to estrogen stimulus (GO:0071391), intracellular estrogen receptor signaling pathway (GO:0033146), regulation of angiogenesis (GO:0016525) and regulation of apoptotic process (GO:0042981) (Supplementary Table 7).
Allele A of rs6500605 DNAJA3 creates DNA-binding sites for 32 TFs that participate in neuron differentiation (GO:0030182), generation of neurons (GO:0048699) and neurogenesis (GO:0022008) (Supplementary Table 8). Allele G of rs6500605 DNAJA2 creates DNA-binding sites for 26 TFs involved in positive regulation of smooth muscle cell apoptotic process (GO:0034393) and negative regulation of angiogenesis (GO:0016525) (Supplementary Table 8).
Allele C of rs7189628 DNAJA2 generates DNA-binding sites for 64 TFs related to three GO terms: cellular response to reactive oxygen species (GO:0034614), epigenetic regulation of gene expression (GO:0040029) and regulation of apoptotic process (GO:0042981) (Supplementary Table 9). Allele T of rs7189628 DNAJA2 created DNA-binding sites for 28 TFs involved in 14 biological processes: negative regulation of interleukin-4 production (GO:0032713), forebrain radial glial cell differentiation (GO:0021861), negative regulation of interleukin-5 production (GO:0032714), negative regulation of oxidative stress-induced neuron intrinsic apoptotic signaling (GO:1903377), positive regulation of vascular endothelial growth factor production (GO:0010575), cytokine production (GO:0001816), regulation of transforming growth factor beta production (GO:0071634), negative regulation of gliogenesis (GO:0014014), cellular response to hypoxia (GO:0071456), angiogenesis (GO:0001525), response to oxidative stress (GO:0006979), response to growth factor (GO:0070848), cellular response to cytokine stimulus (GO:0071345) and chromatin organization (GO:0006325) (Supplementary Table 9).
The STRING database identified 10 proteins having the most significant interactions with DNAJA2: HSPA8, HSPA1B, HSPA1L, DNAJA1, HSPA2, DNAJB1, HSPA4, HSP90AA1, DNAJA4 and STIP1 (Fig. 5, Supplementary Table 10).
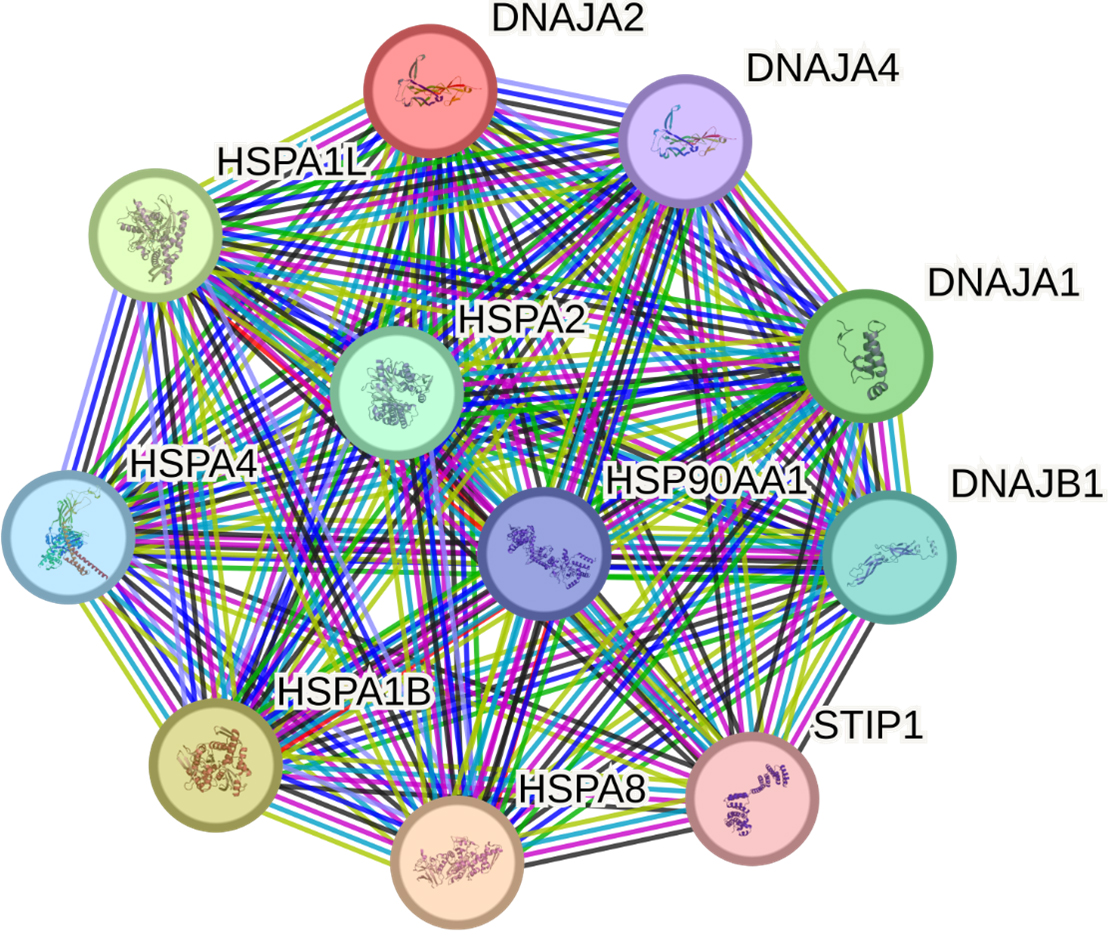 Fig. 5.
Predicted functional partners of DNAJA2. PPI enrichment
p-value: 1.91
DNAJA2 and its main partners in function are involved in 21 GO terms, primarily
representing proteostasis [e.g., protein folding (GO:0006457, false discovery
rate {FDR} = 5.53
The analysis of the primary functional partners of DNAJA3 using the STRING database revealed 10 proteins with the most prominent interactions: HSPA9, HSPA8, HSPA1B, HSPA1A, HSPA4, HSPA5, GRPEL1, GRPEL2, HSPA1L and CLPP (Fig. 6, Supplementary Table 12).
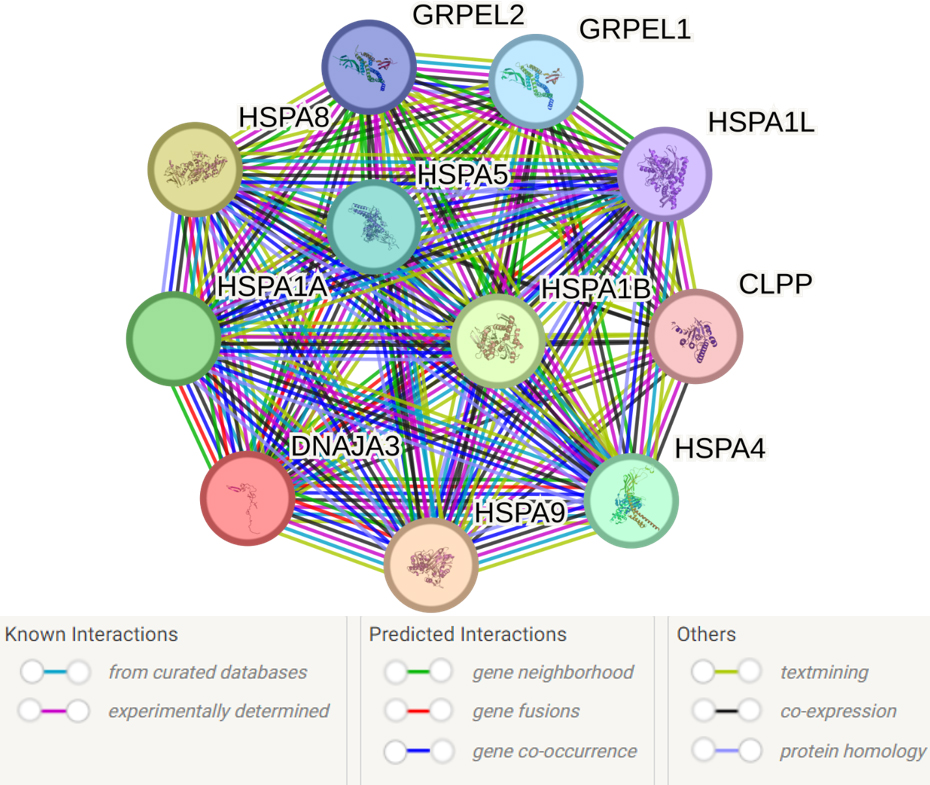 Fig. 6.
Predicted functional partners of DNAJA3. PPI enrichment
p-value: 9.4
Supplementary Table 12 presents the complete list of 54 biological
events involving DNAJA3 and its partners. Here are some key processes that seem
to be most important for the pathogenesis of IS: response to heat (GO:0009408;
FDR = 0.0063), response to stress (GO:0006950; FDR = 0.0156), negative regulation
of apoptotic process (GO:0043066; FDR = 0.0156), protein refolding (GO:0042026;
FDR = 3.26
According to CDKP data, the examined SNPs were linked to a decreased risk of cerebrovascular diseases and stroke severity (e.g., large artery stroke, white matter hyperintensities in cerebral small vessel disease, intracerebral haemorrhage or small-vessel IS and modified Rankin scale score 0–1 vs 2–6 adj stroke severity) and improvement in related traits (e.g., lower systolic blood pressure, lower heart rate and mean arterial pressure). The full list of phenotypes related to IS is presented in Table 7.
| № | SNP | Phenotype | p-value | Beta (OR) | Sample size |
| 1. | rs2034598 DNAJA2 (G/A) | Systolic blood pressure | 0.0017 | Beta |
1,914,060 |
| 2. | Pulse pressure | 0.002 | Beta |
953,984 | |
| 3. | Coronary artery calcification | 0.02 | Beta |
9584 | |
| 4. | White matter hyperintensities in cerebral small vessel disease | 0.02 | Beta |
18,381 | |
| 5. | Heart rate | 0.03 | Beta |
484,178 | |
| 6. | rs7189628 DNAJA2(C/T) | Large artery stroke | 0.018 | OR |
36,651 |
| 7. | Intracerebral hemorrhage or small-vessel ischemic stroke | 0.03 | OR |
24,366 | |
| 8. | rs6500605 DNAJA3(A/G) | Pulse pressure | 0.0001 | Beta |
929,653 |
| 9. | Systolic blood pressure | 0.0005 | Beta |
1,879,660 | |
| 10. | Myocardial infarction | 0.0009 | OR |
302,705 | |
| 11. | Mean arterial pressure | 0.008 | Beta |
147,482 | |
| 12. | Coronary artery disease (CAD) | 0.02 | OR |
1,250,750 | |
| 13. | Modified Rankin scale score 0–1 vs 2–6 adj stroke severity | 0.03 | OR |
4226 | |
| 14. | Hypertension | 0.03 | OR |
603,130 |
Effect alleles are marked in bold.
HaploReg data revealed a substantial effect of rs6500605 DNAJA3 on histone tags in brain tissues and blood. This SNP is in a DNA region binding to H3K4me1 and H3K4me3, with the effect being further enhanced by H3K27ac and H3K9ac in most brain regions and in whole blood (Table 8).
| SNP (Ref/Alt allele) | Tissues Marks | Brain | Blood | ||||||
| (1) | (2) | (3) | (4) | (5) | (6) | (7) | (8) | ||
| rs2034598 DNAJA2 (G/A) | H3K4me1 | - | - | Enh | Enh | Enh | - | Enh | Enh |
| H3K27ac | - | - | - | Enh | - | Enh | - | Enh | |
| H3K9ac | - | - | - | - | - | - | - | Pro | |
| rs7189628 DNAJA2 (C/T) | H3K4me1 | - | - | - | - | - | - | - | Enh |
| H3K27ac | - | - | Enh | Enh | - | - | - | Enh | |
| rs6500605 DNAJA3 (A/G) | H3K4me1 | Enh | Enh | Enh | Enh | Enh | Enh | Enh | Enh |
| H3K4me3 | - | - | - | - | Pro | - | Pro | Pro | |
| H3K27ac | - | - | Enh | Enh | Enh | Enh | Enh | Enh | |
| H3K9ac | - | - | Pro | Pro | Pro | Pro | Pro | Pro | |
1: Brain hippocampus middle; 2: brain substantia nigra; 3: brain anterior caudate; 4: brain cingulate gyrus; 5: brain inferior temporal lobe; 6: brain angular gyrus; 7: brain dorsolateral prefrontal cortex; 8: cells from peripheral blood (any). Effect alleles are marked in bold.
SNP rs2034598 DNAJA2 is in a DNA region binding to H3K4me1. The effect is increased by H3K27ac in some brain tissues and in blood, but only in blood is the effect also enhanced by H3K9ac (Table 8).
Lastly, SNP rs7189628 DNAJA2 is marked by H3K4me1 in blood and by H3K27ac in brain anterior caudate and brain cingulate gyrus, as well as in blood (Table 8).
This is the first paper to show a link between the IS risk, IS clinical
characteristics and SNPs in genes encoding HSP40 family proteins. Namely, in our
study, SNP rs7189628 DNAJA2 increased brain infarct size, rs6500605
DNAJA3 influenced the age of IS onset, and SNP rs2034598 DNAJA2
had protective effects against IS exclusively in males. The observed sexual
dimorphism may be linked to an influence of sex hormones on DNAJA2expression levels. For instance, animal studies have found significant changes in the expression levels of DNAJA2 between males and females [34, 35]. Moreover, in our work, SNP
rs2034598 DNAJA2 was associated with a reduced risk of stroke in
vertebrobasilar arteries. We demonstrated that SNPs rs10448231 DNAJA1,
rs7189628 DNAJA2, rs4926222 DNAJB1 and rs2034598
DNAJA2 were involved in the top epistatic interactions related to IS;
SNP rs10448231 DNAJA1 manifested the strongest mono-effect (2.96% of IS
entropy); pairwise combination rs7189628 DNAJA2
The role of HSPs in diseases associated with misfolded and aggregated proteins, including IS, is well established. HSPs are critical for proteostasis, especially under brain injury scenarios. Notably, HSP70 and its co-chaperone HSP40 are significantly induced in response to the brain injury [36]. Although the involvement of HSP70 in ischemia is well documented due to its abundance and its functions in the repair, refolding and trafficking of damaged proteins, the participation of HSP40 in ischemia has not been extensively researched.
HSP40 co-chaperone proteins regulate the formation of complexes between HSP70 and client proteins. The J-domain, present in all HSP40 family members, is crucial for regulation of HSP70’s ATPase activity [37]. Together, HSP70 and HSP40 constitute a system essential for proteostasis [38].
In cardiovascular diseases, HSP40 expression is notably increased in atherosclerotic plaques, thus surpassing the levels of HSP70 or HSP60 [39]. Nguyen et al. [39] have proposed that HSP40 member DNAJA1 can be responsible for T-cell activation during the immunopathogenesis of atherosclerotic lesions. Additionally, previous research has revealed DNAJA2 underexpression in angiotensin II–induced endothelial dysfunction [40]. The involvement of HSP40 in atherosclerosis is confirmed by recent findings from Kumari et al. [41], who identified DNAJA1 and DNAJB1 as key players in the biogenesis of ApoB100. Because apolipoprotein B–containing lipoproteins are major drivers of atherosclerosis and related conditions, including IS [42], the participation of HSP40 proteins in Apolipoprotein B (ApoB) biogenesis highlights their potential role in increased IS risk. Additionally, elevated DNAJC2 antibody (DNAJC2-Ab) levels have been linked to an elevated risk of stroke [43]. This association is explained by those authors as an initial response to bacterial infection [44], with this response being further amplified by overexpression of DnaJ family proteins in atherosclerotic plaques as the disease progresses [39].
Because to date, there has been no research on effects of the HSP40 SNPs under study on IS pathogenesis, we conducted a comprehensive bioinformatic analysis, employing a variety of tools to annotate the potential effects these SNPs can have on the initiation and progression of IS.
A summary of the overall molecular effects of HSP40 SNPs on IS pathology is depicted in Fig. 7.
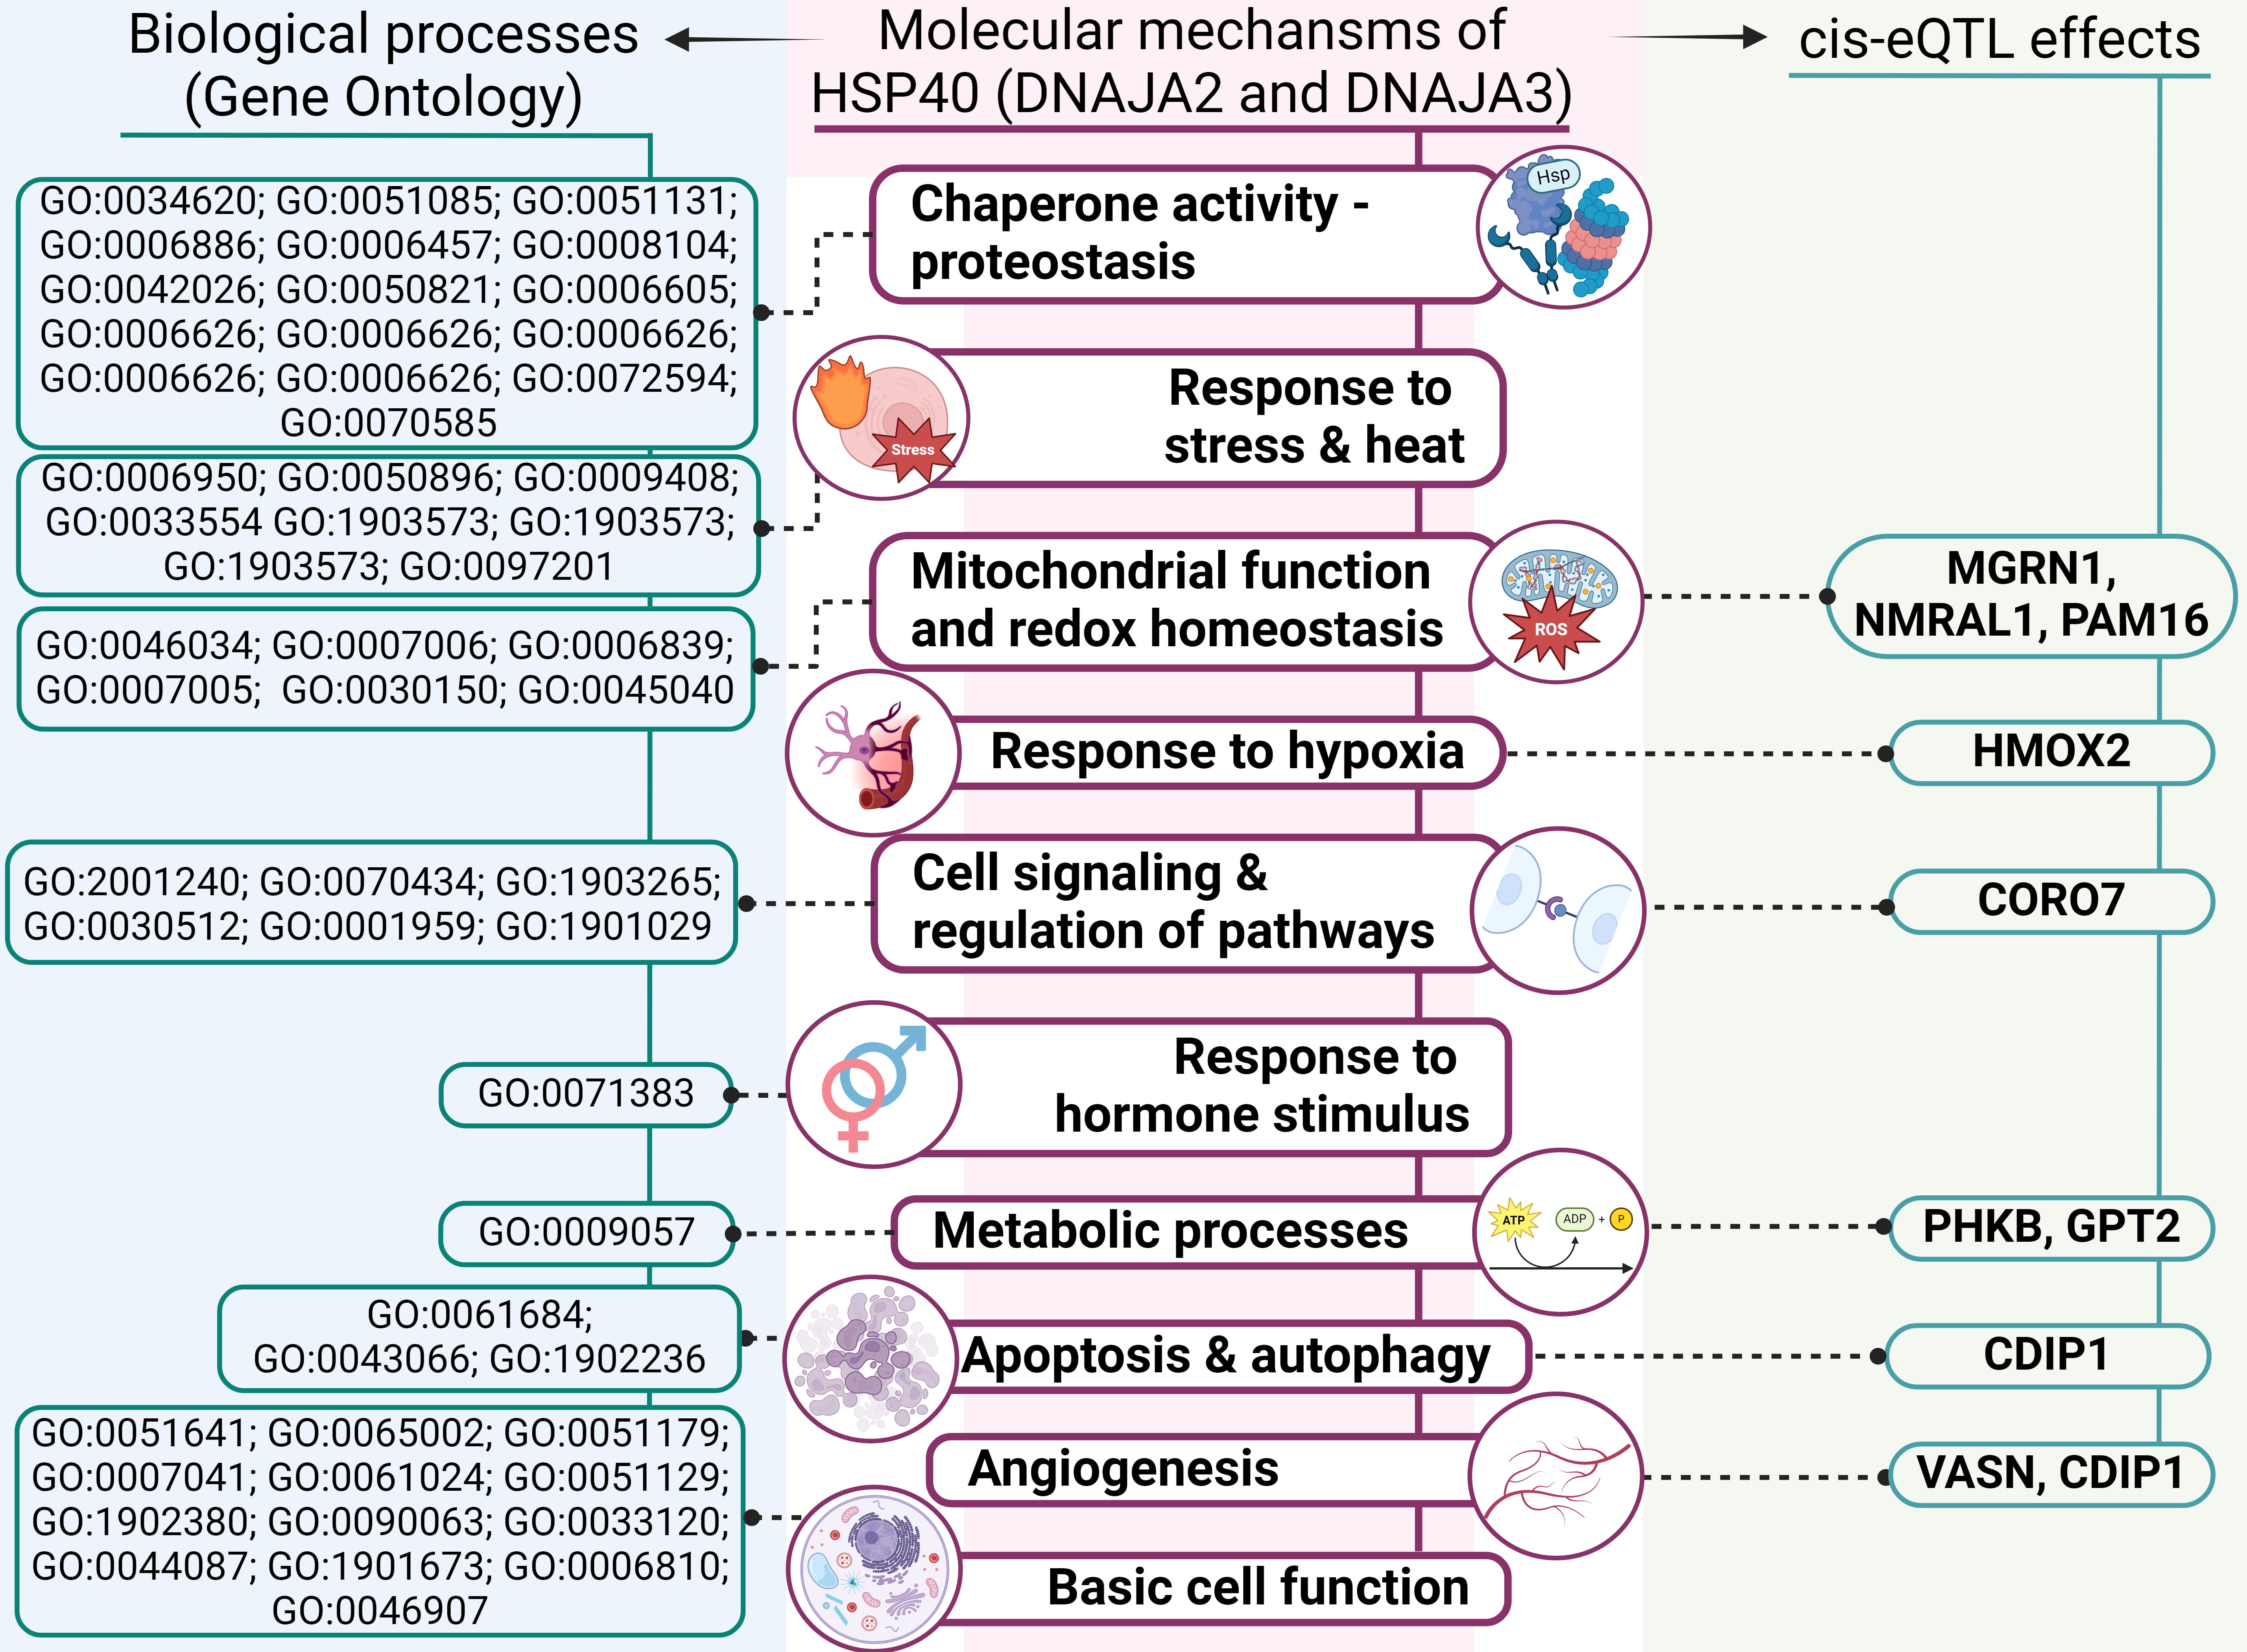 Fig. 7.
An outline of involvement of HSP40 genes’ polymorphisms in molecular mechanisms of IS (results of comprehensive annotation of the SNPs). GO, Gene Ontology; ROS, reactive oxygen species.
First, analysis of DNAJA2’s protein–protein interactions uncovered its interactions with numerous chaperones, including HSPA8 and adapter proteins, which we have previously found to be associated with IS risk [45, 46]. The STRING database analysis revealed that DNAJA2 and DNAJA3, along with their functional partners, participate in various biological processes essential for cell function and survival, such as proteostasis, mitochondrial homeostasis, autophagy and the cellular response to stress. Notably, DNAJA2 takes part in the cellular response to a steroid hormone stimulus, thereby providing an additional link to the sex-specific properties of SNP rs2034598 DNAJA2 (Fig. 7).
Second, TF-associated biological processes of the studied SNPs include angiogenesis, regulation of apoptotic process, response to oxidative stress, regulation of inflammation and cytokine production. Angiogenesis — a critical defensive reaction to hypoxia — plays a major part in the modulation of long-term neurological recovery after IS [47]. Regulation of apoptosis is crucial for improving post-stroke recovery [48]. The oxidative stress that develops under ischemic conditions [49] not only leads to cell death but also contributes to the pathogenesis of IS by breaking down the blood–brain barrier and causing focal destructive lesions [50]. Inflammation further exacerbates neuronal cell death [51] and is central to the development of atherosclerosis: a major risk factor for IS [52].
Third, data from the CDKP indicate that the analysed SNPs are associated with large-artery stroke, IS-related phenotypes (e.g., blood pressure, heart rate or hypertension) and white-matter hyperintensities in cerebral small vessel disease as well as other atherosclerosis-related disorders (e.g., coronary artery disease, coronary artery calcification and myocardial infarction).
Fourth, our examination of cis-eQTL effects revealed that the DNAJA2 and DNAJA3 SNPs influence expression levels of several genes, implying possible mechanisms by which HSP40 SNPs may affect IS development. Among those genes with altered expression are NMRAL1, HMOX2, CDIP1, CORO7, MGRN1, PAM16, VASN, PHKB and GPT2 (Fig. 7) [53].
NMRAL1 regulates redox homeostasis by suppressing reactive oxygen species (ROS)
and nitric oxide (NO) production. Intensive and persistent oxidative stress leads to
translocation of NMRAL1 from the cytoplasm to the nucleus, where it regulates the
DNA damage response while linking cellular redox status to other signalling
pathways and fine-tuning the cellular response to redox changes [54]. Considering
the leading role of oxidative stress in the risk of atherosclerosis-associated
diseases [23, 55, 56], including IS, as evidenced by numerous articles [20, 57], the
regulation of oxidative stress by NMRAL1 is particularly noteworthy. In hypoxia,
a critical factor of cardiovascular pathologies [58, 59, 60] that is called HMOX2
senses the lower O2 concentration and reduces the formation of carbon monoxide (CO) [61].
HMOX2-deficient mice exhibit increased apoptosis around the infarct area
following focal transient ischemia, indicating a protective effect of HMOX2
against IS [62]. Silencing of CDIP1 inhibits apoptosis and improves
angiogenesis in myocardial infarction [63], thus highlighting its participation
in apoptotic regulation and a vascular response to ischemic injury [64]. CORO7 is
required for the activation of the Hippo pathway, which controls tissue
homeostasis through the modulation of cell proliferation and apoptosis [65]. The
hippo pathway takes part in pathological processes of IS, including oxidative
stress, an inflammatory response, blood–brain barrier damage, mitochondrial
disorders and neural cell death [66]. Loss of MGRN1 has chronic and age-dependent
effects on mitochondrial homeostasis in the brain [67]. PAM16 encodes a
mitochondrial protein involved in granulocyte-macrophage colony-stimulating
factor (GM-CSF) signal transduction; this signalling pathway enhances collateral
artery growth and reduces infarct volume in a mouse model of brain ischemia [68].
This protein also participates in the import of nuclear-encoded mitochondrial
proteins into the mitochondrial matrix and may be important in ROS homeostasis
[69]. Following arterial injury, neointimal development is facilitated by the
down-regulation of VASN (vasorin), indicating that it modifies the arterial
wall’s biological responses to pathogenic stimuli [70]. PHKB encodes the
Future research should focus on the functional effects of the HSP40 family SNPs not covered in this work and their potential roles in IS pathogenesis. Moreover, understanding how HSP40 family SNPs regulate gene expression and protein function in the context of IS is crucial. Longitudinal studies are also needed to track changes in HSP40 genes’ expression and proteins’ levels in IS patients, through examination of associations with disease progression and outcomes. Finally, our findings may help to identify therapeutic targets within HSP40 pathways and thus could lead to the development of novel interventions for the prevention and treatment of IS.
Our study is the first to demonstrate a role of HSP40 SNPs in the risk of IS and its clinical manifestations. We analysed intergenic and gene–environment interactions of HSP40 SNPs towards IS risk and performed a comprehensive bioinformatic analysis to reveal the underlying molecular mechanisms. This approach provides new insights into the genetic factors influencing IS and highlights the significance of HSP40 polymorphisms in the disease’s pathogenesis.
First, we were unable to include other HSP40 SNPs in the study owing to methodological challenges; this limitation could have led to loss of information about the associations of these SNPs with the risk of IS. Second, the absence of data on physical activity and fruit and vegetable intake in the control group limited our ability to conduct MB-MDR and MDR modelling that would have incorporated these environmental factors. Third, we did not measure HSP40 gene expression, thereby precluding analysis of differences in expression levels between males and females and assessment of sex-specific differences as well as evaluation of the effect of DNAJA2 genotypes on gene expression levels.
All data reported in this paper will be shared by the lead contact upon request from corresponding author.
OYB designed the research study. KAK, DEG, VMP and EAP performed the research. AVP analyzed the data. KAK, DEG and OYB wrote the manuscript. All authors contributed to editorial changes in the manuscript. All authors read and approved the final manuscript. All authors have participated sufficiently in the work and agreed to be accountable for all aspects of the work.
The study partially used biological material from the biobank of the Research Institute of Genetic and Molecular Epidemiology, collected from 2010 to 2012 as part of previously conducted studies (with permission from the Ethical Review Committee of Kursk State Medical University, Protocol No. 1 from 21.01.2010). Additional collection of biological material for the purpose of this study was carried out in the period 2015–2017 (Protocol No. 12 from 7.12.2015). The study was conducted according to the guidelines of the Declaration of Helsinki. All the participants or their families/legal guardians gave written informed consent before the enrollment in this study.
Not applicable.
This research was funded by Russian Science Foundation (№ 22-15-00288, https://rscf.ru/en/project/22-15-00288/).
The authors declare no conflict of interest.
Supplementary material associated with this article can be found, in the online version, at https://doi.org/10.31083/j.jin2312211.
References
Publisher’s Note: IMR Press stays neutral with regard to jurisdictional claims in published maps and institutional affiliations.