


 , Jin Lv 1,3,*
1 Central Laboratory of Research Department, the PLA Rocket Force Characteristic Medical Center, 100088 Beijing, China
2 School of Public Health, University of Hong Kong, 999077 Hong Kong, China
3 Department of Vascular Neurosurgery, New Era Stroke Care and Research Institute, The PLA Rocket Force Characteristic Medical Center, 100088 Beijing, China
4 Department of Critical Care Medicine, New Era Stroke Care and Research Institute, The PLA Rocket Force Characteristic Medical Center, 100088 Beijing, China
5 Department of Neurology, Baotou Central Hospital, 014040 Baotou, Inner Mongolia, China
†These authors contributed equally.
Abstract
Background: Early neurological deterioration (END), generally defined
as the increment of National Institutes of Health Stroke Scale (NIHSS) score
Keywords
- early neurological deterioration (END)
- intravenous thrombolysis (IVT)
- endovascular treatment (EVT)
- reperfusion therapy
- predictors
The past decade has witnessed substantial advances in the treatment of acute
ischemic stroke (AIS). Evidence-based reperfusion therapies such as intravenous
thrombolysis (IVT) and mechanical thrombectomy have been shown to improve
outcomes in AIS and become the standard care for AIS patients. However, despite
these major improvement, only less than half of patients achieve functional
independence (mRS 0–2) at 90 days as a result of treatment, leaving the others
at a high risk of disability and death [1]. Most of the poor 90-day outcomes in
AIS after reperfusion therapy (i.e., IVT and/or endovascular treatment) are
reported to be largely associated with early neurological deterioration (END).
END generally refers to a
Thus far, END has only been addressed in either IVT or EVT setting. Few studies considered IVT and EVT as a whole for reperfusion therapy. Unfortunately, the latter is more like the cases in the real world. Furthermore, the exact rate and predictors of END have not been systematically investigated. Therefore, we present here a systematic review and meta-analysis of the predictors of END following reperfusion therapy (IVT and/or EVT) in AIS patients. Specifically, we categorized the predictors of END into three groups, IVT, EVT and overall reperfusion therapy, to study the treatment-specific risk factors.
This meta-analysis followed the Preferred Reporting Items for Systematic Reviews and Meta-Analyses (PRISMA) guidelines [10]. Studies published in English between January 2000 and December 2022 were identified by searching PubMed, Web of Science and EBSCO databases. Key search terms were ‘neurological deterioration’, ‘neurological deficit’, ‘neurological decline’, ‘thrombolysis’, ‘thrombolytic treatment’, ‘thrombolytic therapy’, ‘IV rtPA’, ‘endovascular treatment’, ‘endovascular therapy’, ‘mechanical thrombectomy’, ‘acute ischemic stroke’, ‘acute cerebral ischaemia’, ‘proximal vessel occlusion’, ‘proximal artery occlusion’, ‘large vessel occlusion’, ‘large artery occlusion’, ‘vertebrobasilar artery occlusion’, ‘basilar artery occlusion’, ‘middle cerebral artery occlusion’, ‘internal cerebral artery occlusion’. Details of the search algorithm is shown in Appendix I and the Supplementary Materials. Fig. 1 presents the specific screening process.
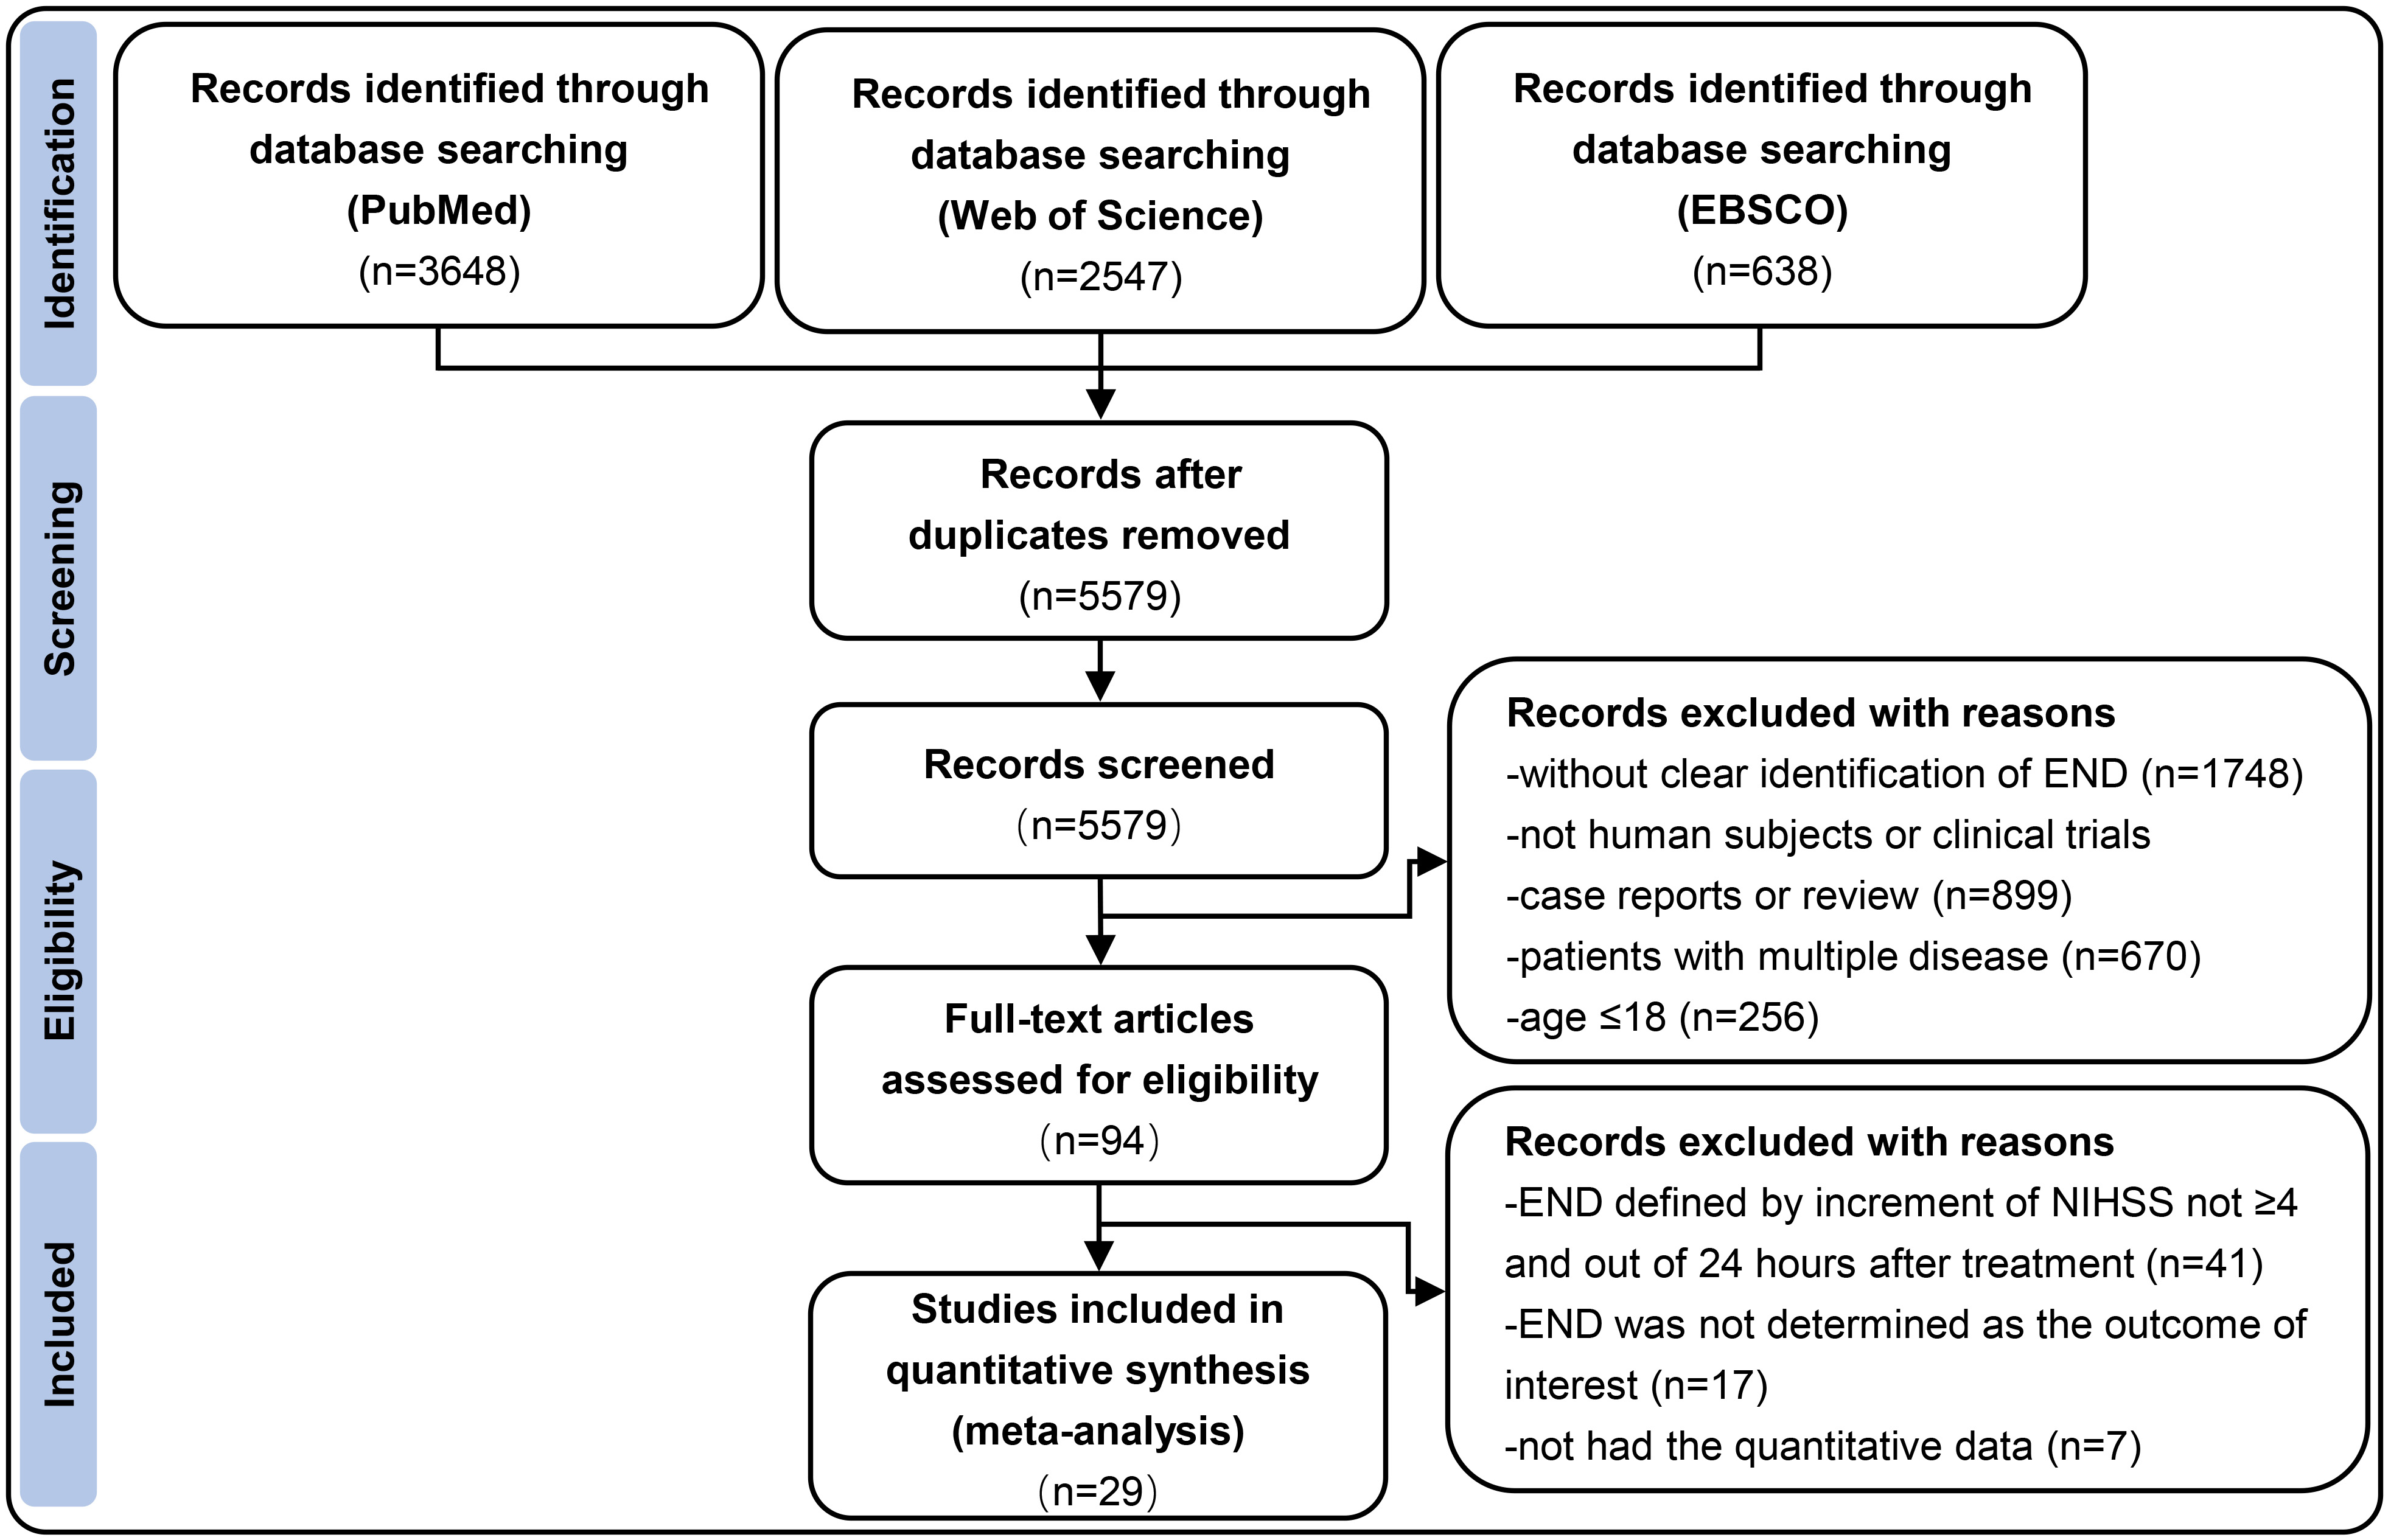 Fig. 1.
Flow diagram depicting the selection of studies eligible for analysis. END indicates early neurological deterioration; NIHSS indicates National Institutes of Health Stroke Scale.
We included all studies that investigated predictors of END for adult patients
with AIS who received IVT and/or EVT if they met the following criteria: (1) age
We excluded studies (1) in animals and studies that did not provide sufficient
information needed in the meta-analysis; (2) patients with baseline pre-stroke
mRS score
Two authors (L.J. and S.H.X.) independently searched the literature, screened eligible studies, and extracted data on the first author’s name, year of publication, study design, sample size, number of patients in END and non-END groups, baseline characteristics, vascular comorbid conditions (history of hypertension, diabetes, atrial fibrillation), NIHSS on admission, Alberta Stroke Program Early CT Scores (ASPECT), lesion location (Internal Carotid Artery (ICA), Middle Cerebral Artery (MCA)), treatment strategy, and the onset to treatment time (OTT). Any disagreement was discussed and resolved by consensus among three other authors (L.C., Z.Y.Q., and L.X.). Three independent authors (L.A.F., L.Y.E, and W.S.) assessed the quality of each included study by using the CONSORT checklist for randomized controlled trials or the STROBE checklist for observational studies [11, 12]. Studies with quality scores of 8–10 were recognized as high quality whereas those who scored 7 or less were considered as low quality. Details of quality assessment scoring are shown in Appendix II and Supplementary Fig. 1.
The risk ratio (RR) of the binary variable or the standardized mean difference
(SMD) of the continuous variable with the 95% confidence intervals (CI) were
calculated as summary statistics in this meta-analysis. The overall RR and SMD
for all pooled data were calculated using the random effect method. Mean and
standard deviation (SD) were calculated using the method described by Luo
et al. [13] if the studies reported median and inter-quartile range
(IQR). We assessed the publication bias using Egger’s test for continuous
variables and Peters test for binary variables in addition to visual analysis of
the funnel plots. The I
The search yielded 6833 relevant records from PubMed, Web of Science, and EBSCO. Finally, a total of 29 studies involving 65,960 AIS patients suffering from END within 24 hours following IVT and/or EVT were included [1, 15, 16, 17, 18, 19, 20, 21, 22, 23, 24, 25, 26, 27, 28, 29, 30, 31, 32, 33, 34, 35, 36, 37, 38, 39, 40, 41, 42, 43]. The specific study selection process was reported in a PRISMA flowchart (Fig. 1). The basic characteristics of all included articles were shown in Table 6 (Ref. [15, 16, 17, 18, 19, 20, 21, 22, 23, 24, 25, 26, 27, 28, 29, 30, 31, 32, 33, 34, 35, 36, 37, 38, 39, 40, 41, 42, 43]).
| No. | Source (Author/Year/Country) | Sample size (Total, END, non-END) | Age, year | Study design | Interventions | Location lesion | Time of stroke onset | Quality score |
|---|---|---|---|---|---|---|---|---|
| 1 | Luo et al. 2022. China [15] | T = 406 | END | A retrospective analysis of a prospectively maintained data | EVT | M1, M2, ICA, ACA, BA | Within 4.5 h | 9 |
| END = 88 | 70 (60–78) | |||||||
| Non-END = 318 | Non-END | |||||||
| 71 (64–77) | ||||||||
| 2 | Lattanzi et al. 2022. Italy [16] | T = 211 | END | A retrospective analysis based a longitudinal study | EVT | M1, M2, internal carotid artery, internal carotid artery terminus, middle cerebral artery | Within 4.5 h | 9 |
| END = 30 | 72 |
|||||||
| Non-END = 181 | Non-END | |||||||
| 79 |
||||||||
| 3 | Xu et al. 2022. China [17] | T = 406 | END | A retrospective cohort analysis based on prospectively collected data | IVT | ICA, M1, basilar artery | Within 4.5 h | 9 |
| END = 64 | 63.0 (56.0–69.5) | |||||||
| Non-END = 342 | Non-END | |||||||
| 64.5 (55.0–73.0) | ||||||||
| 4 | Zhang et al. 2022. China [18] | T = 591 | END | A multicenter, prospective, randomized, open-label trial | EVT | MCA, Intracranial ICA | Within 4.5 h | 10 |
| END = 111 | 70 (63–78) | |||||||
| Non-END = 480 | Non-END | |||||||
| 69 (60–76) | ||||||||
| 5 | Che et al. 2022. China [19] | T = 1107 | END | A multicenter prospective stroke registry | rtPA | N/A | Within 4.5 h | 10 |
| END = 81 | 64.47 |
|||||||
| Non-END = 1026 | Non-END | |||||||
| 63.34 |
||||||||
| 6 | Wang et al. 2022. China [20] | T = 798 | END | A retrospective analysis of a prospectively maintained data | IVT | N/A | Within 4.5 h | 9 |
| END = 139 | 69 |
|||||||
| Non-END = 659 | Non-END | |||||||
| 66 |
||||||||
| 7 | Shah et al. 2021. USA [21] | T = 1238 | END | A retrospective analysis of a prospectively maintained data | IV tPA | ICA, M1, P1, and basilar artery, Vertebrobasilar | Within 4.5 h | 10 |
| END = 91 | 72 |
|||||||
| Non-END = 1147 | Non-END | |||||||
| 69 |
||||||||
| 8 | Fabritius et al. 2021. Germany [22] | T = 211 | END | A prospective consecutive cohort study | EVT or bridging therapy (IVT plus EVT) | Anterior circulation of LVO | Within 4.5 h | 9 |
| END = 38 | 78 (72-80) | ICA, MCA | ||||||
| Non-END = 173 | Non-END | |||||||
| 74 (63–81) | ||||||||
| 9 | Li et al. 2021. China [23] | T = 343 | AD | Retrospective analysis of prospectively collected observational study | EVT | Anterior circulation of LVO | ND, 257 (210–300) | 9 |
| END = 90 | 70.7 |
ICA, MCA | ||||||
| Non-END = 214 | Non-ND | |||||||
| 67.7 |
||||||||
| 10 | Seners et al. 2021. France [24] | T = 721 | END | A retrospective analysis based a longitudinal study | IVT | BA, ICA, M1 or M2 | Within 4.5 h | 10 |
| END = 88 | 69 |
|||||||
| Non-END = 633 | Non-END | |||||||
| 70 |
||||||||
| 11 | Gong et al. 2021. China [25] | T = 1060 | END | A prospective longitudinal study | IVT | Anterior circulation | Within 4.5 h | 10 |
| END = 193 | 73.2 |
Posterior circulation | ||||||
| Non-END = 469 | Non-END | |||||||
| ENI = 398 | 69.6 |
|||||||
| ENI | ||||||||
| 68.1 |
||||||||
| 12 | Boulenoir et al. 2020. France [26] | T = 74 | END | A multicenter retrospective analysis based on prospective study | IVT | iICAo, ICA, MCA, basilar artery | Within 4.5 h | 8 |
| END = 22 | 62 (54–71) | |||||||
| Non-END = 52 | Non-END | |||||||
| 64 (54–74) | ||||||||
| 13 | Girot et al. 2020. France [27] | T = 1925 | END | Multicenter prospective observational registry | EVT alone or bridging therapy (IVT plus EVT) | ICA. M1/ M2 | Within 4.5 h | 10 |
| END = 128 | 75.1 |
|||||||
| Non-END = 1797 | Non-END | |||||||
| 69.8 |
||||||||
| 14 | Tanaka et al. 2020. Japan [28] | T = 744 | END | a retrospective design on Multicenter retrospective observational study | IVT (IVT bridging EVT) | ICA, MCA, BA | Within 4.5 h | 10 |
| END = 79 | H: 78 (67–87.5); I: 75 (64–81) | |||||||
| Non-END = 665 | Non-END | |||||||
| 75 (66–82) | ||||||||
| 15 | Yu et al. 2020. United Kingdom [29] | T = 50726 | END | a retrospective analysis on a multinational open registry project | IVT | Left hemisphere, posterior | Within 4.5 h | 9 |
| END = 3415 | 76 (69–83) | |||||||
| Non-END = 47311 | Non-END | |||||||
| 72 (63–81) | ||||||||
| 16 | Lee et al. 2020. USA [30] | T = 81 | END | A prospective study | IVT | anterior circulation LVO as M1, M2, or carotid artery terminus (ICAT) | Within 4.5 h | 7 |
| END = 28 | 70.8 | |||||||
| Non-END = 53 | Non-END | |||||||
| 63.2 | ||||||||
| 17 | Zhong et al. 2020. China [31] | T = 148 | END | A prospectively registered consecutive cohort study | Basilar EVT | BAO | Within 24 h | 9 |
| END = 21 | 56 (49–65) | |||||||
| Non-END = 127 | Non-END | |||||||
| 61 (54–67) | ||||||||
| 18 | He et al. 2020. China [32] | T = 341 | END | A prospectively study | IVT | Within 4.5 h | 8 | |
| END = 65 | 67.14 |
|||||||
| Non-END = 276 | Non-END | |||||||
| 64.87 |
||||||||
| 19 | Wang et al. 2020. China [33] | T (END) = 581 | END | Single center retrospectively study | IVT | Within 4.5 h | 9 | |
| END = 50 | 59.5 (53.5–67.5) | |||||||
| No END = 531 | Non-END | |||||||
| 62 (53–69) | ||||||||
| 20 | Soomro et al. 2020. USA [34] | T = 178 | END | Retrospective cohort | EVT | LVO | Within 6 h for anterior; 6 to 24 h for posterior | 9 |
| END = 26 | 60.5 (53–69) | |||||||
| Non-END = 152 | Non-END | |||||||
| 63 (53–75) | ||||||||
| 21 | Gong et al. 2019. China [35] | T = 342 | END | Prospectively study | IVT (IVT+EVT) | proximal arte‐ rial occlusion | Within 4.5 h | 9 |
| END = 86 | 70.9 |
|||||||
| No-END = 256 | Non-END | |||||||
| 67.2 |
||||||||
| 22 | Zhang et al. 2019. China [36] | T = 563 | END | Multicenter, large prospective cohort study | IVT (IVT+EVT) | within 4.5 h | 9 | |
| END = 83 | 69.1 |
|||||||
| Non-END = 480 | Non-END | |||||||
| 66.2 |
||||||||
| 23 | Mazya et al. 2018. Sweden [37] | T = 587 | END | Secondary data analysis on an ongoing, prospective, multinational centers cohort study | IVT | occlusion of large proximal and distal cerebral arteries | 9 | |
| END = 53 | 67 (59–75) | |||||||
| Non-END = 534 | Non-END | |||||||
| 67 (57–76) | ||||||||
| 24 | Seners et al. 2017. France [38] | T = 120 | END | Secondary analysis on a prospective cohort study | IVT | MCA | Within 4.5 h | 9 |
| END = 22 | 75.7 |
|||||||
| Non-END = 98 | Non-END | |||||||
| 68.0 |
||||||||
| 25 | Simonsen et al. 2016. Denmark [39] | T = 569 | END | A single center prospective cohort study | IVT | Small vessel disease, Large vessel disease | Less than 3 hours, extended to 4.5 hours | 10 |
| END = 33 | 66 (61–74) | |||||||
| Non-END = 536 | 73 (60.5–80.75) | |||||||
| Non-END | ||||||||
| 66 (57–74) | ||||||||
| 26 | Zinkstok et al. 2014. The Netherlands [40] | T = 640 | END | A prospective, multi-center, randomized controlled trial | IVT (Asprin + standard treatmetn) | 113 (85–150) | 9 | |
| END = 31 | 71.1 |
115 (85–165) | ||||||
| Non-END = 609 | Non-END | |||||||
| 66.7 |
||||||||
| 27 | Mori et al. 2012. Japan [41] | T = 566 | END | A retrospective, multicenter, observational cohort study | IVT | AIS, ICA | Within 3 h | 10 |
| END = 56 | 71.5 |
|||||||
| Non-END = 510 | Non-END | |||||||
| 72.0 |
||||||||
| 28 | Seners et al. 2014. France [42] | T = 309 | END | A retrospective cohort | IVT | Anterior circulation (MCA) | Within 4.5 h | 9 |
| END = 23 | 73.1 |
|||||||
| Non-END = 276 | Non-END | |||||||
| 68.6 |
||||||||
| 29 | Saqqur et al. 2007. Canada [43] | T = 374 | END | A retrospective study | IVT | M1, M2, ICA, BA | Within 3 h | 9 |
| END = 44 | 66.1 |
|||||||
| Non-END = 330 | Non-END | |||||||
| T = 374 | 68.8 |
Fig. 2 shows the pooled overall incidence of END following reperfusion therapy in AIS patients was 14% (95% CI, 12%–15%). In the subgroup analysis, the incidence of END occurring after IVT was 13% (95% CI, 11%–14%), and was 17% after EVT (95% CI, 11%–23%).
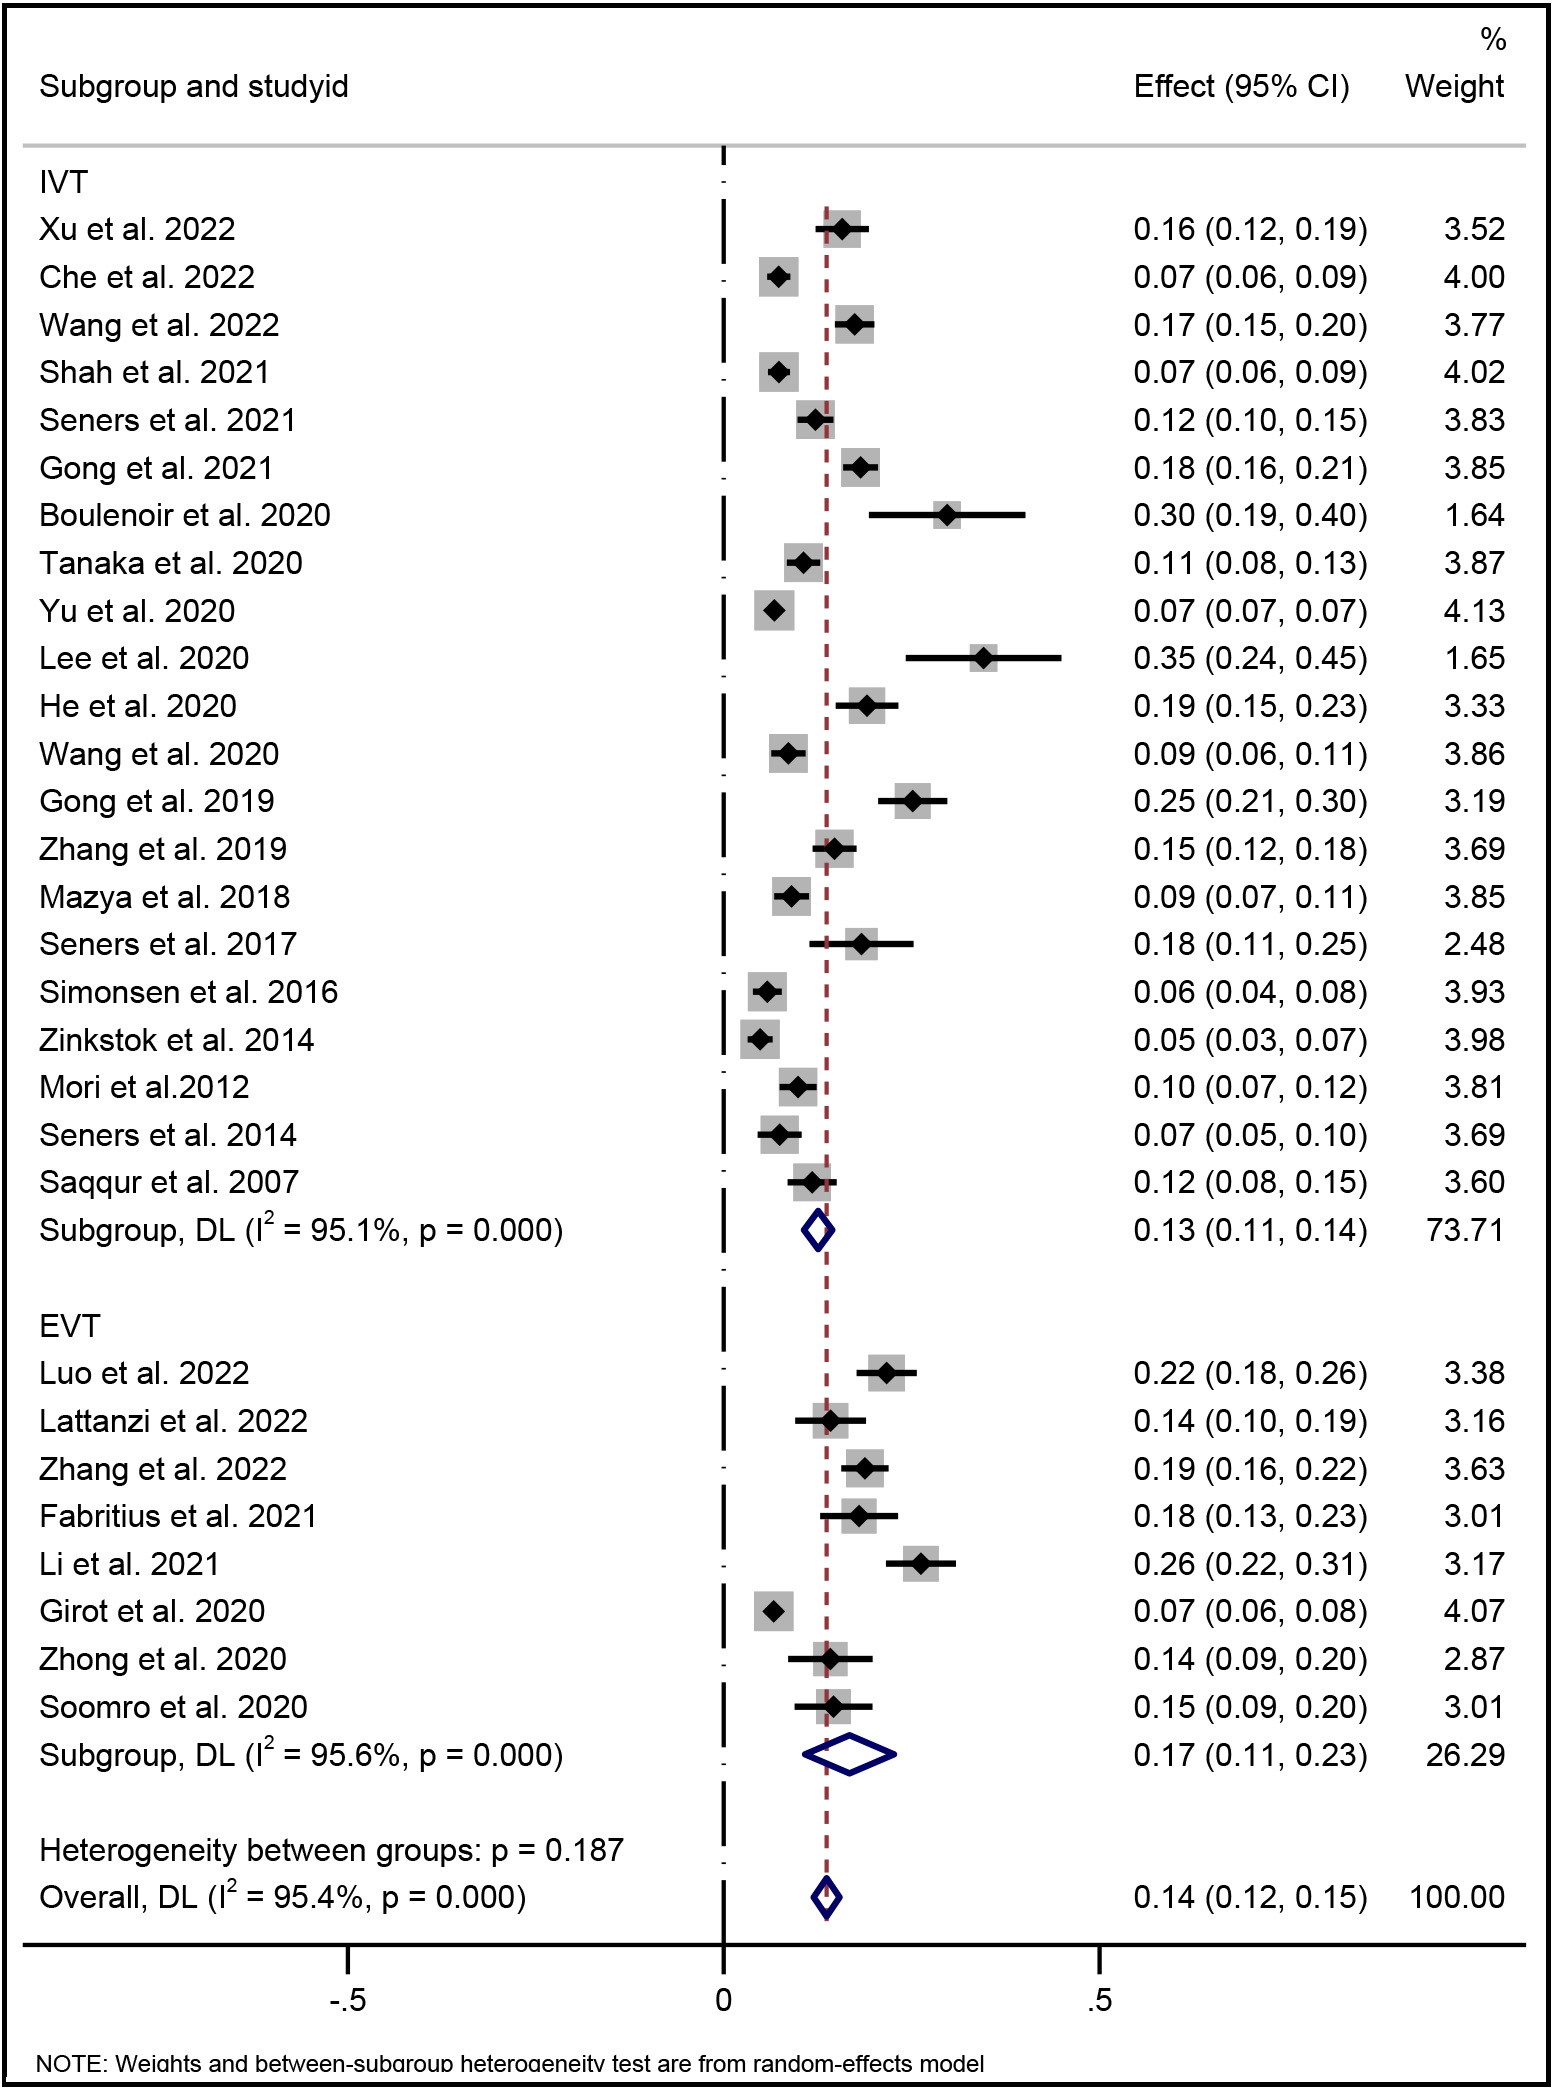 Fig. 2.
Forest plot of pooled incidence of END with random-effect method in AIS patients underwent reperfusion therapy (IVT and/or EVT). END indicates early neurological deterioration; IVT indicates intravenous thrombolysis; and EVT indicates endovascular therapy.
The following risk factors of END in AIS patients after reperfusion therapies were evaluated: age, initial NIHSS, systolic blood pressure (SBP), glucose level at admission, OTT, ASPECT, history of hypertension, diabetes mellitus (DM), arterial fibrillation (AF), stroke subtype by TOAST criteria (large artery atherosclerosis, cardioembolism, others or unknown), occlusion site, and successful recanalization (SR).
For all included studies, the meta-analysis showed that higher age (Effect, overall: 0.16, 95% CI: 0.09–0.23), SBP (Effect, overall: 0.25, 95% CI: 0.14–0.37), glucose level at admission (Effect, overall: 0.44, 95% CI: 0.32–0.57), OTT (RR, overall: 0.07, 95% CI: 0.00–0.13), history of hypertension (RR, overall: 1.29; 95% CI: 1.17–1.42), DM (RR, overall: 1.37; 95% CI: 1.18–1.60) were significantly associated with END after reperfusion therapies (Figs. 3,4).
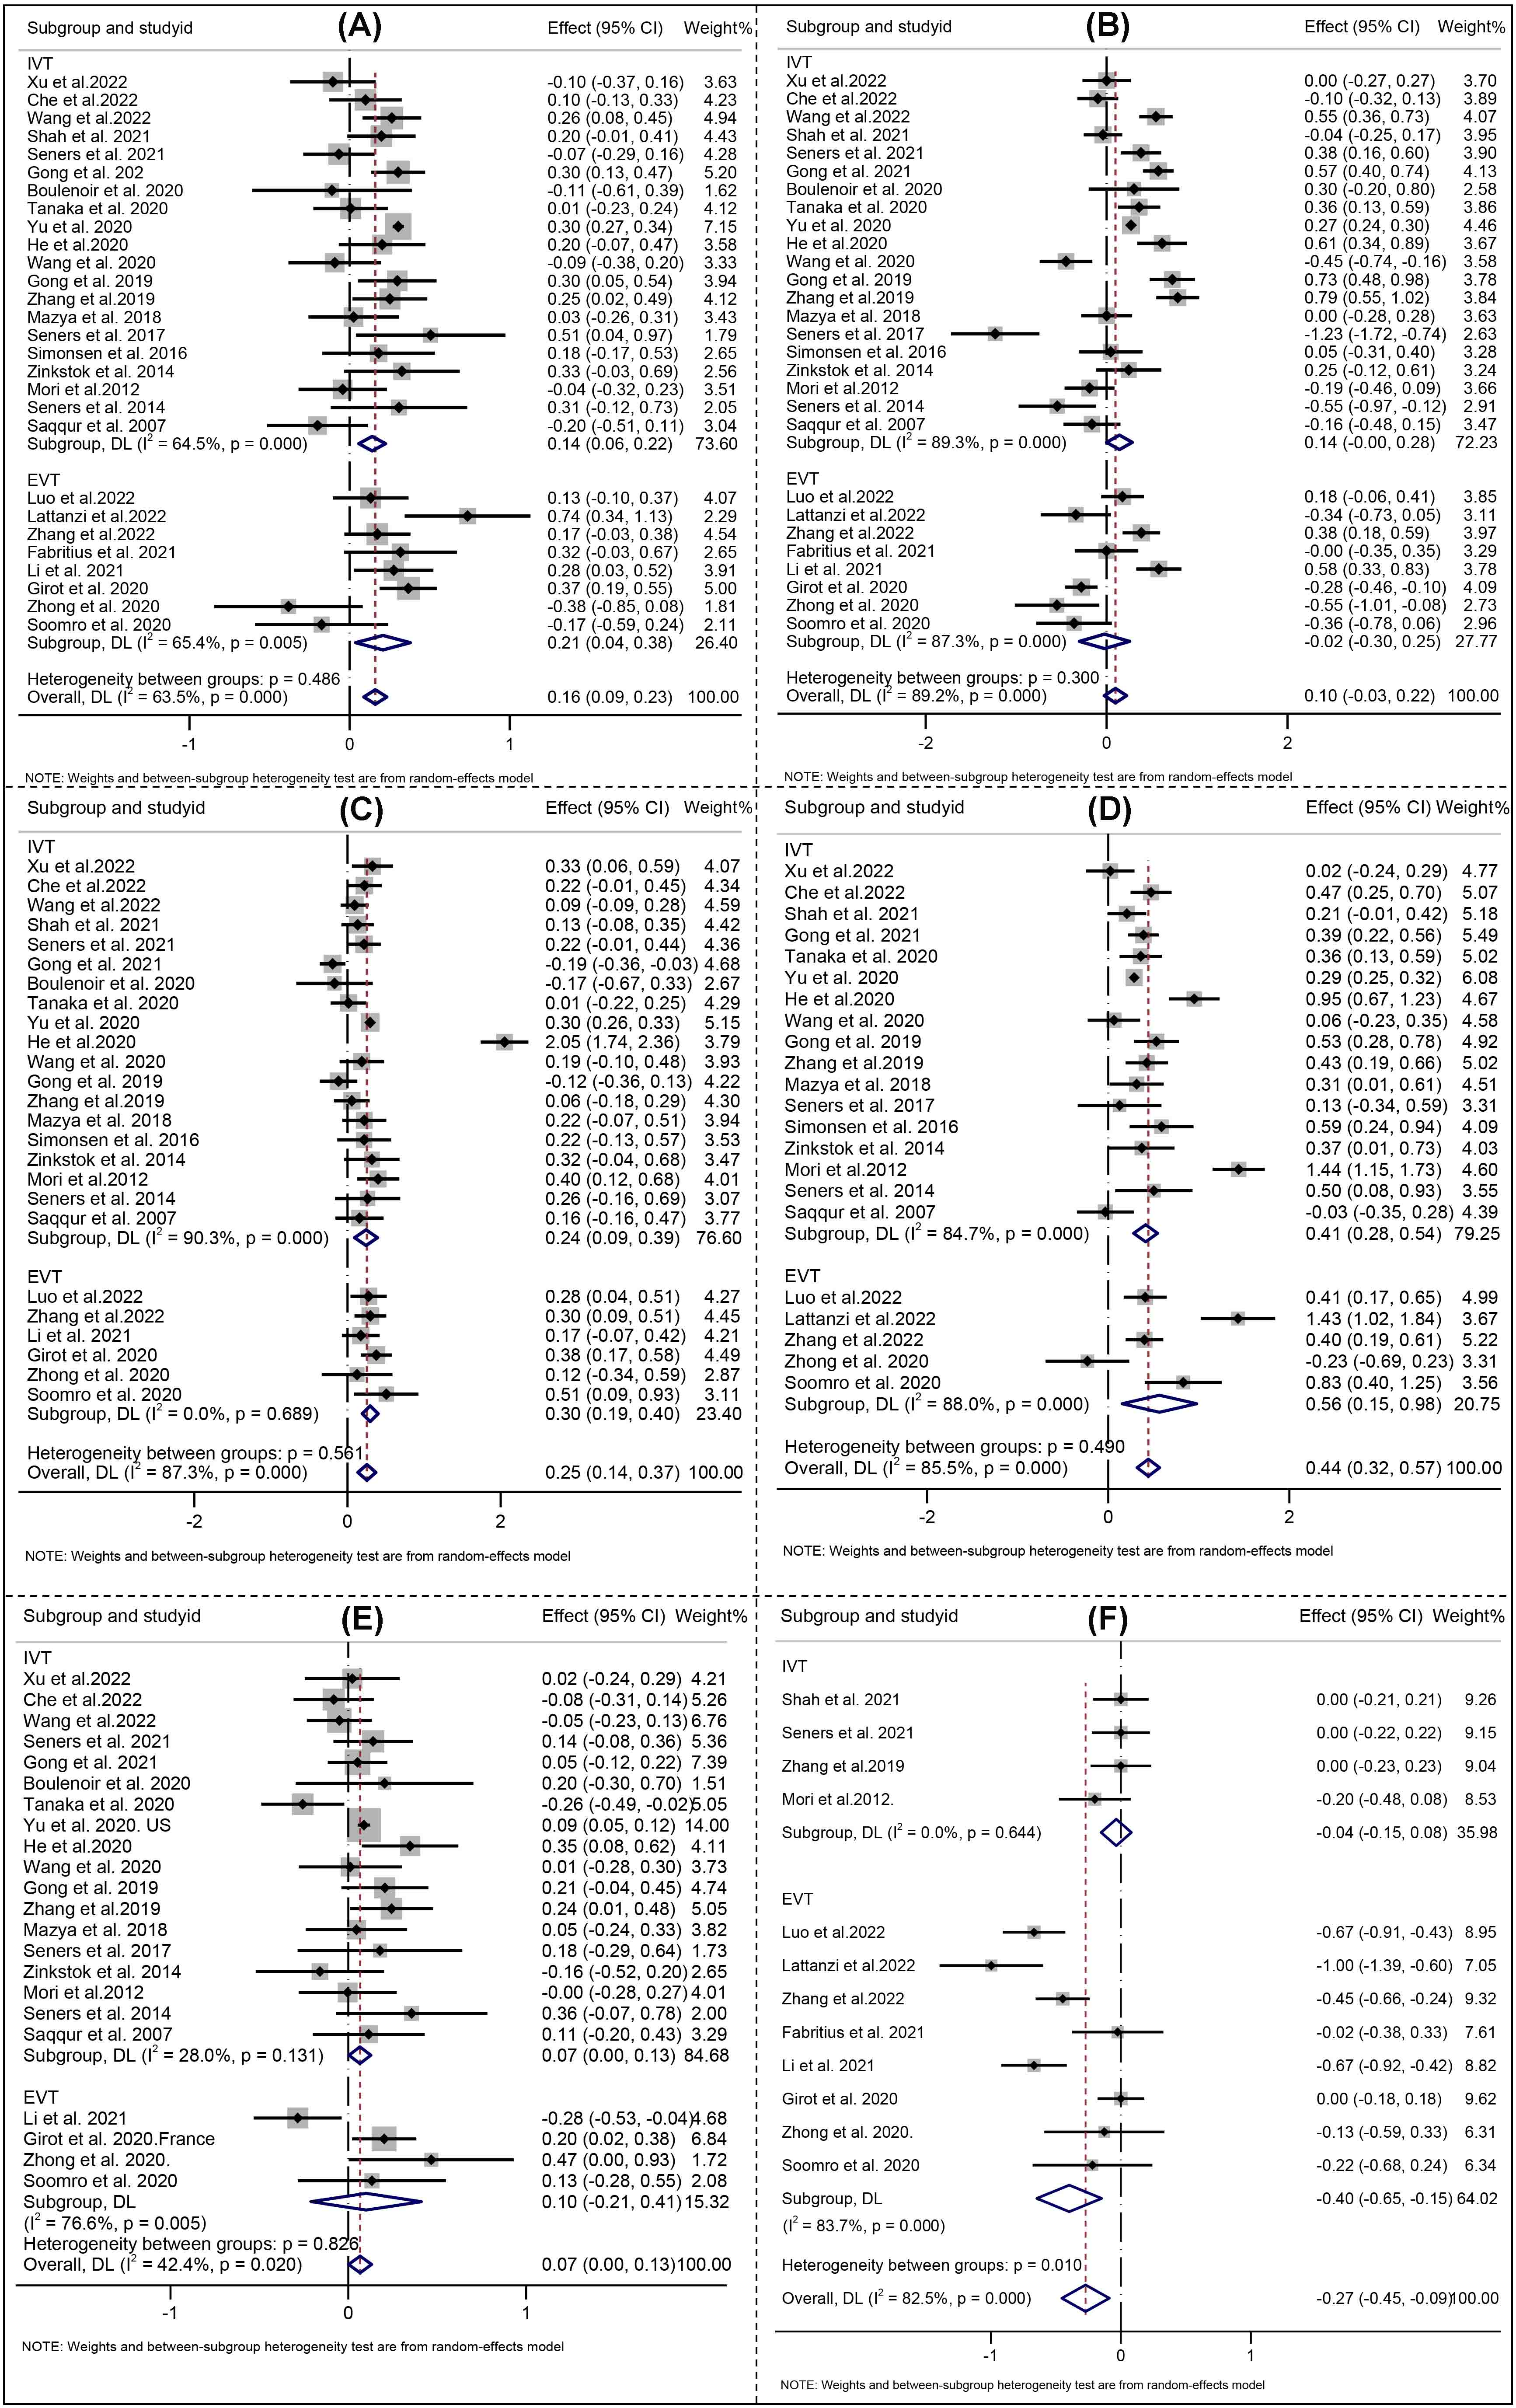 Fig. 3.
Forest Plots of (A) Age; (B) Initial NIHSS; (C) Systolic blood pressure; (D) Serum glucose; (E) Onset to treatment time; (F) ASPECT score. NIHSS indicates National Institutes of Health Stroke Scale; ASPECT indicates Alberta Stroke Early CT score. IVT indicates intravenous thrombolysis, and EVT indicates endovascular therapy. The solid squares denote the standardized mean differences (Effects), the horizontal lines represent the 95% confidence intervals (CIs), and the diamonds denote the pooled effect size.
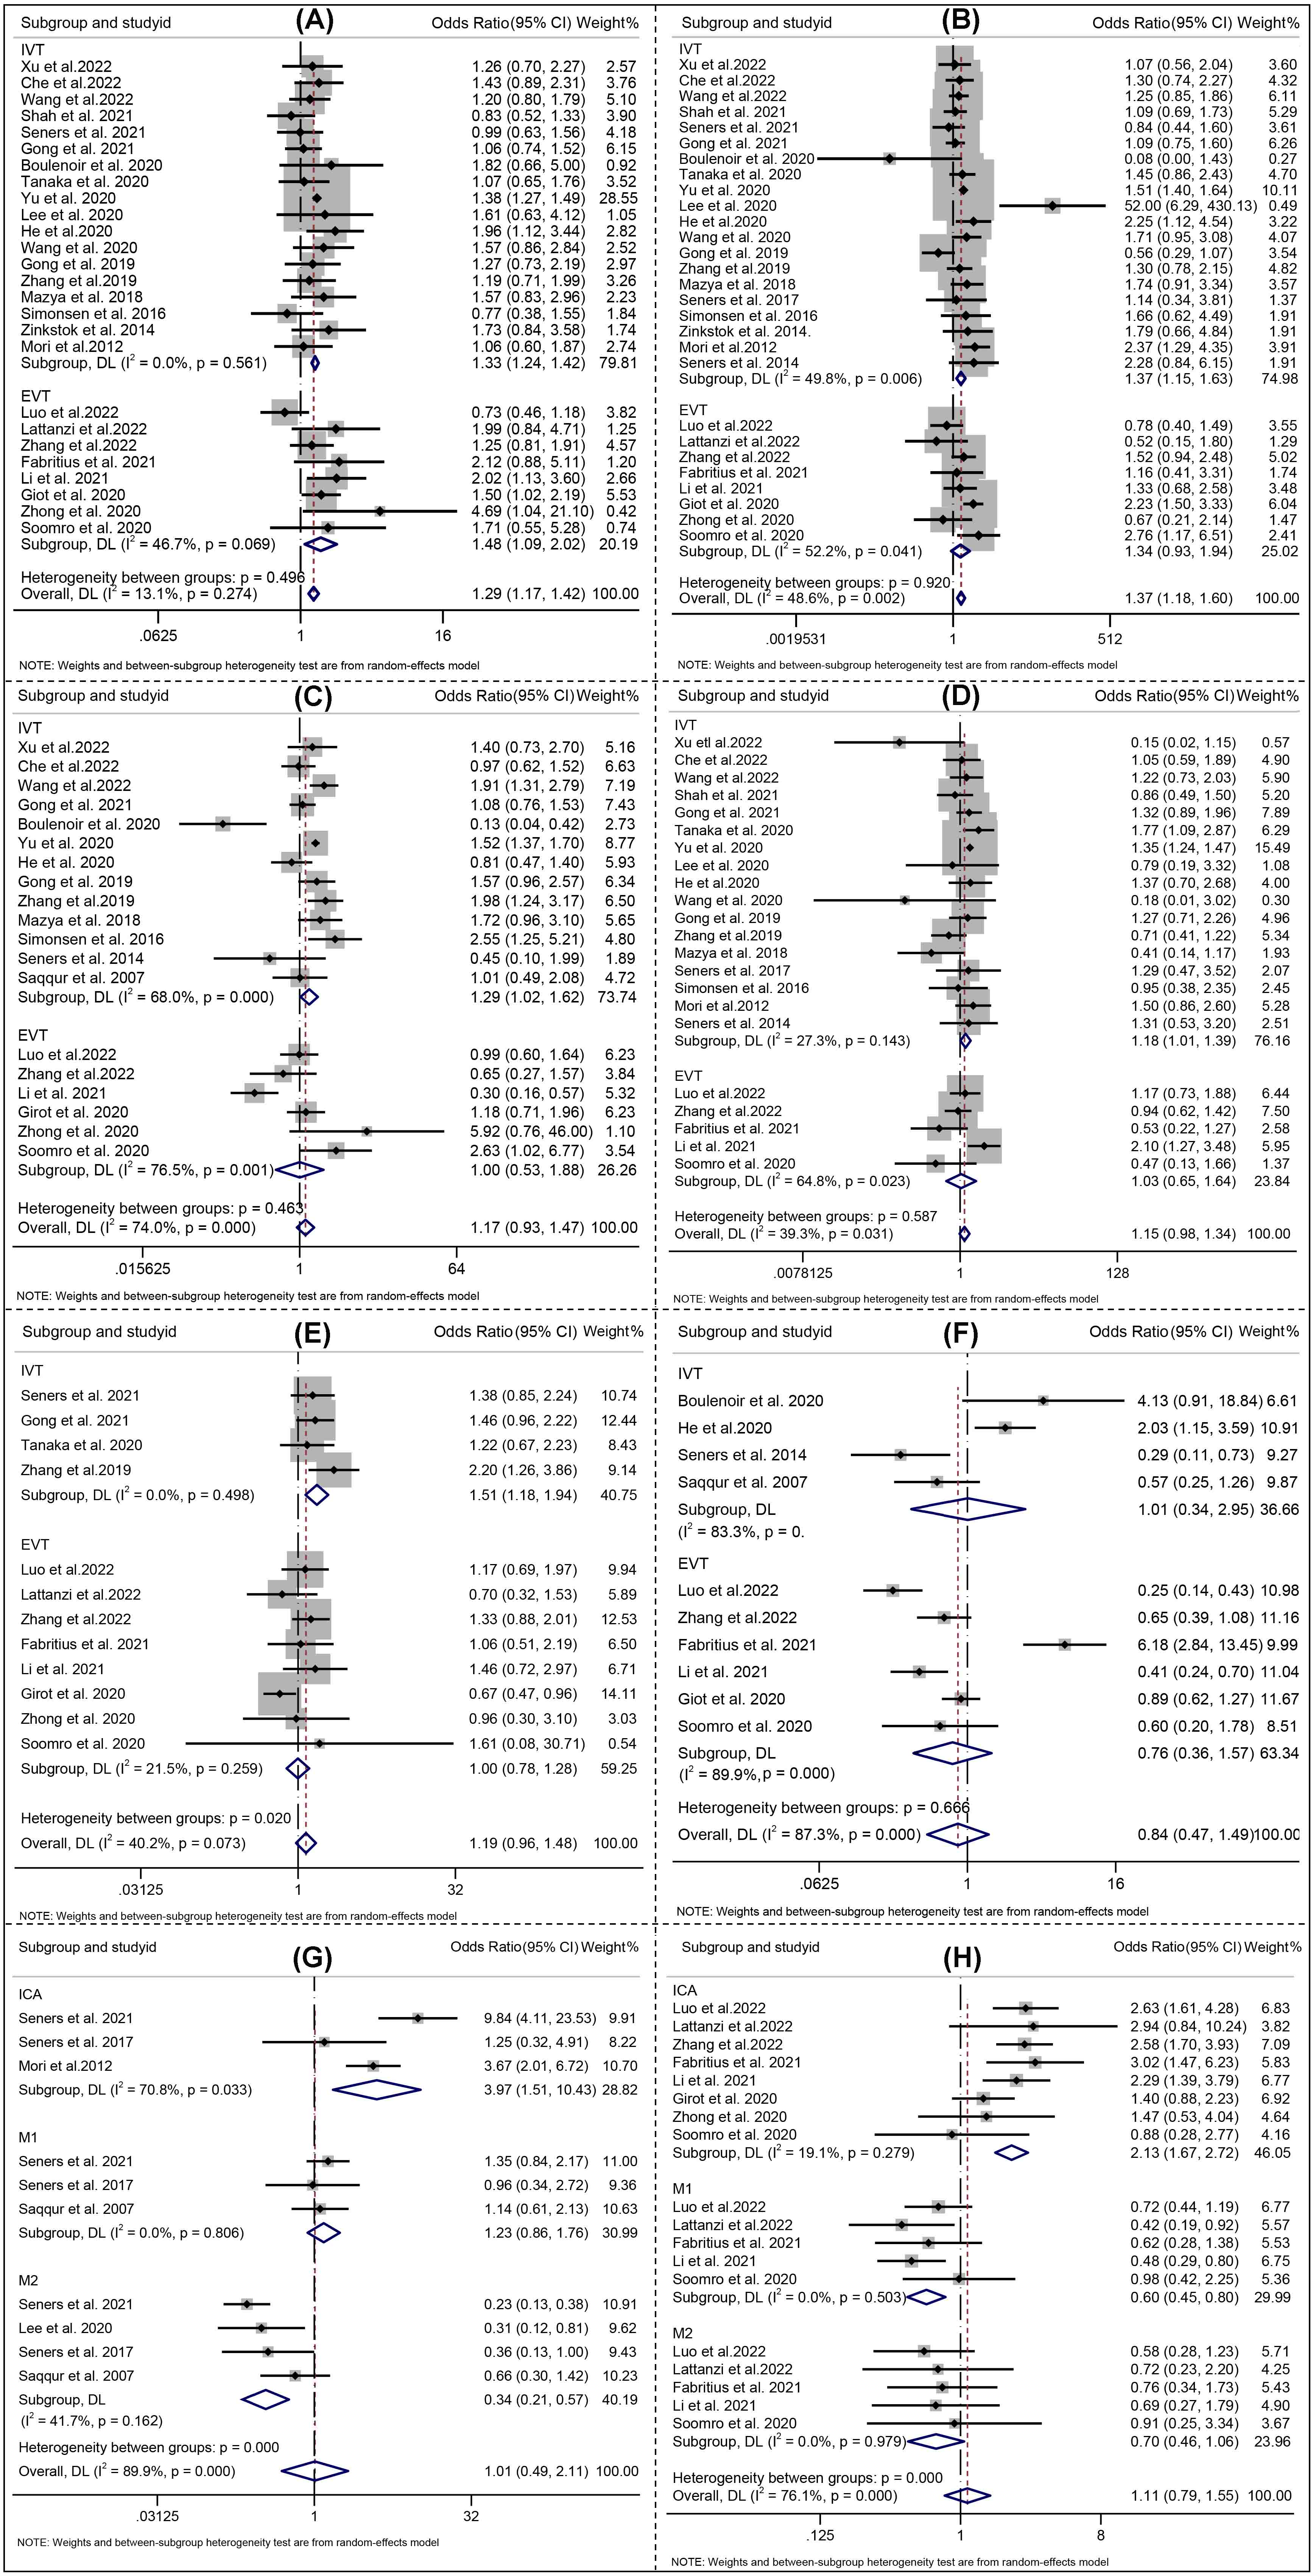 Fig. 4.
Forest plots of (A) Hypertension; (B) Diabetes mellitus; (C) Etiology atherosclerosis; (D) Atrial fibrillation; (E) Lesion location; (F) Successful recanalization; (G) Lesion location_IVT; (H) Lesion location_EVT. IVT indicates intravenous thrombolysis, and EVT indicates endovascular therapy. The solid squares denote the risk ratios (RRs), the horizontal lines represent the 95% confidence intervals (CIs), and the diamonds denote the pooled RRs.
Analysis of the pooled data from studies on END following IVT demonstrated that higher age (Effect: 0.14, 95% CI: 0.06–0.22), SBP (Effect 0.24, 95% CI: 0.09–0.39), glucose level at admission (Effect 0.41, 95% CI: 0.28–0.54), OTT (Effect 0.07, 95% CI: 0.00–0.13), history of hypertension (Effect 1.33; 95% CI: 1.24–1.42), DM (Effect 1.37; 95% CI: 1.15–1.63), AF (Effect 1.20; 95% CI: 1.10–1.31), large artery atherosclerosis (Effect 1.18; 95% CI: 1.01–1.39), internal carotid artery occlusion (Effect 3.97; 95% CI: 1.51–10.43), middle cerebral artery M2 occlusion (Effect 0.34; 95% CI: 0.21–0.57) and bridging therapy (Effect 1.51; 95% CI: 1.18–1.94) were significantly associated with END after IVT (Figs. 3,4).
For studies focusing on END after EVT, four risk factors including SBP (Effect 0.30, 95% CI: 0.19–0.40), history of hypertension (RR 1.48; 95% CI: 1.09–2.02), internal carotid artery occlusion (RR 2.13; 95% CI: 1.67–1.72), and middle cerebral artery M1 occlusion (Effect 0.60; 95% CI: 0.45–0.80) were found to be significantly associated with END (Figs. 3,4).
We noted that the risk of dependency or death (modified Rankin Score
We detected the publication bias by combining visual funnel plots inspection
with the symmetry distributions and the quantitative analysis of Egger’s test and
Peters test (p
Considering the high heterogeneity emerged at predictors of initial NIHSS, SBP, etiology of atherosclerosis, serum glucose, ASPECT, location of intracranial occlusion_IVT, and successful recanalization (Figs. 3,4), a sensitivity analysis was performed to detect which study resulted in such high heterogeneity. No high risk of bias for the studies were identified the other predictors [22, 26]. All the aforementioned results are shown in Supplementary Fig. 4.
The main findings from this meta-analysis focused on investigating the predictors of END occurrence in AIS patients who receiving reperfusion treatments. Elderly, systolic blood pressure, glucose levels at admission, treatment onset, history of previous diseases (i.e., hypertension, diabetes mellitus, arterial fibrillation), internal carotid artery occlusion, and middle cerebral artery M2 occlusion significant associated with END in AIS patients who experienced overall reperfusion therapy. In addition, elderly, SBP, glucose level at admission, OTT, history of hypertension, DM, AF, large artery atherosclerosis, internal carotid artery occlusion, middle cerebral artery M2 occlusion and bridging therapy associated with END in patients who experienced IVT, and four risk factors including SBP, history of hypertension and internal carotid artery occlusion were found to be related with END in patients witnessed EVT.
The definition of END was not clear in existing studies because of the degree of
symptom worsening and the time frame of the deterioration. Some literature
adopted an increase of
Within the currently acceptable timeframe and degree of worsening of END,
multiple risk factors identified in this study were in line with several previous
studies. Age has been identified as a risk factor for END onset in Birschel’s
study [46]. In our study, the pooled data analysis showed that older AIS patients
were at higher risk of END after revascularization treatment, especially more
obviously presented underwent IVT treatment in the subgroup analysis, whereas no
significant association between age and the occurrence of END was observed in
patients receiving EVT treatment. This result might relate to a small number of
studies included in the EVT group, limited by the number of patients. In
addition, another reason might be that patients receiving EVT treatment have a
more strict age restrictions and a smaller age span. Initial NIHSS score is used
widely to measure a level of consciousness on admission, specifically, a larger
initial NIHSS score indicated a declined consciousness which is related to a
greater chance of END achieved [47]. However, in our analysis, the initial NIHSS
score was not statistically significant in predicting the occurrence of END. In
previous studies, the initial NIHSS score was a significant predictor of END24,
both of which used a liberal definition of END24 (worsening of Scandinavian
Stroke Scale, which might be more sensitive than NIHSS, and
History of diabetes mellitus is associated with a higher risk of END occurring [49, 50]. Notably, the poor neurological outcome (i.e., END) has resulted from persistently high level of serum glucose following reperfusion treatments [51]. One potential mechanism could be that it increased blood-brain barrier disruption and promoted sICH. However, hyperglycaemia might also facilitate neuronal damage. OTT (Onset to Treatment Time) was another significant predictor of increased END risk in our meta-analysis. Patients with longer OTT were more likely to have END, which is consistent with the concept of “time is brain” that we have known before. In the subgroup analysis, it was more obviously found in the IVT group, but in the EVT group, the association between age and the occurrence of END was not statistically different. We speculated that the reason was the large heterogeneity in OTT among patients receiving EVT. With the improved concept of thrombectomy, many AIS patients beyond the time window with salvage of brain tissue still received EVT. This might be the reason why OTT time did not fully predict the occurrence of END in EVT patients.
In addition, Kwan’s study [52] found atrial fibrillation aggrandized the risk of END attained, which was also a significant predictor of increased END risk in our meta-analysis. It might be due to the stroke etiology in patients with atrial fibrillation was cardiogenic embolism. The occlusion site was usually large vessel, with less collateral compensation and a larger infarct size. However, in another study [53], which focused on non-thrombolysis mild strokes, the incidence of END24 was 9% in lacunar infarcts as compared with 31% and 23% in large atherosclerosis and cardioembolic strokes, respectively, which showed a non-significant difference. Since stroke was caused by many reasons, the mechanism of END in various subtypes of stroke was completely different, yet remains largely unknown. Proximal arterial occlusion was observed more frequently in patients with END in our meta-analysis. One possible explanation for this association would posit that proximal occlusion predicts stroke severity, and therefore also END through its association with sICH and malignant oedema.
There are a few limitations in this meta-analysis that ought to be considered when interpreting the findings. Although we performed the meta-analysis for AIS cases with EVT, a sufficient subgroup analysis providing reliable results in the EVT group equivalent to IVT and total group may not be possible as scarce EVT studies are included. Due to insufficient data of re-occlusion and collateral circulation reported, it was difficult to analyze these two factors in this meta-analysis. Nevertheless, re-occlusion has been recognized as one of the important prognoses of END by clinical physicians [15], as well as playing a predominant role to improve the neurological functions for stroke patients. Another mechanism of END focuses on the insufficient collaterals with the adverse metabolic consequences among AIS patients in clinical practice [54]. Accordingly, collateral status described a linear relationship of the NIHSS score, implicating such the mechanism moderating symptoms in the hyperacute and post-therapeutic acute stroke phase [22]. Despite the ASPCT score contributing a lot to END occurring [1], we were not able to find a significant association of END as assigning the ASPECT score may vary by different physician.
The strength of this meta-analysis is that several large sample studies were involved to conduct the meta-analysis, providing convincing evidence of the associations, as well as depicting a complete picture to predict END occurring in stroke patients with medical or reperfusion therapies in clinical practice. We not only focused on END occurrence after EVT, but we also determined that the site of occlusion was linked with END after EVT.
This study contains some implications in clinical practice. END at 24 hours was associated with poor outcomes, hinting toward needs of the concentration on neurological deficit management. Understanding and monitoring older age, elevated systolic blood pressure, high levels of serum glucose, hypertension, diabetes mellitus and atrial fibrillation may elevate the early neurological worsening and achieve a satisfactory prognosis. Apart from this, other unmentioned factors, including collateral circulation, ASPECT score, CE stroke, are supposed to be thought about in decision-making protocols before reperfusion therapy conducting. Further studies ought to look into END occurring after EVT deeply because the exact proportion of END onset following EVT, and short-term/long-term prognosis still remain unclear at this stage.
All data generated or analyzed during this study are included in this published article. The datasets used and/or analyzed during the current study are available from the corresponding author on reasonable request. PRISMA checklist is shown in supplementary materials.
JL and WJJ take responsibility for the integrity of the data and the accuracy of the data analysis. Conceptualizing and designing the study—JL, HXS, CL and YQZ. Extracting, analyzing and interpreting the data—All authors. Drafting the study—HXS, CL and JL. Conducting meta-analysis—JL, HXS, CL, YQZ, XL, AFL,YEL. Critical revision of the study for important intellectual content—All authors. Obtaining funding—WJJ. Supervision—JL and WJJ.
Not applicable.
Not applicable.
This study was supported by the grants from National Key Basic Research Program of China (973 program) (grant No. 2013CB733805), and the National Natural Science Foundation of China (grant No. 81871464).
The authors declare no conflict of interest.
Appendix I: Detailed Search strategy
Pubmed
Free Text
Initial search performed on 3 August 2021
Search updated on 7 December 2022
English language limit applied
| # | Search Term | No. of Results |
|---|---|---|
| 1 | ‘neurological deterioration’ or ‘neurological deficit’ or ‘neurological decline’ | 724054 |
| 2 | ‘thrombolysis’ or ‘thrombolytic treatment’ or ‘thrombolytic therapy’ or ‘IV-rtPA’ or ‘endovascular treatment’ or ‘endovascular therapy’ or ‘mechanical thrombectomy’ or ‘medical treatment’ or ‘medical management’ | 3697171 |
| 3 | ‘acute ischemic stroke’ or ‘acute cerebral ischaemia’ or ‘proximal vessel occlusion’ or ‘proximal artery occlusion’ or ‘large artery occlusion’ or ‘large vessel occlusion’ or ‘vertebrobasilar artery occlusion’ or ‘basilar artery occlusion’ or ‘middle cerebral artery occlusion’ or ‘internal cerebral artery occlusion’ | 127348 |
| 4 | #1 AND #2 AND #3 | 3648 |
Web of Science
Free Text
Initial search performed on 2 August 2021
Search updated on 6 December 2022
English language limit applied
| # | Search Term | No. of Results |
|---|---|---|
| 1 | ‘neurological deterioration’ or ‘neurological deficit’ or ‘neurological decline’ ALL | 64510 |
| 2 | ‘thrombolysis’ or ‘thrombolytic treatment’ or ‘thrombolytic therapy’ or ‘IV-rtPA’ or ‘endovascular treatment’ or ‘endovascular therapy’ or ‘mechanical thrombectomy’ or ‘medical treatment’ or ‘medical management’ ALL | 3459585 |
| 3 | ‘acute ischemic stroke’ or ‘acute cerebral ischaemia’ or ‘proximal vessel occlusion’ or ‘proximal artery occlusion’ or ‘large artery occlusion’ or ‘large vessel occlusion’ or ‘vertebrobasilar artery occlusion’ or ‘basilar artery occlusion’ or ‘middle cerebral artery occlusion’ or ‘internal cerebral artery occlusion’ ALL | 79075 |
| 4 | #1 AND #2 AND #3 | 2547 |
EBSCO
Free Text
Initial search performed on 16 August 2021
Search updated on 10 December 2022
English language limit applied
| # | Search Term | No. of Results |
|---|---|---|
| 1 | ‘neurological deterioration’ or ‘neurological deficit’ or ‘neurological decline’ ALL | 31183 |
| 2 | ‘thrombolysis’ or ‘thrombolytic treatment’ or ‘thrombolytic therapy’ or ‘IV-rtPA’ or ‘endovascular treatment’ or ‘endovascular therapy’ or ‘mechanical thrombectomy’ or ‘medical treatment’ or ‘medical management’ ALL | 102745 |
| 3 | ‘acute ischemic stroke’ or ‘acute cerebral ischaemia’ or ‘proximal vessel occlusion’ or ‘proximal artery occlusion’ or ‘large artery occlusion’ or ‘large vessel occlusion’ or ‘vertebrobasilar artery occlusion’ or ‘basilar artery occlusion’ or ‘middle cerebral artery occlusion’ or ‘internal cerebral artery occlusion’ ALL | 46257 |
| 4 | #1 AND #2 AND #3 | 638 |
Appendix II. Quality score
The quality score is composed of 5 items, and each item was allocated 0, 1 or 2 points. This allowed a total score between 0 and 10 points, 10 representing the highest quality. The following items are included in the score:
Objective
0 for no study objectives mentioned
1 for study objectives reported but non-specific
2 for specific study objectives reported
Design
0 for cross sectional studies
1 for case-control studies
2 for longitudinal studies (retrospective or prospective) or interventional studies
Population
Observational studies
0 if n
1 if n 100 to 500
2 if n
Outcome (see table below)
| 0 | 1 | 2 |
|---|---|---|
| If not MRI or CT confirmation of AIS | MRI or CT confirmation with clear location of lesions or stroke onset time | With both clear location of lesions and stroke onset time |
Adjustments
0 if findings are not controlled** for at least age and gender
1 if findings are controlled for age and gender
2 If findings are additionally controlled for covariates:
** ‘Controlled for’ here refers to: adjusted for in the statistical analyses (e.g. with multiple regression); stratified for in the analyses (e.g. males and females separately)
| Variables | Egger test/Peters test | |||||
|---|---|---|---|---|---|---|
| Total | IVT | EVT | ||||
| Z score | p | Z score | p | Z score | p | |
| Age | –3.44 | 0.002 | –3.80 | 0.001 | –0.86 | 0.423 |
| Initial NIHSS | –1.80 | 0.077 | –1.15 | 0.264 | –0.79 | 0.459 |
| Systolic BP | –0.43 | 0.670 | –0.48 | 0.634 | –0.17 | 0.873 |
| Serum Glucose | 1.56 | 0.207 | 1.34 | 0.190 | NA | |
| OTT | –0.20 | 0.840 | –0.34 | 0.741 | 0.21 | 0.851 |
| ASPECT | –0.74 | 0.672 | –4.50 | 0.056 | –0.17 | 0.807 |
| HTN | 9.34 | 0.003 | 9.80 | 0.002 | 1.21 | 0.273 |
| Diabetes Mellitus | 8.57 | 0.431 | 8.04 | 0.076 | 2.84 | 0.285 |
| ET-atherosclerosis | 5.23 | 0.209 | 5.87 | 0.098 | –0.25 | 0.660 |
| AF | 5.68 | 0.180 | 5.31 | 0.287 | 3.71 | 0.531 |
| SR | –0.71 | 0.799 | –0.78 | 0.657 | –0.37 | 0.803 |
| Bridging | –0.53 | 0.612 | –7.78 | 0.065 | –0.178 | 0.135 |
| ICA | 0.109 | 0.912 | 4.10 | 0.419 | 1.21 | 0.510 |
| M2 | –3.09 | 0.553 | –1.98 | 0.912 | –3.87 | 0.199 |
| 90DmRS (0–2) | –3.50 | 0.781 | –6.80 | 0.097 | NA | |
References
Publisher’s Note: IMR Press stays neutral with regard to jurisdictional claims in published maps and institutional affiliations.