


 , Lorena Vega-Zelaya 1,2, Alfonso Canabal 2,3
1 Clinical Neurophysiology, Hospital Universitario La Princesa, 28006 Madrid, Spain
2 Biomedical Research Institute, Hospital Universitario La Princesa, 28006 Madrid, Spain
3 Intensive Care Unit, Hospital Universitario de La Princesa, 28006 Madrid, Spain
Abstract
Background: Music is considered a valuable method for stimulating patients with disorders of consciousness (DOC) by enhancing their awareness and arousal. Although biographical music and auditory relative stimulation has been shown, responses to other types of music has not yet been addressed. The purpose of this study was to assess the brain responses in critically ill patients under sedo-analgesia to music that is highly different in features. Methods: We measured the individual responses to three types of music: classical (ClassM, Mozart), dodecaphonic (DodecM, Schönberg), and heavy metal (HeavyM, Volbeat) in six critically ill patients (one male, five female, all between 53 and 82 years old) with primary brain pathology under sedo-analgesia. We analyzed the changes in each patient’s electroencephalogram (EEG) band composition (delta, 1–4 Hz, theta 4–8 Hz, alpha 8–13 Hz, and beta 13–30 Hz) and synchronization throughout the scalp. Results: In spite of the heterogeneity in the responses, ClassM did not change the basal activity, although there was a tendency toward a decrease in brain activity. DodecM increased the alpha and beta bands from the right hemisphere. However, HeavyM increased the delta and theta bands from the frontal lobes and the alpha and beta bands from most of the scalp. No significant changes in synchronization were observed. Conclusions: Different types of music induce heterogeneous responses in the brain, suggesting that music interventions could affect the brain state of patients. HeavyM induced the greatest changes in brain responses, whereas ClassM showed a tendency to reduce brain activity. The result of this study opens the possibility of using different types of music as tools during the rehabilitation process.
Keywords
- classical music
- dodecaphonic music
- disorders of consciousness
- fast Fourier transform
- heavy metal music
- Mozart's effect
- synchronization
- quantified EEG
Various brain injuries, including ischemic-hypoxic encephalopathy, cerebrovascular disease, craniocerebral trauma, and encephalitis, can lead to disorders of consciousness (DOC). The prognoses are often uncertain and, while some patients recover awareness, others move into a minimally conscious state (MCS) or develop unresponsive wakefulness syndrome (UWS), also known as vegetative state [1].
It has been reported that a patient’s preferred music can enhance the functional connectivity in DOC patients [2] and activate emotion-related areas to a higher degree than unfamiliar music [3]. Moreover, the auditory network has been reported to be modulated by preferred music and aversive auditory stimuli [4], which can help to differentiate between UWS and MCS [5]. Therefore, music intervention can be helpful as a diagnostic tool and as therapeutic intervention in brain injury patients [6].
In intensive care unit (ICU) patients, the complex cortical functions are highly impaired; therefore, the analysis of emotional or psychological responses is limited. However, it is possible that basic neural mechanisms maintain significant functionality [7, 8, 9]. Quantified electroencephalography (qEEG) is an objective, repeatable, and noninvasive method to determine the brain’s response to stimulation [10, 11]. Other methods, such as magnetoencephalography (MEG) or functional magnetic resonance imaging (fMRI), are not easily applicable to ICU patients. Although several studies have reported the use of fMRI to observe behavioral responses, there is little research into music interventions in DOC patients using EEG [12, 13, 14, 15, 16, 17, 18, 19].
Most of the studies used preferred or biographical music, familiar sounds, disliked music, white noise, or classical music [6]. Biographical stimulation has shown to be effective in DOC patients or patients under sedo-analgesia [4, 5]. However, its main nature indicates a lack of systematization, due to changes from patient to patient and, probably, reflects not only brain responses to music, but also emotional responses. Here, we address the possibility of systematic responses using the same type of musical stimulation for each patient. No previous studies have used heavy metal or dodecaphonic music in the set of stimuli used. These types of music are quite different from the auditory stimuli and melodic or classical music used in previous works.
The purpose of this pilot study [20] was to assess the brain responses in critically ill patients under sedo-analgesia to different types of music with highly different features. We hypothesized that the individual patient’s responses to the different types of musical stimulation would induce different brain responses. In this pilot study we do not address which music parameters (rhythm, melody, etc.) are responsible for the putative brain responses.
Abbreviations used can be found at the end of the work.
We studied one man (53 years old) and five women (74.2
(1) Critically ill patients under sedo-analgesia.
(2) There were no asymmetries in bioelectrical activity, e.g., no significant interlobar difference for more than two EEG bands in more than one lobe. In other cases, the patients were considered asymmetric and consequently rejected.
(3) There were no previous antecedents of auditory system impairment.
(4) Brain responsive to nociceptive stimulation.
| Patient | Sex | Age (yrs) | Main pathology (and GCS) Admission at ICU | Hospitalization at ICU (days) | Drugs | Imaging | Outcome |
| 1 | F | 82 | SAH (9) | 4 | PRO, FEN, LEV, PHE, LAC | CT/SAH | ICU |
| 2 | M | 53 | SE (8) | 3 | PRO, MID, FEN, LEV, PHE | MR/L glioma | CH |
| 4 | F | 73 | IPH (7) | 3 | PRO, FEN, LEV, LAC | MR/R IPH | Exitus |
| 5 | F | 73 | CET + CRA (4) | 5 | FEN | CT | Exitus |
| 6 | F | 74 | SAH (8) | 3 | PRO, MID, FEN, THI, LEV | CT/SAH | ICU |
| 7 | F | 69 | SAH (9) | 4 | FEN | CT/SAH | Exitus |
| CET, cranioencephalic trauma; CH, conventional hospitalization; CRA, cardiorespiratory arrest; GCS, Comma Glasgow Score; CT, computed tomography; FEN, fentanyl; IPH, intraparenchymal hemorrhage; ICU, Intensive Care Unit; L, left; LAC, lacosamide; LEV, levetiracetam; MID, midazolam; MR, magnetic resonance; PHE, phenytoin; PRO, propofol; R, right; SAH, subarachnoid hemorrhage; SE, status epilepticus; THI, thiopental. | |||||||
Three patients who fit the above criteria were excluded due to the absence of a brain response to pain.
All patients were studied by computerized tomography (CT) and/or 1.5 T magnetic resonance imaging (MRI, General Electric®, Fairfield, CT, USA).
EEG was indicated by the ICU staff responsible for the clinical assessment of the patient to evaluate the brain activity, including level of sedation, presence of epileptic seizures, or nonconvulsive epileptic status [21]. Hemogram, coagulation, and biochemical analyzes were usually within the normal physiological ranges. Although some values were out of the normal range, we checked that the serum ionic concentrations were always in range.
The experimental procedure was approved by the medical ethics review board of the Hospital Universitario de La Princesa (reference 4274), and informed consent was obtained from the patients’ relatives.
EEG records were obtained using a 32-channel digital system (EEG32U, NeuroWorks,
XLTEK®, Oakville, ON, Canada) with 19 electrodes placed according
to a 10–20 international system. In addition, a differential derivation
Einthoven lead I was positioned for ECG. If necessary, surface electromyography
(EMG) channels were added. Recordings were performed at a 512 Hz sampling rate,
with a filter bandwidth of 0.5 to 70 Hz and a notch filter of 50 Hz. Electrode
impedances were below 25 k
The cortical response to nociception was performed by means of strong pressure with a solid object onto the ungual bed for 10 s [22].
Artefacts were scarcely present (due to the clinical state of patients), and respirator-induced movement, muscle-tone increases by endotracheal tube biting, and movement of people around the patient were carefully avoided. Artefact-free periods were selected by visual inspection and exported to ASCII files to be quantified.
The algorithm used has been published previously [23, 24]. Classical EEG bands
used in the analysis were defined as delta (
A double banana differential EEG montage was reconstructed for analysis [11]. All recordings were divided into different lengths of moving windows of 1 s width, with 10% overlap.
For each window (n) and frequency (k), we computed the fast Fourier transform of
the voltage
We also computed Shannon’s spectral entropy (SSE) according to (Eqn. 2):
where F is the maximum frequency computed and p
We computed the area under the
The expression sup refers to the upper limit of each EEG band and where
The absolute value of Pearson’s correlation coefficient (
where N
The mean value of all windows was then computed to obtain the mean correlation matrix.
These formulae are discrete versions from well-known expressions for Fourier’s transform, Shannon’s spectral entropy, probability from a mass density function, equivalence for integration, and Pearson’s correlation coefficient, respectively [25].
Channels were grouped by cerebral lobes. In the case of the left hemisphere
(shown as an example), we grouped the frontal,
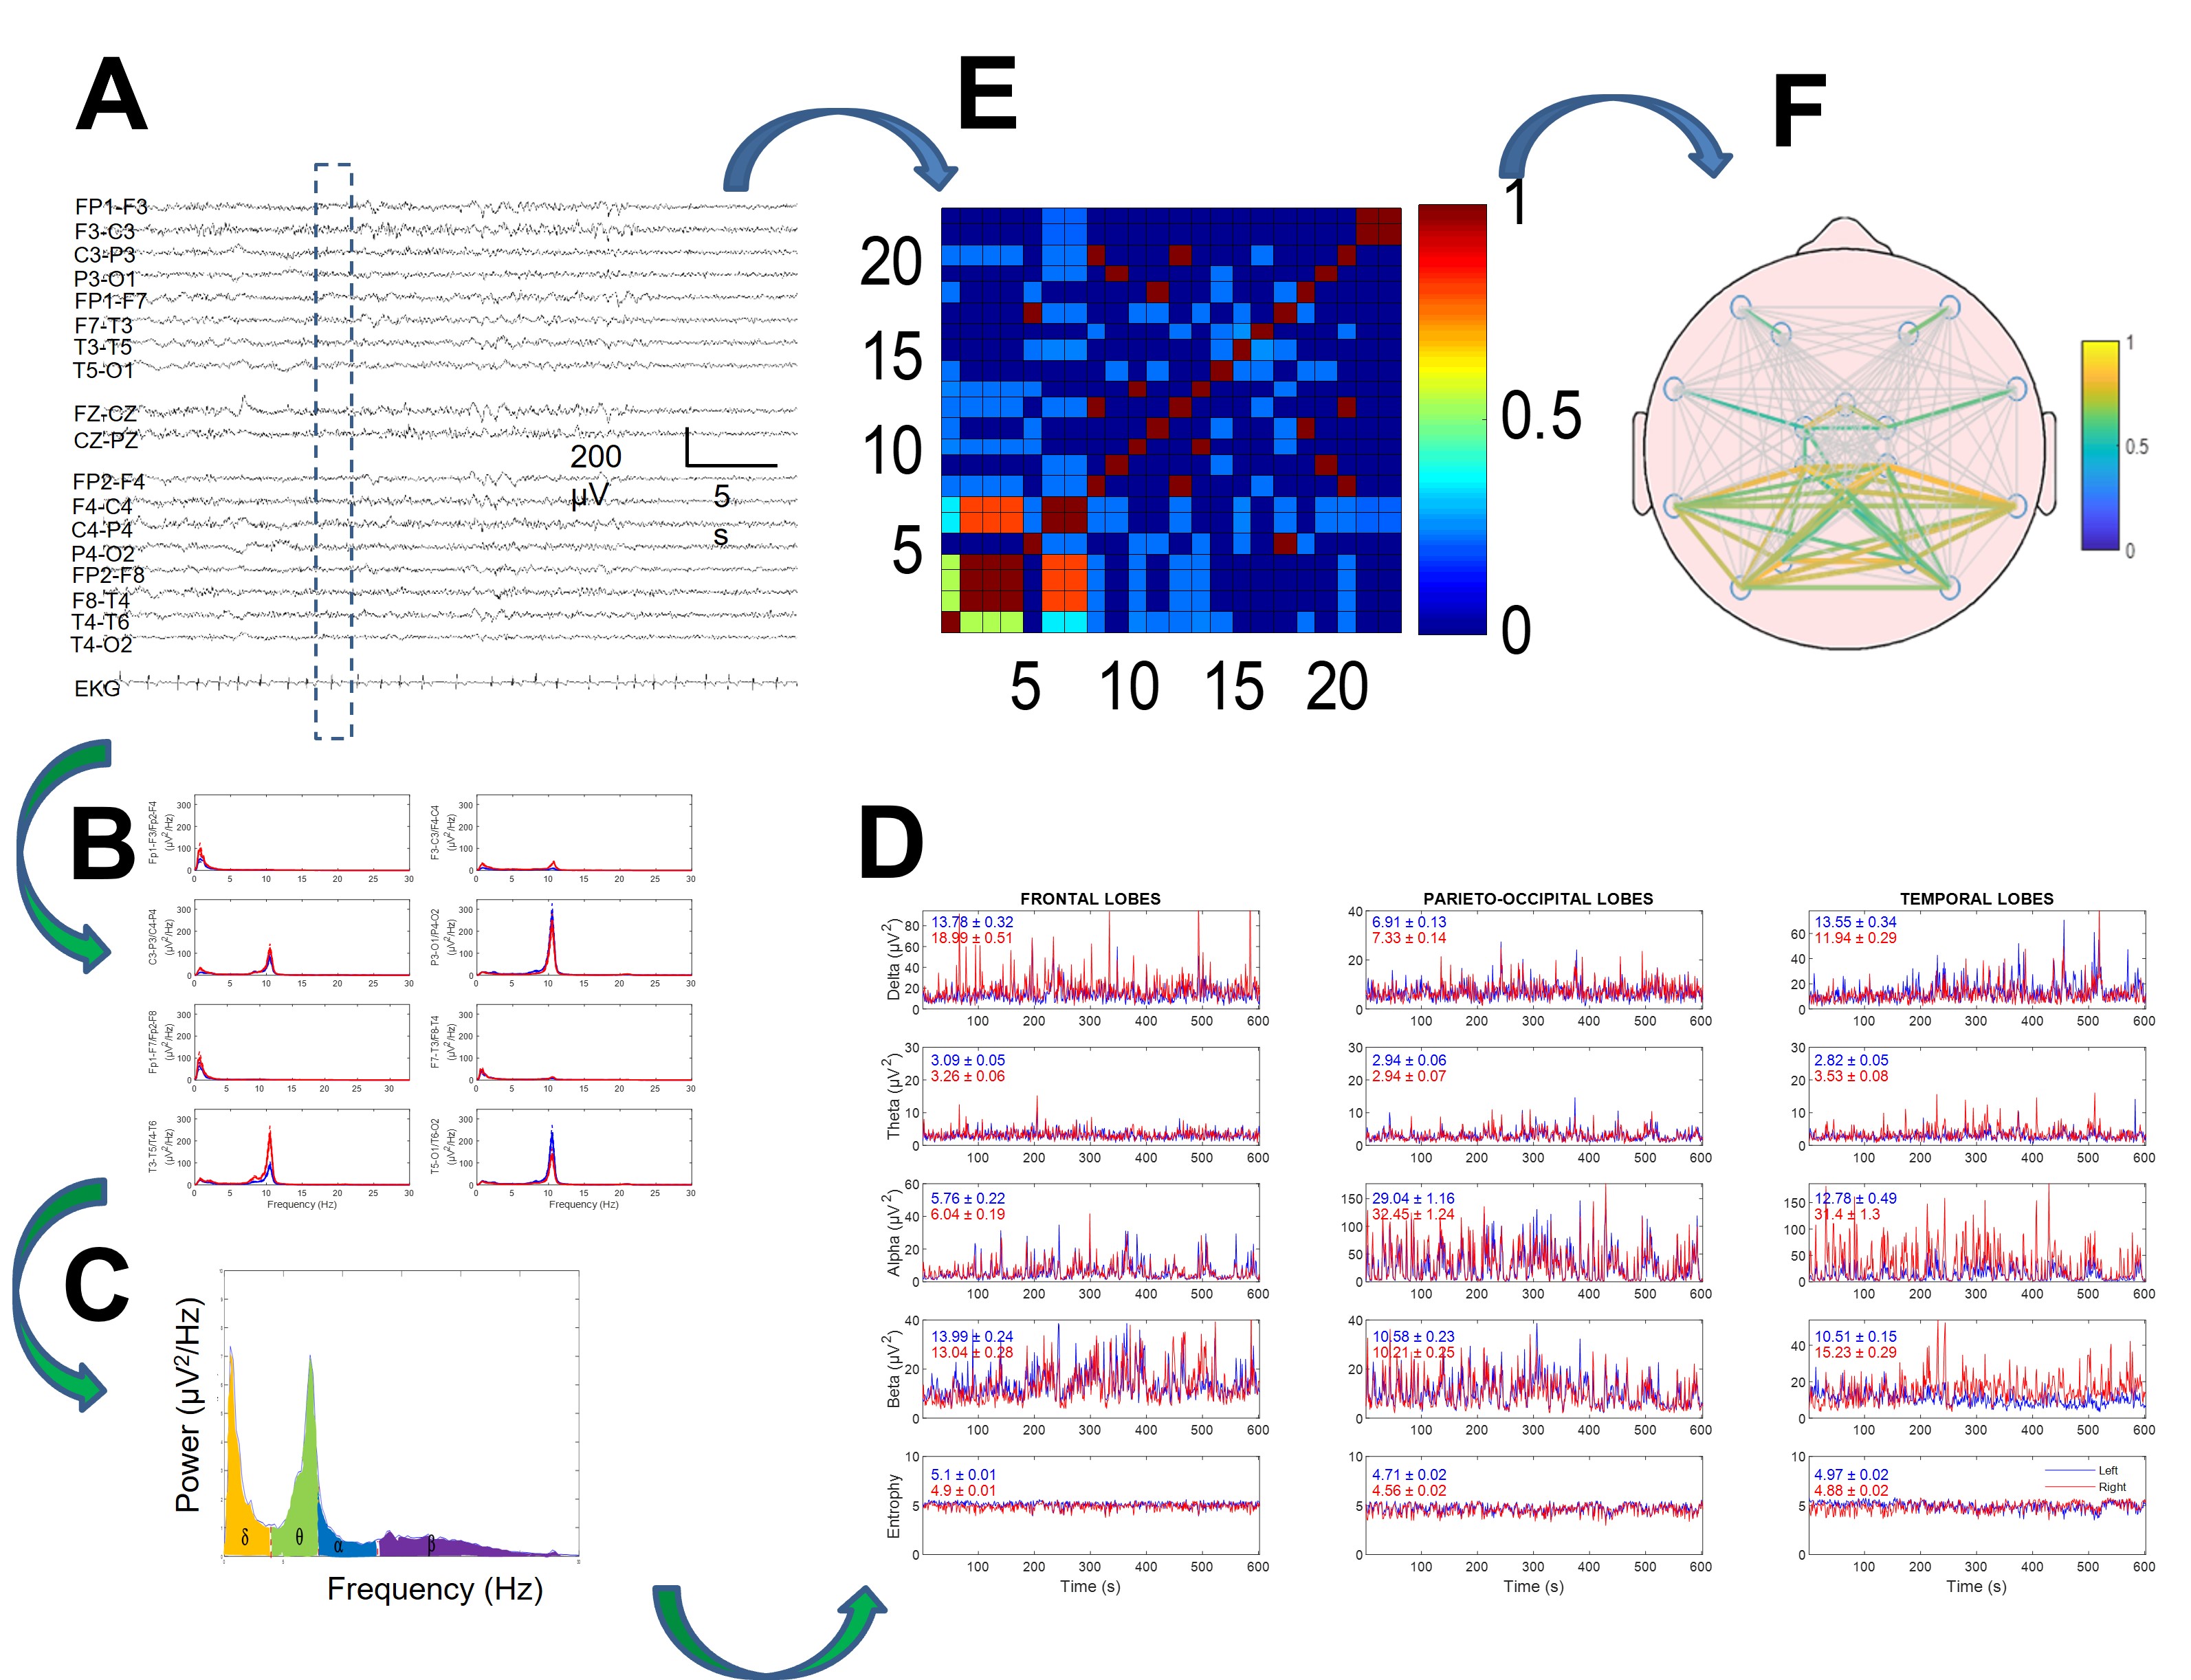
 Fig. 1.
Method of electroencephalogram (EEG) quantification in two branches: power spectra (B–D) and synchronization (E,F). (A) Raw EEG tracing. Discontinuous rectangle shows moving window used for analysis. (B) Power spectra for every channel. (C) Areas for delta, theta, alpha, and beta bands under spectrum highlighted in different colors. (D) Dynamics of four bands (and entropy in lower row) for every lobe. Mean and SEM values for every tracing are displayed inside every graph. Red and blue lines indicate right and left hemispheres, respectively. (E) Correlation matrix for window. (F) Mean correlation computed for all recordings. Reproduced with permission from Pastor J, Necessity of quantitative EEG in daily clinical practice; published by IntechOpen, 2021 [11].
We selected three pieces of music with clearly different musical properties: (i) dodecaphonic music (Schönberg, Klavierstück Op. 33a; denoted as DodecM), (ii) classical music (Mozart, Sonata for two pianos in D, K. 448, denoted as ClassM), and (iii) heavy metal music (Volbeat, The Devil’s Bleeding Crown, denoted as HeavyM).
We selected these pieces for the following reasons: Mozart’s work has been used as a paradigm for the so-called Mozart’s effect [26, 27] and is well-known in Spain. However, not all the familial relatives knew it. The other two pieces were unknown to the patients’ relatives and were, therefore, also most likely unknown by the patient. Schönberg and Volbeat are poorly known by the general public.
A two-minute duration of each of these pieces was selected and played to the patient through headphones that had been gently placed over the ears. A minimum two-minute period with headphones placed on-site without music was used as the basal state. All patients listened to the music at around the same time of day (between 10:30 and 12:30 h). After the basal period, music stimulation with each of the three types of music (DodecM, ClassM, or HeavyM) was carried out, separated by periods of two minutes of wash-out. The sequence was randomized and different for every patient. Therefore, we can exclude the possibility of bias induced by the order or appearance of the music.
The auditory intensity delivered by the headphones was assessed (Smart Sensor,
Intell Instruments Pro®, China), resulting (in dB) ClassM = 68.2
Numerical variables during music stimulation were normalized to the basal period acquired with headphones placed over the ears with no music playing. To evaluate the response, we computed the difference in the mean normalized value during music stimulation minus the basal state (considered as 100%), for example, for the left frontal lobe:
where variables are power, SSE or
All the variables obtained from the power spectra (i.e., EEG bands) were
normalized to the basal state. SSE and
The chi-square test (
Pearson’s correlation coefficient was used to study the linear dependance
between variables. Linear regression significance was evaluated by means of a
contrast hypothesis against the null hypothesis,
This describes a t-Student distribution with n-2 degrees of freedom [28].
The significance level was set at p = 0.05, and the results are shown
as the mean
We studied six critically ill patients with different pathologies. At the time of EEG recording, all patients were under sedo-analgesia, intubated, and showed neuromuscular relaxation, therefore Glasgow Coma Score (GCS) and Coma Recovery Scale were useless. The most relevant clinical findings and demographic data are shown in Table 1. All patients showed right-hand dominance. According to the relatives, none of the patients had these musical pieces as their biographical music, although some of the relatives acknowledged some vague familiarity with the Mozart piece.
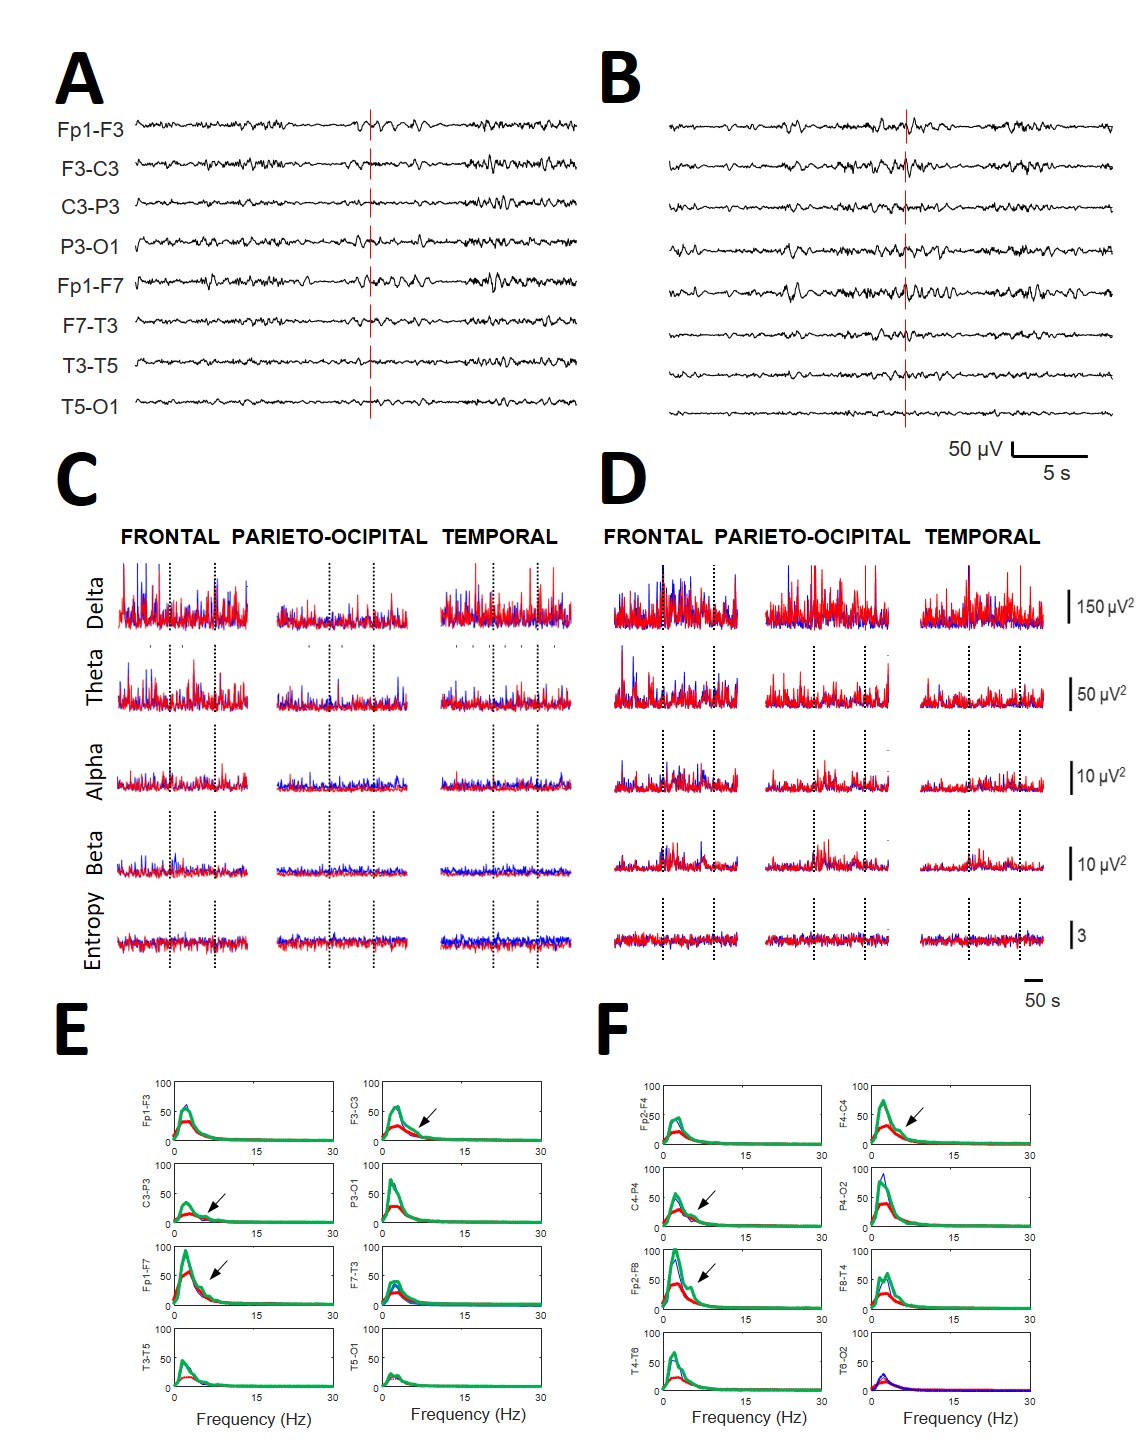
The EEGs recorded during music stimulation did not differ from the basal
bioelectrical activity during de visu inspection (Fig. 2A,B). However,
numerical analysis revealed significant changes induced by music (compare with
Fig. 2C,D). In Fig. 2E,F, as an example, superimposed mean spectra was present
for every channel obtained at basal conditions (blue lines) during the playing of
ClassM (red lines) and HeavyM (green lines) from the same patient (#2). It is
relevant that ClassM decreased the delta component over the whole scalp. However,
the more significant results were the changes in spectra induced by HeavyM in
most channels, especially in the right fronto-temporal regions, with increases in
frequencies higher than delta. However, in this example, neither SSE (basal =
3.20/3.14, ClassM = 3.25/3.22, DodecM = 3.26/3.19 and HeavyM = 3.21/3.19,
respectively, for left/right hemispheres) nor
 Fig. 2.
Relevance of qEEG in obtaining the results compared with de visu recordings. All the data are from the same patient (#2). (A) EEG recording (left hemisphere) during the start of stimulation with ClassM (vertical line) and (B) recording of the same patient at the beginning of stimulation with HeavyM (vertical line). (C) Dynamics of all the bands at the different lobes (indicated at the upper row) during the ClassM and (D) HeavyM. Red lines = right hemisphere; blue lines = left hemisphere. Dotted vertical lines indicate the period of stimulation. (E) Left scalp and (F) right scalp showing mean spectra obtained at basal condition (blue lines), during the stimulation with ClassM (red lines) and with HeavyM (green lines). Arrows indicate the appearance of a theta component at 4.5 Hz with HeavyM at both central regions. All data were obtained from patient #2.
Although not fully analyzed, we observed that HeavyM stimulation induced the appearance of well-defined components at specific places (see Fig. 2E,F), rather than only modifying the power of preexisting bands.
This different behavior for lobar spectra and SSE/synchronization measures was a significant finding in all patients (Fig. 3). As we observed, clear differences in bioelectrical activity were induced by different types of music.
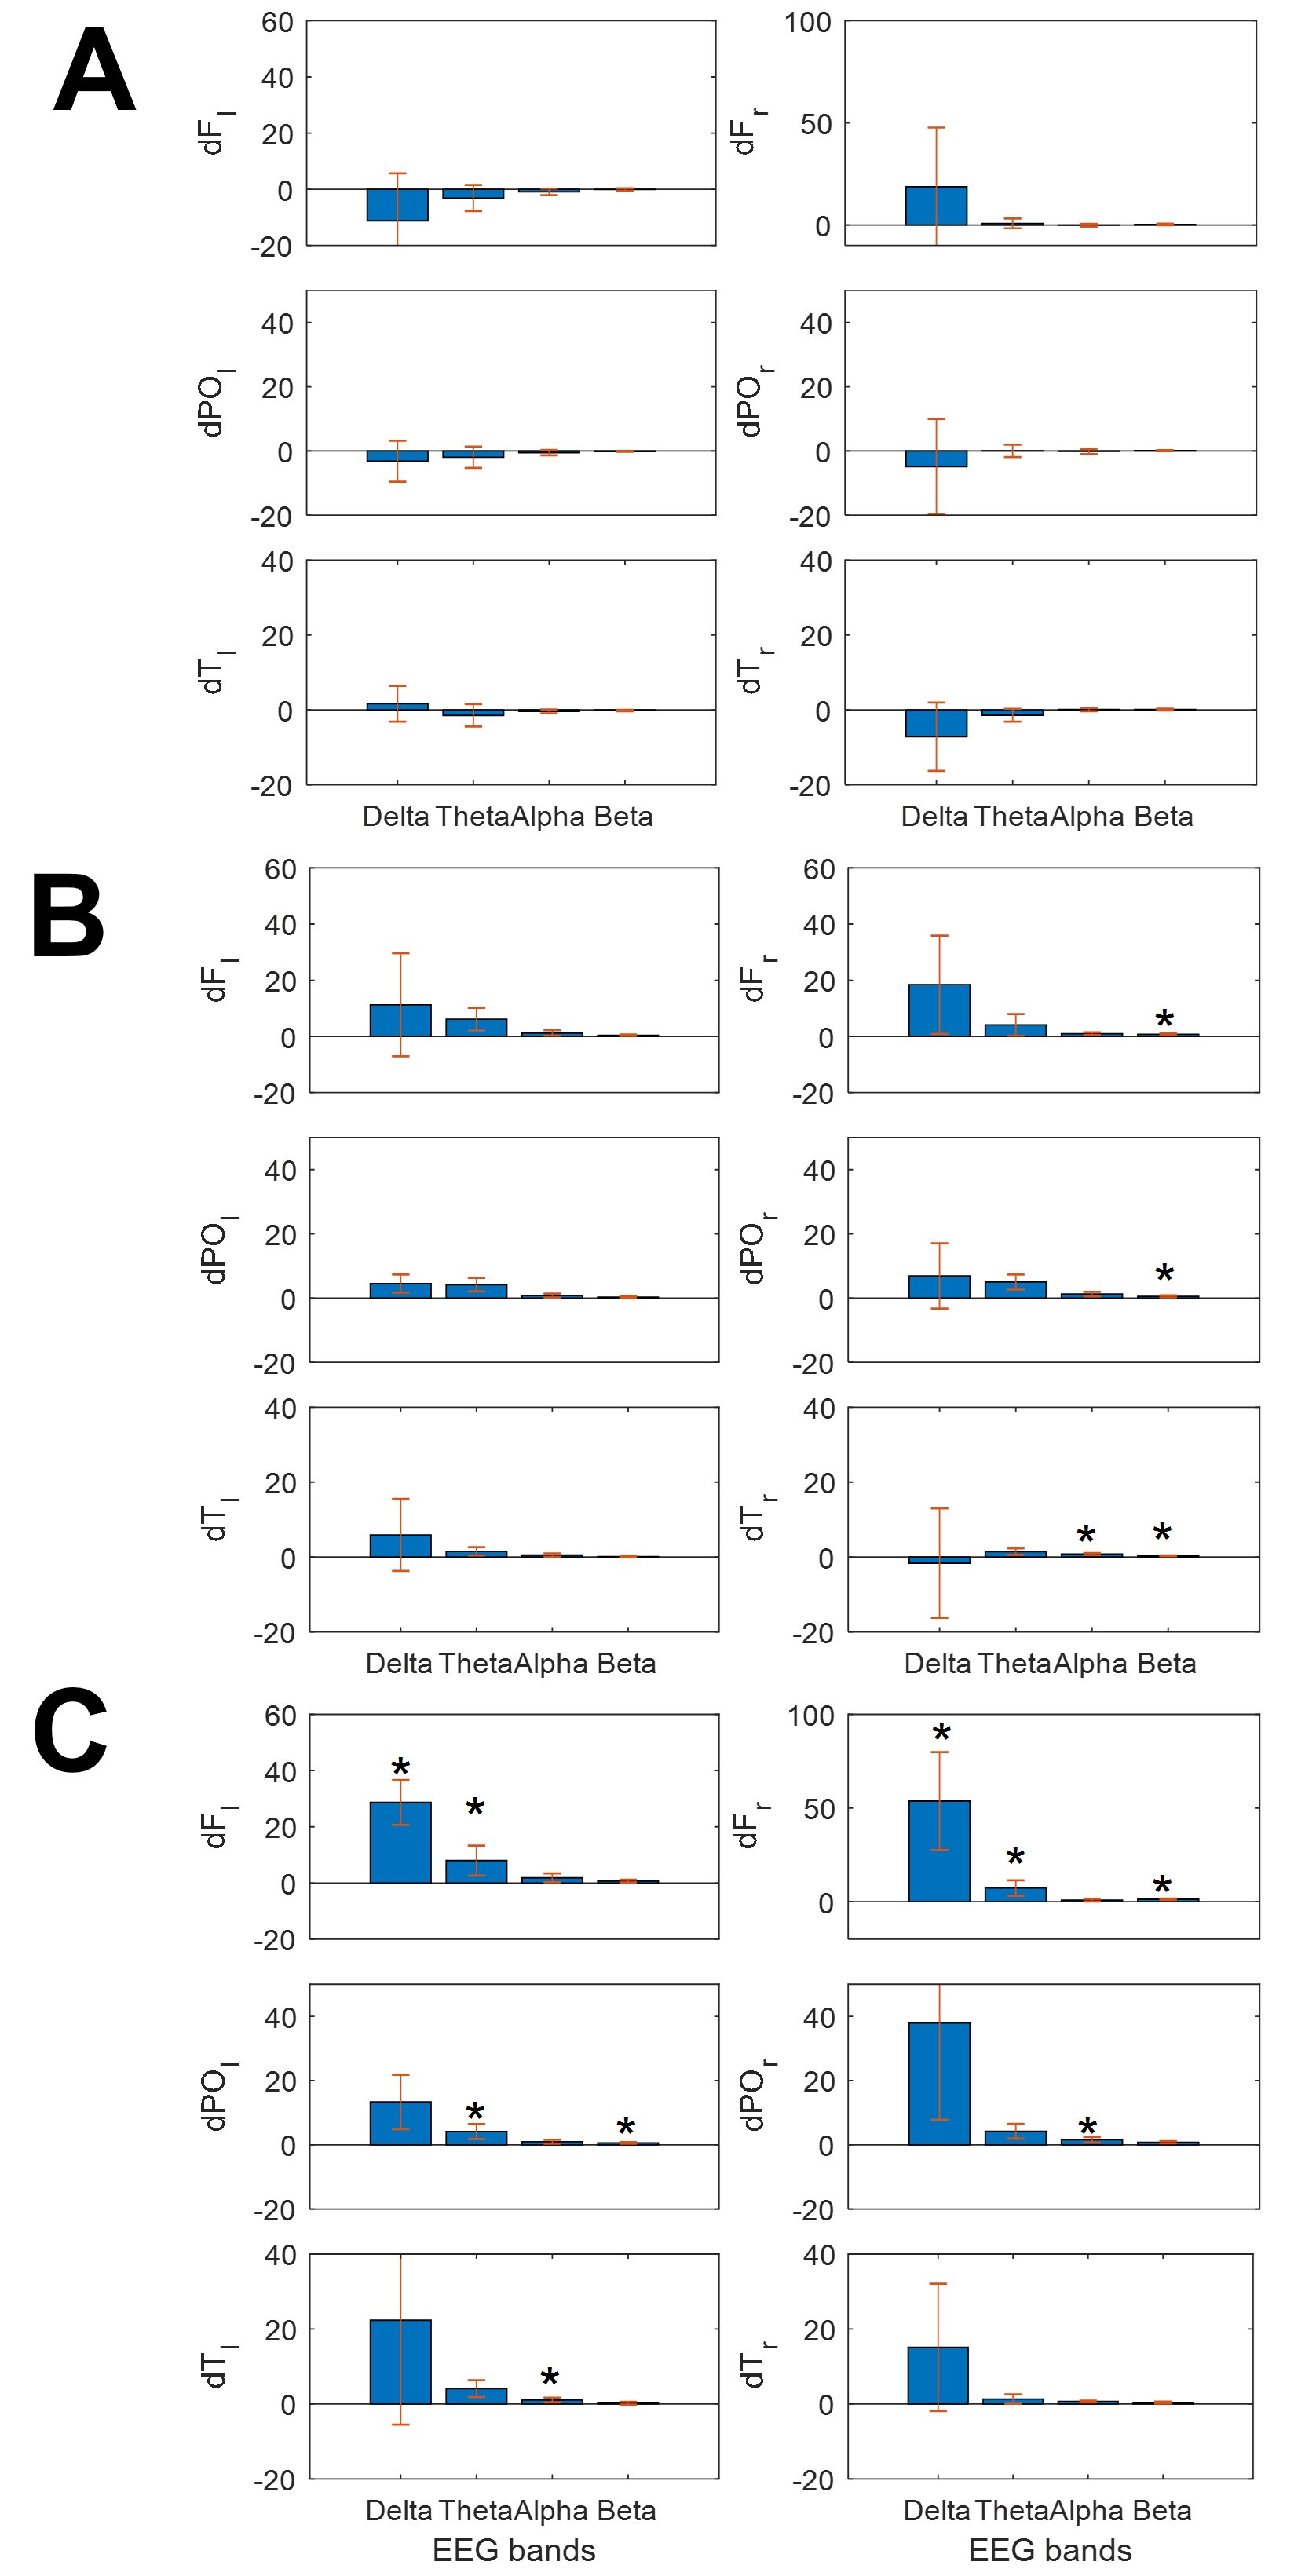
 Fig. 3.
Bars graphs showing the change in mean power spectra for the
different bands at different lobes. (A) ClassM, (B) DodecM and (C) HeavyM.
Asterisks indicate statistical significance (p
This different behavior for lobar spectra and SSE/synchronization measures was a significant finding in all patients (Fig. 3). As we observed, clear differences in bioelectrical activity were induced by different types of music.
As shown in Fig. 3, ClassM (Fig. 3A) mostly reduced the power of EEG bands over
the whole scalp, except for
Finally, HeavyM induced increasing spread changes, always increasing the power,
mainly for the slower bands (delta and theta, but not only these bands) and in
both hemispheres. This kind of music induced significant increases of power in
We compared the effects of the three types of music for the same EEG band in the
same lobe. We only observed differences between ClassM and HeavyM at these bands
and locations (
Finally, although the changes in
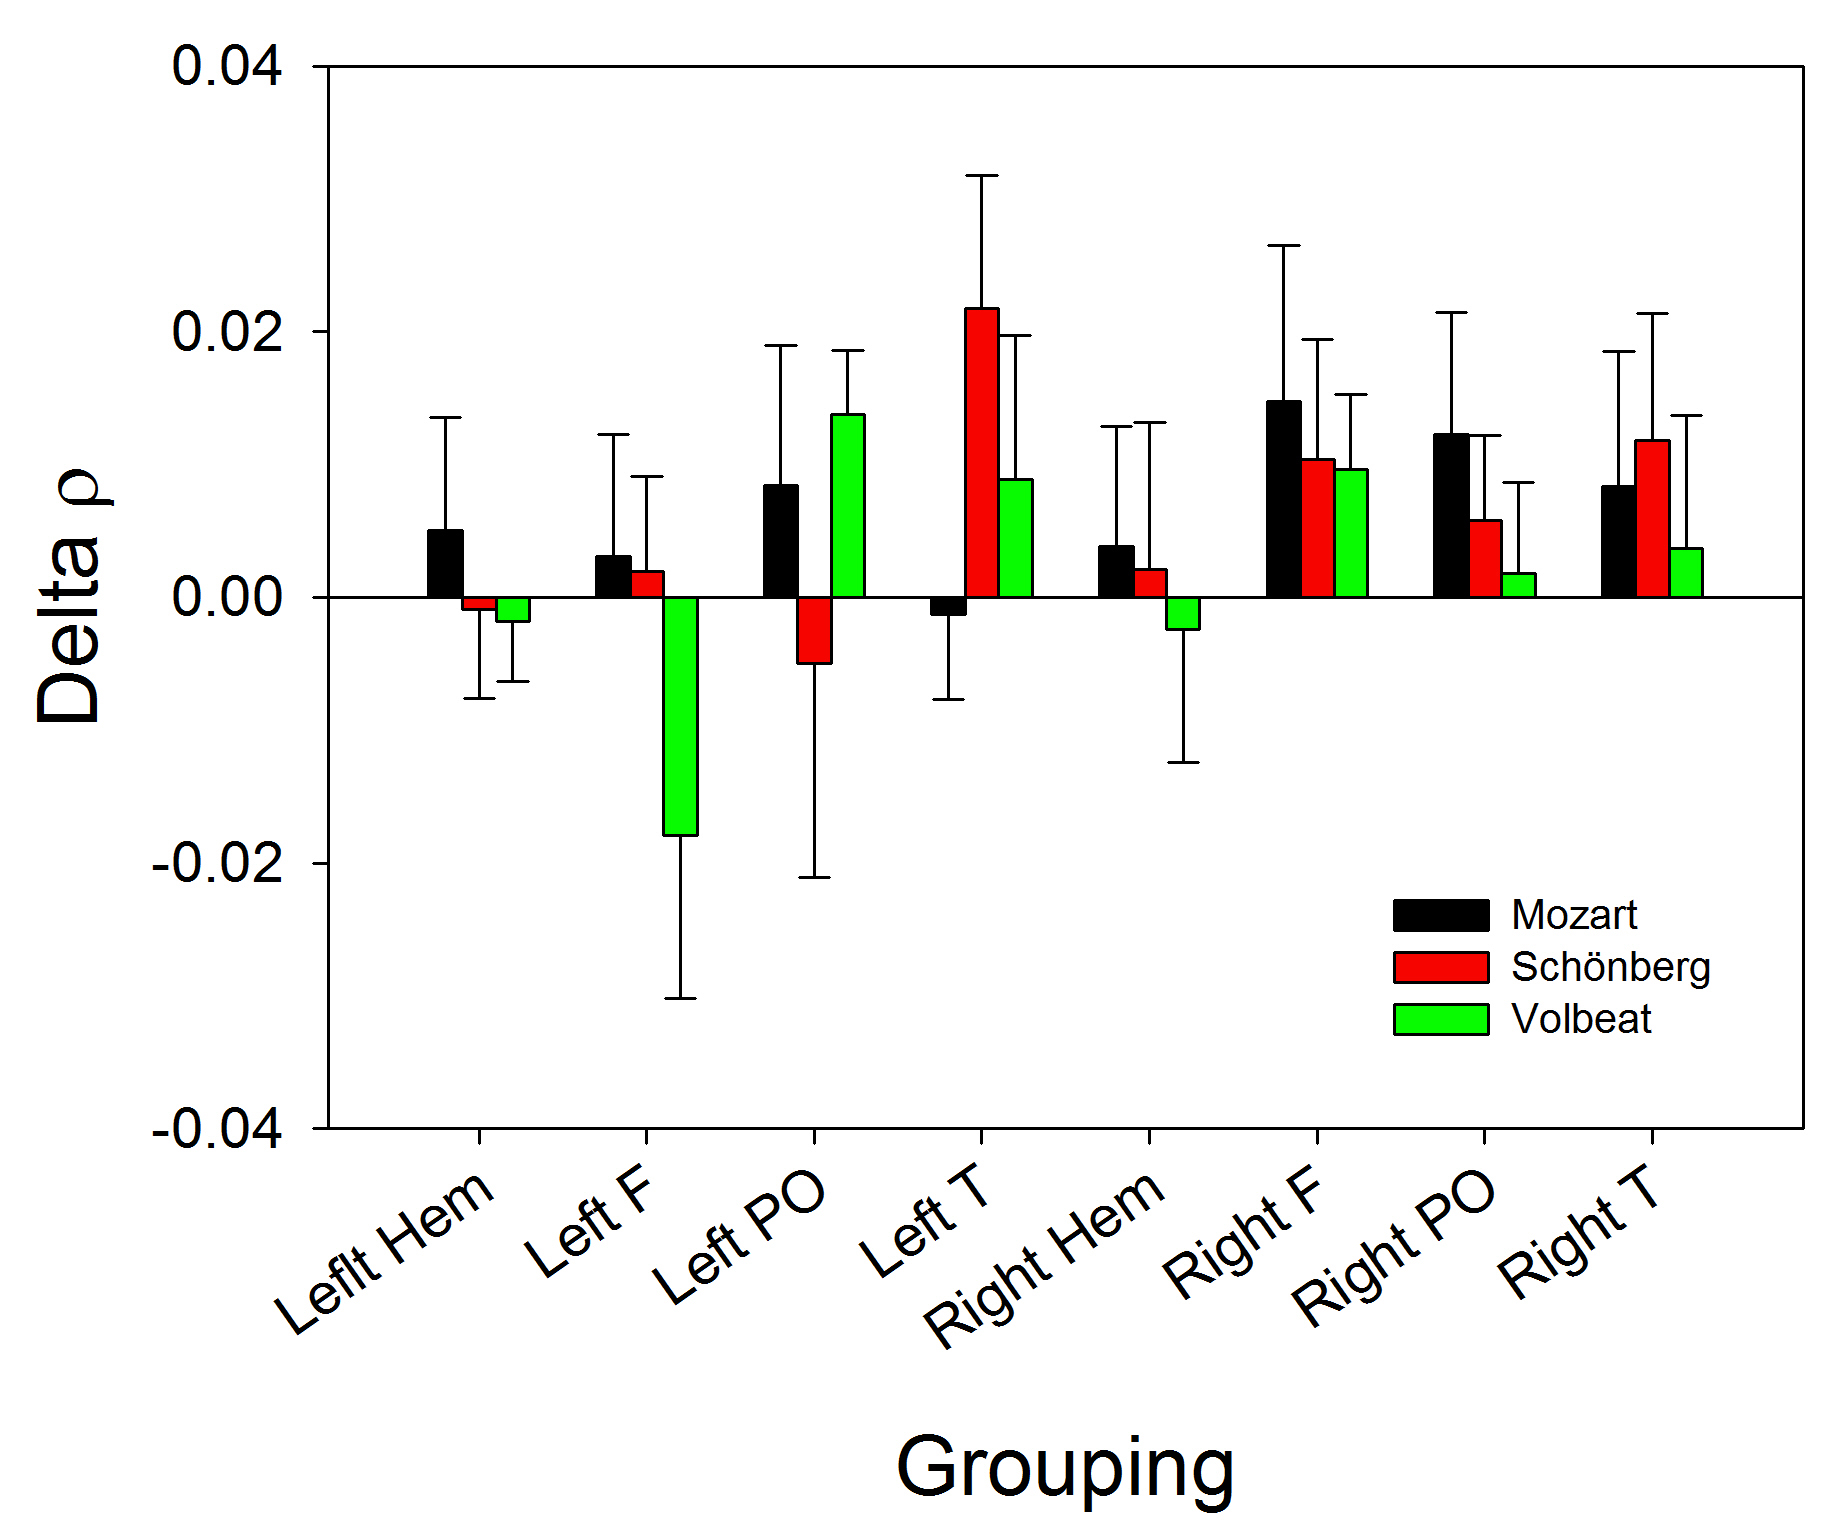 Fig. 4.
Bar graph showing the changes in
We wanted to check whether the changes in the different EEG bands to different
kinds of music stimulation were correlated (e.g., whether the increase in
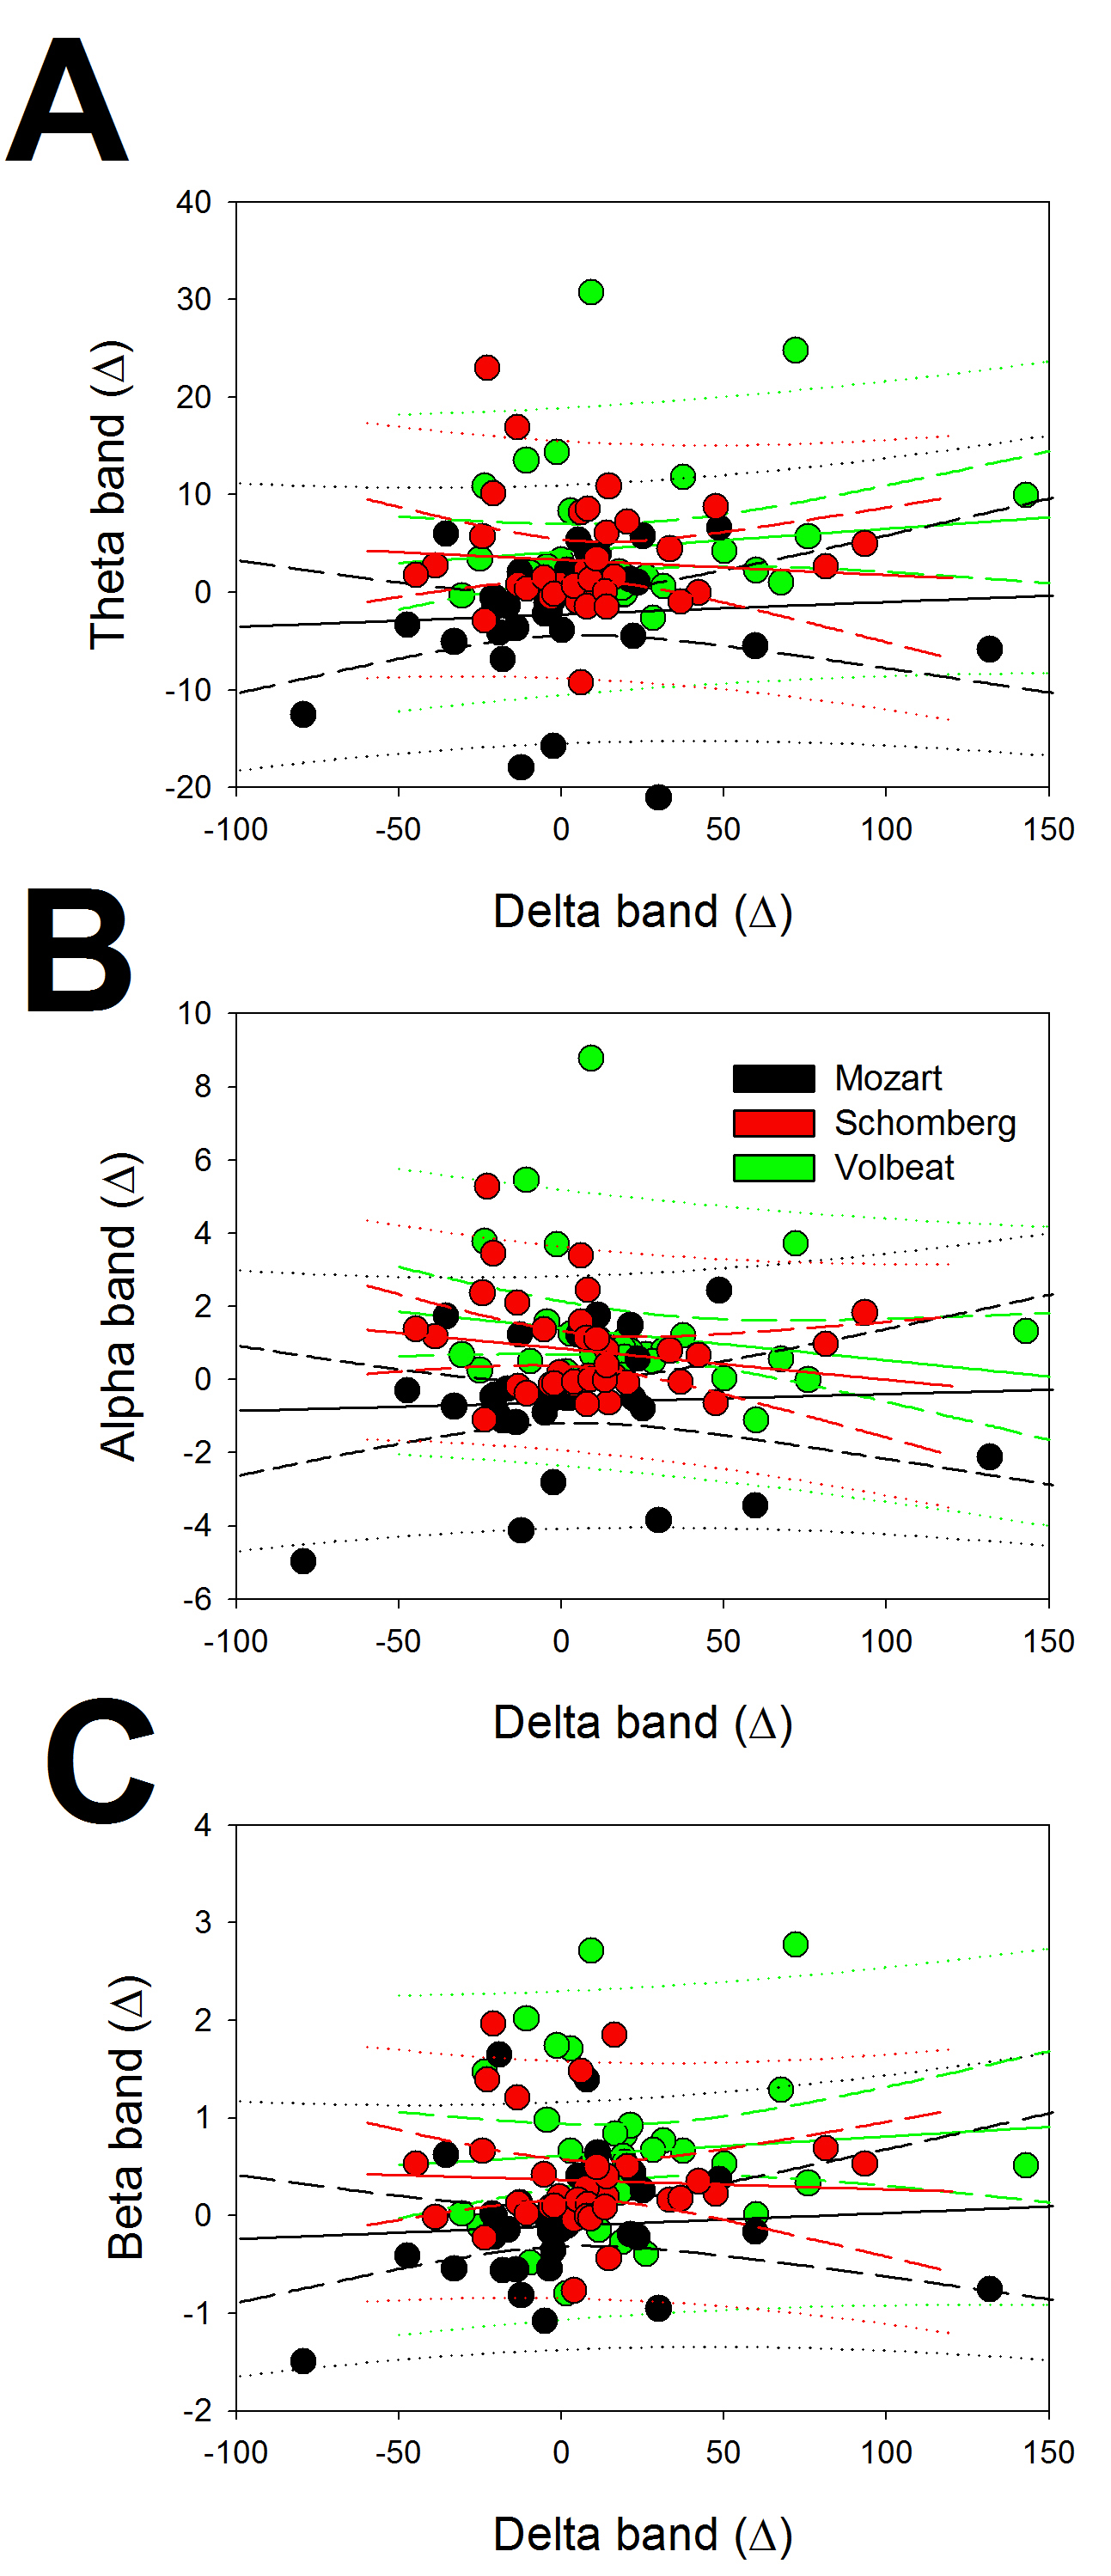 Fig. 5.
Linear regression between delta and the rest of the bands for
the changes in EEG bands. (A) Regression between delta and theta, (B) between
delta and alpha and (C) between delta and beta. Response to ClassM (black),
DodecM (red) and HeavyM (green). The symbol
The correlation coefficients (r) were 0.0689, 0.0477, and 0.0748 for the
regression between delta vs. theta, delta vs. alpha, and delta vs. beta,
respectively, for ClassM, 0.0758, 0.1782, and 0.0474 for DodecM, and 0.1546,
0.2250, and 0.1138 for HeavyM. From Eqn. 7, with n = 36 and p = 0.05, we
noted that only values of r
To characterize the patterns of response in the different lobes of the scalp, we
compared the changes induced by the three types of music in all four EEG bands.
For the analysis, we performed the
| Patient | Lobe | Left | Right | ||
|---|---|---|---|---|---|
| p | p | ||||
| Frontal | |||||
| ClassM vs. DodecM | 63.35 | 4.17 | n.s | ||
| ClassM vs. HeavyM | 76.05 | 30.56 | |||
| DodecM vs. HeavyM | 11.27 | 63.25 | |||
| Parieto-occipital | |||||
| ClassM vs. DodecM | 28.18 | 27.04 | |||
| ClassM vs. HeavyM | 32.88 | 55.06 | |||
| DodecM vs. HeavyM | 6.00 | n.s. | 63.25 | ||
| Temporal | |||||
| ClassM vs. DodecM | 11.65 | 53.72 | |||
| ClassM vs. HeavyM | 29.69 | 39.38 | |||
| DodecM vs. HeavyM | 14.12 | 63.25 | |||
As we can observe from Table 2, the patterns of response were completely different for the left frontal, right parieto-occipital, and both temporal lobes. It is interesting to observe that only 2/18 possibilities were not significant and only for ClassM vs. DodecM in the right frontal lobe and DodecM vs. HeavyM in the left parieto-occipital lobe. All comparisons between ClassM and HeavyM were highly significant in all the lobes.
In this work, we have shown that brain injury patients under sedo-analgesia respond differently to highly different types of music. The EEG is a homeostatic system with different neural systems as substrates for the bioelectrical bands in which the EEG trace can be divided [7, 8, 9, 29]. Therefore, the precise connectivity of each of these systems with specific networks of neural processing for external stimuli (e.g., auditory, somatosensory, visual, etc.) would allow a differential response. Music is a very complex stimulus processed by a modular system distributed along different brain regions [30, 31]. Music is capable of eliciting strong emotions, such as positive and negative emotions, that are mediated by the limbic system and associated structures, such as the prefrontal cortex [32].
In patients with severe DOC, without sedo-analgesia, it has been shown that music can elevate the mismatch negativity amplitude, with a possible association and good prognosis after retesting [19]. In critically ill patients under sedo-analgesia, listening to preferred music can reduce the sedation frequency [33], suggesting brain modulation. Not only the cortical response to music but also the aversive auditory stimulation modulates the resting-state functional connectivity in UWS patients [4]. However, in the previous studies, the music offered to the patient was biographically significant.
Besides the changes in connectivity observed in DOC patients, it has been
reported that active music therapy can increase the brain activity in the frontal
areas, cerebellum, and hippocampus [34], and can increase the value of the GCS
and decrease the ratio of (
The results of the current study show that non-biographical music changes the power of different EEG bands in different manners and with different patterns across the scalp. Surprisingly, ClassM did not change the power of either the bands or the scalp places. In fact, the tendency was clearly decreased for most of the responses, and no significance was attained for the SEM due to the small sample of patients. A decrease in the power of the EEG bands at specific places on the scalp (following the tendency of Fig. 3) could be considered a response, but the number of patients should be increased to confirm this result. Perhaps Mozart’s effect [26, 27, 39], which has been debated previously [40, 41, 42], is mediated by emotional responses or is conscious-mediated by the familiarity of a well-known melody. If true, this would imply that patients with brain pathology with/without sedo-analgesia would not recognize the music and, probably, could not recruit the limbic networks needed for emotions.
In contrast, the most intense response was induced by HeavyM. Relatively few papers have analyzed neural networks while patients listen to HeavyM music. In fact, only two papers have used this music to identify the brain processes associated with sensation-seeking related to music preference: one performed with MRI [43], and another that evaluated the cognitive judgements of music accompanied by affective responses [44] using event-related potentials; both papers used conscious subjects. Therefore, music preference seems to be related to the response to this kind of music. Although our patients were unconscious, we tried to avoid the possibility that patients had been previously exposed to the music by avoiding the use of music that is frequently played on radio stations, TV, or cinema (e.g., several AC/DC songs appear in Marvel’s films, Guns ‘n’ Roses contributed to the soundtrack of Terminator 2 and Marvel’s film Thor Love and Thunder; Ozzy Osbourne and Motorhead music was featured in the film Hellraiser III, and several TV commercials include music by Black Sabbath). Therefore, by personal preference and because Volbeat is not a HeavyM band known by the mass media, we selected the song, The Devil’s Bleeding Crown, which was demonstrated to induce the highest response, including in low-frequency bands and in both hemispheres.
Finally, in twelve-tone music (DodecM), all 12 notes are given more or less equal importance, and the music avoids being in a key. Therefore, its structure is clearly different from other types of music and, to the best of our knowledge, this is the first study to use this kind of music. As with HeavyM, the piece is not very well-known to the non-specialized public. The brain response was to some degree similar to that to HeavyM, although with the particularity that only faster bands (alpha and beta) were significantly activated, and exclusively from the right hemisphere. Meanwhile, HeavyM increased the beta band at the frontal hemisphere and the alpha band at the parieto-occipital right hemisphere. Although there is evidence that connectivity can change according to the type of music [4, 45, 46], we did not obtain demonstration of any statistical differences from the basal state.
This preliminary work has shown that the cerebral response in brain-injured patients under sedo-analgesia is opposite for ClassM and HeavyM. This fact poses many more questions than it answers. For example, why does the delta band increase with Volbeat and decrease with Mozart? We can exclude differences in volume because the three stimuli were fitted to the same decibel output. The exact features of the music (rhythm, tonality, texture, composition of sound frequencies) responsible for the response remain to be elucidated.
The brain’s response to music could depend on different conditions, such as coma stage, brain injury severity, or other pathophysiological derangements in metabolic, hormonal, or immunological systems or nutritional state. Therefore, the brain response could have different meanings for different patients. Although we have not addressed other physiological responses to music (e.g., hormonal or immunological), it would be interesting to address whether these different types of music stimuli also induce differential responses in these parameters.
Music has been suggested as a therapy for DOC states [47, 48, 49]. Taking into account that DodecM and, especially, HeavyM increased the brain activity in this study, it could be speculated that consecutive periods of stimulation with this kind of music can be used in some way to “rehabilitate” the ill brain.
We are conscious of the scarce number of patients, the heterogeneity in pathology, and other possible confounding factors (e.g., metabolic or nutritional state) as the main limitations in this study. Nevertheless, we obtained a robust statistical significance for tests well fitted to the non-Gaussian and small group of patients, demonstrating that the differences observed were real for this group of patients. The small number of patients impedes broader generalization, but the significance of the results cannot be denied. We expect that a larger number of patients with more homogeneity regarding pathology and pathophysiological state at EEG acquisition will decrease the methodological error, allowing a better picture of the effects of different types of music on DOC patients.
Although the data were obtained from a small set of patients, we observed that different types of music induce specific responses in brain activity in unconscious patients suffering from primary brain pathology under sedo-analgesia. HeavyM was the most stimulating music, whereas classical music showed a tendency to reduce brain activity. Despite the need for further research, this difference in response to highly different features of music may be a useful prognosis tool and a component of a music therapy tool.
The datasets used and/or analyzed during the current study are available from the corresponding author on reasonable request.
Conceptualization—JP and LVZ; methodology—JP, LVZ, AC; software—JP; formal analysis—JP; data curation—JP, LVZ, AC; writing - original draft preparation—JP; writing - review and editing—JP. All authors have read and agreed to the published version of the manuscript.
The study observed the principles of the Helsinki’s Declaration and was approved by the Ethics Committee of the Hospital Universitario de la Princesa (Ref. 4274), and each patient’s relative provided wrote informed consent.
Not applicable.
This research received no external funding.
The authors declare no conflict of interest. Jesús Pastor is serving as one of the Editorial Board members of this journal. We declare that Jesús Pastor had no involvement in the peer review of this article and has no access to information regarding its peer review. Full responsibility for the editorial process for this article was delegated to Gernot Riedel.
References
Publisher’s Note: IMR Press stays neutral with regard to jurisdictional claims in published maps and institutional affiliations.