


1 Department of Anesthesiology, Wuhan Children’s Hospital (Wuhan Maternal and Child Healthcare Hospital), Tongji Medical College, Huazhong University of Science & Technology, 430000 Wuhan, Hubei, China
Academic Editor: Rafael Franco
Abstract
Background: To explore the mechanism of endocannabinoid cannabinoid
receptor 1 (CB1) receptor pathway that regulates synaptic plasticity in the
dorsal horn of the spinal cord of rats with neuropathic pain at different ages.
Methods: Neonatal, juvenile, and adult male sprague dawley (SD) rats
were divided into the spinal nerve preservation injury (SNI), SNI + Anandamide
(AEA), SNI + D-AP5, SNI + CNQX, SNI + D-AP5 + AEA, SNI + CNQX + AEA, sham SNI,
sham SNI + AEA, sham SNI + D-AP5, sham SNI + CNQX, sham SNI + D-AP5 + AEA, and
sham SNI + CNQX + AEA groups, respectively. Paw withdrawal threshold (PWT) and
long-term potentiation (LTP) of the spinal dorsal horn PS (field potential) were
assessed to judge the spinal cord’s functional state. Immunohistochemical
staining and Western blot were conducted to detect CB1 protein levels in the
spinal dorsal horn. Results: The LTP response in the spinal cord was
alleviated in the SNI + AEA group. After treatment with the N-methyl-D-aspartate
(NMDA) receptor blocker D-AP5, the LTP of neonatal A nerve was relieved further.
After treatment with the
Keywords
- cannabinoid signaling pathway
- NMDA receptor
- AMPA receptor
- neonatal rat
- juvenile rat
Trauma, inflammation, and direct nerve injury may first cause nerve fiber damage, resulting in a large amount of ectopic electrical activity. The long-term effects of this ectopic electrical activity lead to long-term potentiation (LTP) of synaptic transmission of nociception in the dorsal horn of the spinal cord, ultimately causing hyperexcitability and central sensitization of spinal nociceptive sensory neurons and neuropathic pain. The long-term plasticity of synaptic transmission in the dorsal horn of the spinal cord plays a major role in the pathogenesis of neuropathic pain. Similar changes were detected in synaptic transmission plasticity during the occurrence, development, and maintenance of neuropathic pain [1]. A previous study constructed an adult rat model of neuropathic pain, he spinal nerve preservation injury model (SNI model), which readily induces synaptic transmission of LTP in the dorsal horn of the spinal cord [2]. The decrease in LTP induction thresholds for A and C fiber evoked potentials in the dorsal horn of the spinal cord in SNI model rats suggested that the plasticity of synaptic transmission efficiency in the spinal dorsal horn may play an important role in the development of neuropathological pain. In addition, ectopic electrical activity of nerves in the dorsal horn of the spinal cord after spinal nerve ligation, disruption of the central descending inhibitory system of the spinal cord, phenotypes of injured nerve fibers, and changes in neurochemical factors have been associated with neuropathic pain [3].
The endogenous cannabinoid receptor agonist Anandamide (AEA) acts through
cannabinoid receptors (CB1 and CB2) and other targets, such as G protein-coupled
receptor 55 (GPR55) and transient receptor potential cation channel, subfamily V,
member 1 (TRPV1) receptors, thereby promoting LTP. The CB1 receptors are mainly
distributed in the brain, spinal cord, and peripheral nervous system, as well as
in the pain transmission pathways, such as the posterior horn of the spinal cord.
Some studies on the dorsal horn of the adult rat spinal cord have shown that
presynaptic CB1 receptors are activated, thereby inhibiting glutamate release and
C nociceptive sensory nerve fibers, decreasing spinal excitatory transmission,
and effectuating analgesia in the spinal cord [4]. In the present study, we
analyzed PS in the neonatal and juvenile rat SNI models. This confirmed the LTP
changes in synaptic plasticity-generating field potentials (FPs) in the dorsal
horn of the spinal cord via modulation of glutamatergic
Recording the PS of synaptic transmission in the dorsal horn of the spine is a crucial aspect of LTP and interference with respect to the onset and development of neuropathic pain. LTP is a sustained enhancement of neuronal signaling, and its formation is associated with glutamate AMPA and NMDA receptors, postsynaptic calcium release, and activation of signaling pathways [5]. Previous studies have shown that the modulation of AMPA and NMDA receptors affects LTP formation in the FPs in the dorsal horn of the spine. However, the formation of LTP in the FPs of immature SNI rats is yet to be clarified. In the neonatal period, the spinal dorsal horn develops central sensitization in young individuals [6, 7]. Repeated stressful stimuli (pain signals) redistribute the neurons in the sensory system of the spinal cord with simultaneous appearance of C and A fibers. These phenomena lead to the retention of a large number of synapses or the formation of abnormal connections, causing painful changes that cause chronic pain syndrome, physical discomfort, growth retardation, and other future diseases in children. Therefore, the detection and pharmacological intervention of LTP in the dorsal horn of the spinal cord is essential in neonatal and adolescent individuals. CB1 receptors are widely distributed in the central nervous system and are targets for central analgesia. Therefore, the present study aimed to investigate the mechanisms of endogenous cannabinoid CB1 receptor pathway in regulating synaptic plasticity in the dorsal horn of the spinal cord in rats with neuropathic pain at different ages.
A total of 273 specific pathogen-free (SPF) rats, including neonatal (20 days after birth; P20), juvenile (P40), and adult (P60) (6–8 rats per group, 36 groups; Fig. 1 and Table 1), were purchased from Unilever (Beijing, China), and all the animal experiments were conducted at the Laboratory A Ⅲ of Center for Animal Experiment of Wuhan University. After one week of early adaptation or feeding acclimatization (newborn rats were fed by their mothers), SNI or sham SNI surgery was performed on the animals [8, 9]. According to the method by Bennett and Xie [10], the surgery involved the blunt separation of the sciatic nerve and its three branches, ligation of the tibial peroneal and tibial nerves and preservation of the small sural nerve, silk ligation and shear of the tibial and common peroneal nerves, and preservation of the small sural nerve to establish the SNI model. Local and intramuscular injections of penicillin were adopted to promote wound healing in rats. Sham operation was also performed in the neonatal, juvenile, and adult rat groups. The skin was incised and the nerve separated but not ligated before suturing. After the operation, the rats were kept in a single cage for 14 days.
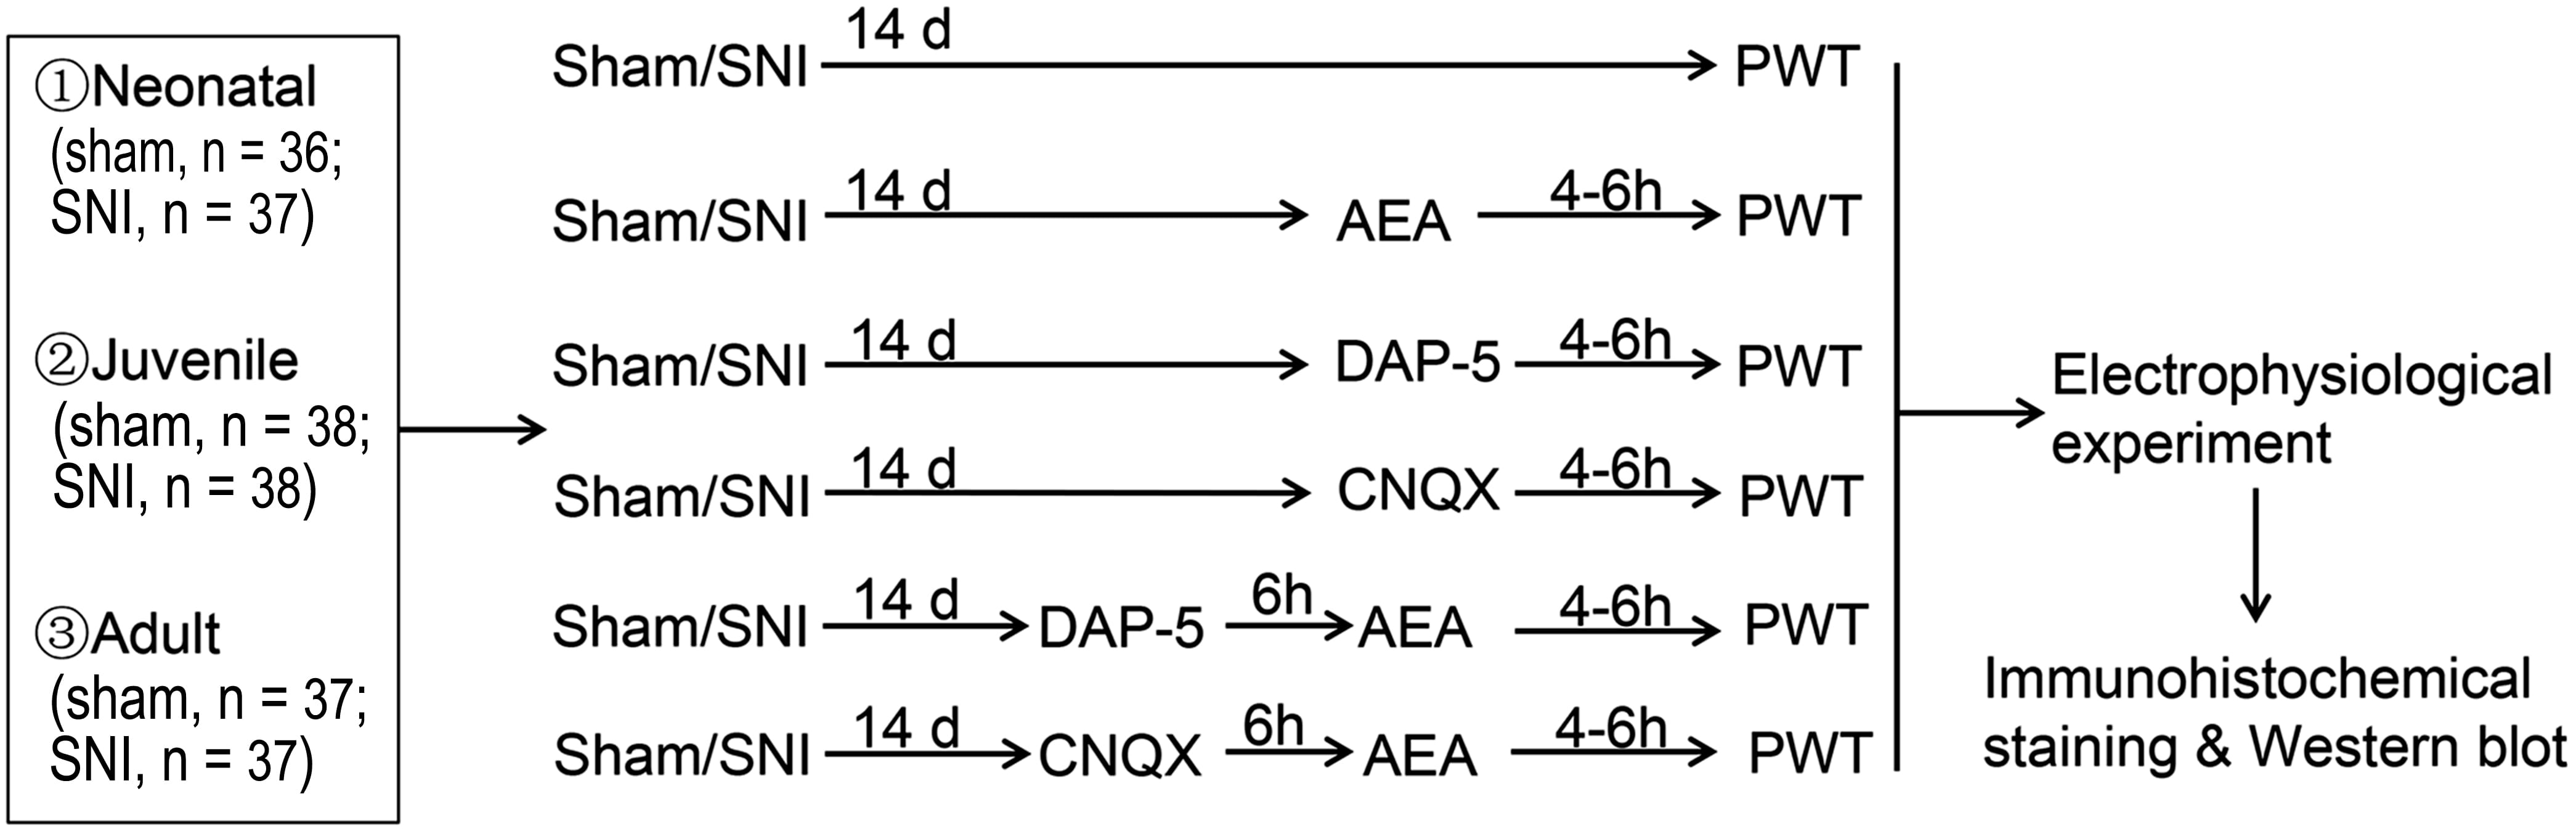 Fig. 1.
Experimental design. SNI, spared nerve injury; d, days; h, hour; PWT, 50% paw withdrawal threshold; DAP-5, DL-2-amino-5-phosphonopentanoic acid; CNQX, 6-cyano-7 nitroquinoxaline-2, 3-dione.
| Neonatal group (P20) | |||||||||
| Before operation | 3 days after operation | 7 days after operation | 14 days after operation | Before operation | 3 days after operation | 7 days after operation | 14 days after operation | ||
| SNI | 6.78 |
5.17 |
3.72 |
2.1 |
Sham SNI | 6.37 |
6.01 |
5.87 |
5.92 |
| SNI + AEA | 6.72 |
5.8 |
3.99 |
4.27 |
Sham SNI + AEA | 6.82 |
6.09 |
5.92 |
6.18 |
| SNI + D-AP5 | 6.61 |
5.42 |
3.75 |
5.82 |
Sham SNI + D-AP5 | 6.73 |
6.39 |
5.99 |
6.27 |
| SNI + CNQX | 6.89 |
5.16 |
3.82 |
4.16 |
Sham SNI + CNQX | 6.69 |
6.52 |
6.18 |
6.29 |
| SNI + D-AP5 + AEA | 6.53 |
5.37 |
3.69 |
6.42 |
Sham SNI + D-AP5 + AEA | 6.71 |
6.61 |
6.37 |
6.46 |
| SNI + CNQX + AEA | 6.82 |
5.37 |
4.05 |
4.85 |
Sham SNI + CNQX + AEA | 6.34 |
6.19 |
6.29 |
6.31 |
| Juvenile group (P40) | |||||||||
| Before operation | 3 days after operation | 7 days after operation | 14 days after operation | Before operation | 3 days after operation | 7 days after operation | 14 days after operation | ||
| SNI | 9.46 |
8.16 |
5.38 |
3.61 |
Sham SNI | 9.32 |
9.18 |
9.10 |
9.03 |
| SNI + AEA | 9.36 |
8.26 |
6.09 |
6.61 |
Sham SNI + AEA | 9.43 |
9.38 |
9.09 |
9.30 |
| SNI + D-AP5 | 9.51 |
8.08 |
5.94 |
7.82 |
Sham SNI + D-AP5 | 9.37 |
9.03 |
8.79 |
9.08 |
| SNI + CNQX | 9.62 |
8.24 |
5.94 |
7.25 |
Sham SNI + CNQX | 9.52 |
9.01 |
8.79 |
9.08 |
| SNI + D-AP5 + AEA | 9.58 |
8.46 |
5.69 |
8.52 |
Sham SNI + D-AP5 + AEA | 9.71 |
9.43 |
9.08 |
9.26 |
| SNI + CNQX + AEA | 9.69 |
8.14 |
5.19 |
8.36 |
Sham SNI+CNQX+AEA | 9.65 |
9.24 |
8.92 |
9.37 |
| Adult group (P60) | |||||||||
| Before operation | 3 days after operation | 7 days after operation | 14 days after operation | Before operation | 3 days after operation | 7 days after operation | 14 days after operation | ||
| SNI | 12.79 |
10.71 |
6.25 |
4.18 |
Sham SNI | 12.64 |
12.08 |
11.98 |
11.88 |
| SNI + AEA | 12.51 |
10.24 |
6.61 |
6.97 |
Sham SNI + AEA | 12.32 |
12.04 |
11.91 |
12.25 |
| SNI + D-AP5 | 12.46 |
10.52 |
6.15 |
7.29 |
sham SNI + D-AP5 | 12.48 |
11.98 |
11.87 |
12.12 |
| SNI + CNQX | 12.36 |
10.62 |
6.37 |
8.63 |
Sham SNI + CNQX | 12.37 |
11.90 |
11.89 |
12.38 |
| SNI + D-AP5 + AEA | 12.49 |
10.86 |
6.43 |
9.68 |
Sham SNI + D-AP5 + AEA | 12.66 |
11.89 |
11.69 |
12.16 |
| SNI + CNQX + AEA | 12.52 |
11.6 |
6.57 |
10.96 |
Sham SNI + CNQX + AEA | 12.54 |
11.96 |
11.91 |
12.42 |
The animals were randomized into the SNI, SNI + AEA, SNI + D-AP5, SNI + CNQX, SNI + D-AP5 + AEA, SNI + CNQX + AEA, sham SNI, sham SNI + AEA, sham SNI + D-AP5, sham SNI + CNQX, sham SNI + D-AP5 + AEA, and sham SNI + CNQX + AEA groups. A volume of 0.5 mL of 1 mmol/L [11] AEA (Asc-429, Xiamen Huijia Biotechnology Company, Xiamen, China) or 10 mmol/L [12] D-AP5 (Asc-003, Xiamen Huijia Biotechnology Company, Xiamen, China) or 10 mmol/L [13] CNQX (MCE, HY-15066, NJ, USA) was injected into the caudal vein at 14 days after SNI (sham operation) in SNI/sham + AEA, SNI/sham + D-AP5, and SNI/sham + CNQX groups. After 6 h post-D-AP5 or -CNQX administration, 0.5 mL of 1 mmol/L anandamide (AEA) [11] was injected into the caudal vein in the SNI/sham + DAP-5 + AEA or SNI/sham + CNQX + AEA group. After 4–6 h, mechanical stimulation was performed to shrink the right palm and assess the leg shrinkage threshold (50% paw withdrawal threshold (PWT)). Then, mechanical stimulation and electrophysiological experiments were carried out in the SNI group, following which, the second and third spinal cord segments were collected.
50% PWT was measured before the injury and at 3, 7, and 14 days after the SNI
operation. Morphology was observed and 50% PWT was determined in rats as
follows. The animals were placed in a von Frey
According to the in vitro electrophysiological technology [15], the sciatic nerve of P20, P40, and P60 rats received ankylosing electrical stimulation at 14 days after SNI to induce LTP in the superficial layer of the spinal dorsal horn, respectively. The field potential amplitude was processed on the RM6240 multi-channel signal acquisition system (RM6240 model: RM6240BD, VBD5246, CZ 01000158) and subjected to single stimulation; P20, P40, and P60 animals were stimulated with 3 V, 5 V, and 8 V, respectively. In the sham operation groups, P20, P40, and P60 animals were stimulated with 5 V, 10 V, and 15 V, respectively. Then, the evoked waves of spinal dorsal horn A or/and C fibers (basic values) were induced. After high-frequency stimulation (HFS) at 6 V, 10 V, and 12 V, respectively, the sham operation group received four levels of electrical stimulation at 10 V, 20 V, and 30 V, frequency 100 Hz, wave width 0.5 ms, string length 1 s, and string interval 10 s. The evoked waves of spinal dorsal horn A and C fibers were induced through the sciatic nerve to produce field potential changes that were recorded for at least 60 min; 14 days after sham SNI, CNQX, D-AP5, and AEA was injected intravenously 6 hours later, and behavioral tests were carried out after 2 h. Subsequently, the electrophysiological experiments were carried out to observe the evoked field potentials of A and C fibers as well as the potential amplitude changes in AMPAR- and/or NMDAR-mediated FPs (expressed in %) (Fig. 2 and Table 2).
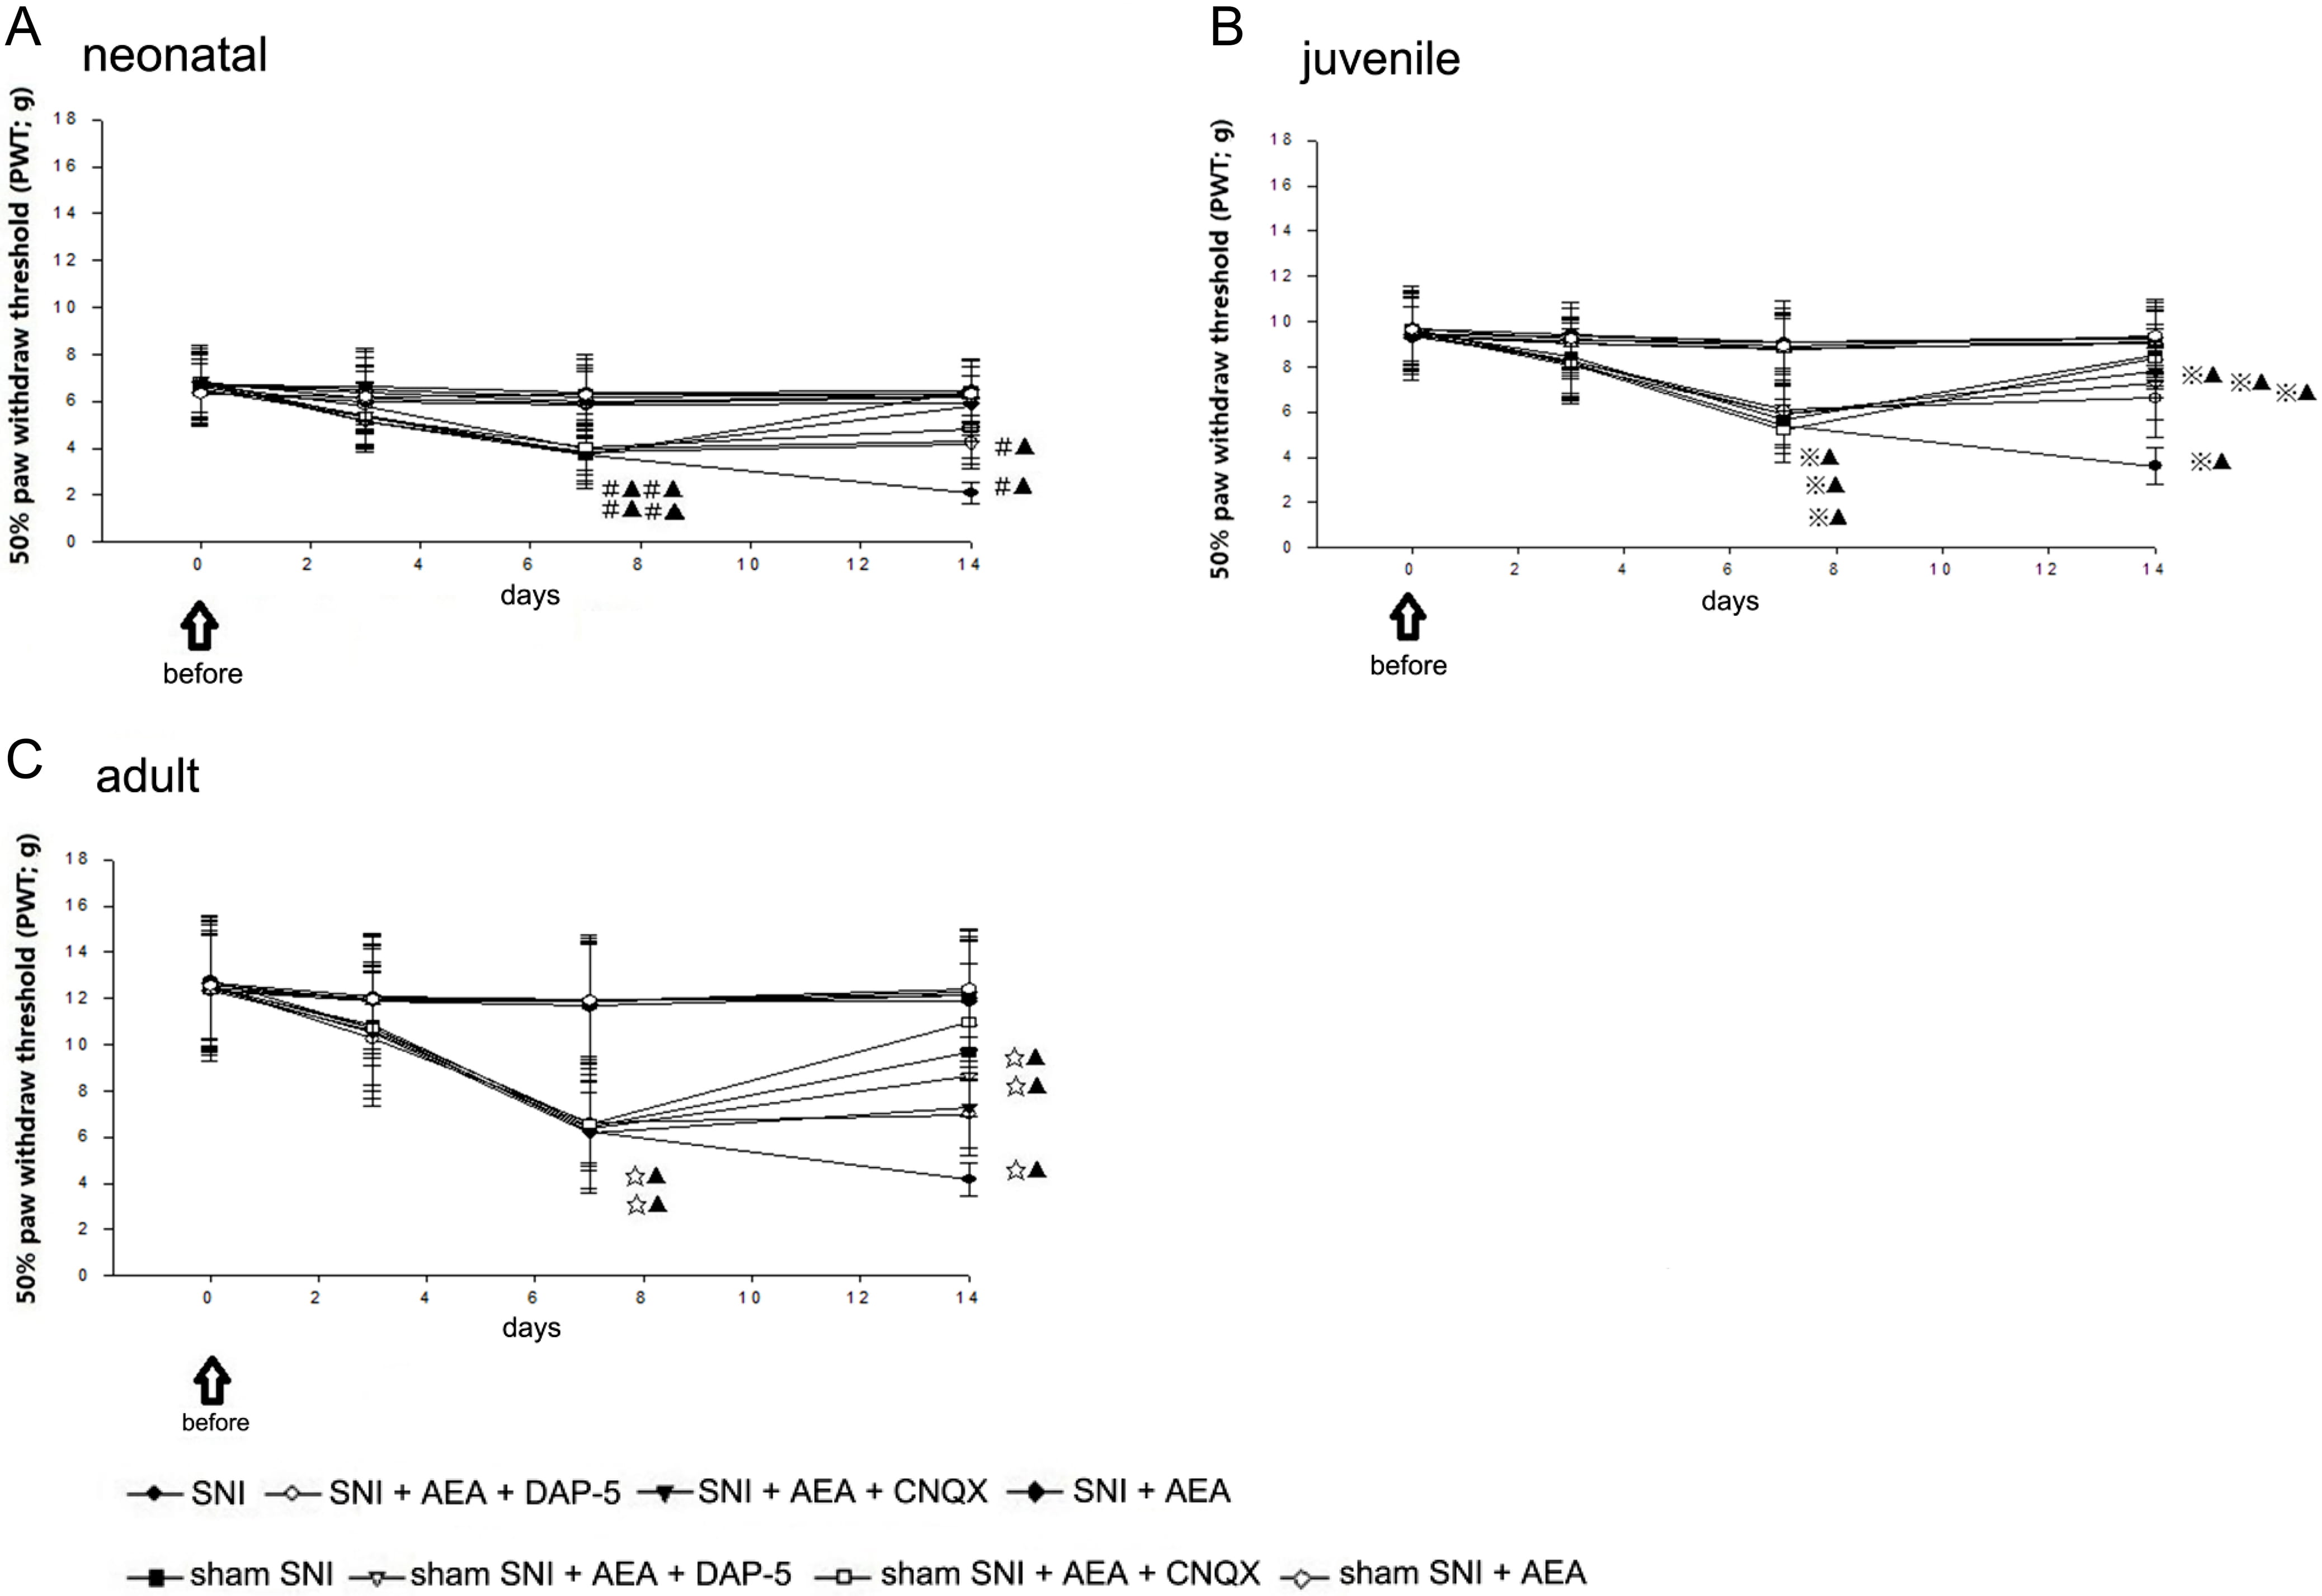 Fig. 2.
50% PWT before and after SNI in rats of different ages.
| A | C | |||||
| Neonatal | Juvenile | Adult | Neonatal | Juvenile | Adult | |
| Before ankylosis in the SNI group | 31.62 |
32.65 |
34.19 |
5.68 |
9.27 |
15.49 |
| After ankylosis | 80.15 |
76.29 |
71.63 |
6.35 |
22.75 |
27.29 |
| Before ankylosis in the sham SNI group | 30.48 |
31.76 |
34.49 |
5.52 |
9.63 |
16.08 |
| After ankylosis | 42.81 |
38.82 |
36.14 |
5.56 |
12.48 |
23.94 |
| Before ankylosis in the SNI + AEA group | 30.58 |
30.85 |
34.26 |
5.98 |
9.75 |
15.76 |
| After ankylosis | 50.31 |
42.59 |
46.09 |
6.49 |
12.27 |
20.74 |
| Before ankylosis in the sham SNI + AEA group | 30.94 |
32.13 |
34.47 |
5.36 |
9.52 |
15.46 |
| After ankylosis | 34.38 |
32.82 |
35.08 |
5.75 |
11.97 |
17.31 |
| Before ankylosis in the SNI + D-AP5 group | 30.63 |
30.82 |
34.16 |
5.82 |
10.57 |
15.81 |
| After ankylosis | 49.37 |
56.08 |
50.59 |
6.25 |
13.82 |
18.75 |
| Before ankylosis in the sham SNI + D-AP5 group | 30.75 |
31.53 |
33.94 |
5.41 |
9.86 |
15.64 |
| After ankylosis | 33.28 |
34.83 |
35.52 |
5.85 |
11.73 |
17.82 |
| Before ankylosis in the SNI + CNQX group | 31.82 |
32.48 |
33.27 |
5.69 |
9.85 |
15.78 |
| After ankylosis | 52.49 |
50.16 |
48.23 |
5.87 |
12.69 |
17.64 |
| Before ankylosis in the sham SNI + CNQX group | 31.46 |
30.52 |
34.07 |
5.29 |
9.46 |
14.69 |
| After ankylosis | 36.08 |
32.64 |
35.75 |
5.09 |
11.86 |
15.51 |
| Before ankylosis in the SN I + D-AP5 + AEA group | 30.64 |
30. 86 |
33.57 |
5.35 |
10.09 |
14.35 |
| After ankylosis | 31.95 |
33.15 |
37.49 |
5.57 |
11.28 |
15.59 |
| Before ankylosis in the sham SNI + D-AP 5 + AEA group | 30.73 |
32.25 |
33.18 |
5.16 |
10.64 |
14.45 |
| After ankylosis | 31.65 |
33.41 |
33.61 |
5.42 |
11.57 |
14.95 |
| Before ankylosis in the SNI CNQX + AEA group | 30.25 |
31.96 |
34.1 |
5.21 |
10.51 |
14.83 |
| After ankylosis | 35.91 |
33.79 |
34.86 |
5.64 |
10.69 |
14.74 |
| Before ankylosis in the sham SNI + CNQX + AEA group | 32.18 |
31.52 |
33.72 |
5.19 |
10.73 |
14.65 |
| After ankylosis | 33.41 |
33.65 |
34.59 |
5.47 |
10.92 |
14.82 |
| SNI and sham SNI groups: ◇, p | ||||||
After the electrophysiological experiment, the chests of the animals were
opened, the right atrial appendage was cut off, and 100–150 mL of normal saline
and 250 m of 4% paraformaldehyde fixation solution were injected successively
and rapidly through the ascending aorta (4
After the electrophysiological experiment, the tissue sections were analyzed according to the above operation, followed by phosphate-buffered saline (PBS) hydration, and sealing with skimmed milk. Hematoxylin and eosin (H&E) staining was performed for histological analysis. The cytoplasm stained red with strong reflectivity, and the color changed with SNI, electrical stimulation, and medication. At room temperature, anti-CB1 receptor antibodies (Abclonal, A1447) were added and incubated for 2 h, followed by incubation with secondary antibodies (A0208,1:1000, Beyotime, Shanghai, China) for 1 h. After three PBS washes, the film was sealed and observed under a light microscope.
The Mshot High Definition Color Pathological Graphic Report Management
System (Mshot MD50) was used to acquire the images of lumbar 2 and 3 segments of
the spinal cord of neonatal, juvenile, and adult rats, respectively. Under a
200
After the above treatments in various groups, spinal cord tissue samples were
obtained, snap frozen with liquid nitrogen, homogenized, and tissue protein
extract was obtained by centrifugation. An equivalent of 35
The ImageJ software (version 1.8.0, LOCI, University of Wisconsin, Madison, WI, USA) was used to analyze the gray value of strips. GAPDH (66009-1-Ig, Proteintech, Company) was used as an internal reference for normalization. The secondary antibodies were goat anti-mouse (SA00001-1, Proteintech Inc., Chicago, IL, USA) and goat anti-rabbit (SA00001-2, Proteintech Inc, Chicago, IL, USA).
Measurement data were analyzed using the SPSS 13.0 software (IBM Corp., Chicago,
IL, USA) and expressed as mean
The present study evaluated the right paw. No significant difference was
detected in 50% PWT between the sham SNI and SNI groups before and 3 days after
SNI. In neonatal rats, 50% PWT in sham SNI rats (including those injected with
D-AP5, CNQX, and AEA) and the SNI + D-AP5 + AEA group was significantly different
from that in the SNI + AEA and SNI + CNQX + AEA groups at 7 and 14 days
postoperatively (p
An amplitude 20% greater than the baseline value and lasting for
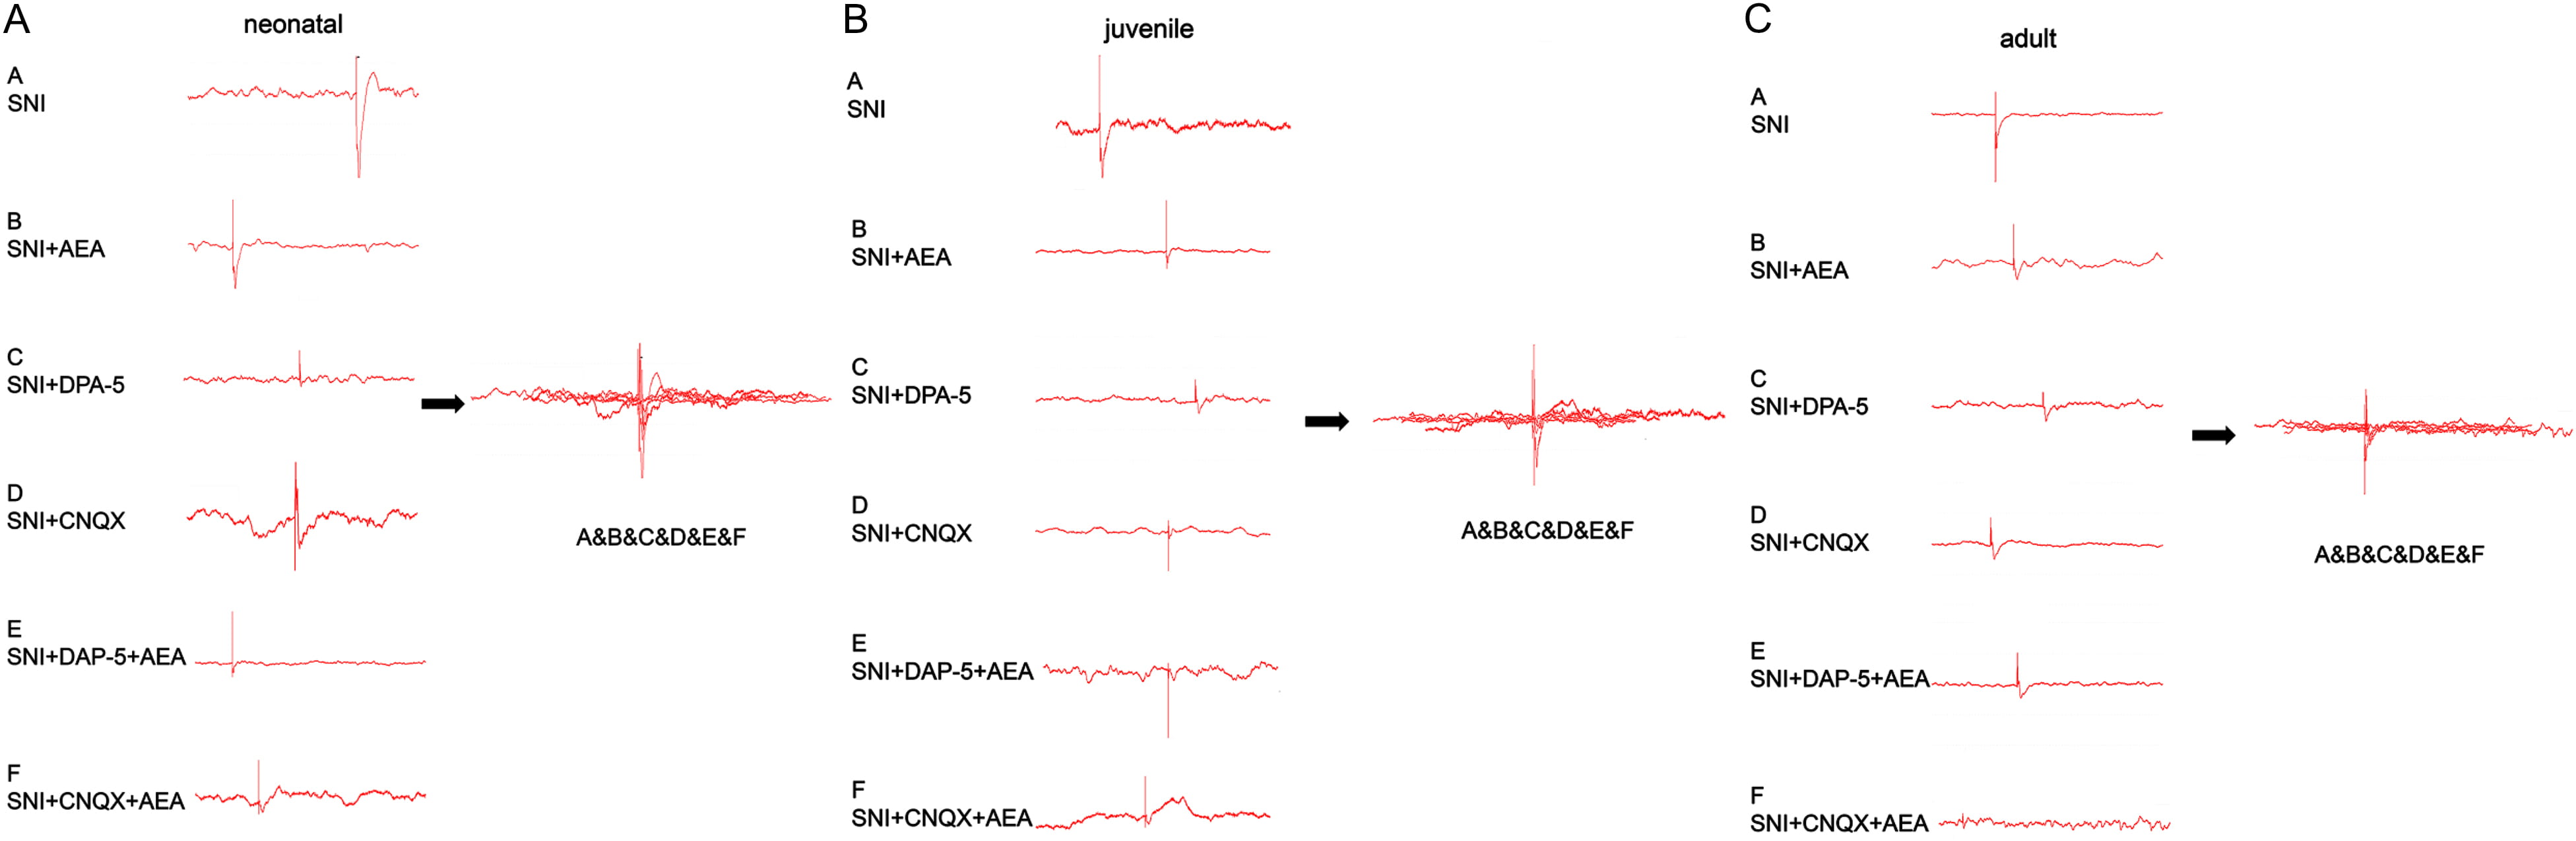 Fig. 3.
Changes in C and A fiber-evoked potentials induced by SNI in rats of different ages under various treatments. Neonatal (A), juvenile (B), and adult (C) animals were assessed under various treatments.
| A | C | |||||
| Neonatal | Juvenile | Adult | Neonatal | Juvenile | Adult | |
| Before ankylosis in the SNI group | 42.72 |
41.98 |
45.27 |
7.22 |
10.86 |
20.58 |
| After ankylosis | 92.75 |
88.57 |
86.45 |
7.85 |
28.17 |
29.84 |
| Before ankylosis in the sham SNI group | 40.64 |
41.94 |
44.76 |
7.36 |
10.43 |
19.83 |
| After ankylosis | 53.81 |
45.68 |
46.51 |
7.43 |
18.54 |
25.96 |
| Before ankylosis in the SNI + AEA group | 40.59 |
42.73 |
45.62 |
7.62 |
10.58 |
19.84 |
| After ankylosis | 58.16 |
51.58 |
54.72 |
7.91 |
18.86 |
23.27 |
| Before ankylosis in the sham SNI + AEA group | 41.29 |
42.67 |
43.32 |
7.59 |
10.32 |
20.65 |
| After ankylosis | 44.68 |
43.92 |
45.83 |
7.98 |
15.28 |
22.82 |
| Before ankylosis in the SNI + D-AP5 group | 40.73 |
40.42 |
43.57 |
7.64 |
10.81 |
20.29 |
| After ankylosis | 58.85 |
62.49 |
60.24 |
8.05 |
16.75 |
23.52 |
| Before ankylosis in the sham SNI + D-AP5 group | 41.25 |
41.06 |
43.82 |
7.29 |
10.72 |
20.58 |
| After ankylosis | 49.59 |
42.18 |
44.59 |
7.81 |
13.94 |
22.17 |
| Before ankylosis in the SNI + CNQX group | 41.83 |
42.06 |
44.28 |
7.52 |
10.89 |
20.15 |
| After ankylosis | 60.72 |
57.41 |
55.28 |
7.89 |
15.29 |
24.52 |
| Before ankylosis in the sham SNI + CNQX group | 40.75 |
41.94 |
43.36 |
7.94 |
10.68 |
20.27 |
| After ankylosis | 55.49 |
42.86 |
44.75 |
8.15 |
13.49 |
23.28 |
| Before ankylosis in the SN I + D-AP5 + AEA group | 40.58 |
41. 28 |
45.09 |
7.17 |
11.42 |
20.82 |
| After ankylosis | 44.29 |
43.46 |
57.82 |
7.98 |
12.42 |
22.49 |
| Before ankylosis in the sham SNI + D-AP 5 + AEA group | 40.72 |
42.26 |
43.25 |
7.14 |
10.1 |
13.26 |
| After ankylosis | 41.25 |
43.41 |
44.08 |
7.36 |
12.62 |
21.73 |
| Before ankylosis in the SNI CNQX + AEA group | 40.47 |
41.58 |
42.06 |
7.21 |
10.27 |
20.61 |
| After ankylosis | 45.27 |
43.18 |
43.52 |
7.39 |
10.86 |
20.89 |
| Before ankylosis in the sham SNI + CNQX + AEA group | 41.85 |
40.86 |
43.32 |
7.35 |
10.12 |
20.36 |
| After ankylosis | 43.63 |
43.27 |
44.93 |
7.42 |
10.65 |
20.82 |
| SNI and sham SNI groups: ◇, p | ||||||
H&E and immunohistochemistry staining showed eosinophils in the dorsal horn of
the spinal cord after electrical stimulation at 14 days after SNI, with bright
red, strong, and dark-brown signals. Immunohistochemistry showed that spinal cord
cells had brownish-red and dark brown signals at 14 days after SNI. On day 14,
the signals were significantly lower in the SNI + D-AP5 + AEA group of neonatal
rats compared to the SNI group (p
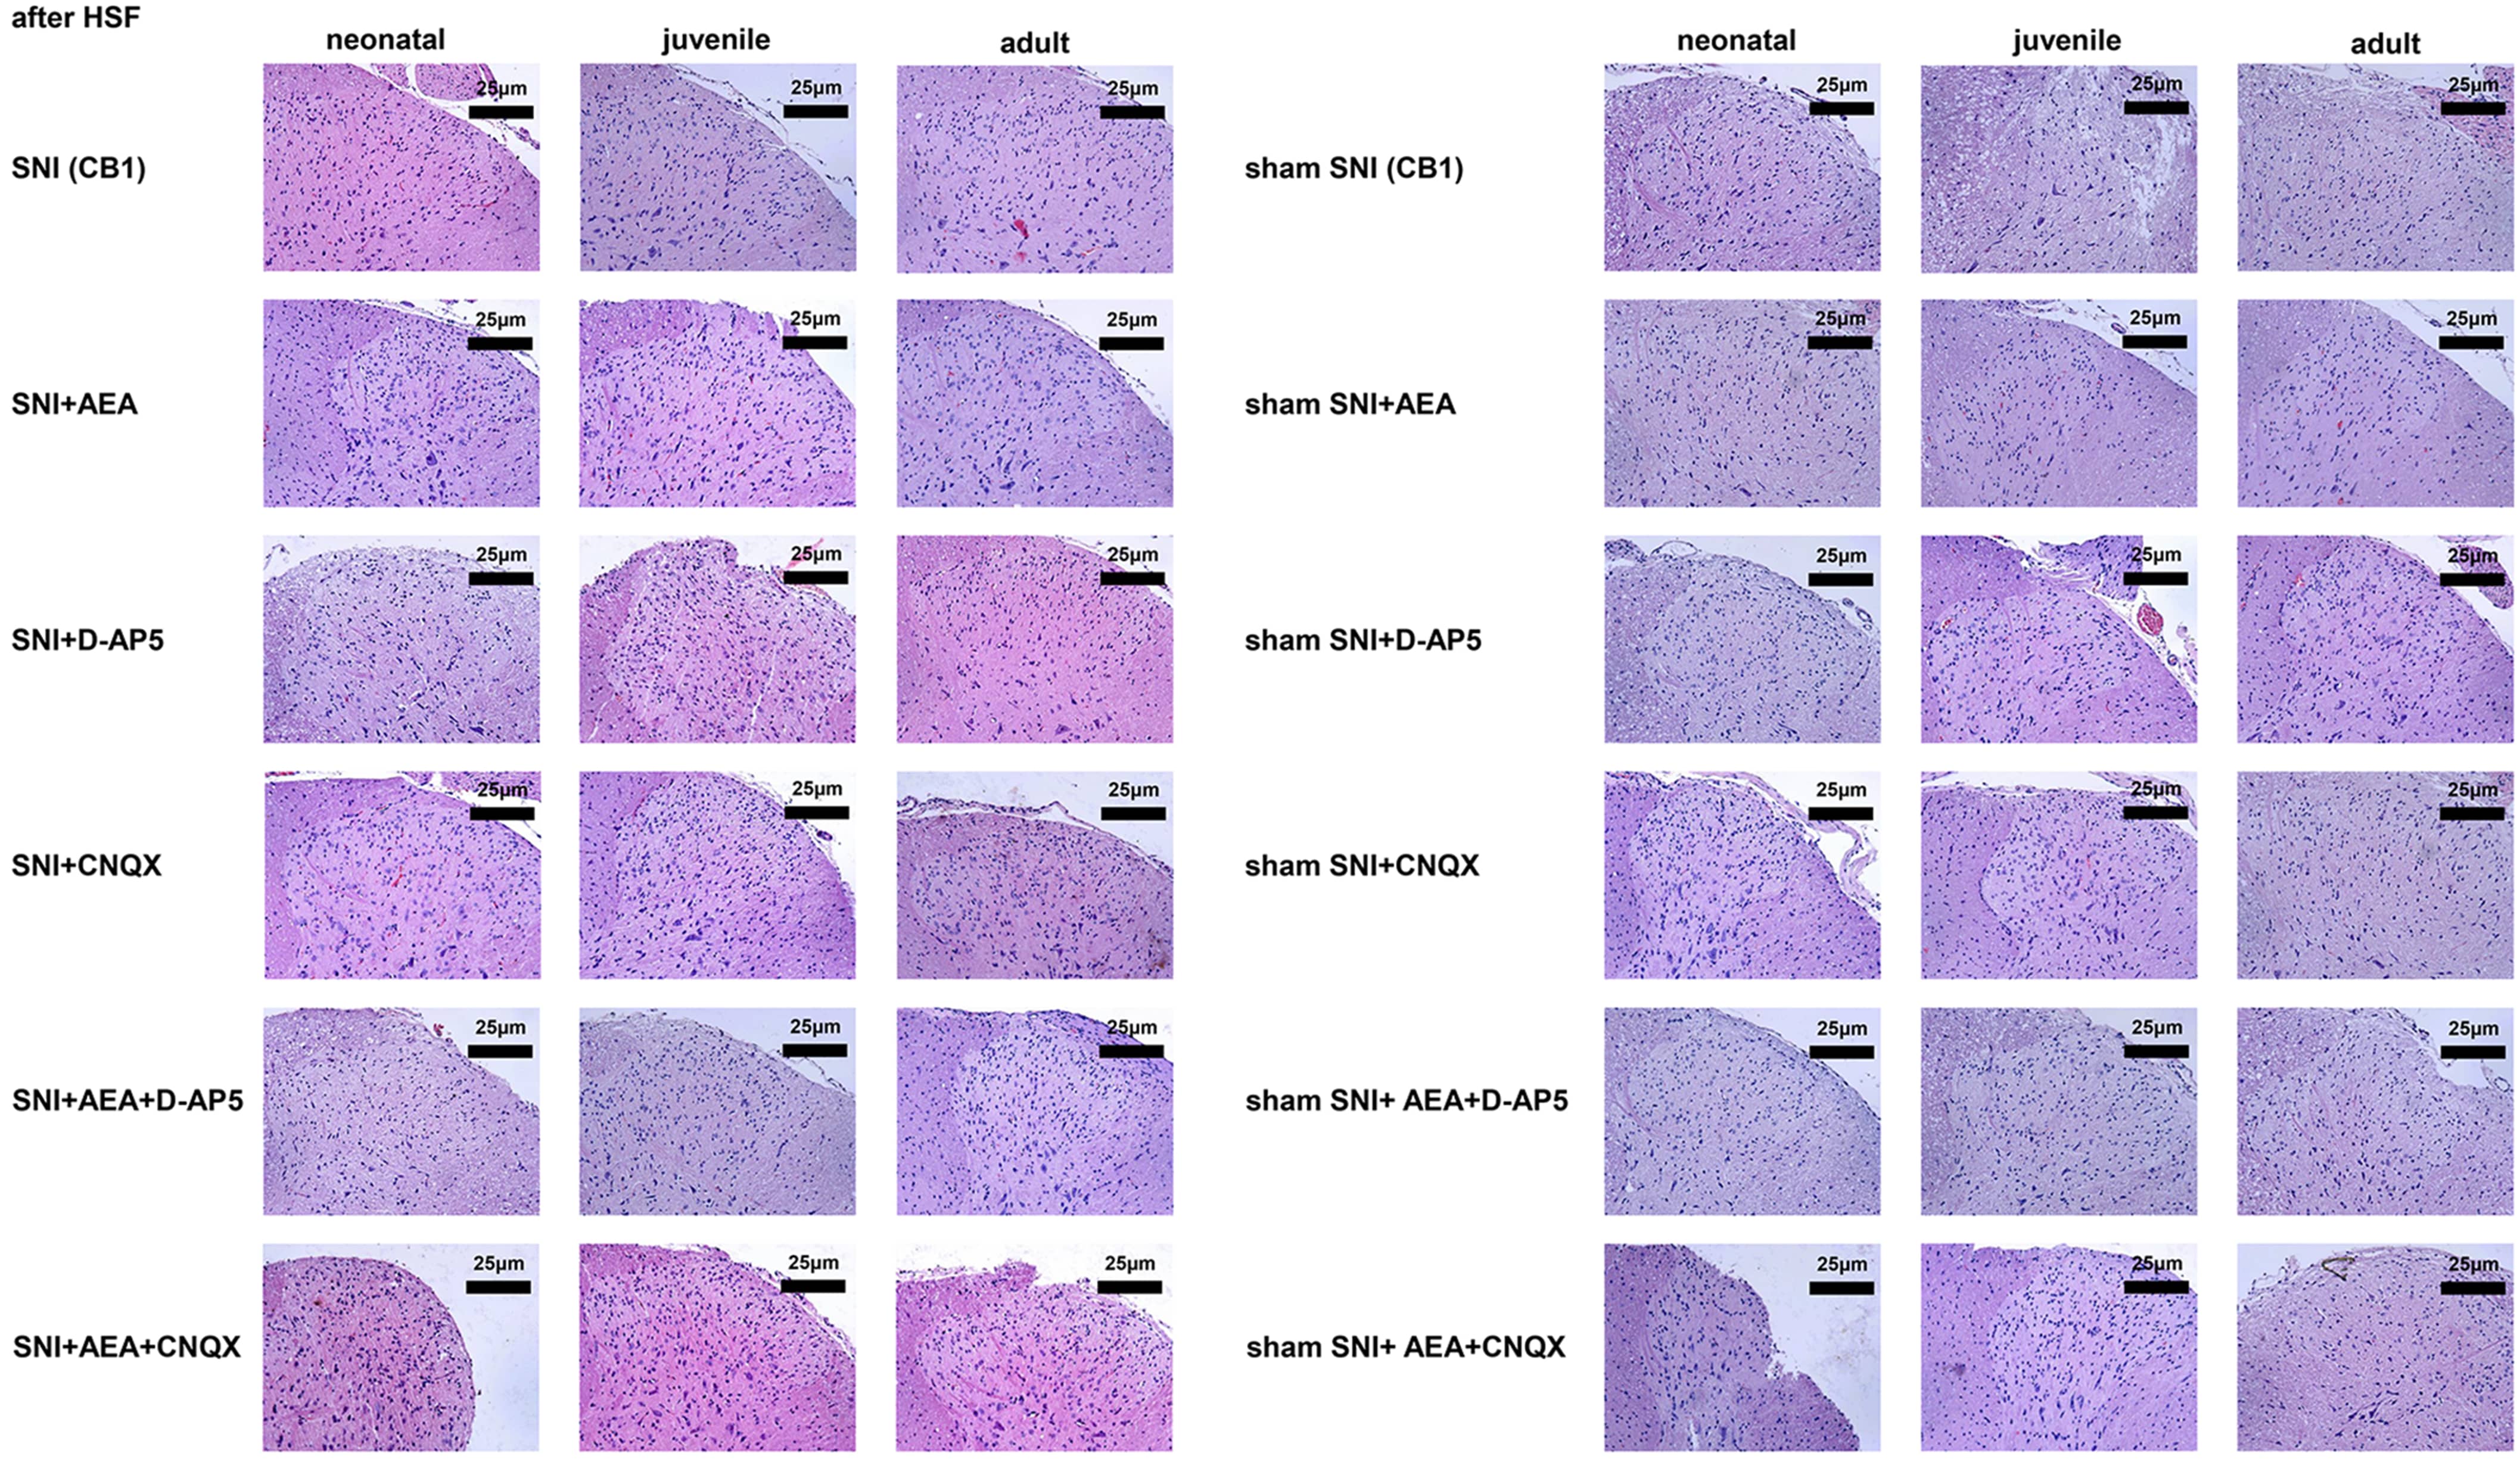 Fig. 4.
Histological analysis of samples collected before or after SNI in rats of different ages under various treatments.
The CB1 signals in the SNI groups of neonatal, juvenile, and adult rats were
bright red and dark brown and significantly higher than those of the
corresponding sham SNI groups on day 14 (p
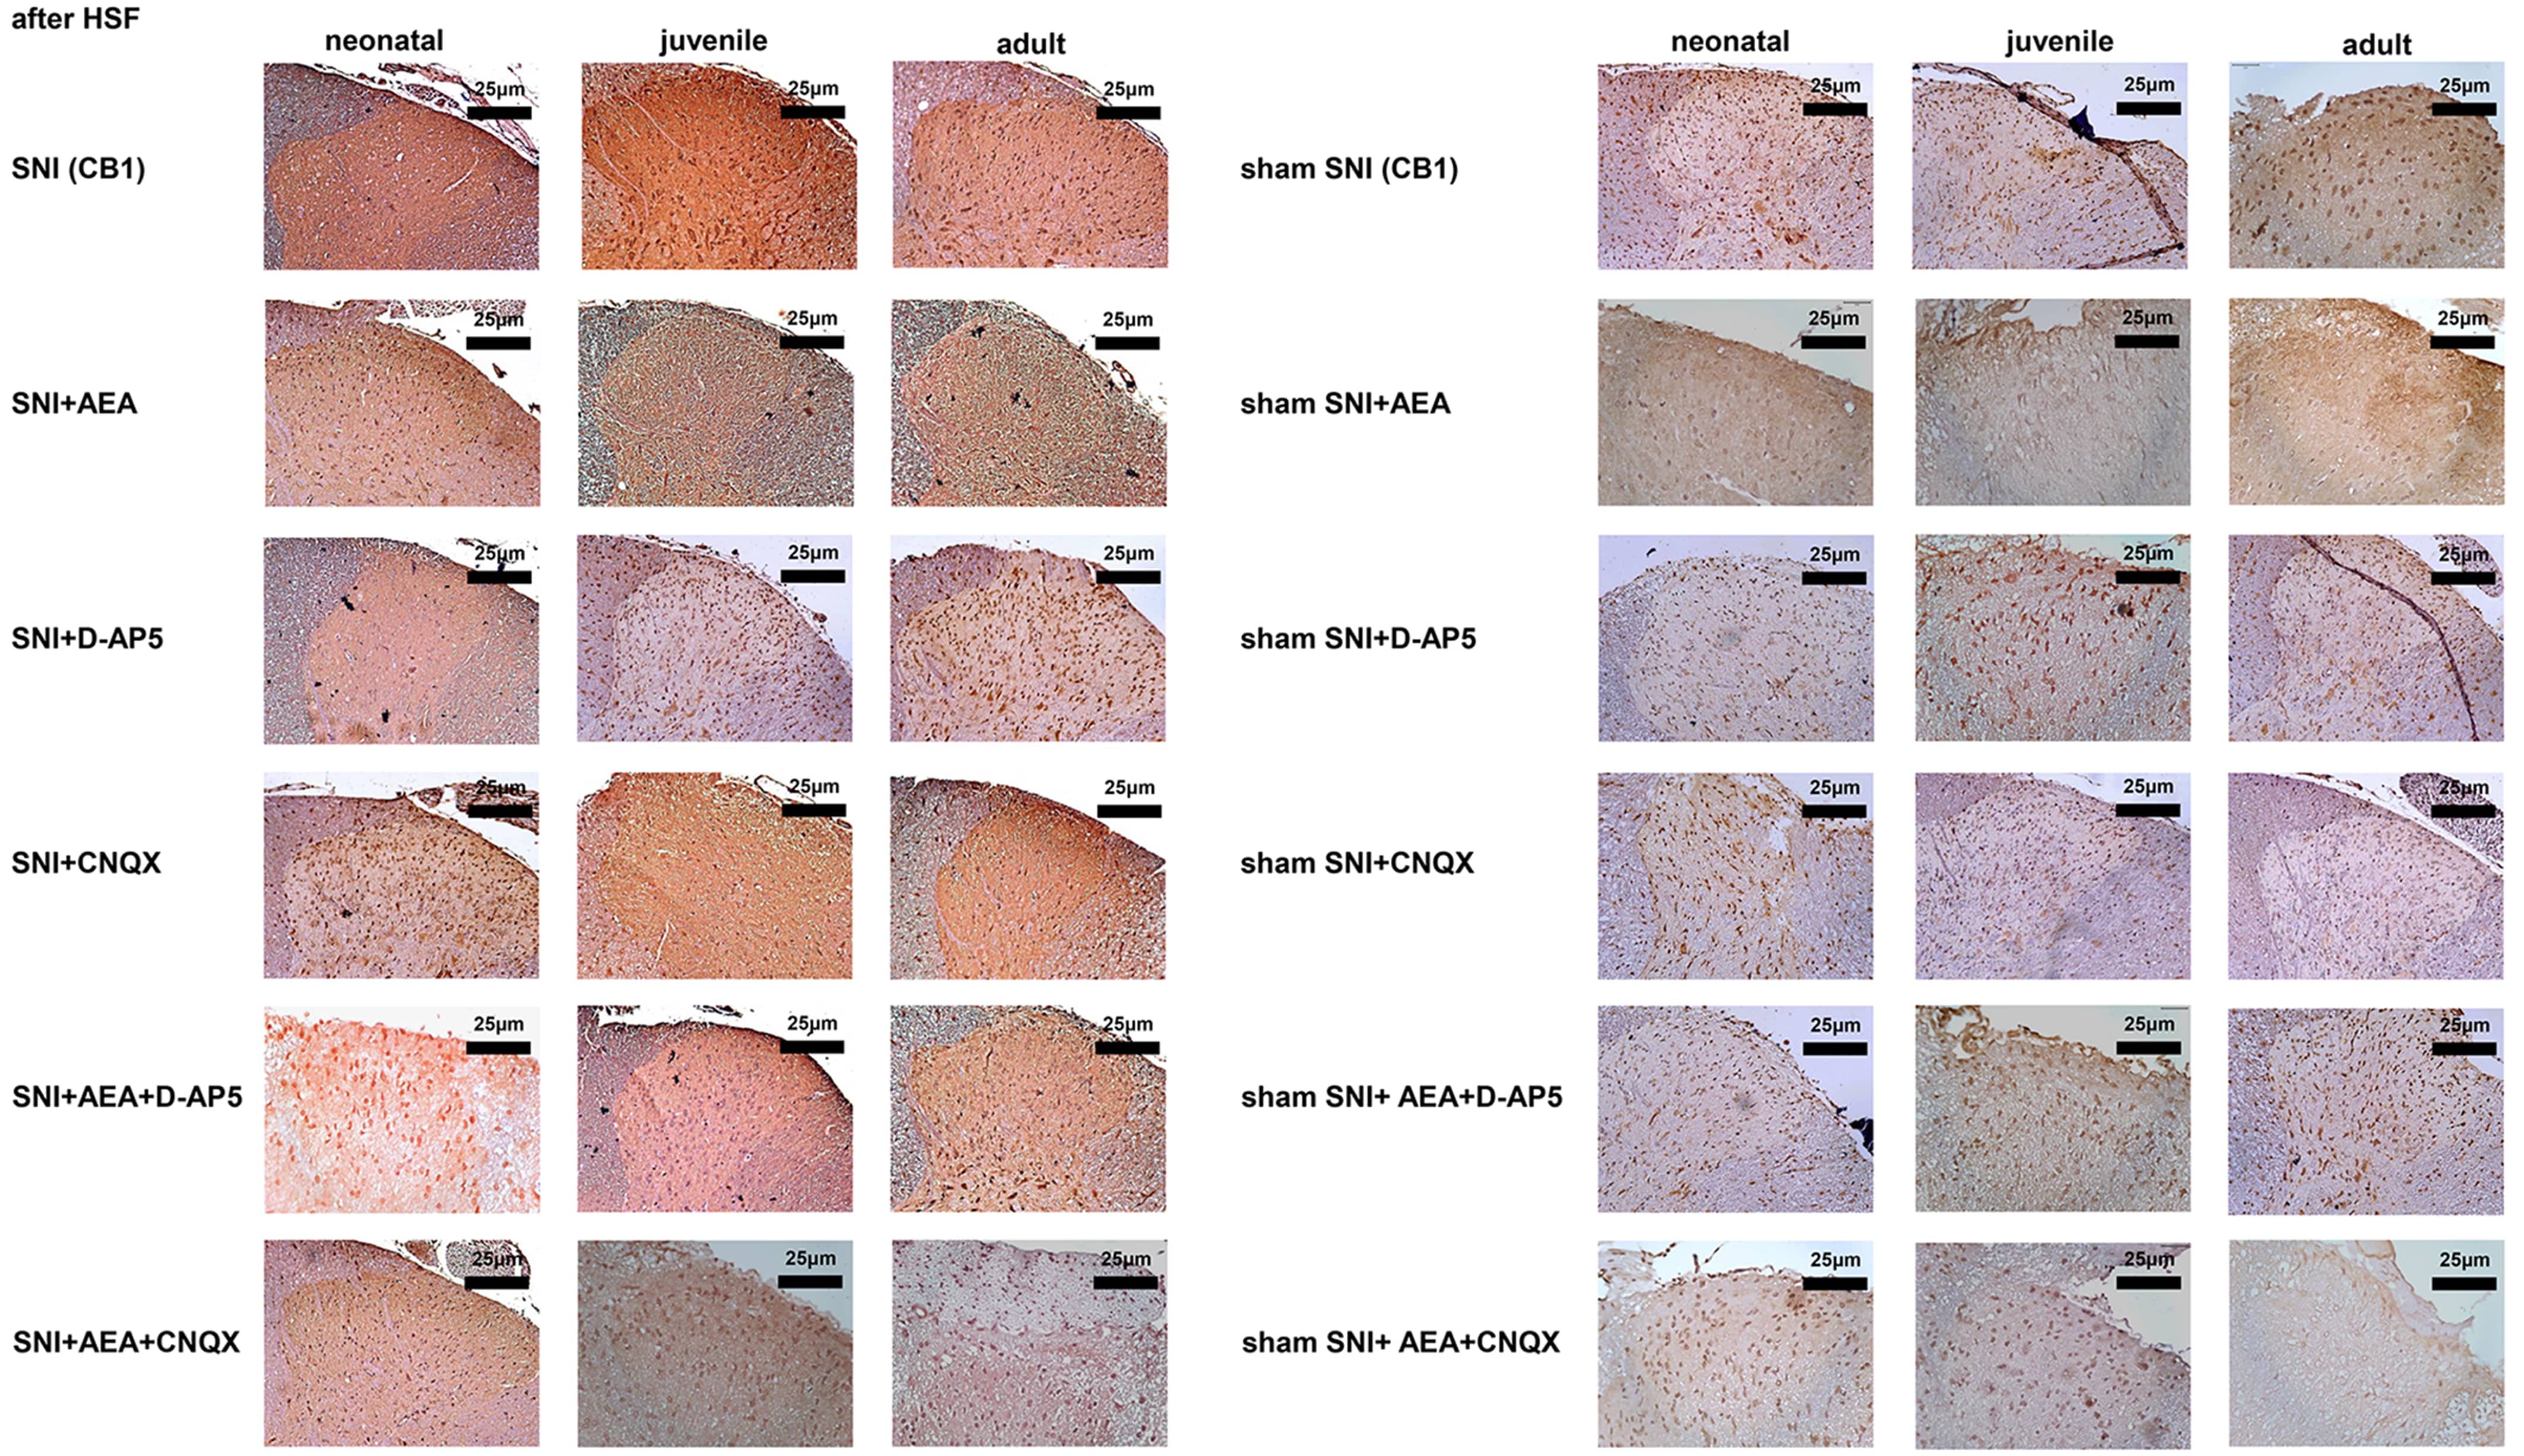 Fig. 5.
CB1 protein levels detected by immunohistochemistry in samples collected before or after SNI in rats of different ages under various treatments.
| Neonatal | Juvenile | Adult | Neonatal | Juvenile | Adult | ||
| SNI | 120.48 |
124.69 |
130.84 |
sham SNI | 102.25 |
105.24 |
108.51 |
| SNI + AEA | 149.75 |
152.54 |
159.16 |
sham SNI + AEA | 104.57 |
106.52 |
102.72 |
| SNI + D-AP5 | 144.86 |
135.28 |
138.63 |
sham SNI + D-AP5 | 106.52 |
102.79 |
101.08 |
| SNI + CNQX | 149.86 |
153.94 |
156.72 |
sham SNI + CNQX | 104.65 |
108.48 |
109.14 |
| SNI + D-AP5 + AEA | 159.85 |
151.19 |
147.24 |
sham SNI + AEA + D-AP5 | 103.53 |
101.36 |
100.29 |
| SNI + CNQX + AEA | 160.28 |
171.49 |
175.83 |
Sham SNI + AEA + CNQX | 100.73 |
102.06 |
104.86 |
| SNI group, SNI group and sham group: ◇, p | |||||||
Western blot was performed to detect the level of CB1 protein in rats after treatment with AEA, CNQX, and D-AP5 at 14 days after SNI. The changes in CB1 levels were consistent with those detecte3d by immunohistochemistry analysis (Fig. 6). The CB1 protein levels were normalized against the GAPDH density, an internal control (Table 5).
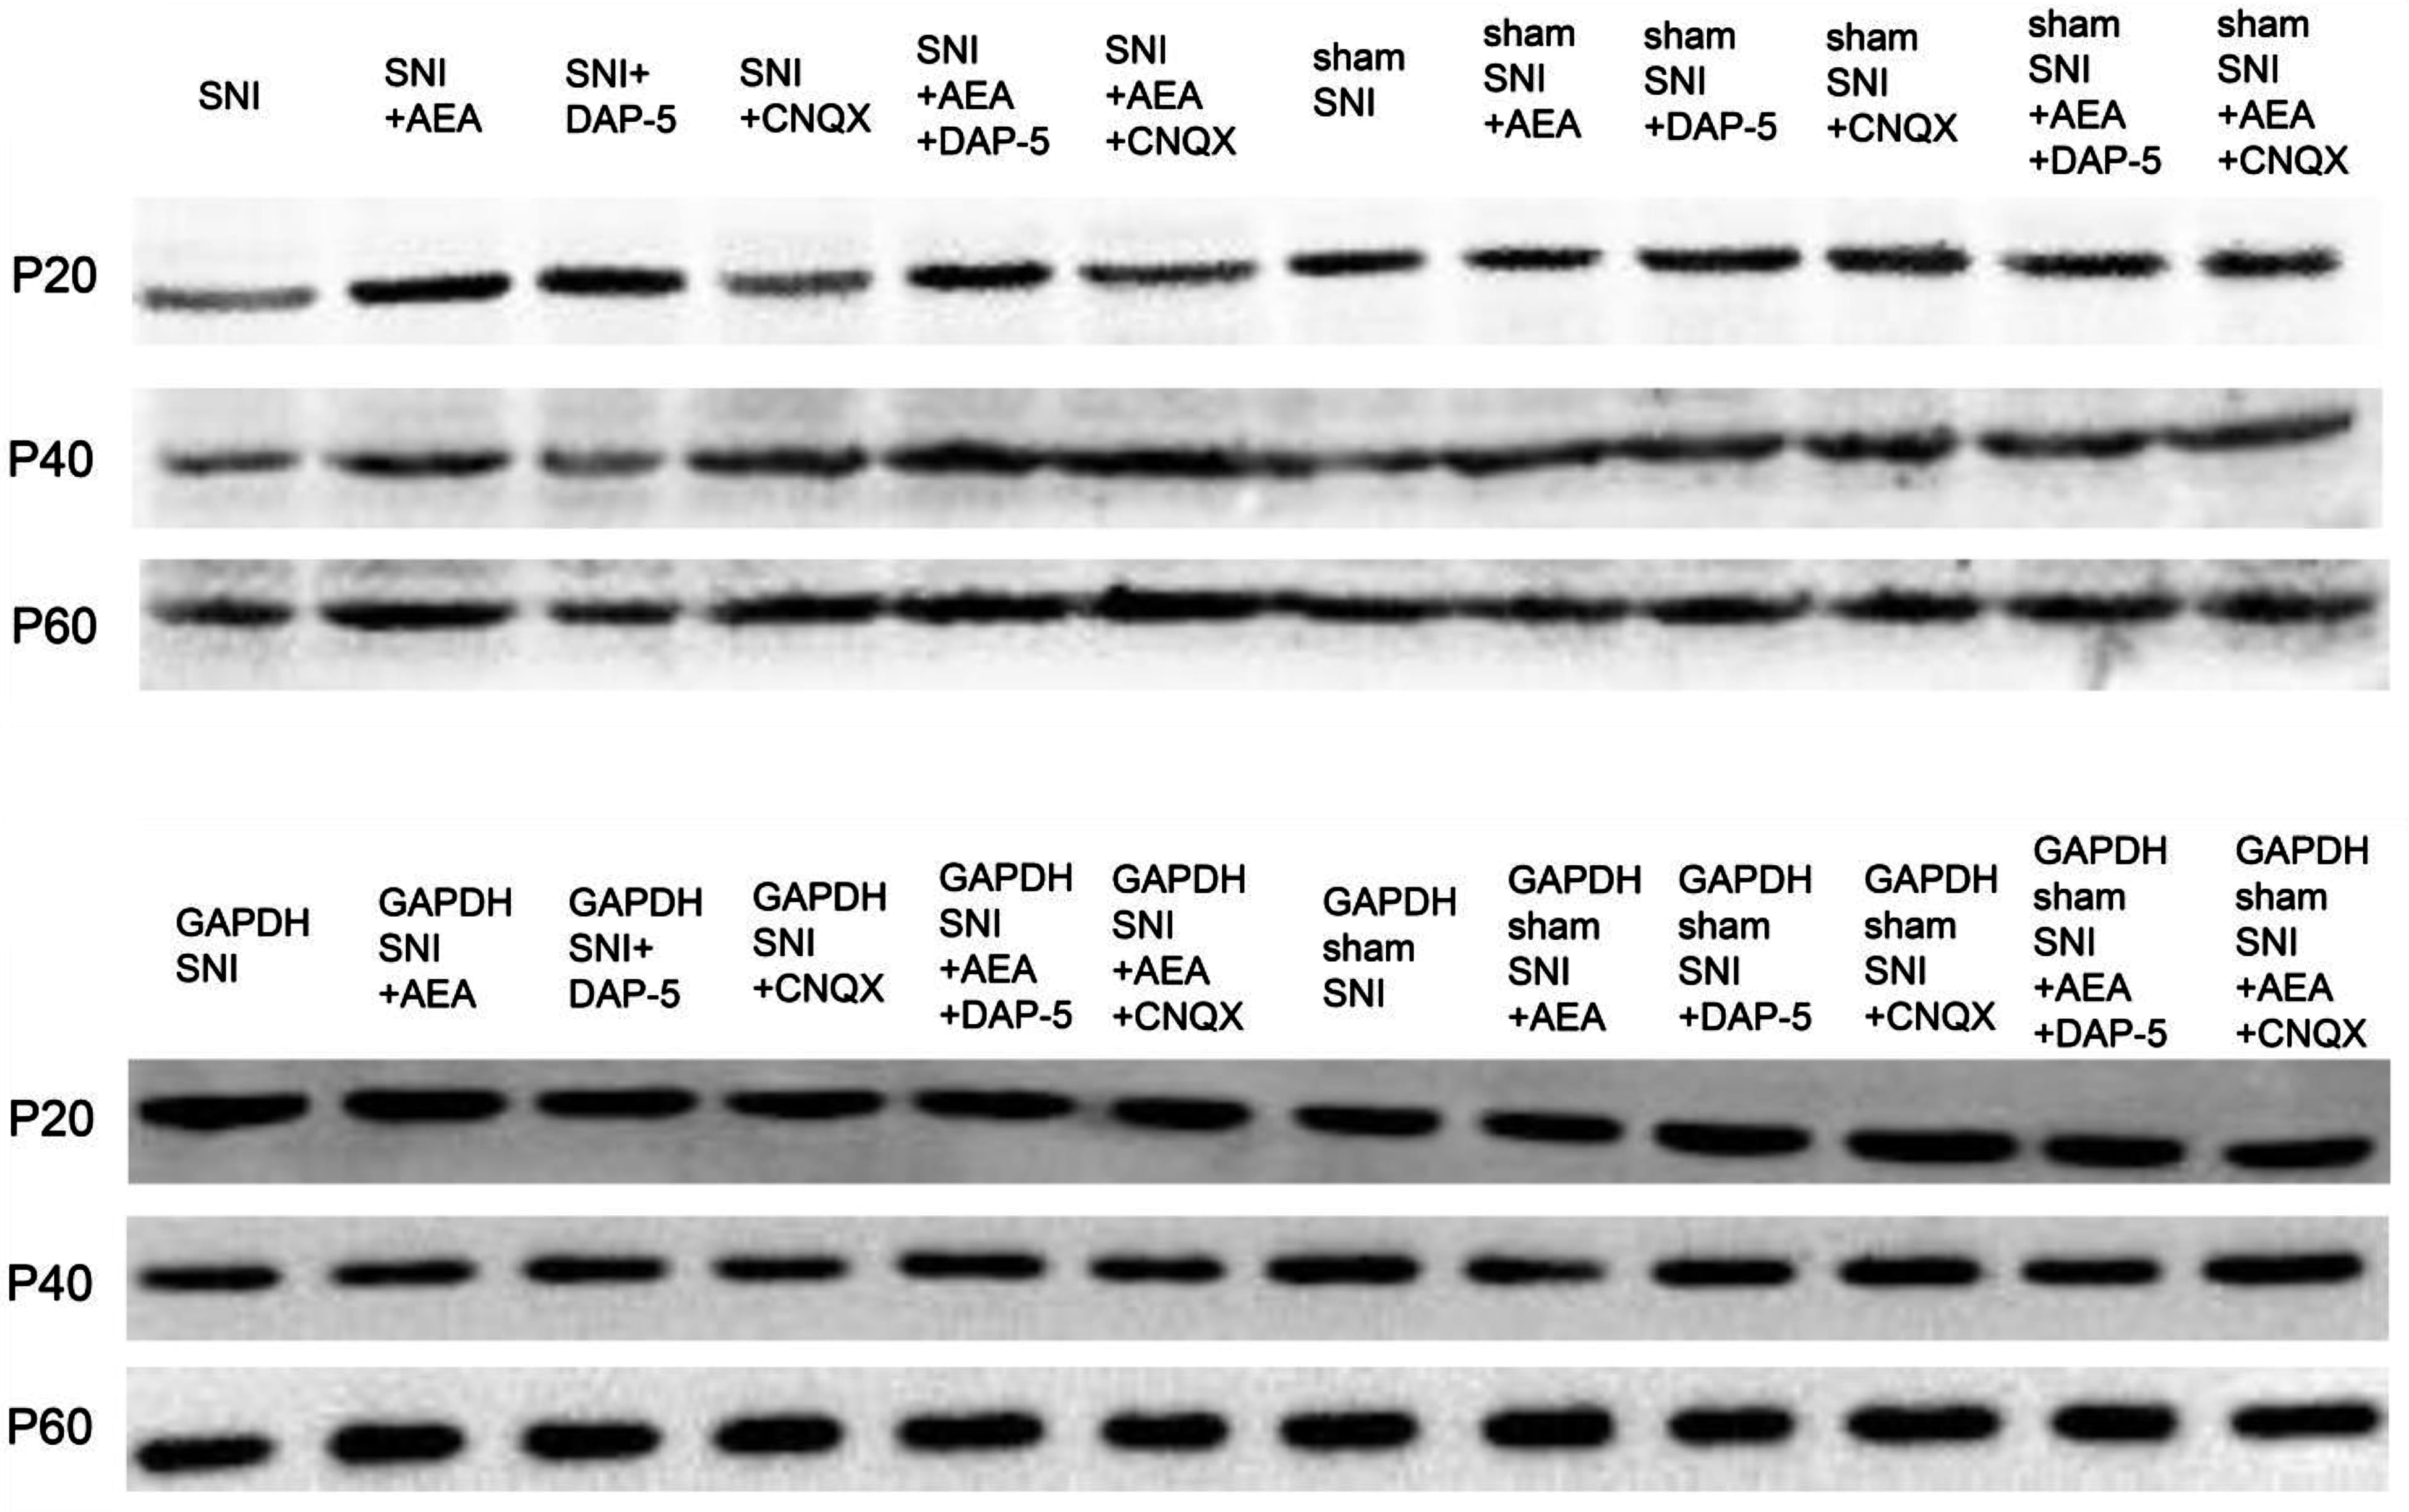 Fig. 6.
CB1 protein levels detected by Western blot in samples collected before or after SNI in rats of different ages under various treatments.
| Neonatal | Juvenile | Adult | Neonatal | Juvenile | Adult | ||
| SNI | 0.54 |
0.59 |
0.67 |
sham SNI | 0.62 |
0.60 |
0.61 |
| SNI + AEA | 0.98 |
1.32 |
1.50 |
sham SNI + AEA | 0.61 |
0.65 |
0.68 |
| SNI + D-AP5 | 0.84 |
0.42 |
0.62 |
sham SNI + D-AP5 | 0.62 |
0.61 |
0.63 |
| SNI + CNQX | 0.78 |
1.03 |
1.35 |
sham SNI + CNQX | 0.64 |
0.62 |
0.64 |
| SNI + D-AP5 + AEA | 1.25 |
0.99 |
0.94 |
sham SNI + D-AP5 + AEA | 0.69 |
0.64 |
0.62 |
| SNI + CNQX + AEA | 0.89 |
2.06 |
2.92 |
sham SNI + CNQX + AEA + | 0.63 |
0.66 |
0.68 |
| SNI group, SNI group and sham group: ◇, p | |||||||
The present study showed that activated CB1 receptors in neonatal rats produce analgesic effects, mainly through NMDA receptors giving rise to the inhibitory activity of FPs. In juvenile and adult rats, this effect was produced through NMDA and AMPA receptors, respectively.
The endogenous cannabinoid system controls the activity of NMDA receptor [16], and CB1 activation produces lasting functional changes in glutamic acid metabolism. The discovery of the endogenous cannabinoid AEA [17] also confirmed the existence of an endogenous cannabinoid system in the body. Subsequently, two endogenous cannabinoid receptors, CB1 and CB2, were cloned; both are G-protein coupled receptors (GPRs). Cannabinoid-derived CB1 receptors are one of the leading targets in the treatment of chronic pain, and the antinociceptive effects of endogenous and exogenous cannabinoids effectuate via CB1 receptors and are widely present in the central and peripheral nervous systems. The immunostaining of CB1 in the dorsal horn of the spinal cord revealed that the receptors are expressed on the internal axons of spinal neurons and that the main sites of antinociceptive action are the A and C fibers of the dorsal horn of the spinal cord. The endogenous ligand concentrations of cannabinoid receptors at 1 mM inhibited mEPSCs, and cannabinoid-activated receptors reduced the synaptic activity.
Endogenous cannabinoid signals are key regulators of synaptic transmission in the brain. AEA is a partial agonist of CB1 and CB2 receptors [18] and a seven-time transmembrane Gi/o type GPR. The inhibitory effect of AEA on mEPSCs could be blocked completely by the selective CB1 receptor antagonist SR141716A; therefore, endogenous cannabinoids maintain the inhibitory effects in the developing spinal cord [19]. The present study provided evidence that cannabinoids mediate presynaptic inhibition of excitatory synapses and nociceptive input in the superficial dorsal layer of the spinal cord, which might be one of the mechanisms of analgesia. CB1 receptor in the central nervous system is activated and other cannabinoid-like effects are produced or the degradation of the endogenous cannabinoid system is inhibited. Therefore, activated CB1 receptors inhibit the development of spinal cord plasticity (FPs) by regulating the content of NMDA in neonatal and juvenile rats.
D-AP5 is a specific inhibitor of NMDA receptor. The primary characteristics of
D-AP5 in adult rats are rapid desensitization of agonists and a long-term
inactivation phase. However, the NMDA receptors have less activated and weakened
AMPA receptor activation stages in neonatal and juvenile rats than in adult rats,
which might be related to the developmental process of rats [20]. The excitatory
amino acids participate in complex physiological processes and synaptic
plasticity changes of the central nervous system through NMDA and AMPA receptors,
including the induction and maintenance of LTP. The NMDA receptor activation
induces LTP [21], which in turn enhances the excitatory postsynaptic potential.
Thus, it could be speculated that ion channels, including AMPA and NMDA receptor
channels, mediating this potential should be modified chemically. Only then the
receptor conductivity could be changed, enhancing the postsynaptic potential.
During LTP induction in adult rats, the sensitivity of NMDA and AMPA receptors to
glutamic acid increases rapidly [22], which could be related to the
phosphorylation at tryptophan, threonine, and tyrosine residues in the receptors.
Several protein kinases can phosphorylate the receptors; for example, PKC
phosphorylates both NMDA and AMPA receptors. The increased sensitivity of NMDA
and AMPA receptors is also related to synaptic structure changes [23]; Ca
In this study, neuropathic pain models at different ages were studied. PWT, LTP, and CB1 immunohistochemistry and Western blot signals were stronger in juvenile rats than in neonatal and adult animals; also, the stress and pain were controlled by NMDA receptor blockers in neonatal and juvenile rats. Nonetheless, the current study only analyzed the above parameters from a performance perspective but no positive or negative controls in terms of chemical compounds. Such deficiencies would be avoided and improved in the future studies, and additional experiments are required to determine all the differences.
CB1 receptor activation in neonatal rats produced analgesic effects through NMDA receptor to realize FP inhibitory effects. Conversely, in juvenile and adult animals, FPs were mainly inhibited through the activation of NMDA and AMPA receptors. Nonetheless, the receptor ratio was altered during development.
FP, field potential; GPR, G protein coupled receptor; LTD, long-term depression;
LTP, long-term potentiation; OD, optical density; PWT, paw withdrawal threshold;
SNI, spinal nerve preservation injury; AEA, Anandamide; TRPV1, transient receptor
potential cation channel, subfamily V, member 1; NMDA, N-methyl-D-aspartate;
AMPA,
JC—Experiment operation, Manuscript writing and Editing; XC—Experiment operation and Data collation; HX, FK, LW—Data collation; LZ—Supervise; JW—Experimental operation and Review. All authors have read and agreed to the published version of the manuscript.
The animals were purchased from Unilever in Beijing, and the experiments were conducted at the Laboratory A III of Center for Animal Experiment of Wuhan University (Approval Number: 2019073).
Not applicable.
This work was supported by the Hubei Provincial Health and Family Planning Commission (grant number WJ2019F008).
The authors declare no conflict of interest.
References
Publisher’s Note: IMR Press stays neutral with regard to jurisdictional claims in published maps and institutional affiliations.