


 , Yuko Gohto 1, Takeshi Murakoshi 2, Hiroko Konno 2, Ayako Miura 3, Miho Nozue 3, Ryo Asaoka 1
1 Department of Ophthalmology, Seirei Hamamatsu General Hospital, 430-8558 Hamamatsu, Shizuoka, Japan
2 Department of Obstetrics and Perinatology, Seirei Hamamatsu General Hospital, 430-8558 Hamamatsu, Shizuoka, Japan
3 Department of Health and Nutritional Sciences, Tokoha University, 431-2102 Hamamatsu, Shizuoka, Japan
Abstract
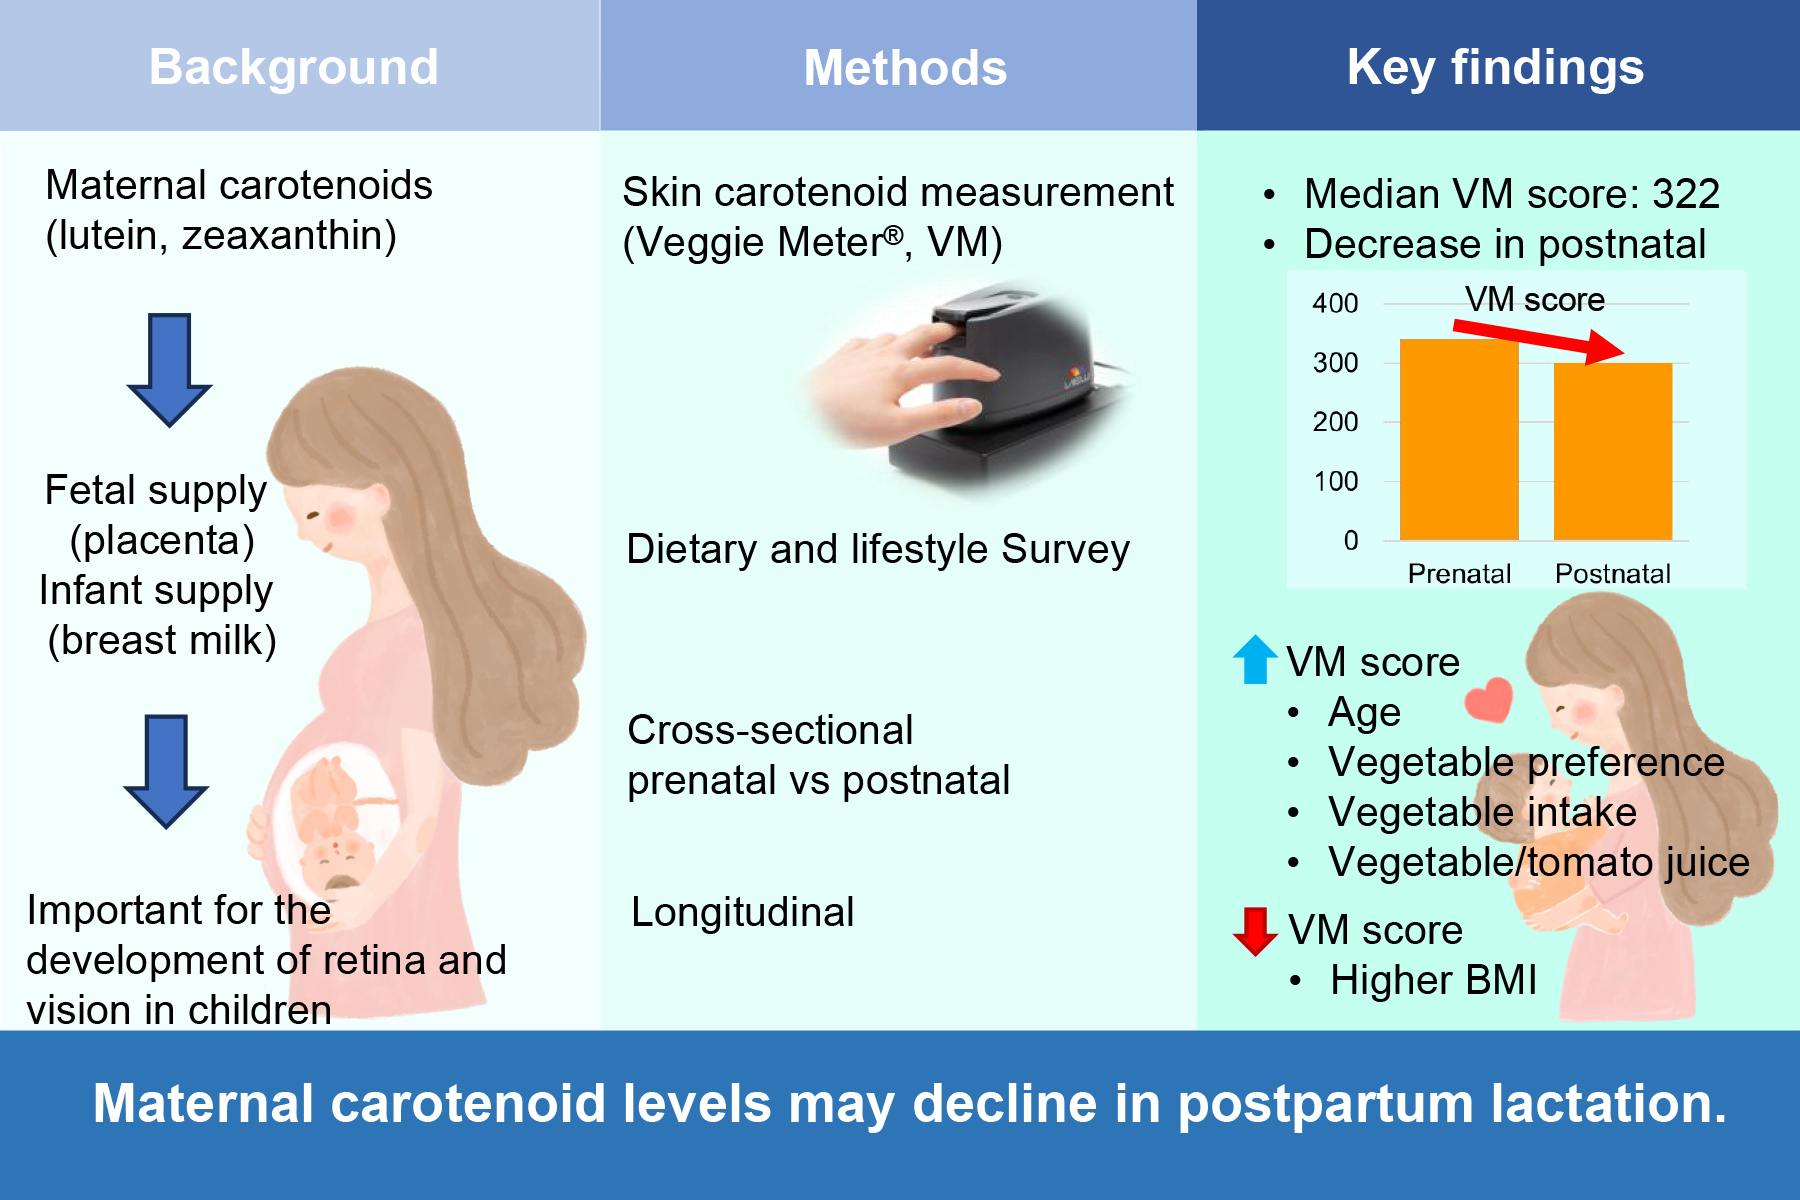
Lutein and zeaxanthin are critical for retinal development in children. Fetuses receive these carotenoids via the umbilical cord, and infants are supplied through breast milk. Therefore, maternal nutritional status may influence retinal development in children. Since studies on carotenoids in Japanese mothers are limited, this study aimed to investigate carotenoid levels in pregnant Japanese women as a first step toward advancing research on retinal development.
Skin carotenoid (SC) levels were measured cross-sectionally in 284 prenatal and 40 postnatal women, and longitudinally in eight women from early, mid, and late pregnancy to one month postpartum using a Veggie Meter (VM). A habitual dietary and lifestyle survey was also conducted.
The median VM score for the 324 women was 322. Gestational age was not correlated with VM scores, whereas postpartum days were negatively correlated with VM scores (Spearman ρ = –0.339; p = 0.032). VM scores did not differ between singleton and multiple pregnancies or between normal and complicated pregnancies. In the multivariate analysis, age (p = 0.009), frequency of vegetable or tomato juice intake (p = 0.005), preference for vegetables (p < 0.001), and number of daily vegetable servings (p = 0.002) were positively associated with VM scores. In contrast, body mass index (BMI) was negatively associated (p < 0.001). In the univariate analysis, postpartum VM scores were significantly lower than prenatal scores (p = 0.018); however, in the multivariate analysis, the effect of delivery was only marginally significant (p = 0.0598). In longitudinal observations, VM scores appeared to decrease over time, although not to a statistically significant level.
SC levels in pregnant and postpartum Japanese women were investigated, and a potential concern was identified: maternal carotenoid levels might decline during postpartum lactation. However, further studies are required to clarify this issue.
Graphical Abstract
Keywords
- skin carotenoid levels
- Veggie Meter
- pregnant women
- postpartum women
- Japanese
Carotenoids have antioxidant and anti-inflammatory properties and play an important role in maintaining health, slowing aging, and preventing various diseases such as cancer, cardiovascular disease, diabetes, and eye diseases [1, 2]. Among the approximately 20 carotenoids in the human body, lutein (L, (3R, 3′R, 6′R) -lutein) and two isomers of zeaxanthin (Z, (3R, 3′R) -zeaxanthin and (3R, 3′S; meso) -zeaxanthin) are essential for the eyes. L and Z in the retina are mostly located in the inner retinal layers as macular pigments (MP) [3, 4], with smaller amounts present in the outer photoreceptor segments and retinal pigment epithelium [5]. The fovea contained more Z, whereas more L was present in peripheral regions [6]. MP improves visual performance as contrast sensitivity and reduces glare disability by absorbing blue light scattering within the retina [7]. In addition, MP acts as a filter against harmful blue light by absorbing it before it reaches the photoreceptor cells, and L, Z quenches singlet oxygen generated by blue light exposure in the photoreceptors, thereby protecting photoreceptors from excessive blue light exposure. In adults, these functions are crucial for preventing age-related macular degeneration (AMD), which is a leading cause of vision loss in elderly individuals. Indeed, L and Z containing supplements has been shown to increase macular pigment optical density (MPOD) in healthy individuals [8] and in patients with early and intermediate AMD [9], and to reduce the incidence of late AMD [10].
However, an increasing number of studies have suggested that L and Z are important for the development of the retina and visual function in children, although the exact mechanisms through which MP contributes to the development of visual function remain unclear [11]. In our previous study [12], MPOD of 0.05 was obtained at 33 weeks and two days of post-menstrual age (PMA) for the earliest time at which MPOD could be detected, and MPOD increased linearly with age and reached 0.1 at PMA of 40 weeks, which was consistent with the results measured by Bernstein et al. [13] in infants. Based on these studies, the MP appears around a PMA of 26 weeks, when a shallow pit begins to form in the fovea during eye development and increases with growth. MPOD in infants is affected by the maternal intake of L and Z, particularly plasma Z concentrations [14]. Clinical trials in which pregnant women received L and Z supplements have reported that although no statistically significant differences were observed, infants in the supplementation group tended to have slightly higher MPOD than those in the non-supplemented group, and their retinal maturity on optical coherence tomography appeared to be somewhat better [15]. In animal studies, monkeys raised on L- and Z-free diets showed impaired development of the retinal pigment epithelium and foveal structure. Clinically, maternal L and Z plasma concentrations influenced the visual acuity of offspring at three years of age [16]. Studies examining maternal carotenoid intake in diet, maternal plasma carotenoid concentrations, infants’ MPOD, plasma carotenoid levels, and visual function are important from the perspective of retinal development in children; however, such studies have not yet been conducted in the Japanese population. Our goal was to determine how much L and Z pregnant and lactating Japanese women should take from the diet, or whether supplementation with L and Z is preferable. As a preliminary step, we examined carotenoid levels in pregnant and postpartum Japanese women before conducting subsequent investigations on carotenoids and vision.
This study comprised two sessions: cross-sectional observation and longitudinal observation.
Participants were recruited from among patients attending the Department of Obstetrics and Perinatology Outpatient Clinic at Seirei Hamamatsu Hospital. The attending physicians explained the outline of the study, and those who expressed their willingness to participate were enrolled. No restrictions were placed on the pregnancy or postpartum status. After completing the dietary habit questionnaire, the participants underwent skin carotenoid (SC) measurements. The measurement results were communicated to the participants; however, no dietary counseling or interventions to modify eating habits were provided.
Pregnancy was diagnosed at the Department of Obstetrics and Perinatology outpatient clinic of Seirei Hamamatsu Hospital; physicians explained the outline of this study, and those who expressed a willingness to participate were enrolled. After completing the dietary habit questionnaire, the participants underwent SC measurements. Measurements were performed on four occasions: at the time of pregnancy diagnosis (up to approximately 20 weeks of gestation), during mid-pregnancy (approximately 30 weeks of gestation), immediately before delivery (36–41 weeks of gestation), and at the 1-month postpartum check-up. The second dietary habits questionnaire was administered on the final day of measurement. The measurement results were communicated to the participants; however, no dietary counseling or interventions to alter eating habits were provided. The participants were also informed that they could withdraw their consent at any time.
SC levels were measured by Veggie Meter® (VM) (version 1.0,
serial number 415W0156-1, or version 2.0, serial number 618W0091, Longevity Link
Corporation, Salt Lake City, Utah). The VM scores ranged from 0 to 1200
(arbitrary units). All the participants received a detailed explanation of the
study and underwent measurements after providing written informed consent.
Calibration was conducted using manufacturer-provided reference materials before
the measurements. All the participants washed their hands with soap and
disinfected their fingers with disinfectant. The researcher assessed the hands of
the participants to determine the absence of contamination. The participants then
inserted the ring finger of the nondominant hand into the device’s finger cradle
and pushed the tip against the convex contact lens surface with the aid of a
spring-loaded lid. The modest pressure applied to the fingertip reduced the blood
perfusion of the measured tissue volume, preventing the strongly absorbed blood
from interfering with the SC-level measurements. VM scores were determined as the
average of three consecutive measurements. The obtained VM scores were converted
to values using the standard VM (version 1.0). using the regression equation as
follows: correction value = 1.0681
The participants completed the survey based on their own considerations. The
contents of the form are as follows: Q1, Are you aware of the importance of
vegetables? (1, Not aware; 2, Somewhat aware; 3, Fully aware); and Q2, Do you
like vegetables? (1, No; 2, Neither yes nor no, 3; Yes); Q3, How many vegetables
did you eat daily during the four weeks? Answer: Number of dishes. One dish
contained 70 g of vegetables. (1,
Normality was assessed using the Kolmogorov-Smirnov test. Because the SC values did not show a normal distribution, non-parametric analyses were used for subsequent analyses. Differences between two groups were assessed using the Mann-Whitney U test, and those among more than three groups were assessed using the Kruskal–Wallis test. Multiple comparisons were performed using the Bonferroni method. We explored the factors associated with Veggie Score using multivariate analysis. Seventeen variables of age, body mass index (BMI), singleton or multiple pregnancies, interval from conception to measurement, and the 13 items of the dietary and life habits survey were reduced to ten using LASSO regression, and an exhaustive-search multivariate analysis was then performed with ten variables. It is widely acknowledged that ordinal statistical models, such as ordinary least squares linear regression, would be over-fitted to the original sample, especially when the number of predictor variables is large, such as in the current training dataset. Tibshirani [18] previously applied a shrinkage method to regularize the sum of the absolute values of the regression coefficients to mitigate these issues in linear/logistic modeling. This LASSO regression method has been used in studies of human perception, genetic, and ophthalmological analyses. The penalized log-likelihood function to be maximized was estimated using the following formula:
Where xi is the i-th row of a matrix of n observations with p predictors,
Three hundred and twenty-four women, 284 prenatal and 40 postnatal, participated in the study. Their ages ranged from 16 to 44 years, and the mean age (standard deviation, SD) was 32.6 (4.5). BMI ranged from 15.3 to 39.8, and the mean was 23.2 (4.0). There were 308 singleton pregnancies and 16 multiple pregnancies. The demographic characteristics are shown in Table 1. The VM scores are listed in Table 2.
| Age range, mean (SD), years | BMI range, mean (SD) | Number of singleton/multiple pregnancies | Number of normal/abnormal pregnancies | |
| All (324) | 16–44, 32.6 (4.5) | 15.3–39.8, 23.2 (4.0) | 308/16 | 302/22 |
| Prenatal (284) | 16–44, 32.6 (4.6) | 15.3–36.7, 23.1 (4.0) | 271/13 | 266/18 |
| Postnatal (40) | 25–41, 32.3 (3.9) | 17.2–39.8, 23.8 (4.1) | 37/3 | 36/4 |
SD, standard deviation; BMI, body mass index.
| No. of participants | Range | Median | Mean (Standard deviation) | p-value | |
| All participants | 324 | 99–677 | 322 | 335.2 (104.9) | |
| Prenatal | 284 | 99–677 | 325 | 340.3 (106.1) | 0.018# |
| Postnatal | 40 | 146–514 | 281 | 299.2 (89.4) | |
| Singleton | 308 | 99–677 | 320.5 | 333.4 (103.6) | 0.258# |
| Multiple pregnancies | 16 | 146–569 | 362 | 368.8 (126.8) | |
| Normal pregnancy | 302 | 99–677 | 323.5 | 337.0 (105.8) | 0.376 |
| Abnormal pregnancy | 22 | 149–514 | 304.5 | 309.7 (91.1) |
#Mann-Whitney U test.
The mean (SD) VM score of all participants was 335.2 (104.9) and the median was
322. The VM scores of the postnatal women were significantly lower than those of
the prenatal women (p = 0.018), with a mean difference of 41.0 (95%
confidence interval [CI], 6.4–75.7). There were no significant differences
between singleton and multiple pregnancies (p = 0.258) or between normal
and abnormal pregnancies (p = 0.376). Abnormal pregnancy included four
cases of miscarriage, 10 cases of preterm birth, and eight cases of fetal growth
restriction (FGR), which resulted in preterm birth. VM scores weakly correlated
with age (Spearman
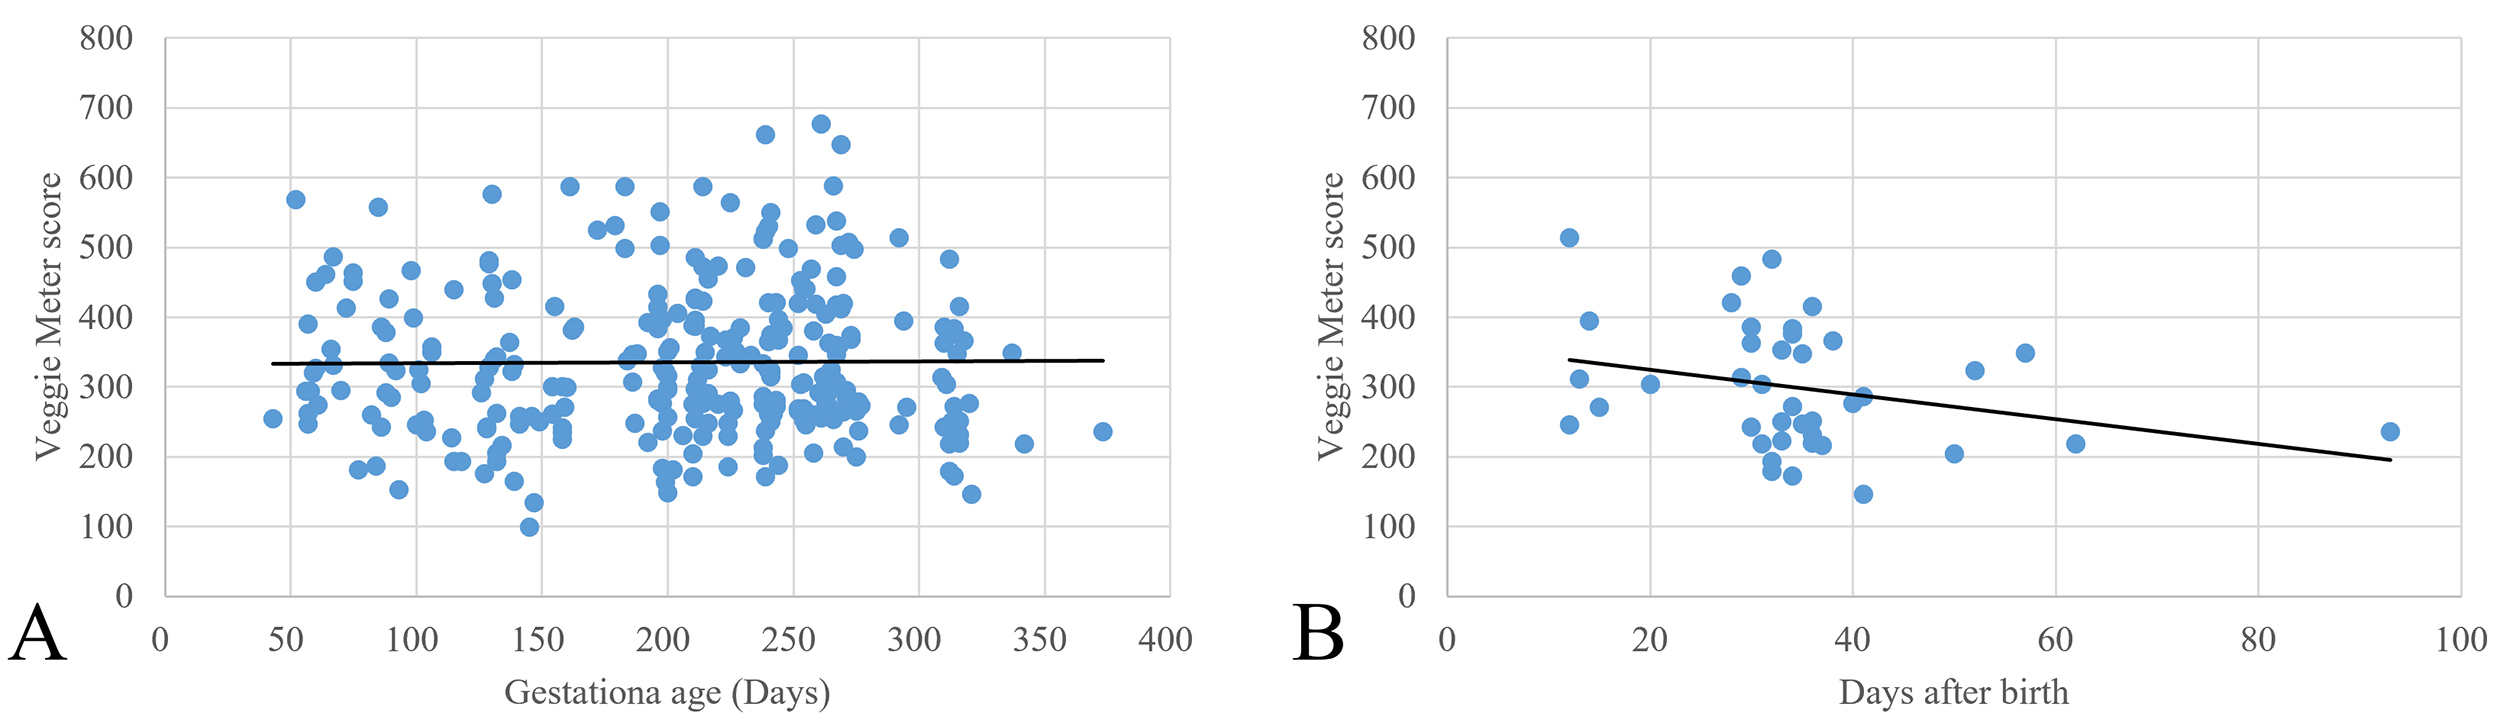 Fig. 1.
Scatter plots of Veggie. Meter scores and gestational age (A),
and days after birth (B). There was no significant correlation between Veggie
Meter scores and gestational age (Spearman
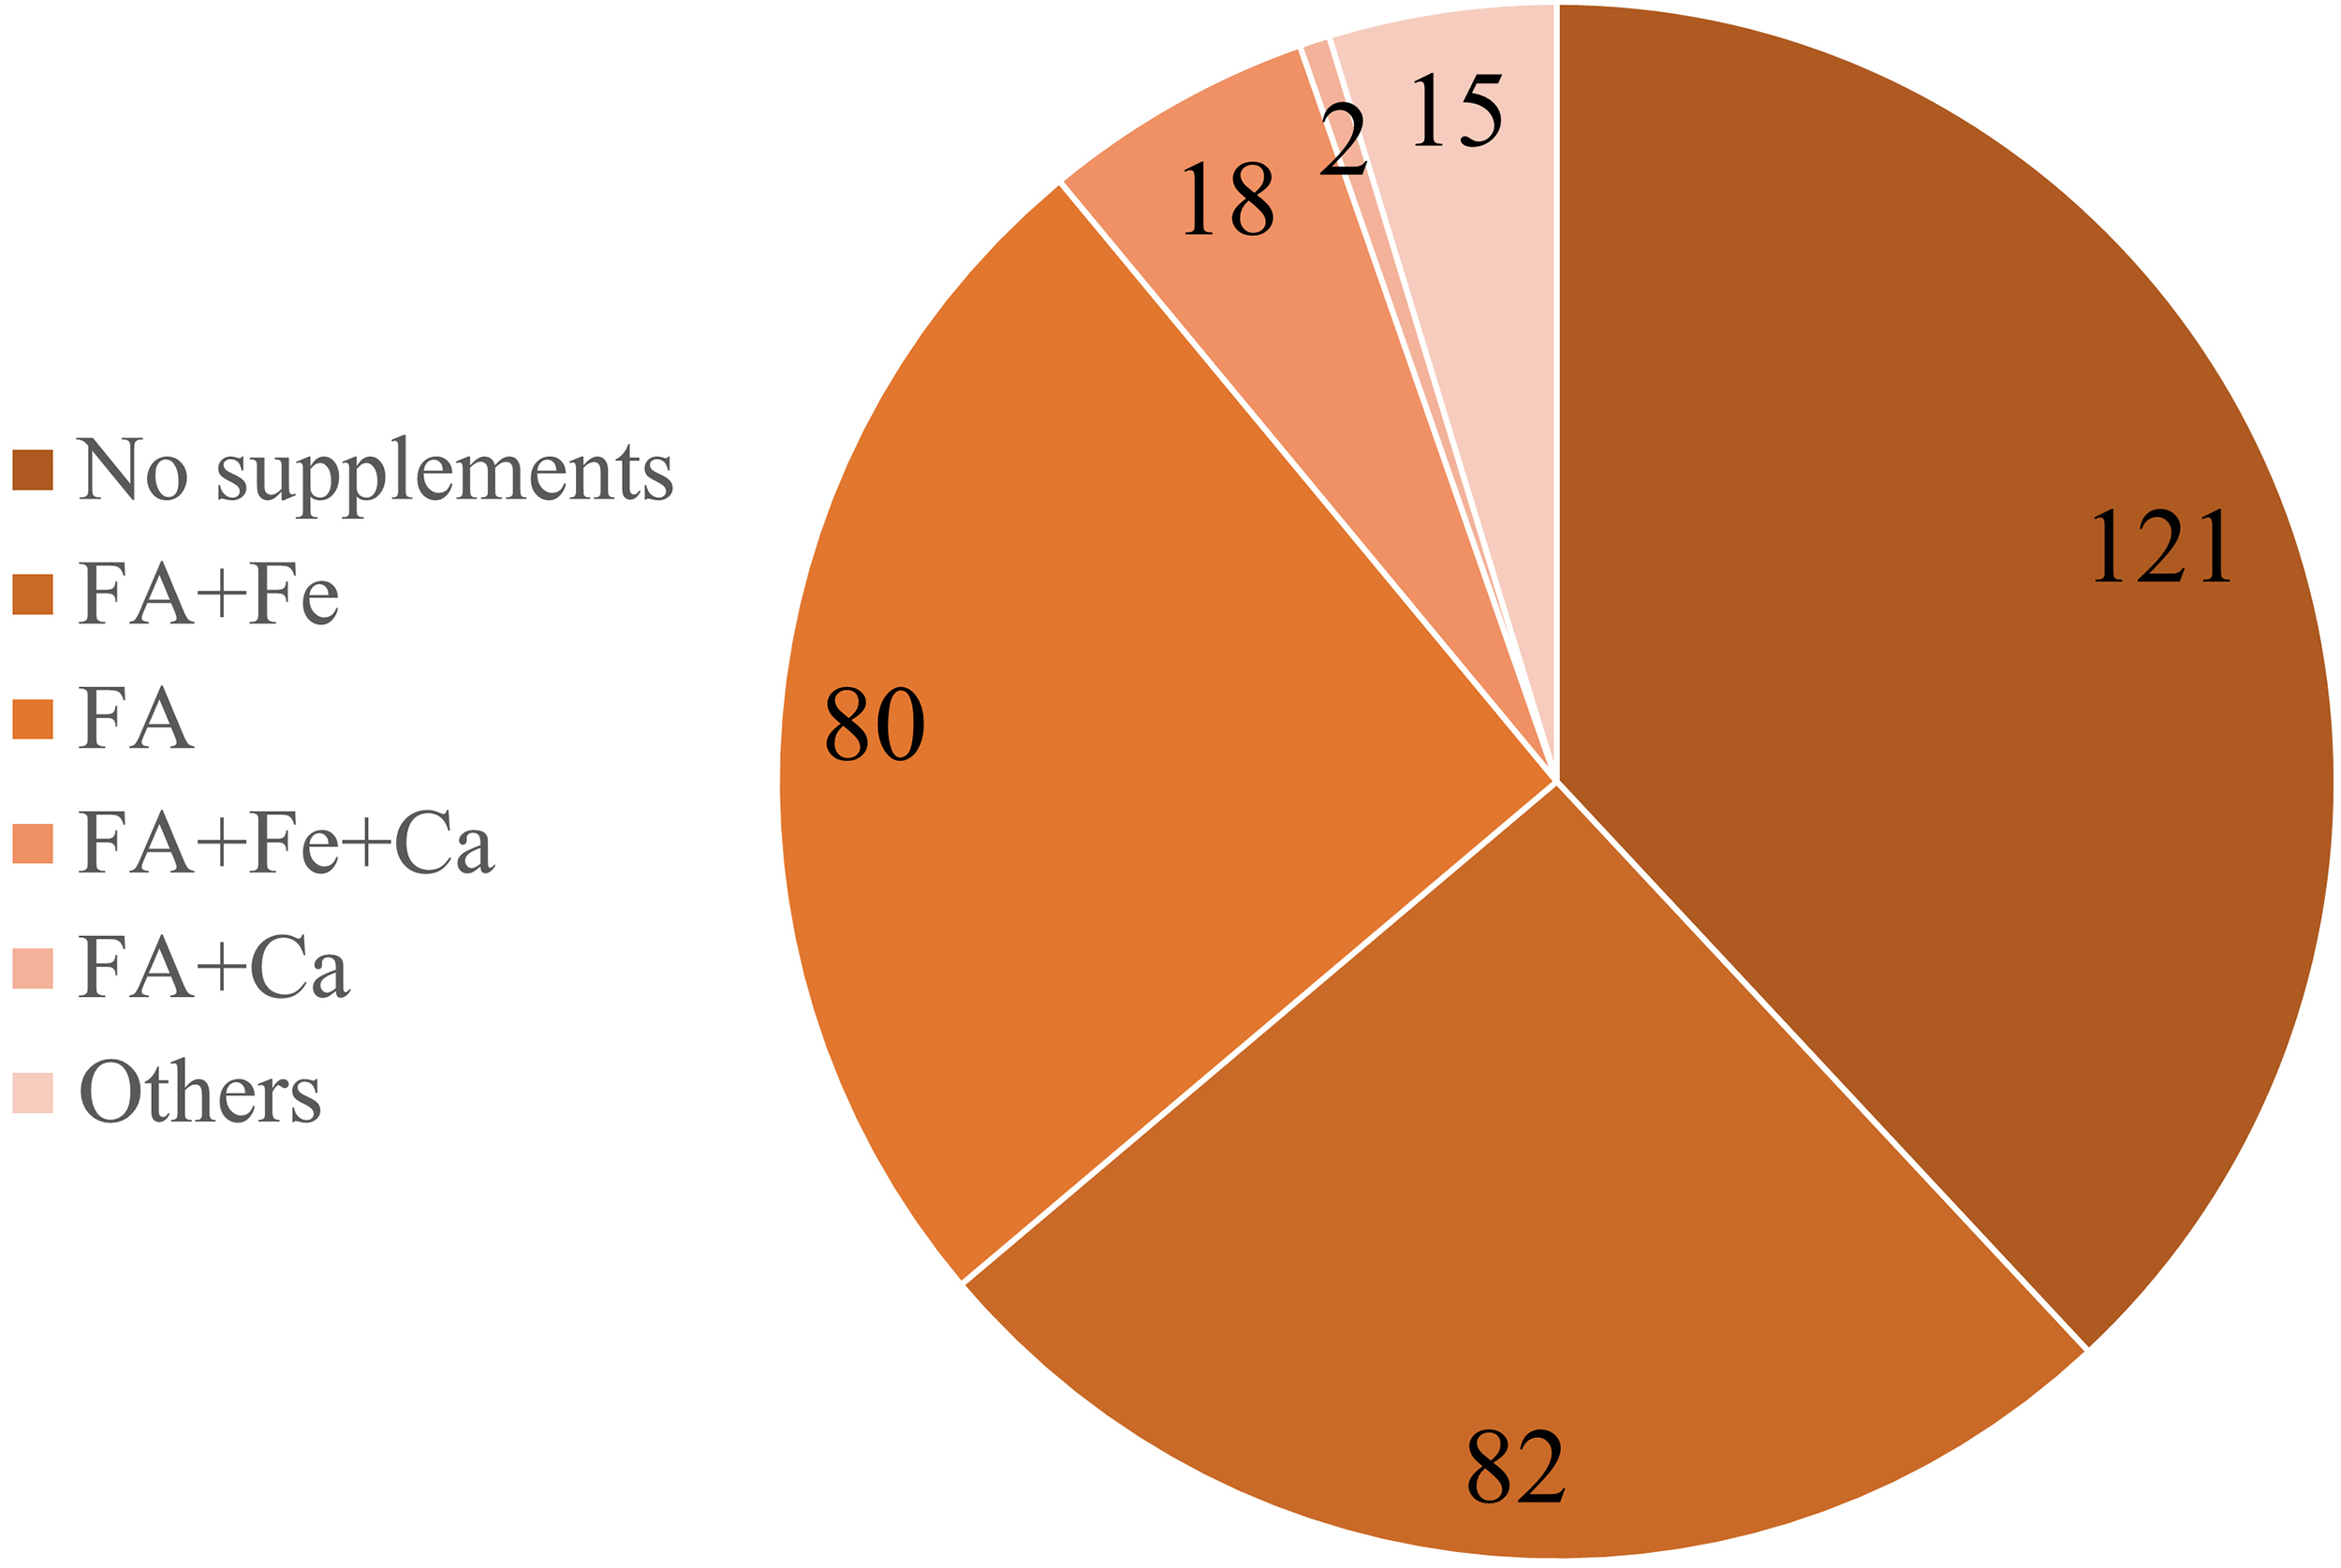
Dietary and life survey, and VM scores are shown in Table 3. Preferences for vegetables, the number of vegetable dishes consumed per week, whether they ate fruit, the frequency of consuming vegetables or tomato juice, and the use of supplements were all significantly associated with VM scores. Overall, 197 participants reported using supplements, 121 reported no supplement use and data were not obtained from six participants. Supplements containing folic acid were the most commonly consumed. No participants took L and Z supplements. The types of supplements are shown in Fig. 2.
 Fig. 2.
The types of supplements. One hundred twenty-one participants did not take any supplements, 80 took folic acid supplements, and 82 took supplements containing folic acid and iron. FA, folic acid; Fe, iron; Ca, calcium; Others, other supplements not containing folic acid.
| Question | Choices | No. of participants | Range | Median | Mean (Standard deviation) | p-value (significantly different pair in post hoc) |
| Q1, Are you aware of the importance of vegetables? | 1. Not aware | 45 | 134–587 | 300 | 308.1 (104.0) | 0.070# |
| 2. Somewhat aware | 251 | 99–677 | 321 | 336.3 (103.6) | ||
| 3. Fully aware | 26 | 146–647 | 359.5 | 364.8 (108.2) | ||
| Q2, Do you like vegetables? | 1. No | 9 | 134–357 | 193 | 220 (79.5) | (1–2, 1–3) |
| 2. Neither yes nor no | 74 | 99–576 | 283 | 305.2 (96.9) | ||
| 3. Yes | 239 | 146–677 | 332 | 348.1 (103.4) | ||
| Q3, How many vegetables did you eat daily in these four weeks? | 1. |
16 | 134–587 | 292 | 296.6 (112.1) | 0.003# (2–3) |
| 2. 1–2 | 232 | 99–587 | 311 | 323.9 (94.6) | ||
| 3. 3–4 | 69 | 146–677 | 356 | 370.7 (118.2) | ||
| 4. 5–6 | 5 | 243–647 | 459 | 460.2 (145.8) | ||
| 5. |
0 | |||||
| Q4, How many green and yellow vegetables did you eat daily in these four weeks? | 1. |
21 | 134–487 | 292 | 300.3 (102.8) | 0.190# |
| 2. 1–2 | 120 | 99–587 | 310.5 | 323.1 (95.9) | ||
| 3. 3–4 | 132 | 171–661 | 327 | 342.0 (108.2) | ||
| 4. 5–6 | 44 | 205–677 | 346 | 353.3 (101.5) | ||
| 5. |
4 | 146–647 | 450 | 423.3 (207.0) | ||
| Q5, Did you eat any fruits in these four weeks? | 1. No | 24 | 99–677 | 281.5 | 287.9 (100.2) | 0.019$ |
| 2. Yes | 298 | 99–661 | 324.5 | 338.4 (104.1) | ||
| Q6, How often did you drink vegetable/tomato juice? | 1. Almost none | 252 | 99–661 | 308.5 | 328.5 (103.4) | 0.003# (1–4, 2–4, 3–4) |
| 2. Once a week | 40 | 134–532 | 327.5 | 330.9 (97.3) | ||
| 3. 3–4 times a week | 16 | 243–677 | 325.5 | 354.4 (108.5) | ||
| 4. Daily | 14 | 173–576 | 447 | 433.6 (98.5) | ||
| Q7, How often did you drink green juice? | 1. Almost none | 300 | 99–677 | 320.5 | 334.6 (104.5) | 0.346# |
| 2. Once a week | 13 | 146–473 | 301 | 307.9 (106.4) | ||
| 3. 3–4 times a week | 4 | 216–499 | 319 | 338.3 (131.5) | ||
| 4. Daily | 4 | 333–530 | 395 | 413.3 (83.5) | ||
| Q8, Did you take supplements? | 1. No | 121 | 99–647 | 292 | 311.9 (99.6) | (1–4) |
| 2. Occasionally | 34 | 153–487 | 300 | 309.0 (85.1) | ||
| 3. Sometimes | 33 | 164–507 | 333 | 327.2 (89.6) | ||
| 4. Daily | 130 | 134–677 | 354.5 | 362.9 (109.2) | ||
| Q10, How has your dietary intake changed in these four weeks? | 1. Decreased | 77 | 99–588 | 320 | 323.7 (105.4) | 0.076# |
| 2. Unchanged | 146 | 146–677 | 304.5 | 327.3 (105.2) | ||
| 3. Increased | 95 | 164–661 | 353 | 350.8 (99.8) | ||
| Q11, Do you feel any stress in these four weeks? | 1. Much | 25 | 134–459 | 293 | 301.2 (93.8) | 0.093# |
| 2. Some | 191 | 99–677 | 325 | 343.0 (105.7) | ||
| 3. No | 102 | 146–588 | 310.5 | 324.8 (101.4) | ||
| Q12, How often did you exercise? | 1. No | 151 | 134–587 | 316 | 329.7 (101.2) | 0.666# |
| 2. Once a week | 80 | 99–647 | 317.5 | 329.6 (105.4) | ||
| 3. Four times a week | 51 | 149–661 | 320 | 339.9 (107.8) | ||
| 4. Daily | 35 | 181–677 | 360 | 353.9 (109.3) | ||
| Q13, Did you smoke? | 1. Daily | 0 | 0.118# | |||
| 2. Sometimes | 0 | |||||
| 3. Past | 37 | 146–661 | 281 | 312.7 (105.8) | ||
| 4. No | 282 | 99–677 | 324 | 336.5 (103.4) |
# Kruskal–Wallis test, Multiple comparisons, Bonferroni method, $Mann-Whitney test.
Table 4 shows significant variables associated with VM scores in the multivariate analysis. In the multivariate analysis, higher age, more frequent consumption of vegetable juice or supplements, stronger preference for vegetables, and a greater number of vegetable dishes were significantly associated with higher VM scores. In contrast, BMI showed a significant negative association. The prenatal/postnatal period showed a marginally significant difference (p = 0.0598).
| Variable | Estimate | SE | 95% CI | p-value |
| Age | 3.04 | 1.16 | 0.77 to 5.31 | 0.0092 |
| Frequency of vegetable juice consumption | 19.59 | 6.84 | 6.8 to 33.00 | 0.0045 |
| Frequency of supplement consumption | 14.09 | 4.00 | 6.25 to 21.93 | 0.0005 |
| BMI | –5.64 | 1.34 | –8.27 to –3.01 | |
| Prenatal/Postnatal | –30.27 | 16.02 | –61.67 to 1.13 | 0.0598 |
| Preference for vegetables | 44.59 | 10.51 | 23.99 to 65.19 | |
| Number of dishes of vegetable taking | 31.62 | 10.10 | 11.82 to 51.42 | 0.0019 |
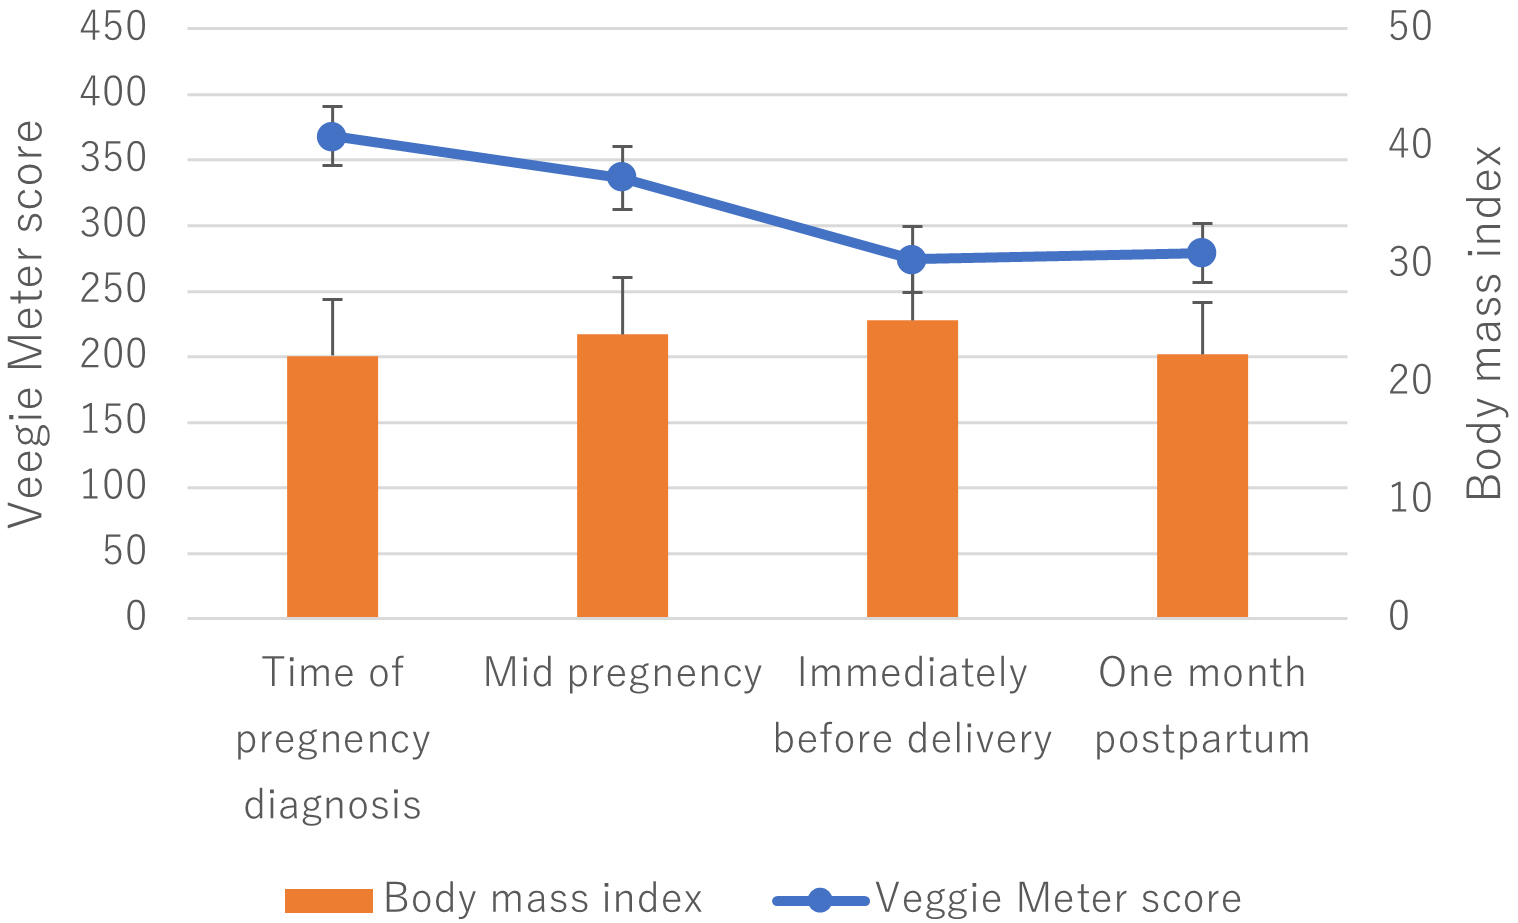
Eleven participants were enrolled at the time of data collection, of whom eight completed all four SC measurements. One participant did not undergo the third or fourth measurement, whereas two participants did not undergo the fourth measurement. The ages of the eight participants ranged from 32 to 43 years, with a mean age of 36.1 (3.5) years. BMI at the first measurement ranged from 17.9 to 32.5, and the mean was 22.3 (4.8). All participants were singletons. The VM scores at the first measurement ranged from 189 to 697 with a mean of 368.2 (151.6). The median was 339. The changes in BMI and VM scores are shown in Fig. 3. There was no significant difference between BMI at the time of pregnancy diagnosis and postpartum BMI. During the mid and late stages of pregnancy, the mother’s BMI appeared to increase compared to that at the time of pregnancy diagnosis, in association with fetal weight gain. The VM scores appeared to decrease over time, but this change was not statistically significant (p = 0.253, repeated-measures ANOVA). Among the items in the dietary and lifestyle habits survey (Q1–13), Table 5 shows comparisons between the time of pregnancy diagnosis and the postpartum period for the four items that were associated with VM scores in the multivariate analysis of the cross-sectional study. Five participants reduced their supplement intake postpartum, two maintained the same level, and one increased the frequency of multivitamin and iron supplement use. These five participants showed a decrease of more than 20% in VM scores postpartum compared to baseline. No major changes were observed in the other three items. In addition, no substantial changes were noted in items other than these four.
 Fig. 3.
The changes in body mass index and Veggie Meter scores. During the mid and late stages of pregnancy, the mother’s BMI appeared to increase compared with that at the time of pregnancy diagnosis, in association with fetal weight gain. Veggie Meter scores appeared to decrease over time, but the change was not statistically significant. Error bars represent standard deviation.
| Change of the score, number of participants | ||
| Q1, Are you aware of the importance of vegetables? | Same, 7 | Decreased from 3 to 2, 1 |
| Q3, How many vegetables did you eat daily in these four weeks? | Same, 6 | Decreased from 3 to 2, 2 |
| Q6, How often did you drink vegetable/tomato juice? | Same, 6 | Increased from 1 to 2, 2 |
| Q8, Did you take supplements? | Same, 2 | Decreased from 4 to 3, 1 |
| Decreased from 4 to 2, 2 | ||
| Decreased from 4 to 1, 2 | ||
| Increased from 1 to 3, 1 | ||
Japanese pregnant and postpartum women were observed cross-sectionally and longitudinally for SC levels. In a cross-sectional study involving 324 participants, the median VM score was 322. There was no correlation between gestational age and VM scores, whereas postpartum days negatively correlated with VM scores. The VM scores did not differ between singleton and multiple pregnancies or between normal and abnormal pregnancies. In the multivariate analysis, age, frequency of vegetable or tomato juice intake, liking vegetables, and number of vegetable servings per day were positively associated with VM scores, whereas BMI was negatively associated. In the univariate analysis, postpartum VM scores were significantly lower than the prenatal values; however, in the multivariate analysis, the effect of delivery was marginally significant (p = 0.0598). In a longitudinal observation of eight participants, the median VM score was 339. The VM scores appeared to decrease over time, but this change was not statistically significant.
Eighteen dietary carotenoids were detected in the human skin, including
lycopene, alpha-, beta-, gamma-, and delta-carotene, beta-cryptoxanthin, L and Z
[19]. Among these carotenoids,
There was no significant correlation between gestational age and VM scores; however, VM scores at one month postpartum were significantly lower than those during pregnancy. Nevertheless, multivariate analysis did not identify delivery as a factor significantly associated with VM scores at the 5% significance level. The longitudinal study showed a trend toward declining VM scores from late pregnancy to the postpartum period, however, it included a limited number of participants and therefore lacked sufficient statistical robustness. After delivery, maternal nutrients are transferred to the infant through breast milk, and dietary habits may be adversely affected by childcare demands; consequently, SC levels may also decrease. Consistent with this, Sherry et al. [29] reported that maternal plasma L and Z concentrations, as well as breast milk L and Z concentrations, decreased at 6 months postpartum in the absence of L supplementation. We reanalyzed previous data on SC levels measured using the same VM [17, 30, 31, 32]. The VM scores of 322 women aged 16 to 44 years had a median value of 342 and a mean (SD) of 356.8 (109.3). Because these are different studies and the participants differ in BMI, and other conditions, direct comparisons cannot be made; however, if the two were hypothetically compared statistically, SC levels in the present study were significantly lower than SC levels in the previous studies (p = 0.014). Furthermore, when the current data were divided into prenatal and postnatal periods and compared with the previous data across three groups (ANOVA, p = 0.004), prenatal SC levels did not differ from the previous studies, whereas postnatal SC levels were significantly lower than the previous studies (Bonferroni, p = 0.005). This result suggested that SC levels in mothers in the early postpartum period was lower than those in non-pregnant individuals. Taken together, whether SC levels decrease after delivery requires further investigation in larger cohorts. Moreover, this study assessed participants only up to one month postpartum; if a postnatal decline does occur, subsequent changes beyond this period would also be of interest.
Consistent with the report that older pregnant women have a higher carotenoid intake than younger pregnant women [33], a weak positive correlation was observed between age and VM scores in this study. The negative correlation between BMI and VM scores was consistent with previous reports [30, 31].
In the cross-sectional analysis, supplement use was identified as a factor
associated with higher VM scores. In the longitudinal analysis, all five
participants who reduced supplement intake showed a decrease of more than 20% in
VM scores postpartum, suggesting an association between supplement use and VM
scores. However, this finding is difficult to interpret because the supplements
consumed by the participants in this study were folic acid, iron, and calcium,
and none of them consumed supplements containing L, Z, or
Metabolic and hormonal changes during pregnancy increase ROS production. Oxidative stress has emerged as a likely promoter of several pregnancy-related disorders such as spontaneous abortions, embryopathies, preeclampsia, FGR, preterm labor, and low birth weight. Carotenoid intake during pregnancy is associated with the prevention of pregnancy-related conditions caused by oxidative stress. Although we focused on the development of visual function in infants, the present findings may serve as fundamental data for research on complications during pregnancy and the postpartum period.
The limitations of this study are as follows. In univariate analysis, postpartum carotenoid levels were lower than those during pregnancy; however, this difference was not statistically significant in multivariate analysis. A possible reason for this discrepancy is the small sample size. An adequate number of participants could not be recruited for this longitudinal study. Larger longitudinal studies are needed to examine the changes in carotenoid levels as pregnancy progresses.
Since L and Z are reportedly involved in the development of visual function in children, adequate maternal intake of these carotenoids is considered important, therefore we investigated carotenoid levels in pregnant and postpartum Japanese women as an initial step toward future research. These findings are significant because they can be compared with previous studies conducted on Western populations. In addition, we identified the potential concern that maternal carotenoid levels might decline in postpartum lactation. If this decline is true and adversely affects visual function in children, prevention of the decline is necessary from a public health perspective. We intend to further investigate the issues identified in this study in future studies.
MP, macular pigment; L, lutein; Z, zeaxanthin; MPOD, macular pigment optical density; PMA, post-menstrual age; SC, skin carotenoid; VM, Veggie Meter; BMI, body mass index; FA, folic acid; Fe, iron; Ca, calcium; SD, standard deviation.
The clinical data of the patients included in this study will be made available upon request, and appropriate measures will be taken to protect their personal information. The data will be made available upon request from readers.
AO designed the research; TM and HK conducted the research; AO and RA analyzed the data; YG, TM, AM, MN, and RA interpreted the data; and AO wrote the paper. All authors contributed to editorial changes in the manuscript. All the authors have read and approved the final version of this manuscript. All authors have participated sufficiently in the work and agreed to be accountable for all aspects of the work.
This study was approved by the Institutional Review Board of Seirei Hamamatsu General Hospital (No.4679) and complied with the Declaration of Helsinki. After explaining the study details to a minor participant and her mother, informed consent was obtained. All the participants provided written informed consent.
The authors would like to express their sincere gratitude to Mieko Nakamura, MD, National Institute of Biomedical Innovation, Health and Nutrition, for valuable advice on the study design and for the appropriate and constructive comments on the manuscript.
This research received no external funding.
The authors declare no conflicts of interest.
References
Publisher’s Note: IMR Press stays neutral with regard to jurisdictional claims in published maps and institutional affiliations.