

 , Jinxin Lin 1,2,3,†, Nan Wang 4, Ruixuan Wang 5, Lin Yang 6, Chao Cao 7,*
 , Xiaobin Zheng 1,2,3,*
1 Department of General Surgery (Colorectal Surgery), The Sixth Affiliated Hospital, Sun Yat-sen University, 510655 Guangzhou, Guangdong, China
2 Guangdong Provincial Key Laboratory of Colorectal and Pelvic Floor Diseases, The Sixth Affiliated Hospital, Sun Yat-sen University, 510655 Guangzhou, Guangdong, China
3 Biomedical Innovation Center, The Sixth Affiliated Hospital, Sun Yat-sen University, 510655 Guangzhou, Guangdong, China
4 Department of Public Health Sciences, University of California, Davis, CA 95616, USA
5 Department of Health Services Research, Management and Policy, College of Public Health and Health Professions, University of Florida, Gainesville, FL 32611, USA
6 Department of Cancer Epidemiology and Prevention Research, Alberta Health Services, Calgary, AB T2N 4Z6, Canada
7 Department of Medical Oncology, Dana-Farber Cancer Institute, Boston, MA 02215, USA
†These authors contributed equally.
Abstract
Taste disorders are associated with various health conditions, including COVID-19. However, the prevalence and correlation of taste disorders are not comprehensively described at the population level. This study aimed to (i) estimate the prevalence of taste disorders, (ii) identify modifiable and non-modifiable correlates, and (iii) investigate the association between taste disorders and diet quality and macronutrient intake.
This cross-sectional study analyzed data from 7408 adults aged ≥40 years in the 2011–2014 National Health and Nutrition Examination Survey (NHANES). Taste disorders and sociodemographic factors were identified through self-reported questionnaires and interviews. Dietary quality was assessed using the Healthy Eating Index (HEI)-2015. Weighted logistic regression models were used to identify correlates of taste disorders, while Wilcoxon rank-sum tests and linear regression models were used to analyze dietary quality and macronutrient intake. Multivariable-adjusted models were adjusted for age, sex, race/ethnicity, socioeconomic status (as measured by educational attainment and family income level), smoking status, physical activity, body mass index (BMI), and a history of chronic diseases (hypertension, high cholesterol, cardiovascular disease, diabetes, and cancer).
Taste disorders had a prevalence of 5.1% (95% confidence interval (CI): 4.5–5.6). Higher rates were observed in individuals with lower educational attainment, lower income, and a history of diabetes (7.3%; 95% CI: 5.8–8.7), cardiovascular disease (9.7%; 95% CI: 7.7–12.0), and cancer (7.0%; 95% CI: 4.1–10.0). Those with taste disorders had poorer diet quality, lower energy intake, lower protein intake, and higher sugar consumption compared with those without (all p < 0.01).
US adults exhibited a high prevalence of taste disorders, particularly among individuals with lower socioeconomic status, chronic conditions, and those who are non-Hispanic White, non-Hispanic Black, and Hispanic. An increased prevalence is associated with poorer diet quality, highlighting the need for targeted interventions to address the nutritional impacts. Due to the limitations of the cross-sectional design, this study could not establish causality between taste disorders and dietary intake or patterns, underscoring the need for longitudinal studies to confirm the observed relationships.
Keywords
- taste disorder
- dietary quality
- macronutrient intake
There are three general taste disorders, including a diminished sense of taste (hypogeusia), the complete loss of taste (ageusia), and an alteration or distortion in the perception of taste (dysgeusia) [1]. Although a small proportion of people can be born with a taste disorder, the most common causes include (i) upper respiratory and middle ear infections, (ii) head and neck cancer radiation therapy, (iii) chemical exposure (e.g., insecticides, some common antibiotics and antihistamines), (iv) head trauma, (v) otolaryngological surgeries or third molar extraction, (vi) poor oral hygiene and dental complications [2]. Most recently, new-onset taste loss has been recognized as a symptom of COVID-19 [3, 4].
Taste disorder has previously been shown to be a risk factor for multiple health complications. For instance, a study conducted in 1697 US adults aged 40 years and older with diabetes or prediabetes found that individuals with sweet taste disorder were 2.45 times more likely to develop ischemic heart disease [5]. Additionally, research in patients with Type 2 diabetes has suggested that hypogeusia may serve as an early indicator of diabetic neuropathy [6], and children and adolescents with Type 1 diabetes were shown to have some taste recognition disorders [7]. Moreover, literature has identified a strong inverse association between greater taste perception and body weight, body mass index, and waist circumference in older subjects with metabolic syndrome [8]. It is plausible that taste disorders lead to further health complications in those with existing conditions (prediabetes, diabetes, metabolic syndrome) through poor compliance with dietary recommendations among these patients [9, 10].
To date, research on taste disorders has predominantly focused on those with underlying health conditions, and knowledge regarding taste disorders in the general population remains limited. Specifically, the prevalence of the condition in the general US population remains unknown, and identified correlates of taste disorder are scarce. To understand the true burden of taste disorders in the US, it is essential to estimate their prevalence and identify correlates to develop and implement targeted interventions to improve the health of affected individuals. Furthermore, correlates can be categorized as modifiable (e.g., lifestyle behaviors such as smoking and dietary habits) or non-modifiable (e.g., demographics such as gender and ethnicity), with the former serving as potential intervention targets for eliciting change and the latter aiding in identifying populations at highest risk.
Considering this background, the aims of the present study were to (i) estimate the prevalence of taste disorder, (ii) determine modifiable and non-modifiable correlates of taste disorder, and (iii) examine the association between taste disorder and diet quality among the US population aged 40 years and older, using a nationally representative sample.
The National Health and Nutrition Examination Survey (NHANES) is a major program of the National Center for Health Statistics designed to monitor the health and nutritional status of US residents [11]. Briefly, the NHANES conducts a series of cross-sectional, nationally representative health examinations using a complex, stratified, multistage sampling design to evaluate the disease burden and risk factors among the civilian noninstitutionalized US population in 2-year cycles starting from 1999 [11]. Each participant provided written informed consent and underwent an in-person interview and a physical examination at a Mobile Examination Center (MEC). The present study extracted and aggregated data on sociodemographic characteristics, physical examination, lifestyle behavior, medical conditions, and dietary information among adults aged 40 years and older in two waves, 2011–2012 and 2013–2014, due to the availability of taste ability data [12]. Individuals who did not answer taste-related questions or refused to participate in the study have been excluded.
Taste disorder identification was based on data from the taste and smell questionnaire, which collected self-reported information on taste ability via household interviews using the Computer-Assisted Personal Interviewing (CAPI) system [13]. This questionnaire was designed to estimate the prevalence of self-reported or medically diagnosed taste and smell disorders among US adults. Participants were asked, “During the past 12 months, have you had a problem with your ability to taste sweet, sour, salty or bitter foods and drinks?” Participants who responded “Yes” were categorized as having taste disorder, otherwise as not having a taste disorder [14]. This measurement was used to provide data to support the Healthy People objectives related to taste disorder [15].
The NHANES 24-hour dietary recall, developed by the National Cancer Institute, was utilized to collect validated data on the quantity (in grams) of each food and beverage consumed in the 24 hours prior to the interview [16]. Daily total energy and macronutrient intakes (total energy, total carbohydrate, protein, fat, sugar, and dietary fiber) were extracted from foods and beverages documented in the total nutrient files. Dietary quality was indicated by the Healthy Eating Index (HEI)-2015, the most current version aligned with the 2015–2020 Dietary Guidelines for Americans. The HEI-2015 employs a scoring system (scores range from 0–100, with higher scores indicating better diet quality) to evaluate foods across 13 components reflecting the food groups and key recommendations in the 2015–2020 Dietary Guidelines for Americans [17].
Self-reported sociodemographic characteristics included age, sex, race/ethnicity
(non-Hispanic White, non-Hispanic Black, Hispanic, and Others), family
income-to-poverty ratio (
Medical history of chronic diseases was documented through the medical condition questionnaire administered during the in-person interview. Cardiovascular disease was identified based on self-reported diagnoses of congestive heart failure, angina, heart attack, coronary heart disease, or stroke [20]. Diabetes was defined as a self-reported physician diagnosis of diabetes. Participants were considered to have a history of cancer if they self-reported a physician diagnosis of any cancer type [21].
All statistical analyses were conducted in accordance with the NHANES analytical guidelines. We included all participants with available information on taste disorders, and used median values to impute missing data for dietary outcomes and covariates. NHANES sampling weights were used to adjust for demographic characteristics, lifestyle behaviors, and chronic diseases, and applied survey analysis procedures to account for the complex survey design, ensuring national representativeness of the estimates [18].
The distribution of participants’ characteristics was stratified by taste disorder status, with linear regression used for continuous variables and chi-square tests for categorical variables. Estimates on weighted prevalence and 95% confidence intervals (CIs) of taste disorder were calculated according to sociodemographic characteristics, lifestyle behaviors, and chronic diseases. Multivariable-adjusted weighted logistic regression model was used to estimate odds ratios (ORs) to identify the correlates for taste disorder. Multivariable-adjusted models accounted for age, sex, race/ethnicity, socioeconomic status (including education attainment, and family income level), smoking status, physical activity, body mass index, and chronic disease history (including hypertension, high cholesterol, cardiovascular disease, diabetes, and cancer).
Weighted mean scores of the HEI-2015 and its subgroups, as well as weighted mean
macronutrient intakes, were calculated by taste disorder status and age groups,
respectively. Due to the violation of the normality assumption, the Wilcoxon
rank-sum test was used to compare median HEI-2015 scores by taste disorder
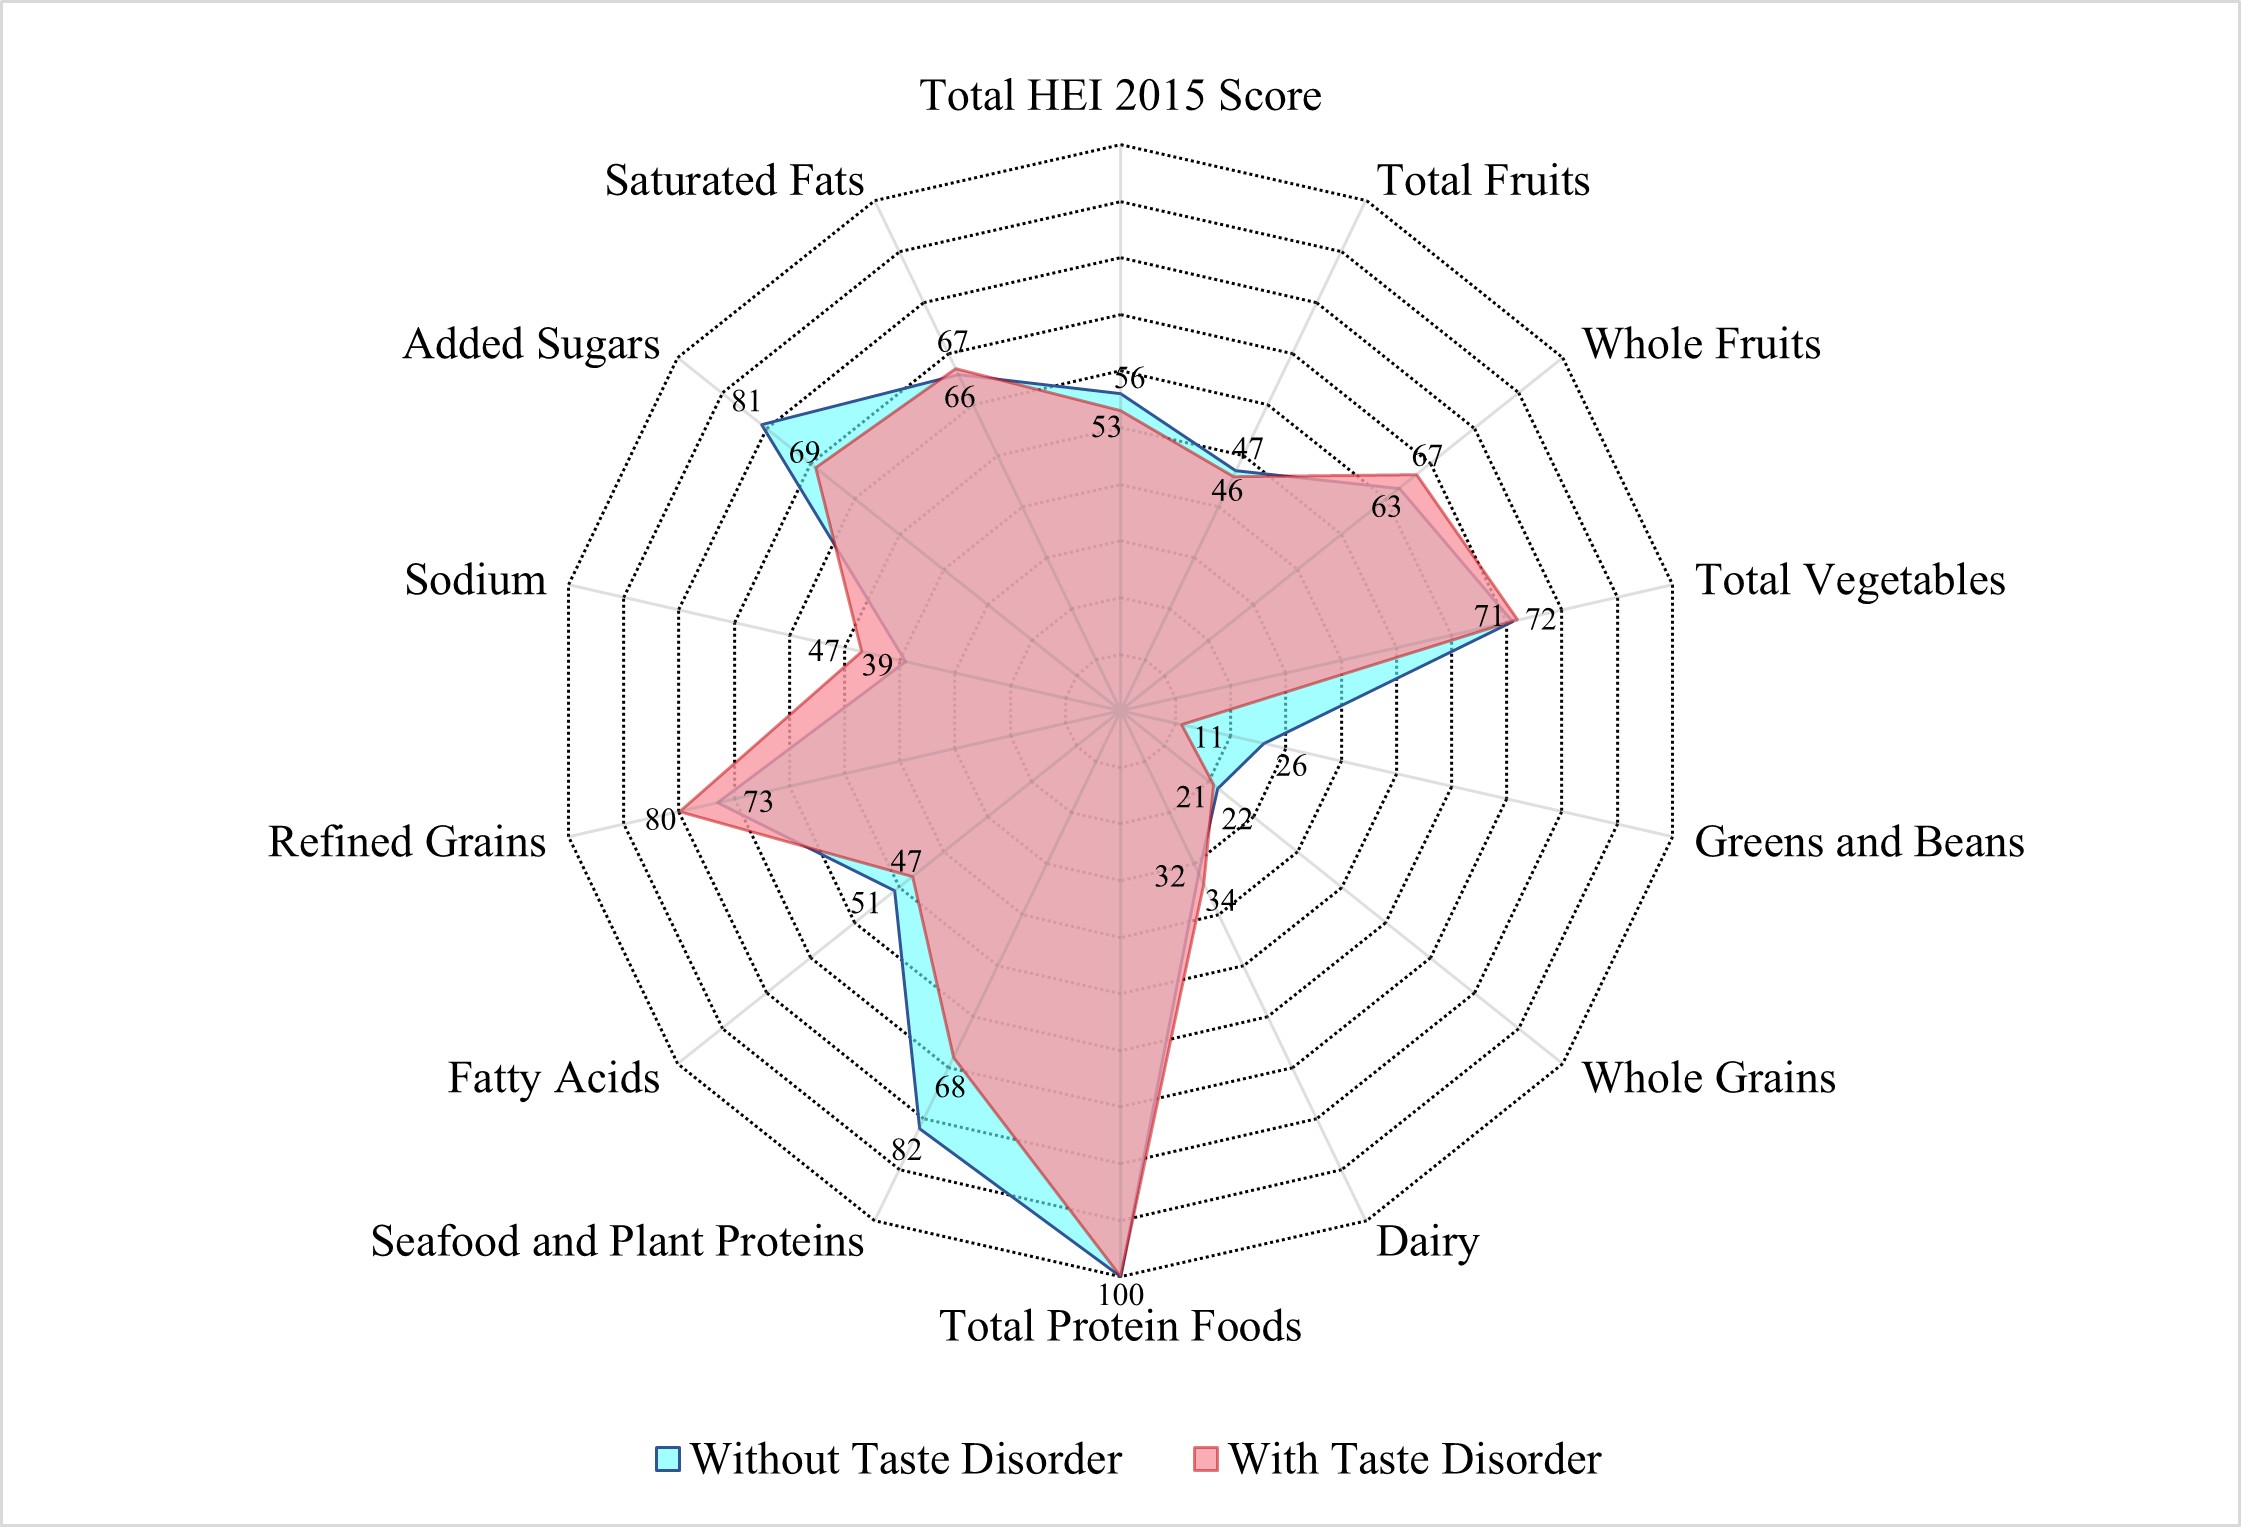
status. Additionally, radar charts were plotted using median values of total and
domain-specific HEI-2015 scores by taste disorder status. Finally, weighted
linear regression models, adjusted for age and total energy intake, were applied
to test differences in macronutrient intakes by taste disorder status within each
age group. All analyses were done using Stata, version 16.0 (StataCorp, College
Station, TX, USA). All statistical tests were 2-sided and statistical
significance was set at p
A total of 7408 adults aged
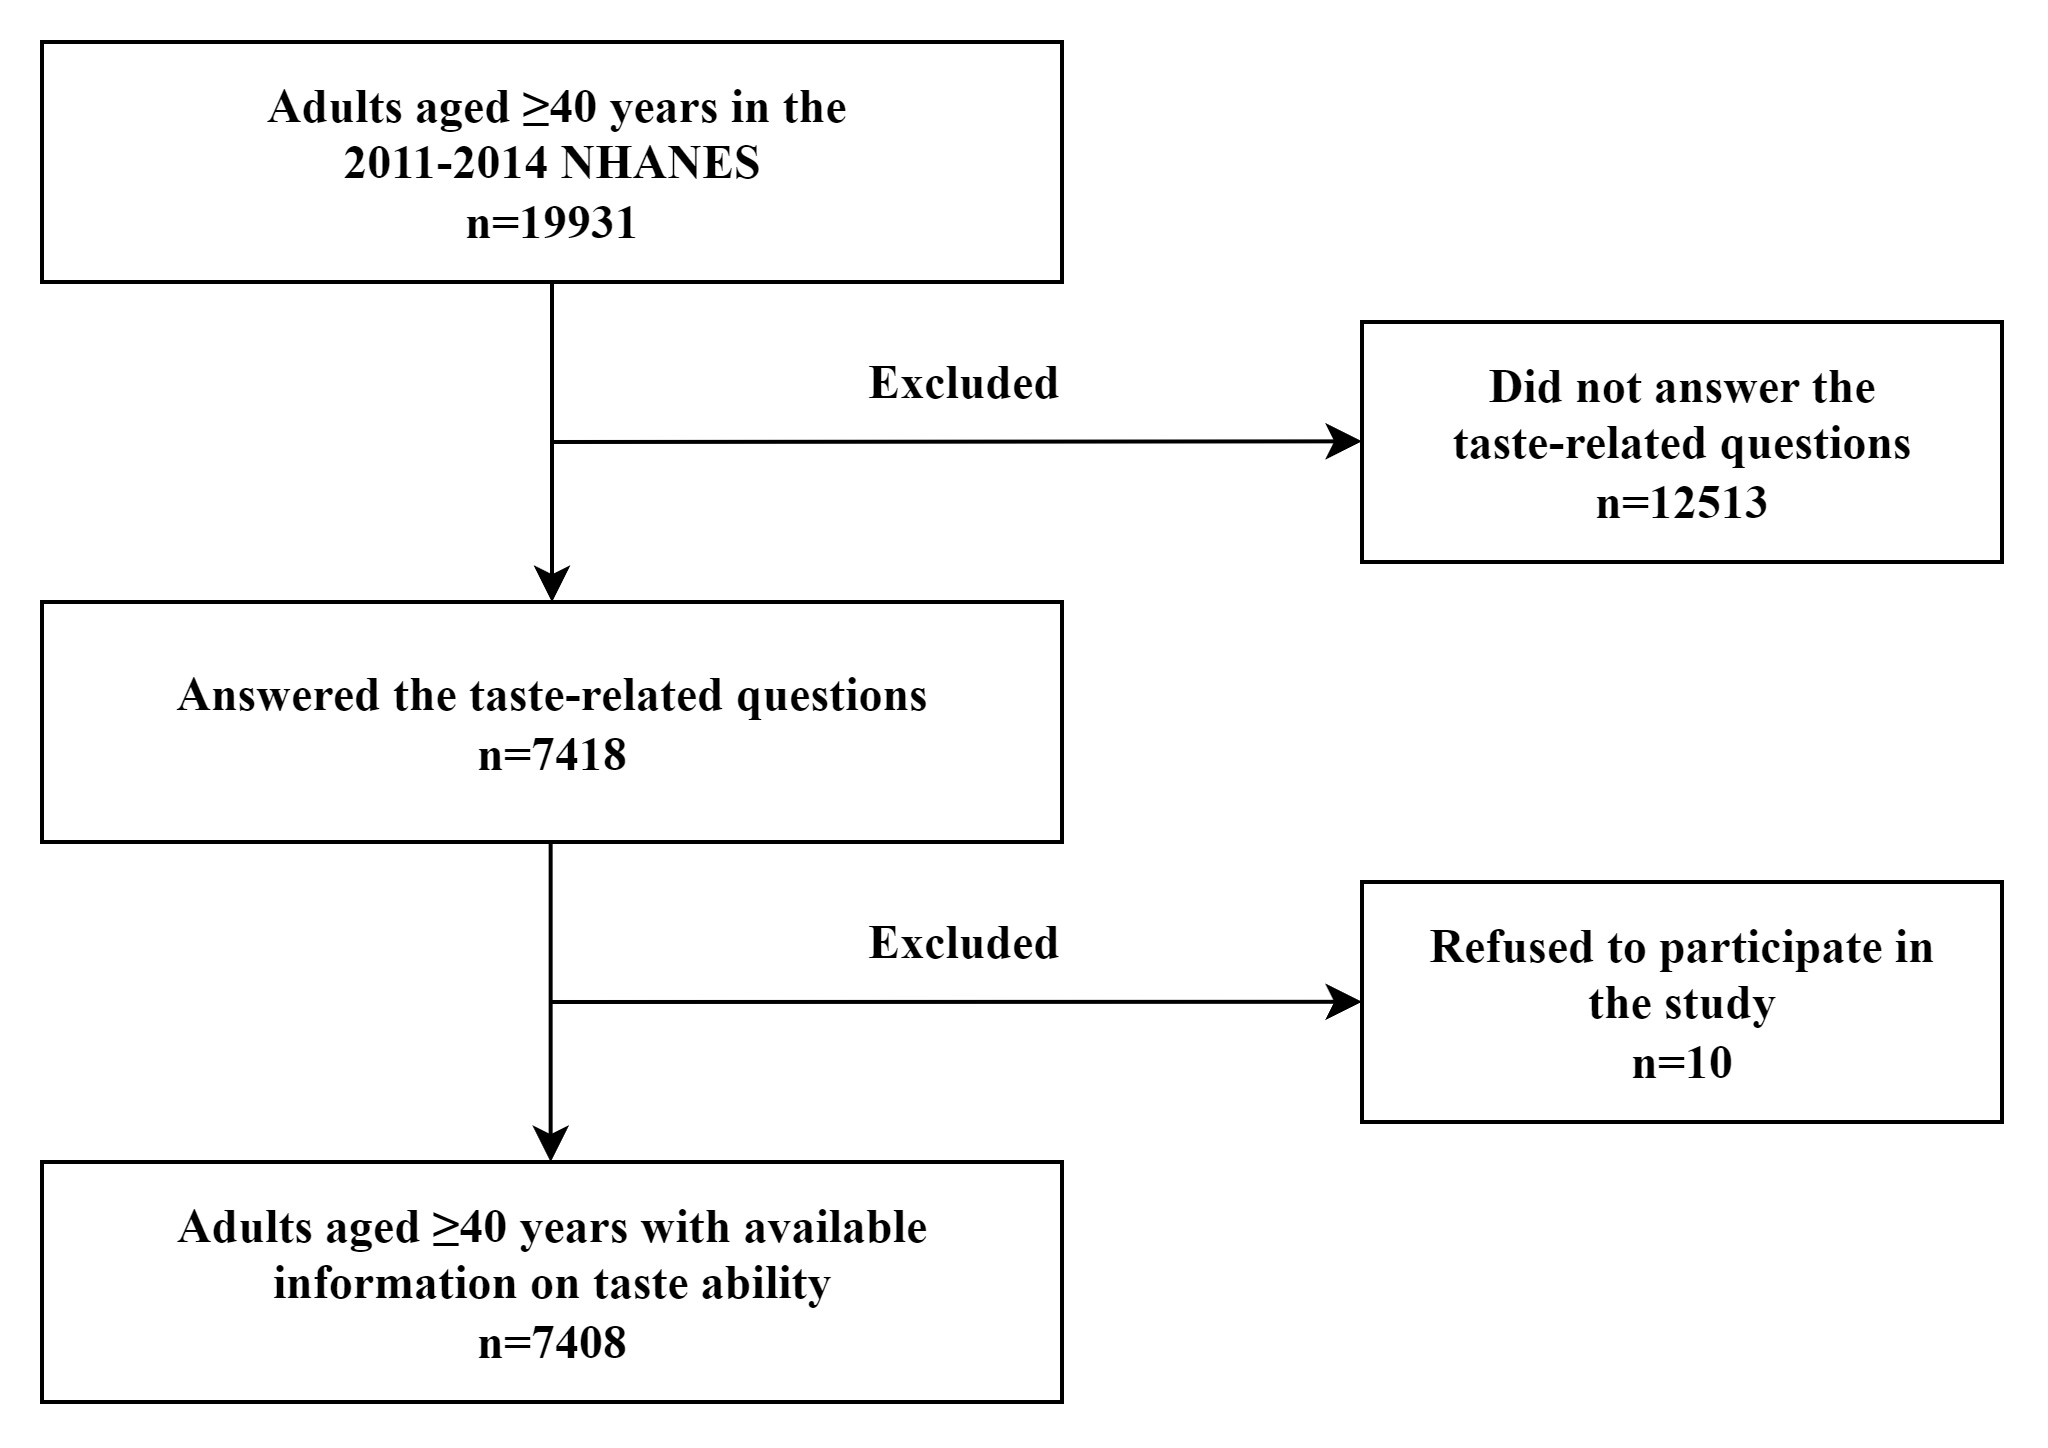 Fig. 1.
Flowchart of the participants among US adults
| Variables | Taste disorder | p value | ||
| No | Any | |||
| N | 6990 | 418 | ||
| Weighted N | 136,943,644 | 7,319,837 | ||
| Age (years) | 57.7 (0.2) | 59.4 (0.9) | 0.049 | |
| Sex (%) | ||||
| Male | 44.9 | 2.3 | 0.500 | |
| Female | 50.0 | 2.8 | ||
| Race/ethnicity (%) | ||||
| Non-Hispanic White | 67.6 | 3.6 | 0.170 | |
| Non-Hispanic Black | 10.1 | 0.6 | ||
| Hispanic | 10.6 | 0.5 | ||
| Other | 6.7 | 0.3 | ||
| Family poverty ratio (%) | ||||
| 17.4 | 1.5 | 0.001 | ||
| 1.3– |
37.2 | 1.8 | ||
| 40.4 | 1.7 | |||
| Education (%) | ||||
| 15.8 | 1.3 | 0.005 | ||
| High school | 20.7 | 1.0 | ||
| 58.5 | 2.7 | |||
| Body mass index (kg/m2) b | ||||
| 24.3 | 1.0 | 0.043 | ||
| 25– |
35.3 | 1.8 | ||
| 35.3 | 2.3 | |||
| Leisure-time physical activity (%) c | ||||
| Inactive | 48.6 | 3.1 | 0.031 | |
| Active | 46.3 | 2.0 | ||
| Smoking status (%) | ||||
| Never | 50.0 | 2.3 | 0.090 | |
| Past | 27.6 | 1.7 | ||
| Current | 17.3 | 1.1 | ||
| Diabetes (%) | ||||
| No | 82.0 | 4.0 | ||
| Yes | 13.0 | 1.0 | ||
| Cardiovascular disease (%) | ||||
| No | 83.4 | 3.8 | ||
| Yes | 11.6 | 1.2 | ||
| Cancer (%) | ||||
| No | 85.2 | 4.3 | 0.140 | |
| Yes | 9.7 | 0.8 | ||
a NHANES sampling weights were applied to adjust for demographic characteristics, lifestyle behaviors, and chronic diseases, ensuring national representativeness of the estimates.
b Weight status was defined by body mass index (BMI = weight (kg)/height (m)2).
c Leisure-time physical activity level was defined by engaging in no (inactive) or any (active) moderate or vigorous recreational physical activity over the past 30 days.
| Variables | Taste disorder | ||
| Prevalence (95% CI) | Odds ratio (95% CI) | ||
| Overall | 5.1 (4.5–5.6) | – | |
| Sex | |||
| Male | 4.8 (4.1–5.6) | 1 [Reference] | |
| Female | 5.3 (4.4–6.1) | 1.13 (0.86–1.50) | |
| Age group (years) | |||
| 40–64 | 4.9 (4.1–5.6) | 1 [Reference] | |
| 5.6 (4.4–6.8) | 0.86 (0.58–1.26) | ||
| Race/ethnicity | |||
| Non-Hispanic White | 5.1 (4.4–5.8) | 1 [Reference] | |
| Non-Hispanic Black | 5.7 (4.9–6.5) | 0.97 (0.79–1.19) | |
| Hispanic | 5.3 (3.9–6.7) | 0.83 (0.57–1.20) | |
| Other | 3.7 (2.6–4.8) | 0.77 (0.54–1.09) | |
| Family poverty ratio | |||
| 8.0 (6.3–9.6) | 1 [Reference] | ||
| 1.3– |
5.0 (3.9–6.1) | 0.63 (0.42–0.95) | |
| 4.2 (3.0–5.3) | 0.66 (0.39–1.11) | ||
| Education | |||
| 7.6 (6.4–8.8) | 1 [Reference] | ||
| High school | 4.8 (3.3–6.3) | 0.67 (0.46–0.97) | |
| 4.5 (3.6–5.3) | 0.72 (0.51–1.02) | ||
| Weight status b | |||
| 4.0 (2.8–5.1) | 1 [Reference] | ||
| 25– |
4.9 (3.7–6.0) | 1.22 (0.85–1.76) | |
| 6.2 (4.9–7.4) | 1.43 (1.01–2.01) | ||
| Leisure-time physical activity c | |||
| Inactive | 5.9 (4.9–6.9) | 1 [Reference] | |
| Active | 4.1 (3.2–5.1) | 0.84 (0.56–1.27) | |
| Smoke status | |||
| Never | 4.4 (3.5–5.3) | 1 [Reference] | |
| Past | 5.9 (4.7–7.1) | 1.26 (0.91–1.74) | |
| Current | 5.8 (4.2–7.4) | 1.13 (0.76–1.69) | |
| Diabetes | |||
| No | 4.7 (4.1–5.3) | 1 [Reference] | |
| Yes | 7.3 (5.8–8.7) | 1.17 (0.89–1.55) | |
| Cardiovascular disease | |||
| No | 4.4 (3.8–5.0) | 1 [Reference] | |
| Yes | 9.7 (7.7–12.0) | 2.02 (1.39–2.92) | |
| Cancer | |||
| No | 4.8 (4.2–5.5) | 1 [Reference] | |
| Yes | 7.0 (4.1–10.0) | 1.40 (0.81–2.42) | |
a Multivariable-adjusted models accounted for age, sex, race/ethnicity, socioeconomic status (including education attainment, and family income level), smoking status, physical activity, body mass index, and chronic disease history (including hypertension, high cholesterol, cardiovascular disease, diabetes, and cancer).
b Weight status was defined by body mass index (BMI = weight (kg)/height (m)2).
c Leisure-time physical activity level was defined by engaging in no (inactive) or any (active) moderate or vigorous recreational physical activity over the past 30 days.
Considering that taste disorders may be associated with dietary choices, the
study further evaluated dietary quality using HEI-2015 scores. Table 3
demonstrated the mean HEI-2015 scores among US adults
| Component | Maximum points | Age groups | |||||||||
| All Adults ( |
Adults (40–64 years) | Older adults ( | |||||||||
| Any taste disorder | p valuea | Any taste disorder | p valuea | Any taste disorder | p valuea | ||||||
| No | Yes | No | Yes | No | Yes | ||||||
| Total HEI-2015 score | 100 | 56.09 | 54.68 | 0.02 | 55.18 | 54.17 | 0.08 | 58.46 | 55.89 | 0.08 | |
| Adequacy | |||||||||||
| Total fruits | 5 | 2.51 | 2.51 | 0.56 | 2.34 | 2.26 | 0.29 | 2.98 | 3.11 | 0.91 | |
| Whole fruits | 5 | 2.77 | 2.76 | 0.24 | 2.59 | 2.53 | 0.06 | 3.26 | 3.29 | 0.79 | |
| Total vegetables | 5 | 3.41 | 3.33 | 0.50 | 3.38 | 3.30 | 0.19 | 3.50 | 3.40 | 0.61 | |
| Greens and beans | 5 | 2.10 | 1.74 | 0.01 | 2.14 | 1.80 | 0.01 | 2.00 | 1.59 | 0.33 | |
| Whole grains | 10 | 3.27 | 2.89 | 0.04 | 3.02 | 2.70 | 0.35 | 3.92 | 3.34 | 0.01 | |
| Dairy | 10 | 5.31 | 5.37 | 0.29 | 5.25 | 5.27 | 0.91 | 5.46 | 5.60 | 0.14 | |
| Total protein foods | 5 | 4.52 | 4.34 | 0.01 | 4.52 | 4.28 | 4.51 | 4.47 | 0.55 | ||
| Seafood and plant proteins | 5 | 3.04 | 2.86 | 0.01 | 3.00 | 2.95 | 0.07 | 3.12 | 2.67 | 0.06 | |
| Fatty acids | 10 | 5.32 | 5.03 | 0.13 | 5.35 | 5.22 | 0.69 | 5.25 | 4.58 | 0.06 | |
| Moderation | |||||||||||
| Refined grains | 10 | 6.55 | 6.94 | 0.22 | 6.42 | 6.98 | 0.21 | 6.89 | 6.85 | 0.75 | |
| Sodium | 10 | 3.98 | 4.65 | 0.03 | 4.00 | 4.81 | 0.04 | 3.95 | 4.27 | 0.33 | |
| Added sugars | 10 | 7.13 | 6.22 | 6.97 | 6.04 | 7.53 | 6.64 | 0.01 | |||
| Saturated fats | 10 | 6.18 | 6.04 | 0.37 | 6.21 | 6.02 | 0.80 | 6.08 | 6.10 | 0.28 | |
a p values were tested using Wilcoxon rank-sum test.
 Fig. 2.
Median healthy eating index-2015 scores among US adults
Building on the dietary quality results, the study further investigated
macronutrient intake patterns. Mean macronutrient intakes were presented by taste
disorder and age group in Table 4. Adults with taste disorder had less total
energy intake than those without the disorder (1950.6 vs. 2086.4 kcal/d). After
adjusting for age and total energy intake, participants with taste disorders
consumed less protein (70.7 vs. 80.3 g/d) but more sugars (113.3 vs. 107.4 g/d)
compared with individuals without any disorder (all p values
| Component | Age groups | ||||||||
| All adults ( |
Adults (40–64 years) | Older adults ( | |||||||
| Any taste disorder | p valuea | Any taste disorder | p valuea | Any taste disorder | p valuea | ||||
| No | Yes | No | Yes | No | Yes | ||||
| Total energy (kcal/d) | 2086.4 | 1950.6 | 0.05 | 2178.6 | 2050.3 | 0.17 | 1846.3 | 1717.3 | 0.16 |
| Carbohydrate (g/d) | 247.4 | 240.7 | 0.04 | 256.9 | 250.0 | 0.14 | 222.9 | 218.9 | 0.12 |
| Protein (g/d) | 80.3 | 70.7 | 83.6 | 72.7 | 71.7 | 66.0 | 0.56 | ||
| Total fat (g/d) | 80.4 | 75.8 | 0.58 | 83.5 | 81.0 | 0.35 | 72.3 | 63.8 | 0.21 |
| Total sugars (g/d) | 107.4 | 113.3 | 111.4 | 117.1 | 96.9 | 104.5 | |||
| Dietary fiber (g/d) | 17.6 | 15.8 | 0.11 | 17.7 | 16.3 | 0.29 | 17.1 | 14.6 | 0.07 |
a p values were adjusted for total energy intake and age using linear regression models.
In this large representative sample of US adults aged 40 years and older, a 5.1% prevalence of taste disorders was observed. Taste disorders were more prevalent among non-Hispanic White, non-Hispanic Black, and Hispanic adults compared with other ethnic groups. Conversely, adults with higher educational attainment or family poverty ratio had a lower prevalence of taste disorders. Participants with a history of diabetes, cardiovascular disease, or cancer had a higher prevalence of taste disorder than those without these chronic diseases. In addition, the present study also found that those with taste disorders had a worse overall diet quality than those without. However, some nuances were observed in the findings: participants with taste disorders had a better dietary quality score in sodium intake. Finally, adults with taste disorders had lower total energy intake, less protein but more sugar intake compared with those without.
Similar to previous studies [22], we observed a 5.1% prevalence of taste disorders. The present study identified that non-Hispanic Whites, non-Hispanic Blacks, and Hispanics had a higher prevalence of taste disorders than other ethnic groups (including Asian and Multiracial individuals). Genetic disorders such as familial dysautonomia may cause complete or severe loss of taste papillae, leading to reduced or absent taste perception [23]. But the factors contributing to the higher taste disorders prevalence among these ethnic groups remain unclear. It remains undetermined whether the racial disparities in taste disorder prevalence are associated with genetic factors (such as genetic variations in taste receptor genes), cultural dietary patterns, or lifestyle habits [24, 25, 26]. Notably, those with higher educational attainment or family poverty ratio, both proxies for higher socioeconomic status, exhibited lower taste disorder prevalence. Existing research has shown that individuals from lower socioeconomic backgrounds were more prone to upper respiratory and middle ear infections [27], which are common causes of taste disorders. This is mainly owing to increased exposure to infectious agents and decreased host resistance to infection [27]. Moreover, low socioeconomic status is also one of the strongest predictors of illness and early death worldwide [28, 29]. These findings partially explained the disparities in taste disorder prevalence by linking educational attainment and family economic conditions to infection risk.
In our findings, adults with a history of diabetes, cardiovascular disease, or cancer exhibited a higher prevalence of taste disorders relative to their counterparts without such chronic diseases. Impaired taste perception may lead to altered eating habits: some individuals consume insufficient food and experience weight loss [10], while others add excessive seasonings (such as sugar, salt, and fats) to compensate for taste loss, further compromising dietary quality and creating a vicious cycle [2, 6]. Reduced taste sensitivity may prompt individuals to increase their discretionary sugar and salt intake to improve food palatability, increasing their risk of obesity, diabetes and cardiovascular disease [30, 31, 32, 33]. Besides, studies have pointed out that taste disorders were also associated with numerous conditions: specific cancers [34], dementia [35, 36], depression [37, 38, 39, 40]. Importantly, reverse causality may underlie the observed associations. Diabetes and cardiovascular disease are known to alter taste perception—hyperglycemia impairs sweet taste sensitivity, while hypertension impairs salt taste perception [41, 42]. These metabolic changes could exacerbate taste dysfunction, leading to compensatory behaviors (e.g., increased sugar/salt intake) that further degrade diet quality. Moreover, cancer chemotherapy medications have been reported to adversely affect taste perception and eating behaviors [43, 44]. Specifically, aggressive treatments targeting the head and neck may damage taste buds or leave bitter/metallic flavors in the mouth interfering with regular taste perception [45, 46]. These associations likely reflect bidirectional relationships, whereby taste disorders and diseases may influence each other dynamically.
Individuals with taste disorders showed poorer overall diet quality (HEI-2015 score: 54.68 vs. 56.09, p value = 0.02). This dietary discrepancy may stem from multiple mechanisms: taste disorders likely reduce the palatability of fibrous and plant-based foods [47], which are often characterized by subtle taste profiles. This may result in decreased intake of nutrient-dense foods (e.g., greens, beans, whole grains), often perceived as bland, and increased consumption of energy-dense, sweetened foods to compensate for taste loss [32, 33]. Additionally, individuals with taste disorders might avoid seafood and plant proteins due to perceived taste abnormalities, contributing to lower scores in these categories [48]. Paradoxically, taste disorder participants had better sodium intake scores, as HEI-2015 rewards lower sodium consumption. Potential mechanisms for this phenomenon include: (1) As previously mentioned, taste disorders may decrease appetite, thereby reducing overall sodium intake; (2) Abnormal salt perception weakens the “pleasure” feedback from the limbic reward pathway (amygdala, nucleus accumbens), prompting voluntary reduction of high-sodium foods [49, 50]; (3) The use of non-salt condiments (e.g., sugar, spices, salt substitutes) to improve palatability may indirectly decrease natural sodium intake [51]. Collectively, these mechanisms highlight how taste disorders disrupt dietary patterns through both sensory impairment and compensatory behaviors.
The finding showed that adults with any taste disorder had significantly lower total energy intake, less protein, and more sugars than those without the disorder. The lower energy intake was primarily driven by diminished appetite due to impaired taste perception. When basic taste stimuli (sweet, sour, bitter, salty) are blunted, the sensory appeal of food decreases, reducing the hedonic reward of eating and prompting voluntary food intake reduction [47, 49, 50]. Protein-rich foods (e.g., seafood, legumes, lean meat) may be perceived as having “fishy” or “bitter” taste due to taste distortion, leading to intentional avoidance [48, 51]. Even if individuals attempt to compensate for taste loss by increasing intake, protein-rich foods induce stronger satiety, further limiting total consumption. Sweetness is one of the most detectable tastes, and high-sugar foods provide stronger taste feedback, alleviating the hedonic deficit caused by hypogeusia [33]. Some patients exhibit “taste compensation behavior”—adding sugar to mask taste abnormalities in other foods, creating a vicious cycle of “increased sugar intake-higher taste threshold” [6]. Taken together, these findings provide a basis for the observed differences in energy and nutrient intake among individuals with taste disorders.
Integrating the findings of this study with prior research, the following
strategies could be implemented to better address taste disorders as a public
health issue: (1) For individuals of low socioeconomic status, particularly
non-Hispanic Whites, non-Hispanic Blacks, and Hispanics populations, implement
taste disorder awareness lectures, taste function screening, and nutritionist
consultation services. (2) Incorporate the NHANES-standard taste disorder
self-assessment questionnaire (e.g., “Have you experienced reduced taste in the
past 12 months?”) into routine chronic disease management for patients with
diabetes, cardiovascular diseases, or cancer during regular follow-ups. (3)
Design high-protein (target 80 g/d) and low-sugar (
The large sample size and exploration of novel correlates of taste disorder are clear strengths of this study. This study covered diverse racial, socioeconomic, and disease statuses, ensuring generalizability and providing new evidence for taste-diet interactions. However, our study also had several limitations. First, the cross-sectional design limits causal inference, potentially introducing bias in interpreting associations. Longitudinal studies should integrate data on disease onset and taste function changes to clarify temporal relationships. Second, self-reported taste disorder (past 12 months) and 24-hour diet recall may have temporal discrepancy and recall bias, this limitation could be addressed by integrating clinical taste tests with multiple-time-point dietary records and validating self-report data with objective measures. Third, since NHANES did not collect detailed information on the types of taste disorders, we did not distinguished hypogeusia, ageusia, and dysgeusia, leading to overgeneralization of the results. Last, owing to the lack of NHANES data on oral health, medications, and appetite-affecting disorders, we were unable to analyze these potential confounders, which might result in residual confounding. Future studies should include oral examinations, medication history assessments, and mental health screenings, controlling for additional confounders via multivariable models.
In conclusion, in this larger sample of US adults a high prevalence of taste disorder was identified and thus justifying further research into this area. It may be prudent to target interventions towards those from a low socioeconomic status and those who are non-Hispanic White, non-Hispanic Black, and Hispanic. Clinicians and dietitians should be made aware that those with diabetes, cardiovascular disease, and cancer are more likely to experience taste disorders and incorporate this into disease management and dietary quality improvement. Due to the limitations of the cross-sectional design, this study cannot establish causality between taste disorders and dietary intake or patterns, underscoring the need for longitudinal studies to confirm the observed relationships.
Data collected for this study, including de-identified individual participant data and a data dictionary defining each field in the dataset, as well as additional related documents such as the study protocol, will be available to others upon publication, without any restrictions, from the website https://wwwn.cdc.gov/nchs/nhanes/Default.aspx.
ZZ analyzed the data and drafted original manuscript; NW and RW were responsible for the acquisition of experimental data, including sample collection and preliminary data sorting; LY participated in the analysis and interpretation of experimental results; NW, RW, and LY provided help and revised manuscript; JL, CC and XZ designed and supervised the study. All authors have contributed to the editorial changes made to the manuscript. All authors read and approved the final manuscript. All authors have participated sufficiently in the work and agreed to be accountable for all aspects of the work.
Not applicable.
Not applicable.
This work is supported by National Key Clinical Discipline, National Natural Science Foundation of China (82470696), Guangdong Basic and Applied Basic Research Foundation (2024A1515010956), the program of Guangdong Provincial Clinical Research Center for Digestive Diseases (2020B1111170004), and Guangzhou Science and Technology Program (2024A04J6400).
The authors declare no conflict of interest.
References
Publisher’s Note: IMR Press stays neutral with regard to jurisdictional claims in published maps and institutional affiliations.