
 , Khadije Hajizadeh 1, Azizeh Farshbaf-Khalili 2,*
 , Mahdi Mahdipour 3, Mahnaz Shahnazi 1,*
1 Department of Midwifery, Tabriz University of Medical Sciences, 51368 Tabriz, Iran
2 Physical Medicine and Rehabilitation Research Centre, Aging Research Institute, Tabriz University of Medical Sciences, 51368 Tabriz, Iran
3 Stem Cell Research Center, Department of Reproductive Biology, Faculty of Advanced Medical Sciences, Tabriz University of Medical Sciences, 51368 Tabriz, Iran
Abstract
Polycystic ovary syndrome (PCOS) is a leading endocrine disorder in reproductive-aged women. While dietary interventions are widely advocated, the distinct roles of adiposity and dietary inflammation in driving PCOS phenotypes remain unclear. Therefore, this study aimed to dissect the contributions of body mass index (BMI) and dietary inflammatory index (DII) to hyperandrogenism and insulin resistance (IR) in PCOS.
This cross-sectional study included 115 women with PCOS who visited gynecology and infertility clinics affiliated with Tabriz University of Medical Sciences. Data from the DII were computed using a validated 168-item semi-quantitative food frequency questionnaire. The free androgen index (FAI) was calculated as follows: (total testosterone (nmol/L)/SHBG (nmol/L)) × 100. The relationships between the BMI and DII and FAI, the Homeostasis model assessment of insulin resistance (HOMA-IR), the Homeostasis model assessment of β-cell function (HOMA-β), the quantitative insulin sensitivity check index (QUICKI), sex hormone binding globulin (SHBG), testosterone, fasting insulin (FI), and fasting blood sugar (FBS) were assessed using descriptive and analytical statistics. The general linear model was applied to adjust for confounders.
The mean (standard deviation, SD) BMI and FAI among subjects were 26.27 (3.82) kg/m2 and 1.5 ± 1.5%, respectively. The median DII (range: –3.66 (most anti-inflammatory) to 4.31 (most pro-inflammatory)) was 0.75. Significant direct relationships were observed between the BMI and FAI (p < 0.001), HOMA-IR (p = 0.008), QUICKI (p = 0.002), testosterone (p < 0.001), FI (p = 0.017), FBS (p = 0.004), and Ferriman Gallwey score (p < 0.001). No significant associations were found between DII and the aforementioned biomarkers (p > 0.05). A normal BMI was associated with a significantly lower hirsutism score (β = –3.94, p = 0.003), fasting blood sugar (β = –10.02, p < 0.001), fasting insulin (β = –4.05, p = 0.042), HOMA-β (β = –1.20, p = 0.012), QUICKI (β = –0.19, p = 0.015), testosterone (β = –0.34, p < 0.001), and free androgen index (β = –0.96, p = 0.025) compared to an obese BMI after adjusting for confounders. No significant associations were observed for DII categories (median split) across any biomarkers or hirsutism.
Adiposity (measured by BMI)—not dietary inflammation—was independently associated with key PCOS manifestations, demonstrating significant positive relationships with hyperandrogenism markers (FAI, testosterone), insulin resistance (HOMA-IR), and clinical hirsutism. A normal BMI was correlated with clinically meaningful reductions in metabolic-androgen parameters compared to obesity. Thus, weight loss and a generally healthy diet may need to be combined to impact PCOS features significantly.
Keywords
- polycystic ovary syndrome
- insulin resistance
- hormonal disorders
- life style
- body mass index
- dietary inflammatory index
Polycystic Ovary Syndrome (PCOS) is a multifaceted endocrine disorder affecting 6–13% of women of reproductive age globally, making it the most prevalent hormonal imbalance in this population [1, 2]. Recognized by the Rotterdam criteria, PCOS diagnosis is based on at least two of three features: oligo-anovulation, clinical or biochemical hyperandrogenism, and polycystic ovarian morphology on ultrasound [3]. Beyond its reproductive manifestations, PCOS is increasingly characterized as a systemic metabolic disorder, with insulin resistance (IR), chronic low-grade inflammation, and visceral adiposity acting as interconnected drivers of its pathophysiology [4, 5]. Emerging evidence underscores that women with PCOS face a fourfold increased risk of type 2 diabetes mellitus (T2DM), a 2.7-fold elevated cardiovascular disease (CVD) risk, and a higher prevalence of non-alcoholic fatty liver disease (NAFLD) compared to age-matched controls [6, 7, 8, 9, 10].
The hyperandrogenic milieu of PCOS arises from both ovarian theca cell hypersensitivity to luteinizing hormone (LH) and adrenal androgen excess, compounded by reduced sex hormone-binding globulin (SHBG) levels due to IR [11, 12]. Free testosterone, quantified through the free androgen index (FAI), serves as a critical biomarker of hyperandrogenism and correlates strongly with hirsutism, acne, and anovulation [13, 14]. Concurrently, IR—present in 65–80% of women with PCOS regardless of body mass index (BMI)—exacerbates androgen synthesis via insulin-mediated stimulation of ovarian theca cells and inhibition of hepatic SHBG production [15, 16, 17]. The Homeostasis Model Assessment of Insulin Resistance (HOMA-IR) and Quantitative Insulin Sensitivity Check Index (QUICKI) are widely employed to assess these metabolic derangements [18, 19, 20].
Mounting evidence implicates chronic inflammation as a central component in PCOS
pathophysiology. Women with PCOS exhibit elevated serum levels of
pro-inflammatory cytokines (IL-6, TNF-
Dietary modulation of inflammation has emerged as a promising therapeutic target
in PCOS. The Dietary Inflammatory Index (DII), a validated tool assessing the
inflammatory potential of diets, quantifies the cumulative effect of 45 food
parameters on circulating IL-1
While obesity amplifies PCOS severity through adipokine dysregulation (leptin resistance, reduced adiponectin) and androgen aromatization in adipose stroma [31], the independent contribution of dietary inflammation remains controversial. Recent Mendelian randomization studies suggest that genetic predisposition to IR accounts for 22–30% of the PCOS risk, highlighting the critical role of gene-diet interactions [32]. Nevertheless, current literature suffers from three key gaps: (1) limited data on DII’s association with FAI and IR in PCOS-specific cohorts, (2) insufficient exploration of BMI-DII synergism in driving metabolic-hormonal dysregulation, and (3) reliance on cross-sectional designs unable to establish temporal causality.
This study addresses these gaps by investigating the dual impact of BMI and DII on FAI, IR, and associated metabolic parameters in a well-phenotyped PCOS women. Therefore, this study aimed to investigate the relationship of BMI and DII with FAI and IR in women with PCOS.
This cross-sectional study enrolled 115 women aged 19–45 years diagnosed with
PCOS according to the Rotterdam Criteria [33], recruited from the infertility and
gynecology clinics of Al-Zahra and Taleghani Teaching Medical Centers of Tabriz
between June 2019 and January 2022. Ethical approval was obtained from the
(Ethics Approval and Consent to Participate: IR.TBZMED.REC.1398.458, adhering to
the Declaration of Helsinki (2013 revision) [34]. Participants provided written
informed consent after a detailed briefing on study objectives and procedures.
Participants were required to meet the following inclusion criteria: (1)
confirmation of PCOS diagnosis (Rotterdam Criteria) within the preceding year,
(2) absence of pregnancy or lactation, (3) no history of endocrine disorders such
as thyroid dysfunction, Cushing’s syndrome, congenital adrenal hyperplasia, or
other endocrine disorders (verified by serum TSH, cortisol, and
17-hydroxyprogesterone levels), and (4) no history of insulin-sensitizing agents,
hormonal contraceptives, or anti-androgen use within 90 days prior to enrollment.
Exclusion criteria included: (1) diagnosis of type 1 or type 2 diabetes (HbA1c
A demographic and obstetric questionnaire was administered, consisting of items addressing age, educational attainment, occupation, duration of PCOS, previous treatments, the first day of the last menstrual cycle, menstrual cycle pattern, BMI, medications used by participants, etc. This questionnaire was developed based on study objectives and a review of scientific literature. It was then sent to 10 gynecology, obstetrics, and nutrition professors to assess content and face validity; revisions were incorporated based on feedback before implementation.
Anthropometric measurements were performed by trained clinicians using
standardized protocols. Body weight was measured to the nearest 0.1 kg using a
calibrated SECA digital scale (Hamburg, Germany), with participants wearing light
clothing and no shoes. Height was assessed with a wall-mounted stadiometer (SECA;
precision
Hirsutism was evaluated using the Ferriman-Gallwey scoring system, where two independent trained researchers, blinded to participant data, assessed hair growth across nine body regions. The scoring system evaluates hirsutism in nine areas: upper lip, chin, chest, upper back, waist, upper abdomen, lower abdomen, arms, and thighs. Each region is scored as follows: 0 = no hirsutism, 1 = mild, 2 = moderate, 3 = severe, and 4 = very severe hirsutism. Total scores range from 0 to 36. Inter-observer agreement was confirmed with a mean kappa value of 0.744 for the nine body areas [35].
Dietary intake was assessed using a validated and reliable semi-quantitative food frequency questionnaire (FFQ) capturing consumption over the past year. This FFQ includes 168 food items, with consumption frequency solicited in standard portion sizes (daily, weekly, monthly, or annually) by a trained investigator. Reported food quantities were converted to grams per day using the Iranian Household Measures Manual [36]. Nutrient intake was analyzed using Nutritionist IV software (N-Squared Computing, Oregon, USA) supplemented with the Iranian Food Composition Database. The DII was calculated according to Shivappa et al. (2014) [25], incorporating 44 food parameters with empirically derived inflammatory weights. Z-scores for each dietary component were computed relative to a global reference database and adjusted for total energy intake using the residual method to minimize confounding.
Fasting blood samples were collected between 8:00 and 10:00 AM during the early
follicular phase (days 3–5 of the menstrual cycle) or following confirmation of
amenorrhea (negative
• Total testosterone and sex hormone-binding globulin (SHBG): Quantified via
electrochemiluminescence immunoassay (Siemens ADVIA Centaur XP; inter-assay CV
• Fasting insulin: Measured using a chemiluminescent microparticle immunoassay
(DiaSorin LIAISON; CV • Fasting blood glucose (FBG): Analyzed via the glucose oxidase method (Pars
Azmoun Autoanalyzer; CV
Insulin resistance and sensitivity indices were derived as follows:
• Homeostasis Model Assessment for Insulin Resistance (HOMA-IR): (fasting insulin
[µlU/mL] • Quantitative Insulin Sensitivity Check Index (QUICKI): 1/(log(fasting insulin)
+ log(fasting glucose)) [38]. • Free Androgen Index (FAI): (Total testosterone [nmol/L]/SHBG [nmol/L])
The sample size was determined a priori using G*Power software (Version 3.1.9.4,
Düsseldorf, Germany) based on two primary outcomes: serum insulin and SHBG
levels. For SHBG, we utilized the correlation coefficient (r = 0.293) between
SHBG and total energy intake reported by Altieri et al. [40], with
Laboratory tests were conducted using standardized kits approved by the reference laboratory, ensuring accuracy and reproducibility. All kits were manufactured under strict quality control protocols, and instruments such as ELISA readers were calibrated and validated by the reference laboratory. Intra- and inter-assay coefficients of variation (CV) were maintained below 5% for all biomarkers, including testosterone, SHBG, and insulin, confirming the reliability of the results.
Normality of data distribution was assessed via the Kolmogorov-Smirnov test.
Descriptive statistics included mean
Inferential analyses included Pearson’s/Spearman’s correlations, independent
t-tests, Mann-Whitney U, Kruskal-Wallis, and one-way ANOVA. The general
linear model (GLM) adjusted for confounders (parity, income, marital status,
education). Analyses used SPSS version 24 (IBM Corp.), significance at p
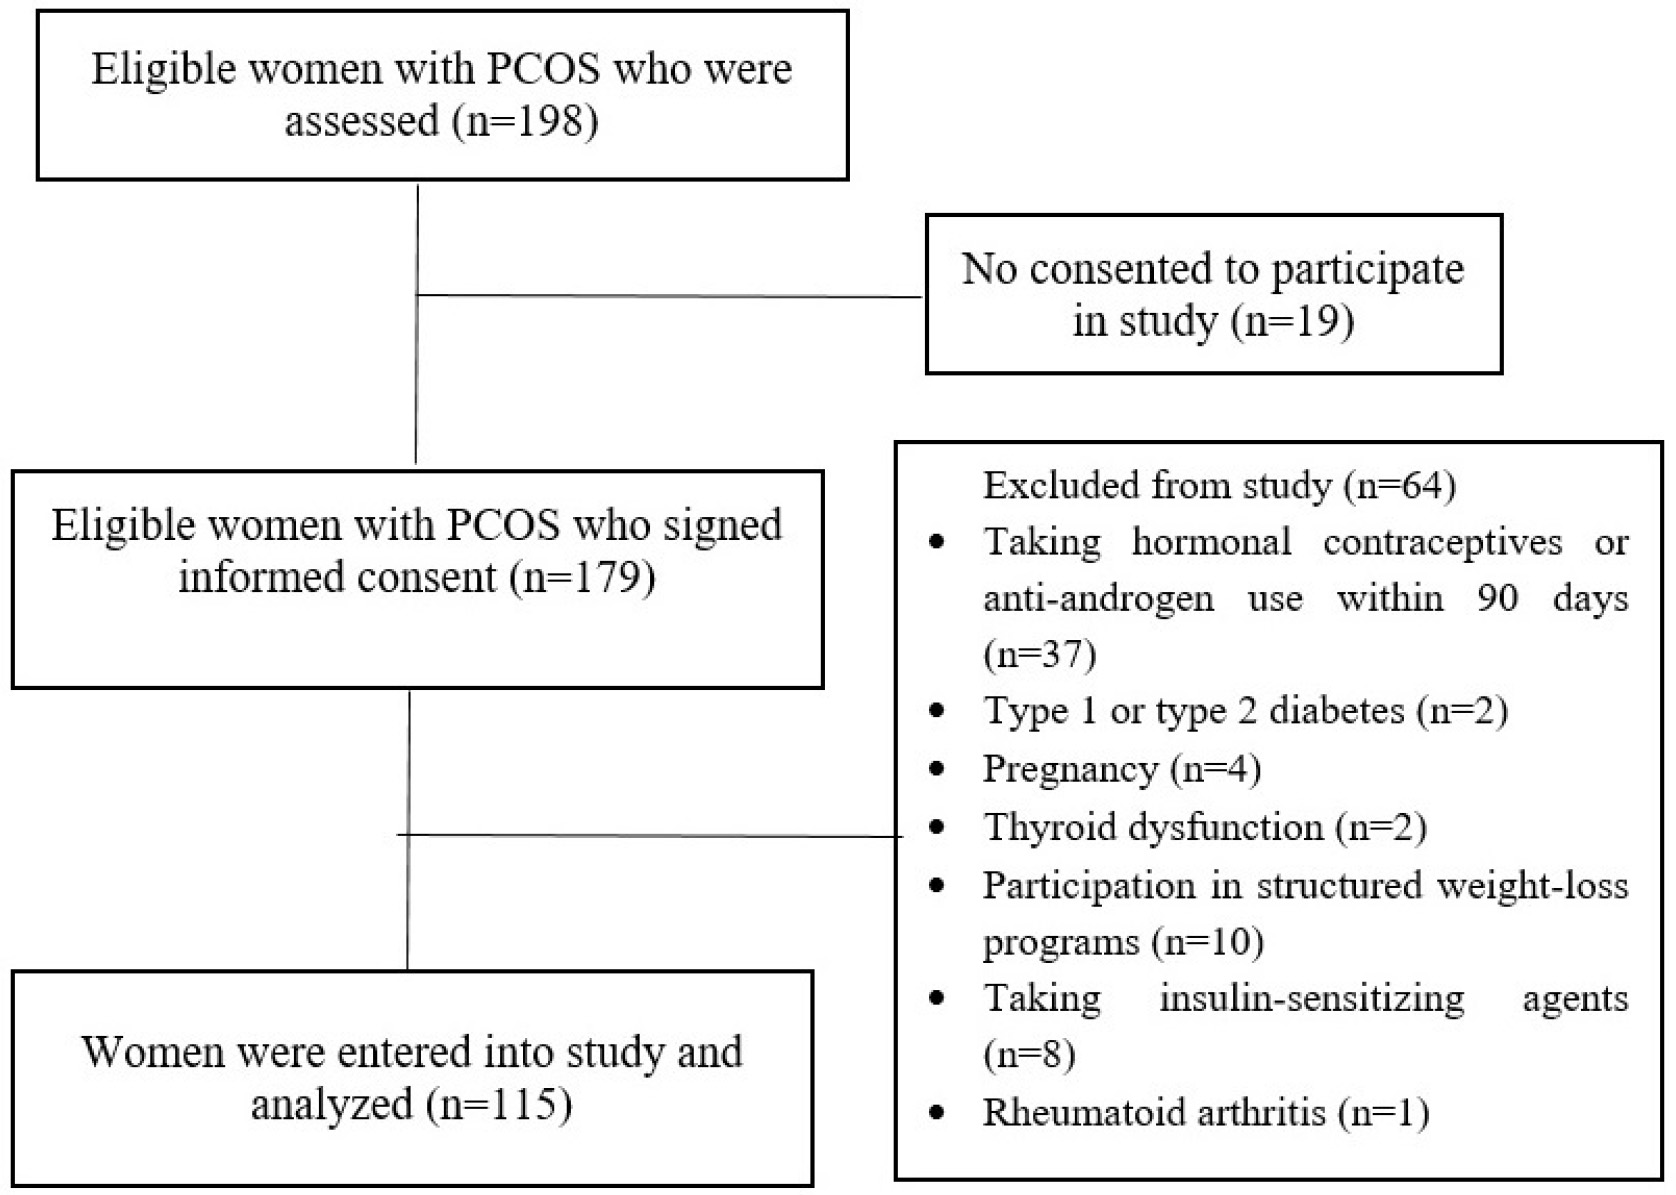
The participant selection process is illustrated in Fig. 1. Among 115 women
included in the final analysis, the mean (
 Fig. 1.
Flow chart of selecting participants.
DII showed no significant relationships with menstrual cycle pattern,
pregnancy/abortion history, or PCOS duration (p
| Characteristic | Number (%) | DII | p-value | BMI | p-value | |
| Mean |
Mean |
Mean | ||||
| Age (years) | 29.28 |
0.77 |
0.718† | 26.27 |
0.406† | |
| Marital status | 0.858‡ | 0.069‡ | ||||
| Single | 35 (30.4%) | 0.81 |
25.29 |
|||
| Married | 80 (69.5%) | 0.75 |
26.7 |
|||
| Education | 0.260§ | 0.183§ | ||||
| Less than diploma | 12 (10%) | 1.54 |
26.38 |
|||
| Diploma | 39 (33.9%) | 0.78 |
25.37 |
|||
| University | 64 (55.6%) | 0.62 |
26.80 |
|||
| BMI (kg/m²) | 26.3 |
0.77 |
0.206† | - | ||
| Normal (18.5–24.9) | 45 (39.1%) | 0.89 |
||||
| Overweight (25–29.9) | 54 (46.9%) | 0.84 |
||||
| Obese ( |
16 (13.9%) | 0.16 |
||||
| Occupation | 0.845¥ | 0.360¥ | ||||
| Unemployed | 2 (1.7%) | 0.93 |
26.35 |
|||
| Housewife | 78 (67.8%) | 0.70 |
26.14 |
|||
| Work from home | 29 (25.2%) | 0.98 |
28.12 |
|||
| Work outside home | 5 (4.3%) | 0.27 |
26.60 |
|||
| Retired | 1 (0.9%) | 2.04 |
20 |
|||
| Family income | 0.152 |
0.054 | ||||
| Sufficient | 106 (92.2%) | 0.70 |
26.47 |
|||
| Insufficient | 9 (7.8%) | 1.59 |
23.92 |
|||
| Menstrual cycle | 0.623¥ | 0.385§ | ||||
| Amenorrhea | 13 (11.3%) | 1.31 |
26.48 |
|||
| Regular | 14 (12.2%) | 0.92 |
25.67 |
|||
| Oligomenorrhea | 86 (74.8%) | 0.65 |
26.42 |
|||
| Gravidity | 0.583¥ | 0.419¥ | ||||
| 0 | 53 (46.1%) | 0.80 |
26.21 |
|||
| 1 | 26 (22.6%) | 0.99 |
25.91 |
|||
| 2 | 24 (20.9%) | 0.98 |
27.29 |
|||
| 12 (10.4%) | 1.23 |
25.22 |
||||
| Parity£ | 0.017¥ | 0.798¥ | ||||
| 0 | 57 (49.6%) | 0.77 |
26.44 |
|||
| 1 | 32 (27.8%) | 1.12 |
25.74 |
|||
| 2 | 20 (17.4%) | –0.19 |
26.72 |
|||
| 3 | 6 (5.2%) | 2.04 |
26.07 |
|||
| DII |
53 (46.1%) | - | 26.38 |
0.827‡ | ||
| DII |
62 (53.9%) | - | 26.20 |
|||
Abbreviations: DII, Dietary Inflammatory Index; BMI, Body Mass Index.
†Pearson correlation, ‡Independent t-test,
§Kruskal-Wallis, ¥One-way ANOVA,
Bold: Statistically significant (p
£ ANCOVA, adjusting for age as a confounder, showed similar results (p = 0.014).
DII ranged from –3.66 (most anti-inflammatory) to 4.31 (most pro-inflammatory), with 53.9% of participants scoring above the median (Table 2).
| Percentile | DII value |
| Maximum | 4.31 |
| 90th | 3.13 |
| 75th | 2.23 |
| Median | 0.75 |
| 25th | –0.69 |
| 10th | –1.61 |
| Minimum | –3.66 |
Abbreviation: DII, Dietary Inflammatory Index.
The mean fasting blood sugar (FBS), fasting insulin (FI), testosterone, Sex
Hormone Binding Globulin (SHBG), Homeostasis Model Assessment of
| Biomarker | Median | Interquartile range (IQR) | Mean |
| Fasting blood sugar (FBS) | 93 mg/dL | 10 | 93.5 |
| Fasting insulin (FI) | 6.7 µIU/mL | 6.5 | 9.2 |
| Testosterone | 0.6 ng/mL | 0.6 | 0.6 |
| SHBG | 54 nmol/L | 51 | 65.4 |
| HOMA- |
1.6 | 1.6 | 2.2 |
| HOMA-IR | 84.8 | 77.3 | 106.3 |
| QUICKI | 1.3 | 0.4 | 1.4 |
| Free androgen index (FAI) | 0.9% | 1.3 | 1.5 |
| Hirsutism score | 11 | 6 | 12.9 |
Abbreviations: FBS, Fasting Blood Sugar; FI, Fasting Insulin; SHBG, Sex
Hormone-Binding Globulin; HOMA-IR, Homeostasis Model Assessment of Insulin
Resistance; HOMA-
No significant correlations were found between DII and FAI (r = 0.089,
p = 0.346), HOMA-
| Variable | Hirsutism score | FBS (mg/dL) | FI (µIU/mL) | HOMA- |
HOMA-IR | QUICKI | Testosterone (ng/mL) | SHBG (nmol/L) | FAI | |
| BMI (Continuous) | ||||||||||
| Correlation coefficient | 0.322 | 0.267 | 0.223 | 0.247 | 0.100 | 0.280 | 0.327 | –0.154 | 0.330 | |
| p-value† | 0.004 | 0.017 | 0.008 | 0.289 | 0.002 | 0.100 | ||||
| DII (Continuous) | ||||||||||
| Correlation coefficient | 0.053 | –0.080 | 0.055 | 0.070 | 0.159 | 0.061 | –0.108 | 0.049 | –0.089 | |
| p-value‡ | 0.778 | 0.395† | 0.563 | 0.450 | 0.090 | 0.515† | 0.249 | 0.603 | 0.346 | |
| DII (Categorical) | ||||||||||
| p-value¥ | 0.869 | 0.463 |
0.504 | 0.561 | 0.329 | 0.484 |
0.214 | 0.829 | 0.630¥ | |
Abbreviations: BMI, Body Mass Index; DII, Dietary Inflammatory
Index; FBS, Fasting Blood Sugar; FI, Fasting Insulin; SHBG, Sex Hormone-Binding
Globulin; HOMA-IR, Homeostasis Model Assessment of Insulin Resistance;
HOMA-
†Pearson’s correlation (continuous variables),
‡Spearman’s correlation (non-parametric data),
* We used General Linear Model to adjust the probable confounding role of parity for the relation of DII with Metabolic-Hormonal Biomarkers. However, no statistically significance results were observed.
BMI correlated positively and significantly with FAI (r =
0.33, p
General linear models revealed that normal BMI (vs. obesity) was associated with
significantly lower hirsutism score (
| Different treatments | €Adjusted |
p-value | £Adjusted |
p-value | ||
| 95% confidence interval | 95% confidence interval | |||||
| Categorized BMI | Categorized DII | |||||
| Hirsutism Score | Normal to obese Overweight/obese |
–3.94 (–6.51 to –1.38) | 0.003 | DII |
–0.25 (–1.96 to 1.46) | 0.775 |
| –1.55 (–4.05 to 0.94) | 0.221 | |||||
| FBS (mg/dL) | Normal to obese Overweight/obese |
–10.02 (–15.14 to –4.91) | DII |
–1.01 (–4.45 to 2.43) | 0.562 | |
| –8.63 (–13.61 to –3.64) | ||||||
| FI (µIU/mL) | Normal to obese Overweight/obese |
–4.05 (–7.95 to –0.15) | 0.042 | DII |
–0.44 (–2.92 to 2.03) | 0.723 |
| –1.91 (–5.71 to 1.89) | 0.322 | |||||
| HOMA- |
Normal to obese Overweight/obese |
–1.20 (–2.13 to –0.27) | 0.012 | DII |
–0.17 (–0.77 to 0.43) | 0.570 |
| –0.73 (–1.64 to 0.174) | 0.112 | |||||
| HOMA-IR | Normal to obese Overweight/obese |
–10.94 (–47.8 to 25.92) | 0.558 | DII |
–11.65 (–34.16 to 10.86) | 0.307 |
| 0.04 (–35.88 to 35.95) | 0.998 | |||||
| QUICKI | Normal to obese Overweight/obese |
–0.19 (–0.34 to –0.03) | 0.015 | DII |
–0.04 (–0.14 to 0.05) | 0.360 |
| –0.09 (–0.24 to 0.05) | 0.191 | |||||
| Testosterone (ng/mL) | Normal to obese Overweight/obese |
–0.34 (–0.54 to –0.14) | DII |
0.04 (–0.09 to 0.18) | 0.516 | |
| –0.18 (–0.38 to 0.01) | 0.066 | |||||
| SHBG (nmol/L) | Normal to obese Overweight/obese |
3.99 (–21.07 to 29.07) | 0.753 | DII |
4.0 (–11.92 to 19.92) | 0.619 |
| –8.25 (–32.68 to 16.18) | 0.505 | |||||
| FAI | Normal to obese Overweight/obese |
–0.96 (–1.80 to –1.21) | 0.025 | DII |
0.45 (–0.09 to 1.0) | 0.105 |
| 0.11 (–0.71 to 0.93) | 0.789 | |||||
Abbreviations: BMI, Body Mass Index; DII, Dietary Inflammatory
Index; FBS, Fasting Blood Sugar; FI, Fasting Insulin; SHBG, Sex Hormone-Binding
Globulin; HOMA-IR, Homeostasis Model Assessment of Insulin Resistance;
HOMA-
BMI (kg/m2) categorized as normal (18.5–24.9), overweight (25–29.9), and
obese (
€ General Linear Model adjusted for family income, marital status, and education level.
£ General Linear Model adjusted for parity and family income.
Bold p-values indicate the statistical significant (
This was a cross-sectional descriptive study that investigated the relationship
between BMI and DII with FAI and IR (HOMA-IR, HOMA-
The robust correlation between BMI and hyperandrogenism mirrors findings from
global cohorts. For instance, Cupisti et al. [41] demonstrated that
obesity amplifies androgenicity through reduced SHBG and elevated free
testosterone—a phenomenon attributed to adipose tissue-driven upregulation of
17
The link between BMI and IR (evidenced by HOMA-
PCOS is associated with chronic low-grade inflammation [49]. This inflammatory state involves immune cell dysfunction, cytokine imbalance, and autoantibody production, contributing to insulin resistance and hyperandrogenism [50]. Despite mechanistic plausibility, DII showed no association with IR or hyperandrogenism—a result contrasting with studies linking pro-inflammatory diets to metabolic syndrome [51, 52, 53, 54]. Several factors may explain this discrepancy. First, chronic inflammation in PCOS is predominately driven by visceral adipose tissue as this accounts for ~30% of circulating IL-6 [55]. This adipose-derived inflammation may act as a confounding exposure, masking dietary influences. Second, the Iranian diet is rich in anti-inflammatory foods (e.g., legumes, vegetables, nuts, oils, and spices including saffron [56, 57]), which may counteract the pro-inflammatory effects of high-DII diets. Third, the DII, based on 44 food parameters, may lack sensitivity to region-specific anti-inflammatory foods such as saffron and pistachios [58]. Additionally, the absence of direct inflammatory biomarkers (e.g., IL-6, CRP) limited our ability to assess dietary effects on phenotypes [59]. We believe that although pro-inflammatory diets may be implicated in PCOS development, their role in modulating established PCOS phenotypes is likely overshadowed by adiposity- driven inflammation.
Notably, two recent case-control studies [60, 61] reported that high DII increases PCOS risk, but neither explored intermediary mechanisms such as IR or FAI. Another study found higher interleukin-6 levels in women with PCOS versus controls, despite comparable DII values [62]. Research in China linked pro-inflammatory diets to elevated PCOS risk, with DII positively correlated with inflammatory markers (platelet-to-lymphocyte and neutrophil-to-lymphocyte ratios) [54]. None of these studies investigated DII’s relationship with IR or FAI in PCOS.
Our null findings suggest that while pro-inflammatory diets may contribute to PCOS development, their role in modulating established PCOS phenotypes is minimal relative to adiposity.
The parity-DII association (higher DII in multiparous women) introduces a novel dimension to PCOS research. Notably, DII was higher in multiparous vs. nulliparous women independent of age. Postpartum metabolic shifts such as persistent IR, weight retention, and altered ghrelin signaling may predispose multiparous women to pro-inflammatory dietary patterns [63, 64, 65, 66]. Additionally, cultural factors in Iran, where multiparity is often associated with sedentary lifestyles and calorie-dense traditional diets, could confound this relationship. Further research is needed to disentangle biological, behavioral, and sociocultural contributors.
While this study benefits from rigorous exclusion criteria and standardized assays, its cross-sectional design precludes causal inferences. Temporal relationships between BMI and DII with outcomes cannot establish causal effects. Future research should prioritize longitudinal and interventional designs to clarify temporal relationships between diet, adiposity, and PCOS progression. Residual confounding by unmeasured variables (e.g., the amount of physical activity, stress, sleep quality, environmental toxins) may obscure diet-outcome relationships and insulin sensitivity. Given that sleep disturbances in women have demonstrated associations with heightened inflammatory markers, IR, and psychosocial distress [67, 68], coupled with evidence indicating physical activity’s critical role in IR management among PCOS populations [69], we suggest that future research measure these variables in addition to DII. In addition, although BMI is a practical and clinically useful measure as an adiposity metric, visceral adiposity (via waist circumference or waist-to-hip ratio) is specifically linked to metabolic inflammation in PCOS. It might be helpful to report participant waist circumference or waist-to-hip ratio data alongside BMI in future studies.
Notably, the calculation of DII through food FFQs is susceptible to recall
bias; concurrent validation using systemic inflammatory biomarkers (e.g., IL-6,
TNF-
According to our findings, adiposity is the main factor influencing variation in hyperandrogenism and metabolic dysregulation in PCOS once the condition is established, with dietary inflammatory potential not demonstrating any independent correlation. Elevated BMI was consistently associated with worsened FAI, insulin resistance, and hirsutism, reinforcing weight management as a cornerstone of PCOS care. After adjusting for sociodemographic confounders, normal BMI correlated with clinically meaningful reductions in metabolic-androgen parameters compared to obesity. By demonstrating that weight status has a greater impact on PCOS metabolic-hormonal profiles than diet quality (in terms of inflammation), these findings suggest that weight loss combined with a generally healthy diet may be necessary to significantly affect PCOS features.
PCOS, Poly cystic ovarian syndrome; LH, Luteinizing hormone; FSH, Follicle stimulating hormone; BMI, Body mass index; FAI, Free Androgen Index; FI, Fasting Insulin; DHEA, Dehydro Epi Androsteron Sulfate; SHBG, Sex Hormone Binding Globulin; DII, Dietary Inflammation Index; HOMA-IR, Homeostasis Model Assessment of Insulin Resistance; HOMA-
The datasets generated and/or analyzed during the current study are not publicly available due to limitations of ethical approval involving the patient data and anonymity but are available from the corresponding author on reasonable request.
NG and AFK were responsible for drafting the protocol, data collection, data analysis and interpretation and writing of the final manuscript. MS, KH, and MM were involved in drafting the protocol, data collection and editing the final version of the manuscript. All authors have contributed to the editorial changes made to the manuscript. All authors read and approved the final manuscript. All authors have participated sufficiently in the work and agreed to be accountable for all aspects of the work.
This study was approved by the Ethics committee of Tabriz University of Medical Sciences with the code of IR. TBZMED. REC. 1398.458. All participants were ensured about the matter of confidentiality. Also, informed written consent was obtained from all participants and parent/legally authorized representatives of illiterate participants. All methods were performed in accordance with the Declaration of Helsinki. All of the methods were carried out in accordance with relevant guidelines and regulations.
The researchers hereby thank all the women participating in this study. We also appreciate the assistance and financial support provided by the Research Department of Tabriz University of Medical Sciences.
The Vice-Chancellor for Research and Technology, Tabriz University of Medical Sciences has funded the original research (Grant No: 62966).
The authors declare no conflict of interest.
References
Publisher’s Note: IMR Press stays neutral with regard to jurisdictional claims in published maps and institutional affiliations.