


 , María Amigo-Bravo 1, Lisa Ursula Werner 2
1 Faculty of Medicine and Health Sciences, Catholic University of Valencia San Vicente Mártir, 46001 Valencia, Spain
2 Faculty of Teaching and Science of Education, Catholic University of Valencia San Vicente Mártir, 46001 Valencia, Spain
Abstract
This study aimed to investigate how education centering around nutrition can influence diet quality and health-related behavior in the Spanish population.
A descriptive cross-sectional study was performed, and the validated NutSo-HH (Nutritional and Social Healthy Habits) questionnaire was administered. The overall sample was 1087 Spanish adults, 48.11% of whom had studied or were studying a degree in health sciences, compared to 51.89% who had no studies or were studying another subject. Differences between groups were assessed using statistical analyses.
The results indicated that people with higher nutrition education exhibited an increased consumption of vegetables (3.64 vs. 3.50), cereals (3.09 vs. 2.70), legumes (2.19 vs. 2.10) and water (3.47 vs. 3.34) (all p < 0.001) and a lower consumption of red meat (1.60 vs. 1.73) (p < 0.001). No statistically significant differences were observed in the consumption of the remaining analyzed food products. People with health literacy reported better self-perceived health (3.94 vs. 3.76) (p < 0.001) and had a lower body mass index (BMI) (23.68 kg/m2 vs. 24.75 kg/m2) (p < 0.001) than those without health literacy. No significant differences were observed in the time spent in sports practice and sedentary lifestyle or in variables related to eating disorders.
This study concluded that although health science education showed some benefits in eating habits and perceptions of well-being, did not significantly influence all aspects of nutritional habits and lifestyles. Further studies with a more holistic approach could provide a more complete picture of the influence of health education on overall well-being.
Keywords
- healthy lifestyle
- diet
- health education
- sociodemographic factors
- survey
- Spain
During the recent pandemic caused by the SARS‑CoV‑2, increased stress and anxiety, as well as a lack of regular routines and structure in daily life, has led to increased consumption of high-calorie comfort foods as a way of coping with negative emotions. In addition, social distancing and isolation may have reduced opportunities to access healthy foods and engage in physical activity, which may have contributed to uncontrolled eating. The emotional pressures and uncertainty caused by this situation have led to an increase in unhealthy eating behaviors and a decrease in the motivation to exercise [1, 2, 3, 4, 5]. This highlights how difficult it is to make beneficial changes in stressful situations and emphasizes the importance of not only teaching about healthy habits, but also providing emotional and psychological support to truly adopt a healthy lifestyle [6, 7]. On one hand, there is increased interest in maintaining or fostering healthy habits post-pandemic [8], while on the other, many individuals continue to struggle with a lack of eating control [9, 10, 11], raising questions about the causes of this phenomenon. A possible explanation could be the lack of adequate information and knowledge about nutrition and healthy lifestyle habits among the general population.
Beyond the impact of COVID-19, another major global public health problem is obesity. According to the World Health Organization (WHO), more than 2.5 billion adults worldwide are overweight and more than 890 million are obese [12]. In Europe, almost 60% of all adults are in the overweight or obese category, and prevalence rates are increasing in many countries due to significant changes in dietary practices and lifestyle behaviors [13].
In Spain, as in other European nations, the obesity epidemic is largely influenced by socioeconomic disparities and changing dietary and lifestyle patterns [14]. In addition, the increasing prevalence of sedentary behaviors, decreased physical activity and alterations in sleep-wake cycles exacerbate the associated risks [15, 16].
Unhealthy behaviors are often rooted in a complex and ramified web of causes involving structural and environmental factors, such as limited access to healthy food choices due to geography, socio-economic disparities, industrial promotion of processed foods, and cultural norms and attitudes that influence dietary choices, physical activity levels and overall lifestyle [17, 18, 19, 20]. One crucial strategy to improve the health and habits of the population is undoubtedly education.
It is important to consider that nutritional education is a crucial factor in the adoption of healthy eating habits [21]. The influence of education and knowledge on nutritional and lifestyle habits has been extensively studied, demonstrating that nutritional education can lead to significant improvements in diet quality and health-related behaviors [22, 23, 24, 25, 26, 27]. For example, a study conducted in school children in Croatia showed that nutritional education programs increased nutrition knowledge and improved both the nutritional status and the active and sedentary lifestyle habits of participants [24].
In addition, long-term research such as the Doetinchem cohort study has revealed that individual changes in lifestyle, observed through longitudinal data, can provide more nuanced insights than simply analyzing average population trends. The mentioned study highlights the importance of following individuals over time to better understand the cumulative effects of education and lifestyle interventions on overall health [26].
Another relevant study discussed how nutrition education is crucial for managing chronic conditions such as type 2 diabetes in Indonesia, highlighting the need for well-structured educational programs to improve the nutritional practices of health professionals and, by extension, their patients [27].
In a similar context, it has been observed that dietary patterns and diet quality in older adults can be predicted and significantly modified through factors such as education. The study showed a positive association between higher education and better diet quality, underlining the role of nutrition education as a predictor of reduced cardiometabolic risk and other health problems [28].
Another explanation could be that in some cases, the nutritional information available may be confusing or contradictory, making it difficult for people to make appropriate dietary choices. In addition, the lack of access to reliable educational resources and the spread of misconceptions and false beliefs about nutrition in the media and social networks can contribute to confusion and dietary mismanagement [29].
It is essential to emphasize this point, as we are nowadays continuously exposed to a great deal of information on this subject (in some cases erroneous), through the many channels that the age of technological communications makes available to us. Sometimes, false beliefs and misconceptions are propagated as myths that have endured over time and are taken for granted by society and can influence our dietary and lifestyle choices, with negative consequences for our health and well-being [30, 31].
It is important to have a minimum of food related education to be able to distinguish between reliable information and misinformation, and thus to be aware of the choices to be made. The stronger their food education, the better able consumers will be to identify misleading or confusing tactics in advertising or on product labels. Food education empowers individuals to make conscious and critical decisions about their diet, which will positively affect their physical and mental health and well-being. Therefore, one would think that professional groups such as doctors, nutritionists, educators, or students are more aware than anyone else of the importance of having correct eating habits and putting them into practice in their personal environment [32].
The structure of Spain’s education system, governed by Organic Law 3/2000 (which replaced the previous LOMLOE law) [33], comprises several progressive levels. It begins with primary education, a mandatory stage for children aged 6 to 12, followed by compulsory secondary education, or Educación Secundaria Obligatoria (ESO), lasting four years from ages 12 to 16. After ESO, students have the option to continue with either the Bachillerato program or vocational training (lasting 2–3 years), both of which qualify them for university entry. University degrees typically require four years, with the option to pursue a master’s degree afterward. The highest academic credential, the PhD, is mainly aimed at those pursuing academic careers.
The present study aims to support the existing literature by providing concrete data focusing on the Spanish population on the effectiveness of nutritional education in promoting healthier lifestyle choices in a world increasingly loaded with contradictory and often incorrect health information. The primary hypothesis proposed that individuals with academic training in nutrition and/or health sciences would demonstrate healthier eating patterns and lifestyles compared to those without such education.
A descriptive cross-sectional study was carried out. A validated and psychometrically tested questionnaire was administered to a sample of Spanish adults living in Spain [34].
Those people who were unable to choose their nutrition due to physical, mental or personal problems were excluded from the sample.
This study employed the validated NutSo-HH (Nutritional and Social Healthy Habits) questionnaire [35], which was enhanced with additional questions to capture socio-demographic and other qualitative details.
The instrument was developed and tested following rigorous methodological standards, ensuring its validity and reliability. Comprising 53 questions, the questionnaire was designed to gather socio-demographic information and analyze nutritional, social and lifestyle habits of the Spanish population in order to assess the health status of the population and enable clinicians to develop a tailor-made intervention to improve specific nutritional and health habits.
The NutSo-HH questionnaire is typically used in studies focusing on the interplay between nutritional habits, social behaviors, and health outcomes. It is particularly relevant for Nutritional Epidemiology Studies, Lifestyle and Public Health Research, Socioeconomic and Cultural Studies or also Chronic Disease Prevention Research.
It is a multidimensional instrument consisting of six primary factors: F1 (Mediterranean foods), F2 (Healthy and unhealthy foods), F3 (Meats and dairy products), F4 (Eating disorders), F5 (Rest habits), and F6 (Alcohol consumption). Additionally, it includes two overarching factors: NUTRI (nutritional, encompassing F2 and F3) and HH (healthy habits, encompassing F4 and F5).
To minimize the loss of useful data caused by human error in the completion of the questionnaire, an attempt has been made to avoid open-ended questions. The structure of the questionnaire consists almost exclusively of closed questions with several possible options where the respondent can select the option that most closely matches his/her lifestyle habits or frequency of food consumption.
The questionnaire was distributed via Google Forms to maximize reach within the target population. A ‘snowball’ sampling approach [36] was implemented, a non-probabilistic method commonly used in social research to access groups that may be challenging to reach. This technique involves initial participants referring additional respondents from their own networks, creating a chain effect that broadens the sample.
Social media platforms such as LinkedIn, WhatsApp, and Facebook were primarily used for dissemination, along with the Instagram account @el_reto_de_la_nutricion. Through this account, researchers engaged with regional professionals and influencers, who further shared the survey with their followers to enhance visibility. Data collection took place from December 2023 to March 2024.
The questionnaire consisted of several sections. The first part focused on
socio-demographic variables such as gender, age (categorized into young: 18–30
years; middle-aged: 31–50 years; and adults over 50 years), education level
(divided into basic education: no studies “no studies” refers to individuals
who have not participated in formal education at all and have not completed any
stage of it, compulsory primary education, secondary or high school, and
vocational training; and higher education: bachelor’s degree, master’s degree,
and PhD), income level (with low income:
Another section recorded anthropometric measures (weight and height), which were used to calculate the body mass index (BMI) (kg/m2), along with health-related variables such as self-reported health status, assessed using a Likert scale from 1 to 5, where 1 indicated very poor health and 5 indicated excellent health.
An additional section addressed the presence of diet-related variables that capture respondents’ behaviors related to eating habits (lack of control over food or drink intake: No control) and perceptions related to food consumption (fear of gaining weight: Obesophobia, dissatisfaction with body image: Body image) these variables were categorized on a Likert scale from 1 to 6, where 1 indicated Never, and 6 indicated Always (see the details in Appendix Table 4).
The largest part of the questionnaire focused on dietary habits, particularly the frequency of consumption of certain food groups. The final two sections of the questionnaire focused on sports habits (sedentary lifestyle, day per week of physical activity and time spent in each session) and social and lifestyle habits (such as going out at night, frequency of alcohol and tobacco consumption or getting drunk). Most of the variables were qualitative, allowing participants to select from various options. Variables related to food consumption frequency as well as lifestyle habits variables were categorized on a Likert scale from 1 to 4, where 1 indicated low or no frequency, and 4 indicated the highest frequency. This classification was used as in previous studies [37, 38].
The variables were categorized into three types: categorical, ordinal, and continuous, and were analyzed using Excel and Jamovi (Microsoft Excel version 16.94, based in Redmond, WA, USA and Jamovi version 2.3.28 by “the jamovi project”, Sydney, Australia).
Due to invalid data, 18 questionnaires (1.63%) were excluded from the analysis, the final valid sample included 1087 respondents.
Discrete variables were presented as absolute values and percentages, while ordinal and continuous variables were summarized using the mean and standard deviation. A descriptive analysis was performed for each variable to calculate these measures. To assess the distribution of the sample variables, the Shapiro-Wilk test was conducted for normality. Given that most variables did not follow a normal distribution, non-parametric tests were used for data analysis, in this case the Mann-Whitney U for ordinal and continuous variables was applied to obtain the presented p-values.
The appropriate tests were applied to each variable, and the results were presented in a table. p-values were calculated for each variable by comparing two groups: individuals with health education and those without health education. A p-value lower than 0.05 was considered statistically significant for rejecting the null hypothesis of equality in between the two groups.
Table 1 reports the socio-demographic data of the sample. It shows that most respondents were female (76.26%) compared to 23.74% male. In terms of age, most respondents were divided between young people (18–30 years old) (39.47%) and middle-aged people (30–50 years old) (44.89%), while those over 50 years old account only for 15.64%. Approximately one third of the sample (31.00%) had basic education while 69.00% had at least a university degree. Most of the population (76.63%) lived in a city larger than 10,000 inhabitants.
| Total sample | Health Sciences | No Health Sciences | |||
| Mean (SD) or % (N) | Mean (SD) or % (N) | Mean (SD) or % (N) | |||
| Total | 100% (1087) | 48.11% (523) | 51.89% (564) | ||
| Male | 23.74% (258) | 19.12% (100) | 28.01% (158) | ||
| Female | 76.26% (829) | 80.88% (423) | 71.99% (406) | ||
| Age total (years) | 36.2 |
31.6 |
40.3 | ||
| Age male (years) | 35.9 |
29.2 |
40.2 | ||
| Age female (years) | 36.2 |
32.2 |
40.4 | ||
| Age in Years (% N) | |||||
| Young (18–30) | 39.47% (429) | 54.88% (287) | 25.18% (142) | ||
| Middle age (31–50) | 44.89% (488) | 38.62% (202) | 50.71% (286) | ||
| Adults ( |
15.64% (170) | 6.50% (34) | 24.11% (136) | ||
| Education level | |||||
| Basic Education | 31.00% (337) | 22.37% (117) | 39.01% (220) | ||
| No studies | 0.55% (6) | 0% (0) | 1.06% (6) | ||
| Compulsory primary education | 2.21% (24) | 0% (0) | 4.26% (24) | ||
| Secondary or high school | 13.34% (145) | 13.77% (72) | 12.94% (73) | ||
| Vocational training | 14.90% (162) | 8.60% (45) | 20.74% (117) | ||
| Higher Education | 69.00% (750) | 77.69% (406) | 61.02% (344) | ||
| Bachelor’s degree | 34.41% (374) | 34.41% (180) | 34.40% (194) | ||
| Master’s degree | 30.54% (332) | 37.86% (198) | 23.76% (134) | ||
| PhD | 4.05% (44) | 5.35% (28) | 2.84% (16) | ||
| Income Level | |||||
| Low | 16.10% (175) | 15.68% (82) | 16.49% (93) | ||
| Medium | 50.87% (553) | 48.18% (252) | 53.37% (301) | ||
| High | 24.47% (266) | 25.05% (131) | 23.94% (135) | ||
| No answer | 8.56% (93) | 11.09% (58) | 6.21% (35) | ||
| Municipality | |||||
| 3.77% (41) | 4.02% (21) | 3.55% (20) | |||
| 2000–10,000 | 19.60% (213) | 16.83% (88) | 22.16% (125) | ||
| 76.63% (833) | 79.16% (414) | 74.00% (419) | |||
Note: SD, Standard Deviation.
Furthermore, Table 1 also shows the distribution of the educational level of the population. It can be seen that the majority of the population has a Bachelor’s degree (34.41%) or a Master’s degree (30.54%).
N = 523 people (48.11%) stated that they had studied or were studying a degree in the Health Sciences branch, compared to 564 (51.89%) who had no studies or were studying or had studied another type of training. Additionally, Fig. 1 shows the distribution of the respondents according to health careers in greater detail. The most represented were the degree in Human Nutrition and Dietetics (20.60%) followed by Nursing (18.30%) and Medicine (15.8%).
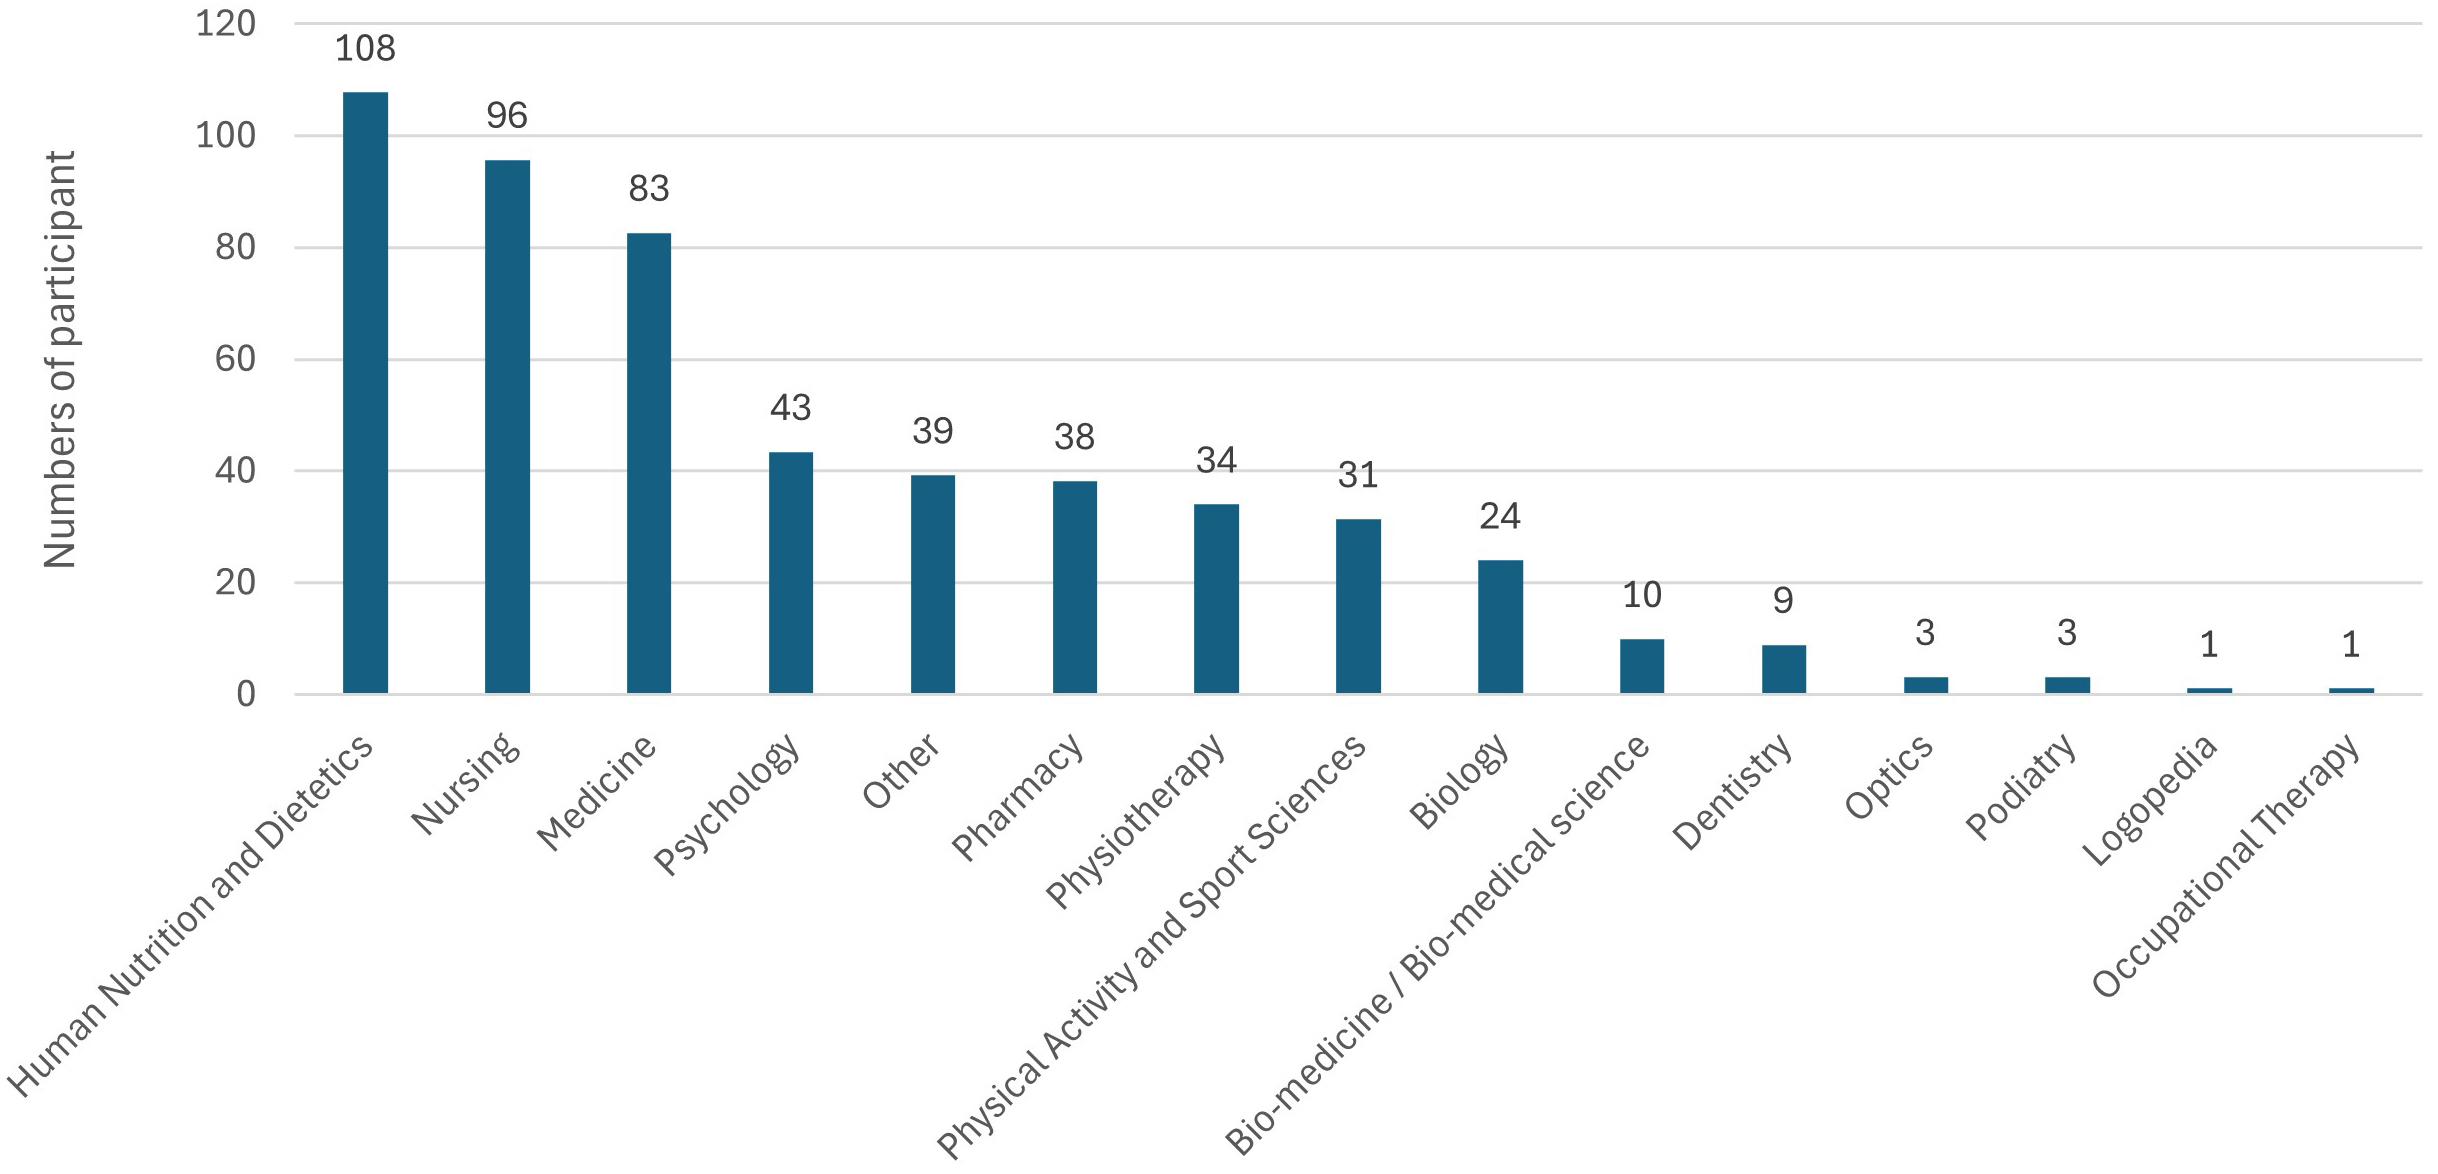 Fig. 1.
Distribution of the sample according to the health career studied (N = 523).
Table 2 compares, using the Mann-Whitney U test for ordinal variables, the
health variables of people with health education with those without. There were
no statistically significant differences in almost any of the health variables
explored, except for self-perceived health, BMI and smoking. With respect to
Self-perceived health, people with health education had better self-perceived
health compared to people without health education (3.94 vs. 3.76; p
| Variables | Health studies | No health studies | p-value* |
| Mean |
Mean | ||
| Self-perceived health | 3.94 |
3.76 |
|
| Obesophobia | 3.13 |
3.21 |
0.244 |
| No control | 2.59 |
2.65 |
0.191 |
| Body image | 3.44 |
3.36 |
0.545 |
| Sedentary lifestyle | 1.54 |
1.55 |
0.465 |
| Sport in minutes | 195.17 |
179.96 |
0.093 |
| BMI (kg/m2) | 23.68 |
24.75 |
|
| Smoking | 1.14 |
1.23 |
0.015** |
| Alcohol consumed | 1.65 |
1.68 |
0.903 |
*Mann-Whitney U, **Statistically significant. BMI, body mass index. NOTE: The health variables do not have units of measurement. They are values on a liker scale from 1 to 4 (see section 2.5 and Appendix Table 4).
Fig. 2 shows a graphical comparison of those health habits that differ between people with health education and those without.
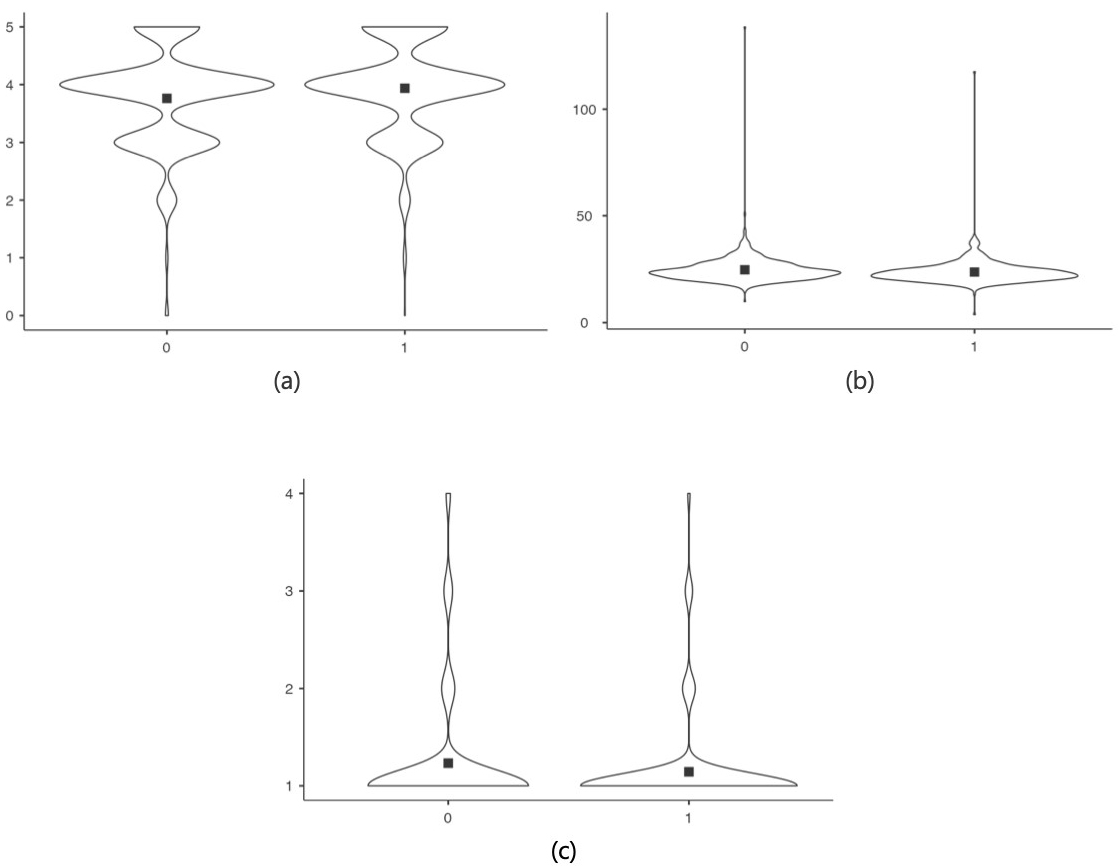 Fig. 2.
Comparison of those health habits that differ between people with health education and those without. (a) Self-perceived health. (b) BMI in kg/m2. (c) Smoking. NOTE: 0: No Health Studies; 1: Health Studies.
Table 3 compares, the nutritional habits of people with health studies with
those without. The Mann-Whitney U test applied detected no statistically
significant differences for almost none of the nutrition variables explored,
except for the frequency of vegetable consumption, red meat, cereals, legumes and
water, where the Mann-Whitney U test detected differences. The consumption of
vegetables was higher for people who are educated in health-related fields than
for those who were not (3.64 vs. 3.5; p
| Variables | Health studies | No health studies | p-value* |
| Mean |
Mean | ||
| Fruit | 2.46 |
2.39 |
0.098 |
| Vegetable | 3.64 |
3.50 |
|
| White fish | 1.73 |
1.74 |
0.837 |
| Blue fish | 1.86 |
1.85 |
0.541 |
| White meat | 2.50 |
2.49 |
0.743 |
| Red meat | 1.60 |
1.73 |
0.001** |
| Dairy | 3.36 |
3.43 |
0.260 |
| Cereals | 3.09 |
2.70 |
|
| Legumes | 2.19 |
2.10 |
0.013** |
| Fast Food | 2.46 |
2.38 |
0.082 |
| Fried Food | 2.20 |
2.21 |
0.786 |
| Ultra-processed products | 2.44 |
2.36 |
0.130 |
| Water | 3.47 |
3.34 |
|
| Sugary drinks | 1.36 |
1.37 |
0.923 |
| Juice | 1.21 |
1.17 |
0.070 |
| Coffee/energy drinks | 1.68 |
1.77 |
0.137 |
*Mann-Whitney U, **Statistically significant.
NOTE: The nutritional variables do not have units of measurement. They are values on a liker scale from 1 to 4 that arise from the categorization of the answers to the questionnaire (see section 2.5 and Appendix Table 4).
Fig. 3 shows a graphical comparison of those nutritional habits that differ between people with health education and those without.
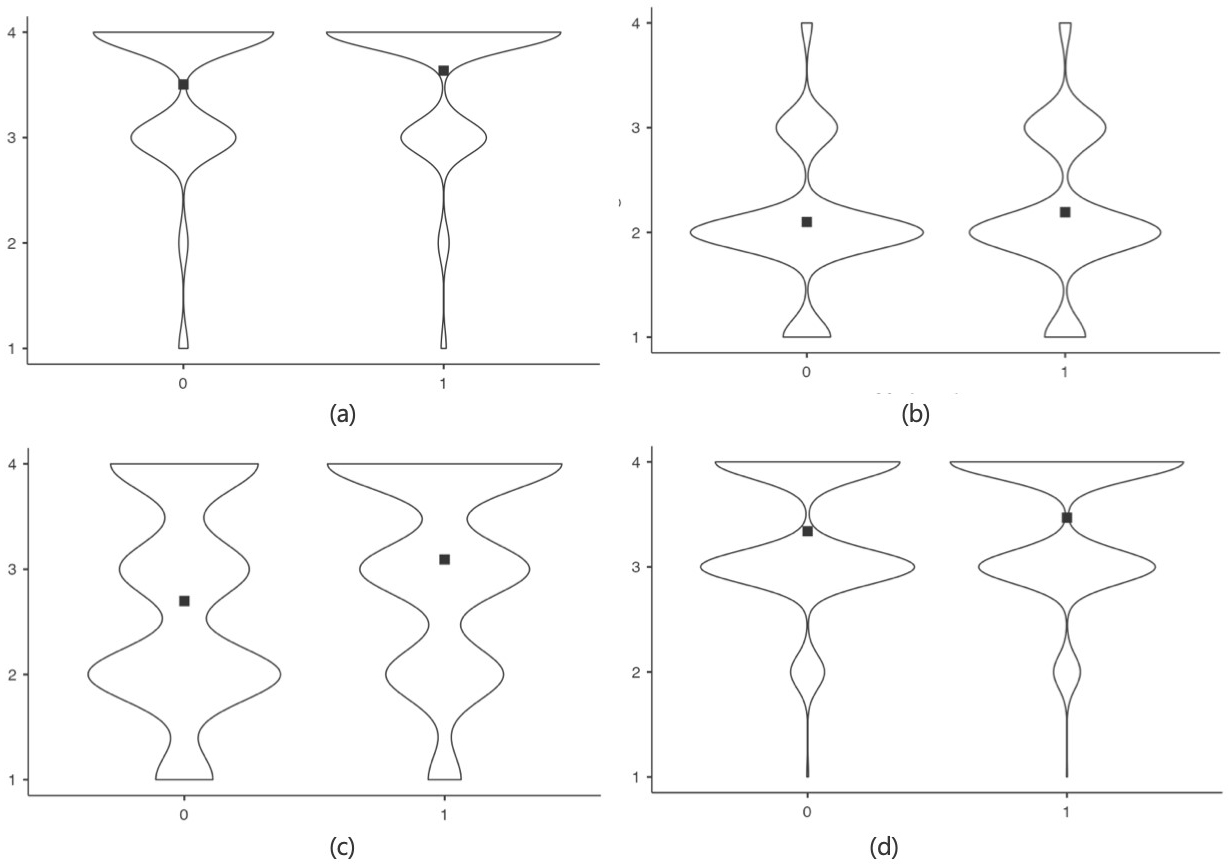 Fig. 3.
Comparison of those nutritional habits that differ significantly between people with health education and those without using violin plots. (a) Vegetable. (b) Cereals. (c) Legumes. (d) Water. NOTE: 0: No Health Studies; 1: Health Studies.
This study set out to explore how education in nutrition and health sciences influences the nutritional habits and lifestyles of the Spanish population. The main hypothesis was that people with studies in nutrition and/or health sciences would have healthier nutritional habits and lifestyles compared to those without such training.
The results did not fully confirm this hypothesis, although significant differences were found in the consumption of certain foods, such as vegetables, red meat, cereals, pulses and water, which were consumed in greater quantities by people with health education, but most of the differences in the variables were not significant.
No significant differences were observed in the consumption of fruit, fish, white meat and dairy products. This lack of difference could be explained by the importance of these foods in the regular diet of the general population, regardless of their level of education in health sciences. These foods are in fact typical products used in the Mediterranean diet which, although progressively being replaced by the adoption of other dietary patterns [39], is still the predominant diet in the Iberian Peninsula [40].
No statistically significant differences were found in the consumption of fast food, fried food, ultra-processed food, sugary soft drinks, juices and coffee or energy drinks. If we look at the values obtained, the frequency of consumption of these foods is low in both groups, indicating that we are in the presence of a population with generally healthy nutritional habits. It is possible that given the very low consumption values of these food groups it is difficult to detect significant differences.
Another plausible explanation for the lack of difference found in dietary habits between the two groups is that, although health-educated individuals are knowledgeable about the benefits of certain foods, factors such as access, product marketing, personal preferences and cultural mores play a crucial role in food selection [41, 42, 43, 44]. The fact that there are no differences in the consumption of these foods suggests that nutrition education, while effective for certain foods, may not be sufficient to counteract external influences and general dietary trends in society. For example, the availability and marketing of fast and ultra-processed foods may be determinants that outweigh the impact of health education [45, 46].
Another important finding is that people with health literacy reported better self-perceived health and had a lower BMI, as well as a lower frequency of smoking. A high BMI is associated with an increased risk of chronic diseases [47]. According to the WHO, maintaining a BMI in the healthy range (18.5–24.9) can reduce the risk of these conditions [48]. In addition, another study have shown that overweight and obesity can negatively affect quality of life and mental health [49]. Regarding smoking, it has been shown to be one of the leading causes of death and disease in the world. Smoking is associated with an increased risk of cardiovascular disease, cancer and chronic respiratory diseases [50]. It is possible that knowledge about the risks associated with being overweight and smoking, acquired during health education, may motivate these individuals to adopt healthier behaviors [48, 51]. Regarding better self-perceived health among people with health education, it may reflect a greater awareness of their health, as well as a greater ability to manage their well-being through healthy lifestyle habits.
However, no significant differences were found in the time spent in sport, which could be because physical activity promotion requires specific and continuous interventions [52, 53] which are not always included in health science education programs. Encouraging people to stay active involves deliberate efforts over time, this includes building accessible infrastructure like parks and bike paths, implementing supportive public policies such as subsidies for fitness programs, and running educational campaigns to raise awareness among others. In addition, physical activity may be more influenced by the environment and available opportunities, such as accessible sports facilities and leisure time, than by health education alone [54].
Reviewing previous studies [55, 56], they assessed how food consumption habits influenced health-related quality of life and found similar patterns to our study. These studies showed that people with higher education tended to have a better perception of their health and a lower body mass index (BMI). However, it was also observed that differences in fruit consumption by educational level were minimal, suggesting that this specific dietary habit may not significantly contribute to the observed variations in health perception and BMI.
Previous studies [57, 58, 59], focused on the relationship between sociodemographic variables and beverage consumption in different groups of the Spanish population. They found that, although the beverage consumption pattern of the population is affected by sociodemographic variables and healthier drinking habits are related to better nutrition and health status of the population, there were no significant differences in the consumption of other beverages such as juices, coffee and energy drinks. These findings may suggest that cultural and access differences may play a crucial role in beverage consumption habits, regardless of health knowledges.
Other studies [60, 61, 62] highlighted that health education is related to better dietary and lifestyle habits among Spanish women. They found that women with higher education and higher income tended to have a healthier diet, a lower BMI and a better perception of their health. However, they also observed that older adult women were more sedentary and less physically active compared to younger women, which aligns with our findings indicating that health education is not always associated with increased physical activity without specific interventions.
This study has several strengths, such as the homogeneity of the sample, which allows obtaining representative results for the specific group studied. It also focuses on a specific population, thus obtaining detailed and accurate data on the nutritional habits and lifestyles of this population. Another strength is the use of a validated questionnaire to assess nutritional and lifestyle habits, which increases the reliability and validity of the data collected.
However, the study also has several limitations that should be considered when interpreting the results. Firstly, the sample was mostly composed of women with higher income and educational levels than the average Spanish population. This lack of diversity could influence the nutritional and health behaviors collected, limiting the results. In addition, the data were based on self-reports, which may have desirability biases, recall biases and reporting errors. It also did not examine how different factors such as physical activity level, stress and eating habits interact over time, which could help to understand more about health and well-being. In the data analysis, subgroups such as newly graduated students and healthcare staff with years of experience were not considered. This analysis could reveal important differences between subgroups. In addition, the degree of nutrition and health knowledge of the study population was not measured with specific instruments, which would help to better understand the relationship between educational background and health behaviors.
For future studies, it would be interesting to include more accurate data collection methods, such as in-depth interviews with dietary records, which could improve accuracy at the nutritional level.
Another proposal is to include a more diverse sample in terms of gender, educational level and socioeconomic status, to improve the results for the Spanish population. It would be also interesting to explore how different levels of health and/or nutrition education may influence other aspects of long-term well-being. Also, longitudinal studies using methods that reduce self-report biases, such as direct observation or the use of biomarkers, could provide a more accurate assessment of changes in lifestyle habits.
Finally, it would be beneficial to separate and analyze independently the different degrees in health sciences, as well as to consider subgroups such as students, recent graduates and health workers with years of experience, to identify specific differences between these groups, as well as to measure the degree of knowledge in nutrition and/or health of the population studied.
Training in nutrition and/or health sciences is associated with improvements in some certain dietary habits, such as increased consumption of vegetables, cereals, legumes and water. Whereas people with health studies eat less red meat than people with no health studies. However, no significant differences were found in the consumption of fruit, fish, white meat, dairy products, fast food, fried food, ultra-processed food, soft drinks, juices and coffee/sweetened beverages between people with health education and those without health education.
People with health literacy reported better self-perceived health and had a lower body mass index (BMI) compared to those without health literacy. In addition, smoking was less prevalent among individuals with health education. No significant differences were observed in the time spent in sports practice.
It is advisable to further explore how different levels of health and/or nutrition education may influence other aspects of long-term well-being, using methodologies that reduce self-report bias.
Although health science education shows some benefits on eating habits and perceptions of well-being, it does not seem to have a significant influence on all aspects of nutritional habits and lifestyles. A more holistic approach could provide a more complete picture of the influence of health education on overall well-being.
The data presented in this study are available upon reasonable request to the corresponding author.
ES: Conceptualization, Data curation, Investigation, Methodology, Validation, Visualization, Writing – original draft, Writing – review & editing. MAB: Writing – original draft, Writing – review & editing, Investigation and Visualization. LUW: Data curation, Formal Analysis, Visualization, Writing – review & editing. All authors contributed to editorial changes in the manuscript. All authors read and approved the final manuscript. All authors have participated sufficiently in the work and agreed to be accountable for all aspects of the work.
The research strictly followed ethical principles outlined in the Declaration of Helsinki and received approval from the Ethics Research Committee of the Catholic University of Valencia (approval code UCV/2019-2020/152, 18 June 2020). Prior to participating, explicit informed consent was obtained from all individuals, ensuring they were fully informed about the study’s objectives, procedures, and potential risks, and emphasizing the voluntary nature of their participation.
The authors sincerely appreciate the collaboration of all individuals who contributed to this research. Special thanks to those who played a role in sharing the questionnaire and to those who devoted their time to participate in and provide responses to the survey.
This research received no external funding.
The authors declare no conflict of interest.
See Appendix Table 4.
| Variable | Category | Score |
| Sleeping hours | Less than 6 h | 1 |
| Between 6 and 7 h | 2 | |
| Between 7 and 8 h | 3 | |
| More than 8 h | 4 | |
| Getting up rested | Never | 1 |
| Very seldom and sometimes | 2 | |
| Frequently and almost always | 3 | |
| Always | 4 | |
| Sleep quality | 0 and 1 | 1 |
| 2 | 2 | |
| 3 | 3 | |
| 4 and 5 | 4 | |
| Water | Never and very rarely (2 max. per month) and 1 glass/cup/week and 2 or more glasses/cups/week | 1 |
| 2 glasses/cups or less every day | 2 | |
| 3 to 5 glasses every day | 3 | |
| More than 5 glasses every day | 4 | |
| Sugary soft drinks, coffee and energy drinks | Never and very rarely (2 glasses max. per month) | 4 |
| One glass per week and 2 or more glasses per week | 3 | |
| 2 glasses or less every day | 2 | |
| 3 to 5 glasses and more than 5 glasses every day | 1 | |
| Juice | Never and very rarely (2 glasses max. per month) | 1 |
| One glass per week and 2 or more glasses per week | 2 | |
| 2 glasses or less every day | 3 | |
| 3 to 5 glasses and more than 5 glasses every day | 4 | |
| Fish consumption | Never or very seldom | 1 |
| Between 1 and 2 times a week | 2 | |
| Three or more times a week | 3 | |
| Every day | 4 | |
| Consumption of fast food, fried and ultra-processed dishes | Never | 1 |
| Very seldom (2 times a month maximum) | 2 | |
| Once a week | 3 | |
| Several times a week | 4 | |
| Getting drunk | Never or less than once a month | 1 |
| Monthly | 2 | |
| Weekly | 3 | |
| Daily or almost daily | 4 | |
| Alcohol consumption | Never or once a month | 1 |
| 2–4 times a month | 2 | |
| 2–3 times a week | 3 | |
| 4–5 times a week or every day | 4 | |
| Smoking | Non-smoker | 1 |
| Light smoker (less than 5 cigarettes per day) | 2 | |
| Moderate smoker (6–15 cigarettes per day) | 3 | |
| Severe smoker (more than 16 cigarettes per day) | 4 | |
| Night outings | Never and sporadically | 1 |
| Between 1 and 2 times a week | 2 | |
| More than 3 times a week | 3 | |
| Every day | 4 | |
| Sedentary lifestyle | Less than 7 h | 1 |
| Between 7 and 9 h | 2 | |
| Between 9 and 11 h | 3 | |
| More than 11 h | 4 | |
| Obesophobia, No control and Body image | Never | 1 |
| Rarely | 2 | |
| Occasionally | 3 | |
| Frequently | 4 | |
| Very frequently | 5 | |
| Always | 6 |
References
Publisher’s Note: IMR Press stays neutral with regard to jurisdictional claims in published maps and institutional affiliations.