


 , Dongze Chen 2,*,†, Weilin Zhu 1, Zhisheng Liang 3, Liang Zhao 1, Huatang Zeng 1, Liqun Wu 1, Xin Ye 4,5, Chaoqun Ao 1, Kaichuan Diao 6
1 Shenzhen Health Development Research and Data Management Center, 518028 Shenzhen, China
2 Key Laboratory of Carcinogenesis and Translational Research (Ministry of Education/Beijing), Laboratory of Genetics, Peking University Cancer Hospital & Institute, 100142 Beijing, China
3 Department of Global Health, School of Public Health, Peking University, 100091 Beijing, China
4 Institute for Global Public Policy, Fudan University, 200433 Shanghai, China
5 LSE-Fudan Research Center for Global Public Policy, Fudan University, 200433 Shanghai, China
6 Shenzhen Center for Chronic Disease Control, 518038 Shenzhen, Guangdong, China
†These authors contributed equally.
Abstract
Nonalcoholic fatty liver disease (NAFLD) was clinically documented to be accompanied by iron homeostasis imbalances, however, the causal relationship between them remains unclear. Therefore, this study aimed to examine the relationship between iron homeostasis indicators (serum iron, ferritin, transferrin, total iron binding capacity (TIBC), and transferrin saturation (TSAT)) and NAFLD risk.
We applied two-sample Mendelian randomization (MR) to assess the effects of genetic liability to iron homeostasis indicators (N = 43,220–246,139) on NAFLD risk (N = 377,988) in individuals of European ancestry. Reverse direction MR, multivariable MR, and two-step MR were performed to estimate reverse association, causal effects independent of smoking or drinking, and the mediating effect of lipid metabolism, respectively. Smoking and drinking as confounders were considered confounders.
Genetically predicted serum iron, ferritin, and TSAT were significantly associated with a higher risk of NAFLD (odds ratio (OR): 1.286, 95% confidence interval (CI): 1.075–1.539; p = 0.0059; OR: 1.260, 95% CI: 1.050–1.500, p = 0.0195; and OR: 1.223, 95% CI: 1.067–1.402; p = 0.0039, respectively). Reverse direction MR analysis suggested that genetic liability to NAFLD had no significant causal effect on iron homeostasis. Sex-specific MR exhibited a stronger effect size for the association of elevated ferritin with NAFLD risk in males (OR: 1.723, 95% CI: 1.338–2.219; p = 2.48 × 10⁻⁵). Two-step MR revealed that elevated triglycerides (TGs) mediated approximately 3%–5% of the observed effect of serum iron and TSAT on NAFLD risk, while decreased low-density lipoprotein cholesterol (LDL-C) mediated 9%–10%.
Genetic liability to iron status imbalance may causally affect NAFLD. This evidence may support the clinical treatment of NAFLD in the target population.
Graphical Abstract
Keywords
- iron status
- lipid metabolism
- nonalcoholic fatty liver disease
- Mendelian randomization
- mediation
Nonalcoholic fatty liver disease (NAFLD) is characterized by hepatic steatosis in the absence of significant alcohol consumption and other secondary causes of hepatic fat accumulation [1]. It has become the most prevalent form of chronic liver disease, ranging from nonalcoholic fatty liver (NAFL) to advanced histological stages. A systematic review estimated that NAFLD afflicted 29.8% of the global population in 2019 [2]. Despite its growing prevalence, effective noninvasive diagnostic strategies and treatments for NAFLD are still lacking, underscoring the need to identify modifiable factors associated with disease progression. Among these, iron status may be a promising target for NAFLD prevention and treatment.
Iron plays key roles in various physiological processes, while cellular iron overload can induce oxidative stress and lipid peroxidation via the Fenton reaction [3]. Biochemical measures of iron status, such as serum iron, ferritin, transferrin, total iron binding capacity (TIBC), and transferrin saturation (TSAT), serve as essential clinical indicators for iron homeostasis. Several observational studies have consistently found that elevated serum ferritin levels are independently associated with elevated severity and mortality among patients with NAFLD [4, 5, 6, 7]. However, the association between other iron status indicators and NAFLD severity is limited and controversial [8, 9, 10, 11]. Although iron homeostasis imbalances are clinically documented to accompany NAFLD, the causal relationship between them remains unclear.
Smoking and alcohol consumption are the most common lifestyle factors often
accounted for as confounders in association studies. Cigarette smoking has been
identified as a risk factor for the onset and severity of NAFLD [12, 13], and
smoking status could also affect iron status [14, 15]. Modest alcohol consumption
(defined as
Observational epidemiological studies are limited by their susceptibility to confounding and reverse causation. An alternative approach that can address these challenges is the Mendelian randomization (MR) study in which genetic instruments are used as the proxy of iron status or NAFLD. MR is based on the hypothesis that genetic instruments are determined at conception by random chromosome distribution and are unrelated to potential confounders. In this study, we provide evidence on the causal effect of iron status, including serum iron, ferritin, transferrin, TIBC, and TSAT, on NAFLD risk by conducting two-sample MR and meta-analysis based on multiple sets of genome-wide association study (GWAS) summary statistics. Considering sex differences in the prevalence, risk factors, severity, and clinical outcomes of NAFLD [18], we further investigated sex-specific causal relationships. Multivariate MR (MVMR) was used to adjust for smoking status and alcohol consumption to confirm the results. Dyslipidemia plays a key role in the development of NAFLD [19], and two-stage MR was performed to explore whether lipid metabolism (low-density lipoprotein cholesterol [LDL-C] and triglyceride [TG]) mediated the association of iron homeostasis imbalance with NAFLD.
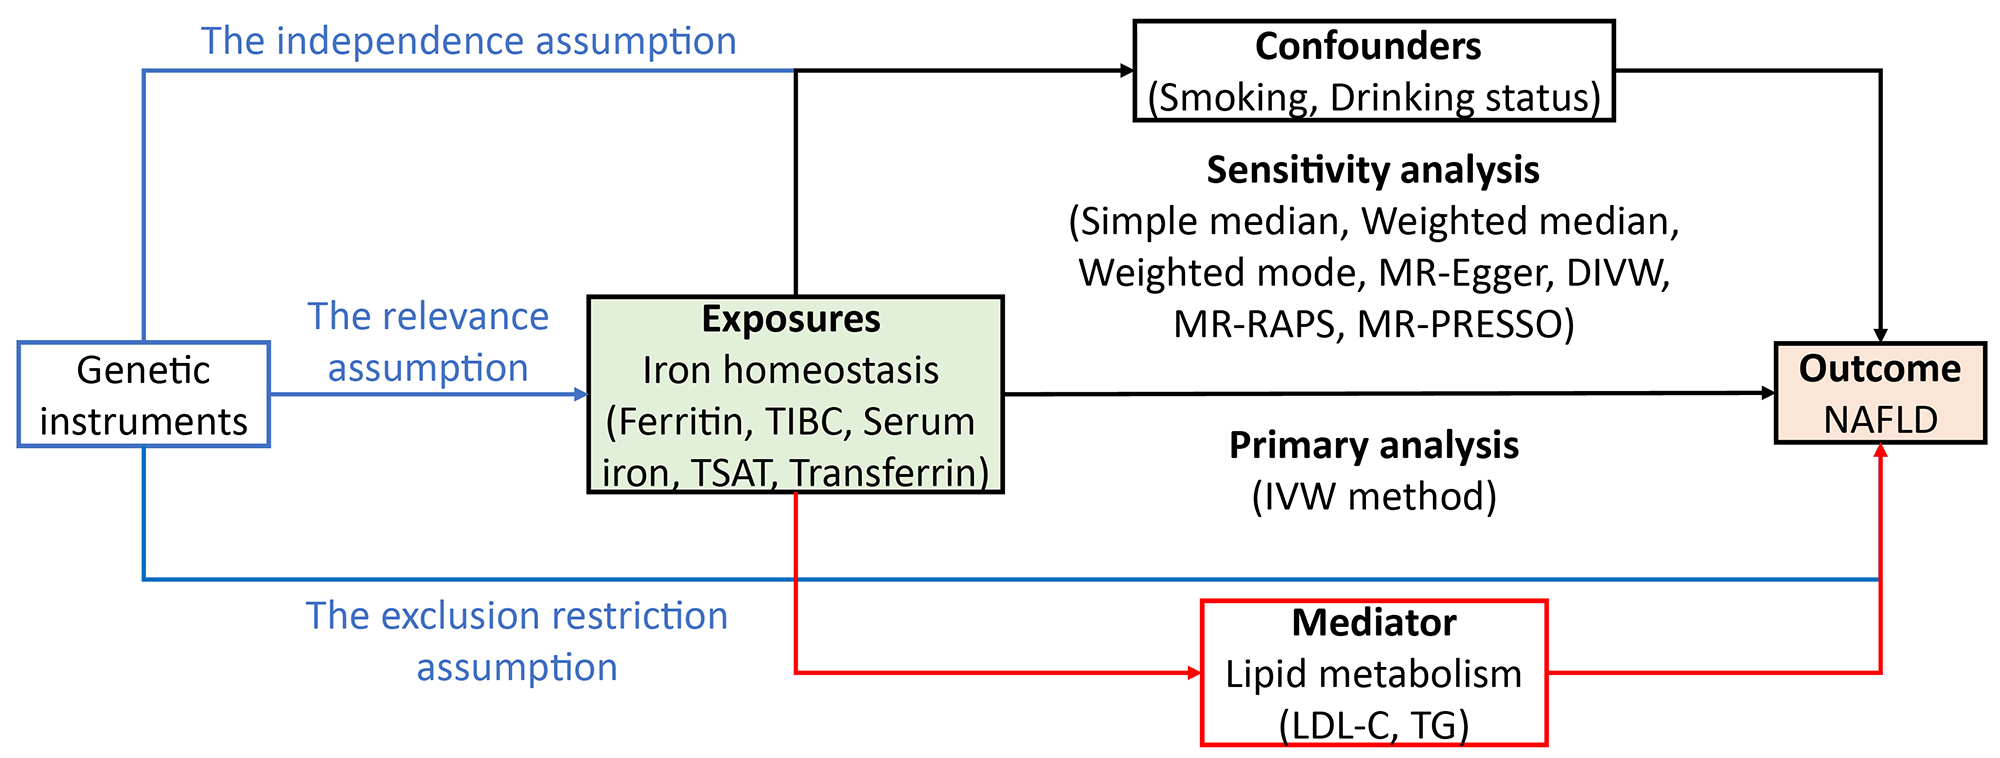
Fig. 1 shows the study design. Independent instrumental variables for iron homeostasis were retrieved separately from the GWAS performed by Bell et al. (2021) [20] and Benyamin et al. (2014) [21], whereas the summary statistics of SNP-NAFLD associations were retrieved separately from the GWAS performed by de Fairfield et al. (2022) [22], FinnGen (2021) (https://gwas.mrcieu.ac.uk/datasets/finn-b-NAFLD/) and Anstee et al. (2020) [23] to represent the discovery cohort, replication-1 cohort, and replication-2 cohort, respectively. We first examined the associations of iron homeostasis indicators (2021) with NAFLD using two-sample MR in the large discovery dataset and then performed two replication analyses in two independent datasets. To increase the power of the analysis, we combined estimates from three data sources. We performed the same procedure for iron homeostasis indicators (2014). Reverse direction MR, multivariable MR, and two-step MR were performed to estimate reverse causation, causal effects independent of cigarettes or drinking, and the mediating effect of lipid metabolism, respectively. The analytic process followed the STROBE-MR guidelines [24]. MR analyses depend on three key assumptions: assumption one, instrumental variants (IVs) are strongly related to the risk factor (i.e., the relevance assumption); assumption two, genetic variants are not associated with any confounding factors in the exposure-outcome association (i.e., the independence assumption); assumption three, IVs affect outcomes only through exposure (i.e., the exclusion restriction assumption).
 Fig. 1.
Study design overview. (A) We performed various MR analyses to investigate the causal relationship between iron homeostasis imbalance and NAFLD. (B,C) MR analyses were conducted and subsequently meta-analyzed to generate pooled estimates. (D) Additional analyses, including mediation, multivariable, sex specific, reversed MR, were conducted for iron homeostasis (2021) and NAFLD (2022).
Detailed information on GWASs of studied exposures, mediators and outcomes is
presented in Table 1. There is no sample overlap between exposures and outcomes
in this study. For each phenotype, we directly extracted independent genome-wide
significant (p
| Category | Year | PubMed ID | Traits | Unit | SNPs | Participants | Adjustments | Consortiums/Cohorts |
| Exposure | 2021 | 33536631 | Ferritin | SD of log-transformed ferritin (1.08 µg/L) | 40 | 246,139 | age, sex and other study specific covariates | Icelandic, INTERVAL UK, DBDS |
| Serum iron | SD (7.76 µmol/L) | 16 | 163,511 | |||||
| TIBC | SD (14.14 µmol/L) | 16 | 135,430 | |||||
| TSAT | SD (13.25%) | 12 | 131,471 | |||||
| 2014 | 25817829 | Ferritin | SD of log-transformed ferritin (0.74 µg/L) | 6 | 45,443 | age, sex, principal component scores and other study specific covariates | GIS | |
| Serum iron | SD (6.39 µmol/L) | 5 | 49,120 | |||||
| Transferrin | SD (0.54 g/L) | 9 | 46,458 | |||||
| TSAT | SD (11.34%) | 5 | 43,220 | |||||
| Outcome | 2022 | 34535985 | NAFLD | One-unit in log-transformed odds ratio | 6 | 377,988 (4761 cases and 373,227 controls) | age, sex, top 20 genetic principal components | UKB |
| 2021 | - | NAFLD | One-unit in log-transformed odds ratio | NA | 218,792 (894 cases and 217,898 controls) | age, sex, top 10 principal components, genotyping batch | FinnGen | |
| 2020 | 32298765 | NAFLD | One-unit in log-transformed odds ratio | 4 | 19,264 (1483 cases and 17,781 controls) | sex, top 5 principal components | European tertiary liver centers, WTCCC, Hypergenes cohort, KORA | |
| Mediator | 2013 | 24097068 | LDL-C | SD (44.1 mg/dL) | 28 | 188,577 | age, sex, principal component and other study specific covariates | 37 cohorts |
| TG | SD (100.2 mg/dL) | 54 | 188,577 |
SD, standard deviation; SNPs, singlenucleotide polymorphisms; DBDS, danish blood donor study; GIS, genetics of iron status; UKB, UK Biobank; WTCCC, Wellcome Trust Case Control Consortium; KORA, Cooperative Health Research in the Region of Augsburg; TIBC, total iron binding capacity; TSAT, transferrin saturation; NAFLD, nonalcoholic fatty liver disease; LDL-C, low-density lipoprotein cholesterol; TG, triglyceride.
Summary-level data (i.e., beta coefficient and corresponding standard error) for the associations of exposure-associated IVs with NAFLD were extracted from GWAS including 4761 NAFLD cases and 373,227 noncases (discovery stage), GWAS including 894 cases and 217,898 noncases (replication-1 stage), and another GWAS including 1483 NAFLD cases and 17,781 noncases (replication-2 stage). The case definition and exclusion criteria in the included NAFLD GWASs are shown in Supplementary Table 13 (B).
Univariable two-sample MR was used to estimate the total effect of genetic liability to iron homeostasis indicators on NAFLD. We used the multiplicative random effects inverse-variance weighted (IVW) method to generate effect estimates as the main outcome [26]. If the essential assumptions of the MR are satisfied, this technique delivers the best statistical power. To examine and validate these assumptions, we ran a series of sensitivity analyses using the simple median [27], weighted median [27], weighted mode [28], MR-RAPS [29], MR-DIVW [30], and Mendelian randomization Pleiotropy Residual Sum and Outlier (MR-PRESSO) [31] techniques, as each approach makes different assumptions on instrument validity. Univariable two-sample MR analysis was performed using the TwoSampleMR (version 0.5.6), MendelianRandomization (version 0.6.0), Mr.raps (version 0.3.1), MRPRESSO (version 1.0) and MR-CAUSE (version 1.2.0) packages in the R environment (version 3.6.1, R Foundation for Statistical Computing, Vienna, Austria). Combined estimates from three data sources were achieved by the meta package in R. All statistical tests were two-sided. To account for multiple comparisons, we applied Bonferroni correction to adjust the p values in our analysis.
We also performed multivariable Mendelian randomization (MVMR) to assess the causal effect of genetic liability to iron homeostasis indicators on NAFLD independent of adjustment variables. We selected cigarettes per day or drinking per week as adjustment variables. For each MVMR analysis, 54 and 91 IVs for cigarettes per day and drinking per week were added to the models, respectively. We performed an IVW-MVMR regression, incorporating one exposure and one adjustment variable into the regression model. We used conditional F statistics to assess the validity and strength of the instrumental variables. MVMR analyses were performed using the MVMR package (https://github.com/WSpiller/MVMR, version 0.3.0) in the R environment.
To further assess the mediation effects of lipid metabolism on the causal relationship between iron homeostasis indicators and NAFLD, we performed a two-step MR mediation analysis. We selected low-density lipoprotein cholesterol (LDL-C) and triglyceride (TG) as potential mediators. Two-step MR is based on the coefficient product method to calculate indirect (or mediator) effects. This process calculates two MR estimates, one for the causal effect of exposure on the mediator and the other for the causal effect of the mediator on the outcome. These two estimates are then multiplied together to estimate the indirect effect [32].
We assessed the strength of the instruments by calculating their F
statistic. F statistics can be calculated using the formula
To further assess the robustness of the findings, we conducted further tests for
horizontal pleiotropy. Estimates of intercept in MR-Egger regression were used to
evaluate the directional pleiotropy of IVs [35]. The MR-PRESSO method can detect
and correct for horizontal pleiotropy by removing outliers [31]. To quantify
heterogeneity across individual causal effects, Cochran’s Q was calculated, with
a p value
We also created informative graphs to show the results. Scatter plots contrast SNP-outcome relationships with SNP-exposure associations in a graph that can provide a quick image of the causal effect estimates of different MR approaches. Forest plots are mostly used to determine the occurrence of heterogeneity in IVs. Funnel plots provide a visual assessment of the degree of pleiotropy balance of the instruments utilized, with symmetry providing evidence against directional pleiotropy. The leave-one-out plots were created to evaluate influential outliers.
The mean F statistic and power calculation are shown in Supplementary
Table 1 (supplementary material A). The mean F statistic for each set of
instruments exceeds 10, indicating the absence of weak instrument bias. Across
combinations of the iron homeostasis indicators and NAFLD outcome, we had 80%
power to detect ORs as small as 1.12–1.46. High heterogeneity was observed in
the analyses for ferritin (2021) and TAST (2021) in the discovery analyses, as
well as for TIBC (2021) in the sex-specific analysis (Supplementary
Table 2, A). The results of graphical diagnostics also revealed no significant
heterogeneity in the analysis of the four indicators (Supplementary Figs.
1–4, A). Thus, we should note whether these associations remained consistent
after removal of outlier variants in MR-PRESSO analysis. No pleiotropy
(p value for Egger intercept
The primary (IVW) and sensitivity analyses in the discovery dataset are shown in
Fig. 2. The IVW method indicated that a genetically predicted one-SD increase in
serum iron (7.76 µmol/L) was significantly associated with an
increased risk of NAFLD (OR [95% CI], 1.286 [1.075–1.539], p =0.0059). The OR of NAFLD was 1.223 [1.067, 1.402] (p = 0.0039) for
genetically predicted one-SD increase of TSAT (13.25%). IVW indicated that no
significant associations were found between ferritin or TIBC and the risk of
NAFLD. High heterogeneity was observed in the analysis for ferritin (p
value for Q = 1.27
 Fig. 2.
Univariable Mendelian randomization between iron homeostasis
(2021) and NAFLD (2022) included primary analyses and sensitivity analyses. When
the MR-PRESSO global test cannot reach significance for our specified
significance threshold, no outliers can be detected, and the outlier-corrected
analyses do not make sense. IVW, inverse variance weighted; DIVW, biased
inverse-variance weighted; OR, odds ratio; SE, standard error; SNP, single
nucleotide polymorphism; TIBC, total iron binding capacity; TSAT, transferrin
saturation. A p value
The combined results were similar to the results in the discovery datasets, as exhibited in Supplementary Fig. 5 (A) and Supplementary Table 14b–f (B). In the reverse MR analysis, genetic liability to NAFLD (2022) was not significantly associated with four iron homeostasis indicators (2021) (Supplementary Table 14a, B), indicating that there was no causal effect of genetic liability to NAFLD on iron homeostasis. As shown in Supplementary Table 3 (A), when cigarettes per day or drinking per week were included in the MVMR model, there was still evidence that a genetically predicted serum iron or TAST had a significant effect on the risk of NAFLD.
Using the IVW method, sex-specific association found that the OR of NAFLD
dramatically increased to 1.723 [1.338, 2.219] (p = 2.48
 Fig. 3.
Sex-specific associations of genetically predicted iron
homeostasis (2021) with the risk of NAFLD (2022) using the IVW method. CI,
confidence interval; OR, odds ratio; TIBC, total iron binding capacity; TSAT,
transferrin saturation; NAFLD, nonalcoholic fatty liver disease. A p
value
Two-step MR analysis was performed to explain the mediation effect of dyslipidemia (LDL-C and TG) on the causal relationship between iron homeostasis and NAFLD (Table 2a,2b and Supplementary Table 15, B). Genetically predicted one-SD increase in serum iron was associated with 0.108 mg/dL lower LDL-C, and genetically predicted one-SD increase in LDL-C (44.1 mg/dL) was associated with 0.802 times the risk of NAFLD. In contrast, a genetically predicted one-SD increase in serum iron was associated with a 0.029 mg/dL increase in TG, and a genetically predicted one-SD increase in TG (100.2 mg/dL) was associated with a 1.420-fold increased risk of NAFLD. The proportion of the effect of serum iron on NAFLD mediated by LDL-C or TG levels was 9.52% and 3.97%, respectively. The effect of TAST on mediators (LDL-C and TG) and mediators on NAFLD was similar to that of serum iron, and the mediation proportion was 9.95% and 4.98% for LDL-C and TG, respectively.
| Mediator | Exposure→Mediator | Mediator→Outcome | Indirect OR | Direct OR | Mediation proportion | ||
| Beta | p value | OR | p value | ||||
| LDL-C | –0.108 (–0.166, –0.049) | 0.0003 | 0.802 (0.668, 0.963) | 0.0182 | 1.024 | 1.256 | 9.52% |
| TG | 0.029 (0.003, 0.054) | 0.0266 | 1.420 (1.155, 1.747) | 0.0009 | 1.010 | 1.274 | 3.97% |
| Mediator | Exposure→Mediator | Mediator→Outcome | Indirect OR | Direct OR | Mediation proportion | ||
| Beta | p value | OR | p value | ||||
| LDL-C | –0.092 (–0.138, –0.046) | 0.0001 | 0.802 (0.668, 0.963) | 0.0182 | 1.020 | 1.198 | 9.95% |
| TG | 0.028 (0.008, 0.048) | 0.0068 | 1.420 (1.155, 1.747) | 0.0009 | 1.010 | 1.210 | 4.98% |
Effect represents the beta coefficient estimated by IVW models for corresponding
association; OR, odd ratios; TSAT, Transferrin saturation; NAFLD, Nonalcoholic
fatty liver disease; T2D, Type 2 diabetes; LDL-C, Low-density lipoprotein
cholesterol; TG, Triglyceride. A p value
To the best of our knowledge, no previous study has carried out a MR analysis to explore the effect of iron status on NAFLD. This MR study found that genetic predisposition to higher levels of serum ferritin, serum iron or TSAT was associated with an increased risk of NAFLD, independent of genetically predicted smoking and drinking, and mediated by LDL-C and TG. There were no inverse associations of genetically predicted NAFLD risk with iron homeostasis indicators. Notably, the causal relationships between ferritin and NAFLD showed sex-specific differences and were particularly statistically significant in males.
The epidemiological investigations of iron homeostasis indicators and NAFLD outcomes are summarized in Supplementary Table 4 (A). Most research has focused on the association between serum ferritin and NAFLD severity in patients, with limited attention to its relationship with NAFLD risk in the general population [4, 5, 6, 7]. Only one large population-based study uncovered a positive association between serum ferritin and NAFLD risk, as well as a negative association between serum iron and NAFLD [11]. Serum iron, on the other hand, has been linked to a higher risk of hepatocellular carcinoma in NAFLD patients [8] and abnormally elevated ALT in the general population [9]. According to the current research background, the causal relationship between iron status indicators and NAFLD is ambiguous. This study established the causal direction of increased serum ferritin, serum iron, and TSAT to an increased risk of NAFLD.
As shown in Fig. 4, iron status involves multiple-hit progression of NAFLD. The initial hit is insulin resistance, which leads to an increased uptake and synthesis of free fatty acids stored as TG in hepatocytes, resulting in simple steatosis. Increased hepatic iron levels aggravated insulin resistance, and increased lipogenesis and gluconeogenesis in a genetically obese and iron overload mouse model [38]. The second hit is the production of oxidative stress and activation of inflammatory pathways, which accelerate the progression from steatosis to nonalcoholic steatohepatitis (NASH). Handa et al. [39] found that dietary iron induced hepatic oxidative stress, inflammation, and immune cell activation in a genetically obese mouse model. Iron accumulation promotes inflammation by altering macrophage polarization status [40]. The third hit is fibrosis, which progresses from NASH to cirrhosis. Persistent activation of hepatic stellate cells (HSCs) is an early and key event in fibrosis. Several studies have reported that iron promotes fibrosis by activating HSCs [41, 42]. Additionally, the experimental study in Caenorhabditis elegans revealed that iron overload activates sgk-1, encoding serum- and tissue-specific glucocorticoid-inducible kinase, which upregulates acs-20 and vit-2/3—homologous to mammalian fatty acid transport proteins (FATP1/4) and yolk lipoprotein genes [43]. This regulation enhances lipid uptake and facilitates lipid storage in lipid droplets, establishing a direct link between iron metabolism and lipid accumulation. Complementarily, clinical investigations in dialysis patients demonstrate a correlation between hepatic iron overload and increased hepatic proton density fat fraction (PDFF), as measured by MRI [44]. These findings indicate that iron deposition aggravates hepatic lipid accumulation, potentially through oxidative stress and dysregulation of lipid metabolism pathways. Together, these studies suggest that iron overload not only acts as a “first hit” by initiating lipid accumulation but also serves as a “second hit” by amplifying hepatic injury and accelerating NAFLD progression.
 Fig. 4.
Multiple-hit mechanism on how iron overload may contribute to NAFLD.
The causal relationship from genetically predicted ferritin to NAFLD exhibited sex differences, implying that males were more vulnerable to increased ferritin, which could be explained by the protective role of endogenous estrogens in female. Among younger patients, the prevalence of both NAFLD and NASH was 2–3 times higher in men than in women, while the prevalence of NASH was higher in women after 60 years of age [45]. An epidemiologic study consistently found that menopause, as a natural state of estrogen deficiency, was associated with an increased risk of hepatic steatosis [46].
The study discovered that elevated TG mediated approximately 3%–5% of the observed effect of serum iron and TSAT on NAFLD risk, while decreased LDL-C mediated 9%–10%. A previous MR study also found that dyslipidemia characterized by low levels of LDL-C and high levels of TG was associated with an increased risk of NAFLD [47]. Moreover, sufficient evidence found that iron overload caused lipid metabolism disorders, especially elevated circulating TG [48, 49, 50, 51]. The plasma nonesterified fatty acid (NEFA) pool is the primary source of fatty acids for TG synthesis in the liver. Adipose tissue via TG lipolysis is the primary contributor to the plasma NEFA pool. A retrospective study, including 740 patients with NAFLD, found that steatosis severity was higher in those with low LDL-C [52], which impaired lipid export from hepatocytes. Elevated TG and decreased LDL-C mediate iron overload-induced imbalances in fatty acid uptake, synthesis, and oxidative and secretory pathways in the liver, eventually leading to NAFLD.
From a clinical perspective, this study provides valuable insights into the clinical implications of iron homeostasis in the pathogenesis of NAFLD, offering evidence of its significant role in disease progression and potential therapeutic avenues. The identification of TG and LDL-C as partial mediators’ points to the potential utility of targeted lipid-lowering interventions to mitigate the risk of NAFLD in individuals with elevated iron parameters. Furthermore, the observed sex differences in the causal association between ferritin and NAFLD risk emphasize the necessity of sex-specific considerations in disease prevention and management strategies.
The most notable strength of the study is that extensive sensitivity analyses and replication studies were performed. In addition, we used sex-specific MR, MVMR, and mediation analysis to dig deeper into the correlation mechanism between iron homeostasis and NAFLD. However, limitations should be kept in mind when interpreting our results. The major issue for any MR study is horizontal pleiotropy, which means that certain genetic instrument variables influence the risk of outcome not through exposure but through other alternative pathways. However, various measures were employed to minimize the effects of pleiotropy, although residual confounding may still exist. In addition, the nonlinear association and gene‒environmental interaction could not be estimated in summary-level genetic statistics. At last, although we performed a stratified analysis of sex by making full use of the data, a stratified analysis of other factors could not be achieved, such as age and BMI. Future research should aim to explore gene-environment interactions. Additionally, clinical interventions targeting iron metabolism, such as iron chelation therapies or modulation of key iron-regulatory genes, may offer potential therapeutic strategies for NAFLD, particularly in individuals with iron overload.
In conclusion, this study presents MR evidence supporting the causal roles of elevated serum iron, ferritin and TAST in the development of NAFLD, as well as the mediation effects of increased TG and decreased LDL-C. The causal relationship between serum ferritin and NAFLD risk was stronger in males. These findings underscore the importance of managing iron homeostasis and lipid homeostasis as an effective strategy of NAFLD treatment and concerns for sensitive populations.
The datasets used and analyzed during the current study are available from the corresponding author on reasonable request.
YZ and DC contributed equally to this manuscript. YZ: Conceptualization, Methodology, Formal analysis, Software, Writing - Original draft preparation, Supervision. DC: Methodology, Data Curation, Formal analysis, Validation, Writing - Review & Editing. ZL: Software, Visualization. LZ: Writing - Review & Editing. HZ: Funding acquisition, Conceptualization. LW: Funding acquisition, Validation. XY: Data interpretation, Writing - Review & Editing. WZ: Software, Validation, Data interpretation, Writing - Review & Editing. KD: Data analysis, Validation. CA: Data analysis, Validation. All authors contributed to editorial changes in the manuscript. All authors read and approved the final manuscript. All authors have participated sufficiently in the work and agreed to be accountable for all aspects of the work.
Not applicable.
The authors thank all the participants and researchers who contributed and collected data.
This work was supported by the Sanming Project of Medicine in Shenzhen No. SZSM202111001.
The authors declare no conflict of interest.
Supplementary material associated with this article can be found, in the online version, at https://doi.org/10.31083/IJVNR26773.
References
Publisher’s Note: IMR Press stays neutral with regard to jurisdictional claims in published maps and institutional affiliations.