

 , Lijiao Xiong 3,†, Yanmei Cen 2,†, Guo Hong 1,2, Yingao Shen 1, Xiaoguang Luo 1,*
1 Department of Neurology, Shenzhen People’s Hospital (The Second Clinical Medical College, Jinan University; The First Affiliated Hospital, Southern University of Science and Technology), 518001 Shenzhen, Guangdong, China
2 The First Clinical Medical College of Jinan University, 510632 Guangzhou, Guangdong, China
3 Department of Geriatrics, Shenzhen People’s Hospital (The Second Clinical Medical College, Jinan University; The First Affiliated Hospital, Southern University of Science and Technology), 518001 Shenzhen, Guangdong, China
†These authors contributed equally.
Abstract
Parkinson’s disease (PD) is a chronic progressive neurodegenerative disease, and the exact etiology of PD has not been fully elucidated. Changes in dietary patterns play an important role in the onset and progression of PD. However, the association between specific dietary factors and PD remains unclear.
A total of 14,309 subjects from the National Health and Nutrition Examination Survey (NHANES) (2007–2016) were included. Logistic regression was used to analyze the association between 34 nutrients and PD. The regression model was adjusted for potential confounders and effect modifiers including age, gender, race, education, hypertension, and stroke.
The data showed negative associations of the intake of protein (0.99 (0.98, 1.00), p = 0.018), fiber (0.96 (0.93, 0.99), p = 0.003), vitamin E (0.91 (0.86, 0.97), p = 0.005), copper (0.55 (0.36, 0.86), p = 0.009) with PD. Alpha carotene (p = 0.042), beta-carotene (p = 0.006), phosphorus (p = 0.018), magnesium (p = 0.002), sodium (p = 0.035), potassium (p = 0.001) had a potential negative correlation with PD. The intake of carbohydrate, sugars, fat, cholesterol, vitamin A, beta-cryptoxanthin, lycopene, lutein zeaxanthin, vitamin B1, vitamin B2, niacin, vitamin B6, folate, vitamin B12, vitamin C, vitamin D, vitamin K, calcium, iron, zinc, selenium, caffeine, theobromine, alcohol was not associated with PD (p > 0.05).
Some specific dietary elements are associated with PD, and supplementation of dietary elements may have potentially beneficial effects. However, the observed associations between dietary factors and PD may be influenced by changes in diet resulting from the disease itself, rather than diet influencing PD risk. Further longitudinal studies are needed to establish causal relationships and directionality.
Keywords
- Parkinson's disease (PD)
- dietary intakes
- National Health and Nutrition Examination Survey (NHANES)
Parkinson’s disease (PD) is an increasingly common neurodegenerative disorder with a multifactorial etiology in many aging societies [1]. The number of patients with PD is constantly increasing. A total of 630,000 people in the United States are diagnosed with PD every year, additionally, the projected number of Western Europeans affected by this disorder is expected to increase to ten million by 2030 [2]. PD is characterized by bradykinesia, restless tremor, rigidity, and postural instability. Besides, PD includes non-motor symptoms, such as cognitive decline, constipation, depression, hyposmia, and urinary dysfunction, and the severity of symptoms has a significant impact on the quality of life of patients [3, 4]. Although it is urgent to reduce the incidence of PD, the underlying pathogenesis of PD remains unclear.
Clinician scientists are beginning to pay attention to the relationship between nutrition, dietary patterns, and PD. The nutritional status of an individual seriously affects the quality of life in PD patients [5, 6]. There is a direct relationship between individual malnutrition and the severity of PD symptoms [7], and healthy nutrition and diet emerge as potential areas to reduce the risk of PD [8]. Antioxidants, such as some vitamins, carotenoids, lutein, fruits, and vegetables, have different effects on the natural course of PD [9, 10, 11, 12, 13]. However, the vast majority of studies have explored the relationship between PD and a single or few antioxidant changes, and the results of these studies are not completely consistent [9, 11, 14, 15, 16]. This is because the population size of previous studies was small, and the overall impact of the complexity of dietary intake was ignored. Nutrition and diet represent modifiable risk factors for PD, more epidemiological studies are needed to validate the relationship between them.
The National Health and Nutrition Examination Survey (NHANES) is a research program designed to assess the health and nutritional status of adults and children in the United States. The Centers for Disease Control and Prevention (CDC) is responsible for providing important health statistics for the nation. To our knowledge, this is the first study to comprehensively investigate the relationship between dietary intake and PD using NHANES data. This study aims to investigate the association between dietary intake and PD in a representative sample of Americans, which can be used as a reference for the prevention of PD.
The data used in this study were acquired from NHANES (https://www.cdc.gov/nchs/nhanes/index.htm) website. This is a cross-sectional survey conducted by the National Center for Health Statistics (NCHS) and the Centers for Disease Control and Prevention. For this study, a dataset was constructed using publicly available data files of NHANES responses from 2007 to 2016. A total of 14,039 NHANES respondents over 40 years of age were included and interviewed about their dietary intake and medical status. The entire data integration process is shown in Fig. 1.
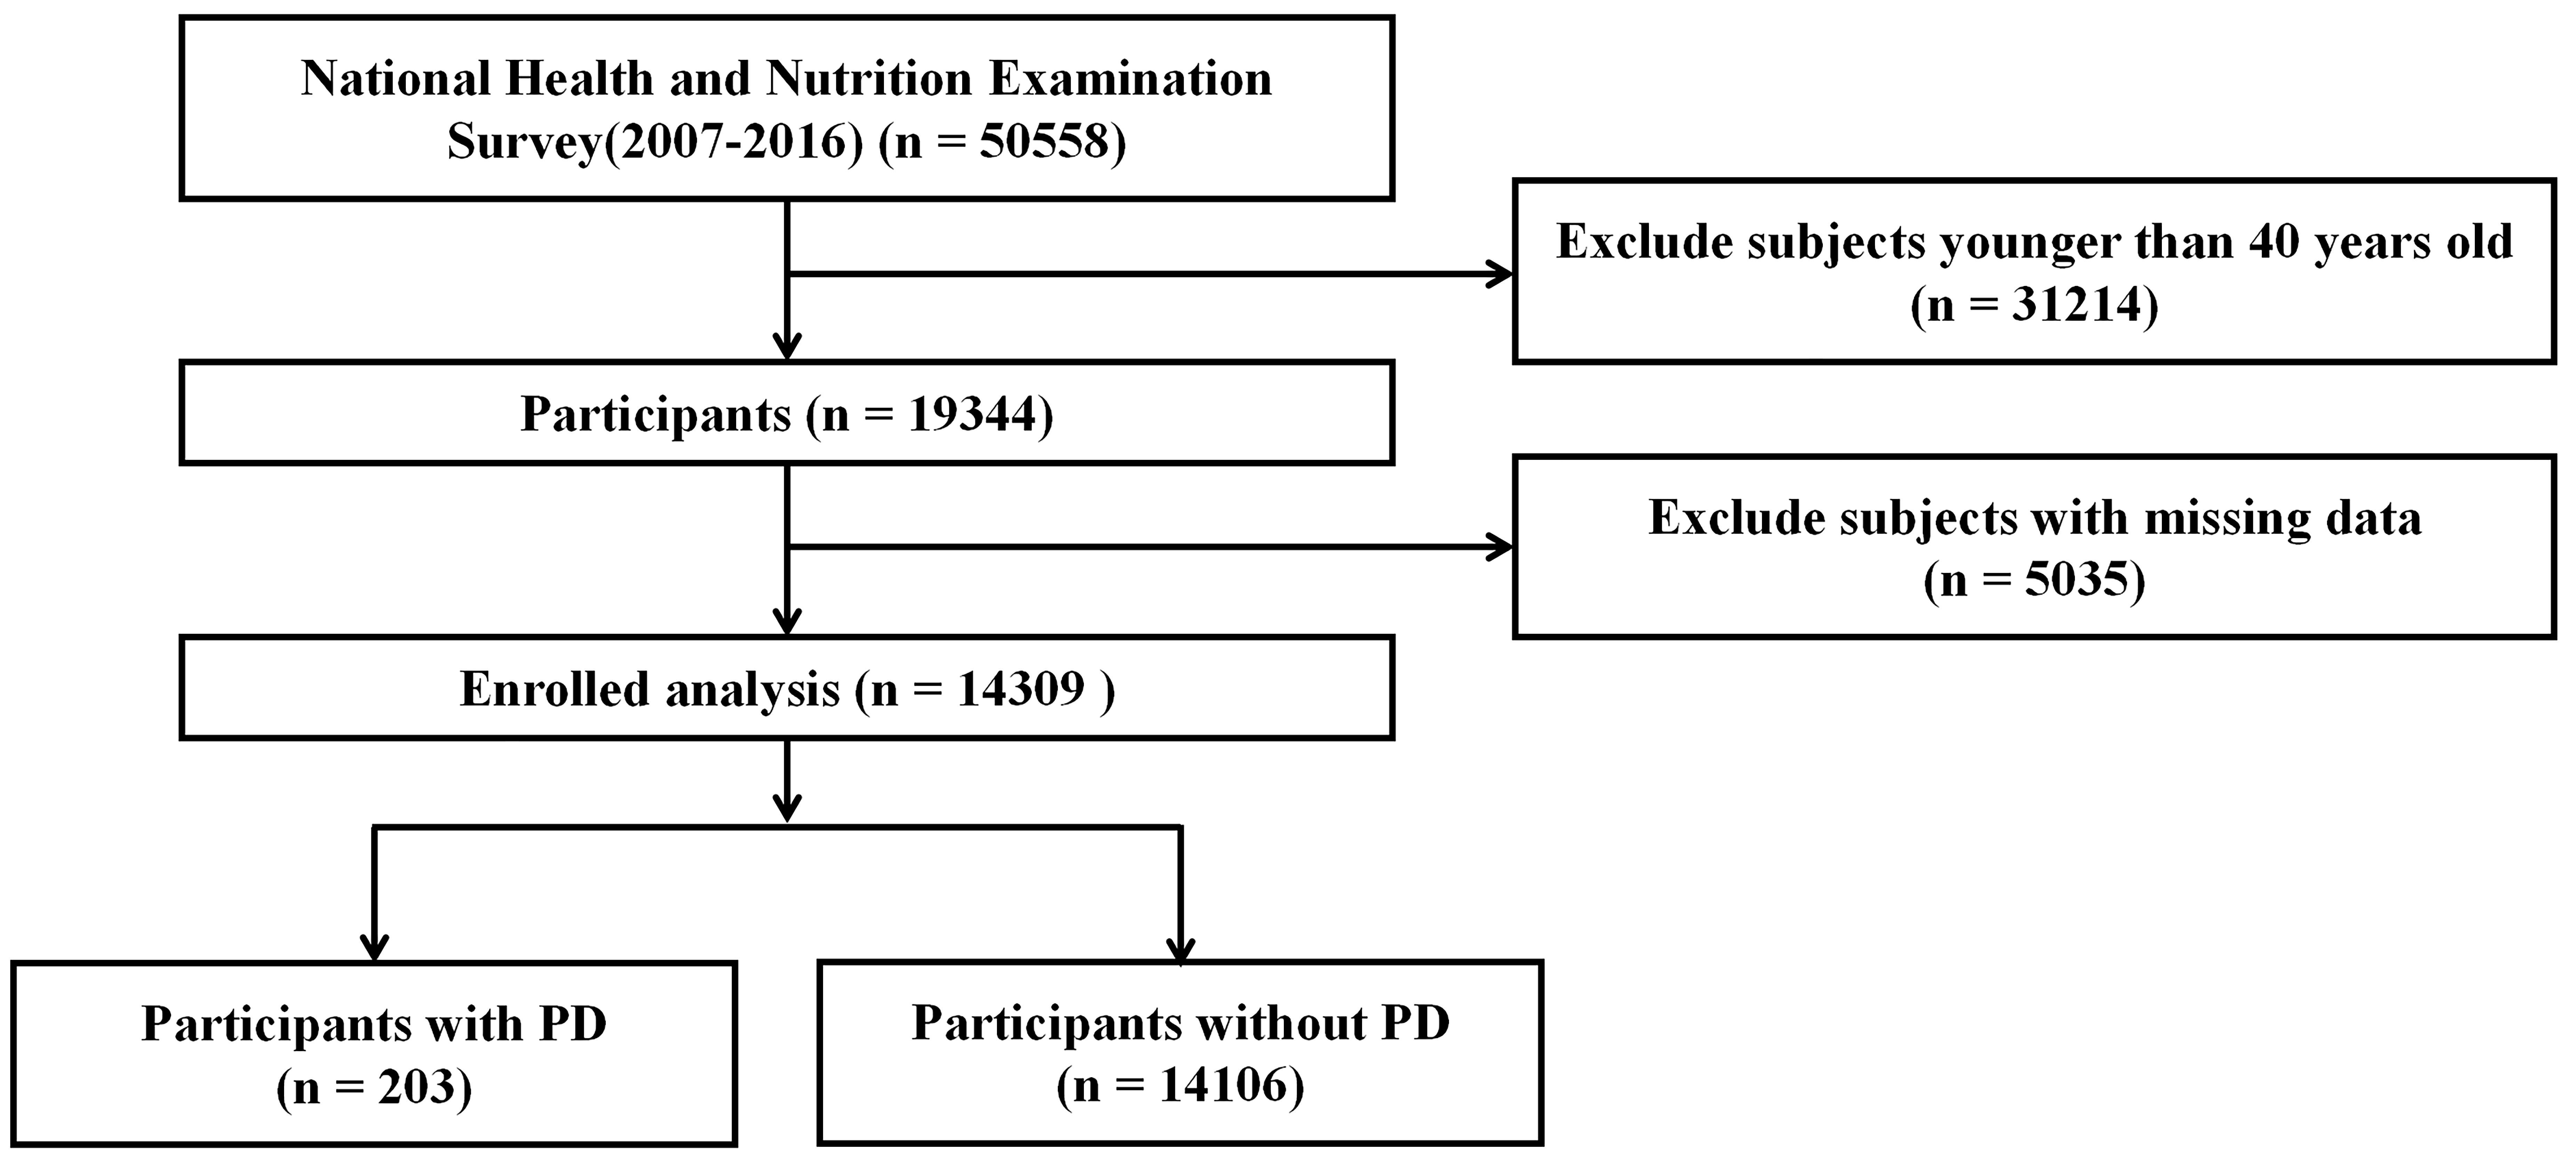 Fig. 1.
 Flowchart of study participants. PD, parkinson’s disease.
PD cases were identified by specifying “Second Level Category Name” as “ANTIPARKINSON AGENTS” in the “Multum Lexicon Therapeutic Classification Scheme” within the NHANES database.
To assess total dietary intakes in the NHANES, interviewers conducted two consecutive 24-hour dietary recalls. In the first case, the conclusion was made face-to-face at the MEC examination, and in the second case, the conclusion was made by telephone within 3–10 days. Dietary intakes were calculated from the average of data from two dietary recalls; otherwise, the single diet data of participants were deleted.
A total of 34 dietary factors were included in the NHANES dietary questionnaire. These factors encompassed protein (g), carbohydrate (g), total sugars (g), fiber (g), fat (g), cholesterol (mg), vitamin A (µg),
The choice of covariates in our study has been considered a potential confounding factor in previous studies [17, 18, 19]. We assessed demographic covariates including age, gender, race, education, and some diseases including diabetes, hypertension, stroke, coronary heart disease, hyperlipidemia, and viral hepatitis. We excluded interviewers with missing covariate data.
We considered all survey sampling weights when analyzing the data. We followed the NHANES analytic and reporting guidance for all analysis procedures. For all individuals in the present study, descriptive analyses were performed on the characteristics of each participant. Continuous variables are presented as means and standard deviations (SD), while categorical variables are presented as frequencies and percentages. Univariate analysis was used in population characteristics, and changes in continuous and categorical variables were compared using t-tests and chi-square tests; variables with p-value
Compared to the participants without PD, the PD participants were more likely to be older (p = 0.008), tended to be non-Hispanic white (p = 0.005), tended to be female (p = 0.017), and represented more likely associated with hypertension (p = 0.005) and stroke (p
| Variable | Total | Non-Parkinson | Parkinson | p-value | |
| Number | 14,309 | 14,106 | 203 | ||
| Age | 57.67 (0.19) | 57.62 (0.19) | 61.20 (1.33) | 0.008** | |
| Gender | 0.017* | ||||
| Male | 6827 (47.71) | 6738 (46.89) | 89 (33.99) | ||
| Female | 7482 (52.29) | 7368 (53.11) | 114 (66.01) | ||
| Race | |||||
| Non-Hispanic White | 6749 (47.17) | 6616 (72.94) | 133 (83.24) | 0.005** | |
| Non-Hispanic Black | 2942 (20.56) | 2913 (9.93) | 29 (7.83) | ||
| Mexican American | 1960 (13.7) | 1940 (6.24) | 20 (3.99) | ||
| Other Race | 2658 (18.58) | 2637 (10.88) | 21 (4.94) | ||
| Education | 0.109 | ||||
| Below high school | 3697 (25.84) | 3635 (16.04) | 62 (25.02) | ||
| High School | 3311 (23.14) | 3267 (22.93) | 44 (20.90) | ||
| Over high school | 7301 (51.02) | 7204 (61.03) | 97 (54.08) | ||
| BMI | 29.37 (0.11) | 29.36 (0.11) | 30.23 (0.58) | 0.14 | |
| DM | 0.296 | ||||
| no | 10,779 (75.33) | 10,641 (81.49) | 138 (77.99) | ||
| yes | 3530 (24.67) | 3465 (18.51) | 65 (22.01) | ||
| Hypertension | 0.005** | ||||
| no | 6317 (44.15) | 6253 (50.18) | 64 (33.85) | ||
| yes | 7992 (55.85) | 7853 (49.82) | 139 (66.15) | ||
| Stroke | |||||
| no | 13,528 (94.54) | 13,354 (95.82) | 174 (84.83) | ||
| yes | 781 (5.46) | 752 (4.18) | 29 (15.17) | ||
| Coronary heart disease | 0.392 | ||||
| no | 13,448 (93.98) | 13,260 (94.79) | 188 (91.91) | ||
| yes | 861 (6.02) | 846 (5.21) | 15 (8.09) | ||
| Hyperlipidemia | 0.973 | ||||
| no | 2842 (19.86) | 2800 (19.50) | 42 (19.64) | ||
| yes | 11,467 (80.14) | 11,306 (80.50) | 161 (80.36) | ||
| Viral hepatitis | 0.448 | ||||
| no | 13,899 (97.13) | 13,705 (97.62) | 194 (96.71) | ||
| yes | 410 (2.87) | 401 (2.38) | 9 (3.29) | ||
Data presented are mean (SD) or n (%), * p
Table 2 presents the dietary intake of the included participants. Compared to the non-PD participants, PD patients took fewer specific dietary components, including significantly less protein, fiber, fat, various vitamins (B1, B2, B6, C, D, E, K, niacin, folate), minerals (phosphorus, magnesium, zinc, copper, sodium, potassium, selenium), and carotenoids (
| Variables | Total | Non-Parkinson | Parkinson | p-value |
| Protein (g) | 79.60 (0.44) | 79.75 (0.43) | 68.80 (2.33) | |
| Carbohydrate (g) | 239.74 (1.59) | 239.88 (1.59) | 229.81 (8.76) | 0.252 |
| total sugars (g) | 105.18 (0.82) | 105.12 (0.82) | 109.27 (6.31) | 0.516 |
| dietary_fiber (g) | 17.33 (0.16) | 17.37 (0.16) | 14.35 (0.55) | |
| total fat (g) | 78.28 (0.56) | 78.41 (0.56) | 68.74 (2.86) | 0.001** |
| Cholesterol (mg) | 280.70 (2.26) | 280.87 (2.28) | 268.14 (13.34) | 0.348 |
| vitamin A (µg) | 669.87 (9.53) | 670.58 (9.57) | 619.43 (52.56) | 0.332 |
| 462.81 (16.47) | 465.03 (16.68) | 305.64 (41.47) | ||
| 2486.84 (60.64) | 2499.37 (61.72) | 1596.26 (177.64) | ||
| 90.35 (2.50) | 90.76 (2.55) | 61.73 (7.72) | ||
| Lycopene (µg) | 5077.70 (118.66) | 5092.78 (119.98) | 4005.53 (527.36) | 0.05 |
| lutein zeaxanthin (µg) | 1703.69 (45.33) | 1709.88 (45.39) | 1263.97 (200.53) | 0.028* |
| vitamin B1 (µg) | 1.58 (0.01) | 1.59 (0.01) | 1.45 (0.04) | 0.003** |
| vitamin B2 (µg) | 2.14 (0.02) | 2.14 (0.02) | 1.98 (0.07) | 0.015* |
| Niacin (mg) | 24.51 (0.17) | 24.56 (0.17) | 21.16 (0.71) | |
| vitamin B6 (mg) | 2.03 (0.02) | 2.04 (0.02) | 1.77 (0.06) | |
| Folate (µg) | 222.83 (1.91) | 223.34 (1.90) | 186.73 (8.68) | |
| vitamin B12 (µg) | 5.06 (0.08) | 5.06 (0.08) | 4.74 (0.22) | 0.18 |
| vitamin C (mg) | 82.89 (1.26) | 83.10 (1.26) | 67.47 (6.58) | 0.02* |
| vitamin D (µg) | 4.79 (0.05) | 4.80 (0.05) | 4.27 (0.23) | 0.023* |
| vitamin E (mg) | 8.51 (0.11) | 8.54 (0.11) | 6.66 (0.35) | |
| vitamin K (µg) | 119.74 (3.02) | 120.17 (3.05) | 89.37 (9.01) | 0.002** |
| Calcium (mg) | 928.56 (7.47) | 929.30 (7.47) | 875.68 (32.47) | 0.101 |
| Phosphorus (mg) | 1340.49 (7.97) | 1342.64 (7.98) | 1187.61 (30.71) | |
| Magnesium (mg) | 301.12 (2.36) | 301.77 (2.35) | 254.88 (7.62) | |
| Iron (mg) | 14.77 (0.12) | 14.78 (0.12) | 13.94 (0.68) | 0.22 |
| Zinc (mg) | 11.29 (0.11) | 11.31 (0.11) | 9.92 (0.34) | |
| Copper (mg) | 1.29 (0.01) | 1.30 (0.01) | 1.07 (0.04) | |
| Sodium (mg) | 3359.94 (21.24) | 3365.57 (21.45) | 2959.75 (91.06) | |
| Potassium (mg) | 2723.69 (17.31) | 2729.03 (17.14) | 2343.72 (67.79) | |
| Selenium (µg) | 110.07 (0.70) | 110.25 (0.70) | 97.47 (3.12) | |
| Caffeine (mg) | 187.28 (3.52) | 187.69 ( 3.53) | 157.65 (16.38) | 0.069 |
| Theobromine (mg) | 37.40 (0.75) | 37.36 (0.77) | 40.36 (5.93) | 0.625 |
| Alcohol (g) | 8.72 (0.36) | 8.77 (0.36) | 4.89 (0.92) |
Data presented are mean (SD), * p
| Characters | Estimate | OR (95% CI) | p-value |
| Protein (g) | –0.01 | 0.99 (0.98, 1.00) | 0.018* |
| Carbohydrate (g) | 0 | 1.00 (1.00, 1.00) | 0.834 |
| total sugars (g) | 0 | 1.00 (1.00, 1.01) | 0.155 |
| dietary_fiber (g) | –0.04 | 0.96 (0.93, 0.99) | 0.003** |
| total fat (g) | –0.01 | 0.99 (0.99, 1.00) | 0.08 |
| Cholesterol (mg) | 0 | 1.00 (1.00, 1.00) | 0.788 |
| vitamin A (µg) | 0 | 1.00 (1.00, 1.00) | 0.499 |
| 0 | 1.00 (1.00, 1.00) | 0.042* | |
| 0 | 1.00 (1.00, 1.00) | 0.006** | |
| 0 | 1.00 (1.00, 1.00) | 0.07 | |
| Lycopene (µg) | 0 | 1.00 (1.00, 1.00) | 0.201 |
| lutein zeaxanthin (µg) | 0 | 1.00 (1.00, 1.00) | 0.245 |
| vitamin B1 (µg) | –0.16 | 0.85 (0.65, 1.13) | 0.267 |
| vitamin B2 (µg) | –0.12 | 0.89 (0.71, 1.12) | 0.307 |
| Niacin (mg) | –0.02 | 0.98 (0.95, 1.00) | 0.052 |
| vitamin B6 (mg) | –0.19 | 0.83 (0.67, 1.02) | 0.073 |
| Folate (µg) | 0 | 1.00 (0.99, 1.00) | 0.051 |
| vitamin B12 (µg) | –0.01 | 0.99 (0.96, 1.02) | 0.708 |
| vitamin C (mg) | 0 | 1.00 (0.99, 1.00) | 0.081 |
| vitamin D (µg) | –0.02 | 0.98 (0.94, 1.01) | 0.172 |
| vitamin E (mg) | –0.09 | 0.91 (0.86, 0.97) | 0.005** |
| vitamin K (µg) | 0 | 1.00 (0.99, 1.00) | 0.089 |
| Calcium (mg) | 0 | 1.00 (1.00, 1.00) | 0.552 |
| Phosphorus (mg) | 0 | 1.00 (1.00, 1.00) | 0.018* |
| Magnesium (mg) | 0 | 1.00 (1.00, 1.00) | 0.002** |
| Iron (mg) | 0 | 1.00 (0.96, 1.03) | 0.79 |
| Zinc (mg) | –0.04 | 0.96 (0.93, 1.00) | 0.061 |
| Copper (mg) | –0.59 | 0.55 (0.36, 0.86) | 0.009** |
| Sodium (mg) | 0 | 1.00 (1.00, 1.00) | 0.035* |
| Potassium (mg) | 0 | 1.00 (1.00, 1.00) | |
| Selenium (µg) | 0 | 1.00 (0.99, 1.00) | 0.1 |
| Caffeine (mg) | 0 | 1.00 (1.00, 1.00) | 0.249 |
| Theobromine (mg) | 0 | 1.00 (1.00, 1.00) | 0.569 |
| Alcohol (g) | –0.01 | 0.99 (0.98, 1.00) | 0.052 |
Adjustment for potential confounders including age, race, gender, hypertension, and stroke. * p
This is the first comprehensive investigation of the relationship between dietary intakes and PD in the US population based on the NHANES database. In this cross-sectional study, decreased intake of protein, fiber, vitamin E, and metals including copper was associated with an increased risk of PD. In addition, many specific dietary elements were statistically different between PD and non-PD populations.
Malnutrition is a key indicator to measure nutritional status. Studies have shown that 3%–60% of PD patients are at risk of malnutrition [20], which is related to dysphagia and anosmia in PD [6]. There is a reduction in food intake in PD patients [6]. In our study, PD patients had a reduction in protein intake, and protein intake was negatively correlated with PD risk. It is worth noting that a low-protein diet may have a protective effect on PD [21, 22], which can improve the body’s response to dopamine, and the patient’s motor symptoms can be better improved [21]. Therefore, PD patients may tend to deliberately slow the progression of the disease by reducing protein uptake. Constipation is a very common symptom of PD [23]. Reduced dietary fiber intake affects intestinal health and gut microbiota composition and can cause constipation [24]. EFSA proposed that 25 grams of dietary fiber per day is sufficient intake to ensure normal defecation in adults [25]. However, studies suggest that nearly half of PD patients have less than 25 grams of dietary fiber per day [26]. Dietary fiber intake in our study was inversely associated with PD risk. Constipation is one of the clinical symptoms of early PD. Changes in dietary structure may already exist in early PD, and PD patients should supplement dietary fiber to improve constipation [27]. In addition, a high dietary fiber diet can reduce neuroinflammation in aging mice [28], and a low protein-high dietary fiber diet pattern may be a promising new direction for the treatment of PD in the future. Moreover, individuals with PD exhibited a decrease in overall fat consumption, although our study did not find a significant correlation between total fatty intake and the risk of developing PD. A prospective cohort study demonstrated a link between the consumption of low-fat dairy products and an increased risk of PD [29], while another study yielded similar results to our own, finding no significant disparity between the two [30]. Notably, research has shown that individuals with PD tend to consume higher levels of trans fats compared to those without the disease [31]. Furthermore, prolonged consumption of a high-fat diet in healthy mice resulted in the development of peripheral insulin resistance and exhibited nigrostriatal dopaminergic dysfunction and parkinsonism, indicating a potential association between high-fat diet, insulin resistance, and PD [32]. The variability in these findings may be attributed to the variations in the composition of dietary fats consumed, underscoring the necessity for further research to elucidate the relationship between fat intake and the risk of developing PD, as well as to inform preventive strategies.
Dietary antioxidants, such as vitamin C, vitamin E, and carotene, can prevent oxidative damage and have been suggested as neuroprotective agents for PD [33, 34]. However, the epidemiological results of previous studies have been inconsistent. Previous cross-sectional studies have shown an inverse association between vitamin E and the risk of PD [9, 35], and one of the negative associations was significant only in women [9, 16]. Some results of prospective studies suggest no association between vitamin E and PD [15, 36], such as the Honolulu Heart Study cohort, which found no association between vitamin E and PD risk through nearly 30 years of follow-up [15]. In a 12-year cohort study in China, increased vitamin E intake was associated with a reduced risk of PD [37]. These results are difficult to interpret because of the potential impact of recall and selection bias. In our study, taking less vitamin E may enhance a person’s risk of developing PD. Some dietary antioxidant vitamins (such as vitamin C and vitamin B) did not affect the risk of PD, and our results in this study are consistent with these conclusions [37]. Lutein has been reported to be positively associated with PD risk [38], and this relationship was not found in our study. Carotene is a pro-vitamin A carotenoid present in fruits and vegetables, and the ability of Carotene to protect the nervous system has been illustrated over the past decade [39]. The entry of carotene into the body can reduce oxidative damage by scavenging oxygen free radicals [40]. Results of a meta-analysis suggest an inverse, but nonsignificant, association between dietary carotene intake and PD risk [41]. The results of another study, like ours, suggest that carotene intake is significantly associated with a reduced risk of PD [16]. In addition, our study also found that
Certain dietary metal elements serve as essential nutrients and also play a crucial role in antioxidant activity by forming complexes in the body to regulate the balance of free radicals, which is closely linked to the development of neurodegenerative diseases [42, 43]. A meta-analysis study indicated that while moderate to high iron intake was not correlated with the risk of PD overall, subgroup analysis revealed a positive association between high iron intake and PD risk in Western populations (1.47, (1.17–1.85), p = 0.001) [44]. Moderate to high intakes of zinc and copper were found to not significantly increase the risk of PD, with only limited support from two small studies [10, 44]. However, there remains a lack of conclusive evidence on this relationship. Our study also found no association between iron and zinc intake and the risk of PD. Interestingly, a decrease in copper intake was associated with an increased risk of PD in our study (0.55 (0.36, 0.86), p = 0.009) Copper is an essential micronutrient crucial for human health and development, as it plays a key role in antioxidant activity and mitochondrial energy metabolism through its involvement in superoxide dismutase-1 (SOD1) and cytochrome-c-oxidase [45]. One study demonstrated a reduction in copper levels in the substantia nigra of individuals with PD [42], while a separate case-control study indicated significantly lower total blood copper levels and ceruloplasmin in PD patients [46]. However, the relationship between these findings and copper intake remains unclear. Copper has the potential to induce neurotoxicity through chemical redox reactions that generate free radicals, potentially leading to neuronal damage [47]. Additionally, copper has been shown to worsen
Our study also has some limitations. Information on dietary intake was based on self-reported 24-hour recall, which may be biased compared to objective data. And long-term food intake is not exactly consistent with what is reported over 24 hours. In addition, some data were removed because of missing information, which also affected the analysis. Not using older and more recent NHANES cycles may have caused the results to be biased. Although we adjusted for some known covariates, many interactions among dietary intake itself may have affected the results of the study, and some unknown residual confounding (e.g., education level, income, or energy intake) may confound the results. Besides, in this study, the confirmation of PD cases was primarily based on a questionnaire inquiring about the use of anti-PD medications, which has inherent limitations. Firstly, it lacks clinical confirmation and may fail to capture undiagnosed or untreated PD cases, potentially underestimating the disease prevalence. Secondly, some patients may be taking anti-PD medications for reasons other than PD, leading to potential misclassification of cases. Although the use of a relatively broad case definition is permissible in epidemiological studies, it is essential to acknowledge its limitations. Based on the self-reporting of patients using antiparkinson agents, we failed to distinguish the participants who were in the early stage of PD. Since this is a cross-sectional study, the causal relationship between food intake and PD remains unclear. Future research requires more rigorous clinical assessments and diagnostic methods to accurately classify cases and investigate disease-related factors.
Our findings underscore the importance of specific dietary components in PD risk reduction. While more research is needed to establish causality and to understand the mechanisms underlying these associations, our study provides valuable insights that could inform future dietary recommendations for PD prevention and treatment.
Publicly available datasets were analyzed in this study. This data can be found here: https://www.cdc.gov/nchs/nhanes/index.htm.
ZHZ designed the study. ZHZ and LJX wrote the manuscript. ZHZ, YMC, GH, YAS, and XGL collected, analyzed, and interpreted the data. XGL critically reviewed, edited, and approved the manuscript. All authors read and approved the final manuscript. All authors have participated sufficiently in the work and agreed to be accountable for all aspects of the work.
The studies involving human participants were reviewed and approved by the NCHS Research Ethics Review Board (ERB) (https://www.cdc.gov/nchs/nhanes/irba98.htm). Written informed consent for participation was not required for this study following the national legislation and the institutional requirements.
The author thanks the staff and the participants of the NHANES study for their valuable contributions.
This work was supported by Science and Technology Planning Project of Shenzhen Municipality (KCXFZ20201221173605013).
The authors declare no conflict of interest.
References
Publisher’s Note: IMR Press stays neutral with regard to jurisdictional claims in published maps and institutional affiliations.