


 , Rui Zhang 1,2,†, Yalan Wang 1,2, Fan Wu 1, Tongyan Zhang 3, Dongxuan Li 1,*
 , Qian Du 1,2,*
1 Department of Pharmacy, The Third Affiliated Hospital of Chongqing Medical University, 401120 Chongqing, China
2 College of Pharmacy, Chongqing Medical University, 400016 Chongqing, China
3 Infectious Disease Department, Second Affiliated Hospital of Tianjin University of Traditional Chinese Medicine, 300250 Tianjin, China
†These authors contributed equally.
Abstract
Comprehensive quantitative and comparative risk data on drug-induced acute kidney injury (AKI) remain limited. Thus, this study aimed to supplement the current data with information from the FDA Adverse Event Reporting System (FAERS) database.
Based on the collected AKI-related reports in the FAERS database from 2004 to 2023, we summarized a list of reported nephrotoxic drugs, compiling counts of the most frequently reported single drugs and drug classes. A disproportionality analysis was used to evaluate the AKI risk of reported drugs, and histological and onset time analyses were conducted.
A total of 1456 drugs were reported as culprit drugs in the 327,561 AKI-related reports in the FAERS database, most of which were antineoplastic agents. Omeprazole was the most frequently reported single drug, followed by furosemide, pantoprazole, esomeprazole, and lansoprazole. Drugs for acid-related disorders were the most commonly reported drug class, followed by agents acting on the renin–angiotensin system, antineoplastic agents, immunosuppressants, and analgesics. In the disproportionality analysis, 1021 drugs showed different degrees of association with the occurrence of AKI, among which eight drugs (spironolactone, mycophenolic acid, enalapril, valsartan, candesartan, gentamicin, vancomycin, and nifedipine) had the largest number of positive signals, with 15 positive signals each. Drugs acting as an antineoplastic agent were the class with the largest number of positive signal drugs in most preferred term groups; however, the imbalance of risk signal distribution among drug classes reflected the subsequent risk differences in relation to AKI. In the histological analysis, tubulointerstitial injury was the most commonly reported type of histological injury. In the onset time analysis, vancomycin presented the shortest median onset time, while the median onset time for lansoprazole was the longest.
Our study integrated quantitative and comparative AKI risk data for 1456 reported culprit drugs using the FAERS database, which can provide reference information for clinical practice.
Keywords
- acute kidney injury
- acute renal failure
- adverse drug reaction
- pharmacovigilance
- data mining
Acute kidney injury (AKI) is a rapid decline in the kidneys’ ability to filter metabolic waste products from the blood, which manifests clinically as an abrupt and sustained increase in the serum levels of urea and creatinine with an associated disruption of salt and water homeostasis [1]. It is a common disorder of renal function that affects 7 to 18% of hospital inpatients and 20–200 per million population in the community worldwide [2], significantly increasing the risk of death, economic burden, and the probability of progression to end-stage renal disease and chronic kidney disease [3, 4, 5].
There are many known etiologies of AKI, mainly including sepsis, critical illness, circulatory shock, burns, trauma, cardiac surgery, major non-cardiac surgery, poisonous plants and animals, radiocontrast agents, and nephrotoxic drugs [6, 7]. Among them, drugs are the third to the fifth leading cause of AKI [8], accounting for about 18%–27% of all AKI cases [9], and even as high as 66% in elderly patients [10]. Due to the prominent position of drugs in the etiology of AKI, the 2012 AKI guideline of the Kidney Disease Improving Global Outcomes (KDIGO) group recommended that the management of potentially nephrotoxic drugs should be the basic intervention measures throughout the four stages of AKI (high risk of AKI, AKI stage 1, 2, and 3) [11]. In this context, it is of great significance for medical professionals to be familiar with the potential nephrotoxicity of drugs to ensure the management quality of AKI.
In clinical practice, medical professionals usually rely on primary, secondary, and (or) tertiary information sources to obtain information on nephrotoxic drugs [8]. However, this process may not run smoothly because of the substantial fragments and discrepancies in nephrotoxicity information provided by various sources [12, 13]. In response to this situation, some researchers have carried out literature review studies to integrate the nephrotoxicity information of drugs, highlight the high-risk drugs causing AKI, and recommend management measures [6, 9, 14, 15, 16, 17, 18, 19]. However, although these studies have made an excellent critical review of the literature and simplified the process for medical professionals to achieve and apply information about drug nephrotoxicity, they cannot provide comprehensive quantitative and comparative risk data of these drugs, which partly limits the practicability of the research results in high-risk drug monitoring, primary suspected drug identification, and drug withdrawal selection. Thus, it is necessary to explore a method to quantify and compare the AKI risk of drugs comprehensively.
At present, the massive real-world adverse event (AE) data in the spontaneous reporting system bring opportunities for understanding the risk characteristics of drugs [20, 21]. In terms of kidney safety, the pharmacovigilance database has been widely used to understand the AKI risk of specific drugs [22, 23], investigate the most common AKI pathogenic drugs [24], compare the risk differences of AKI among drugs in the same category [25, 26, 27], and explore risk characteristics of drug-induced AKI in the special population [28]. To some extent, these studies confirmed the feasibility of using pharmacovigilance databases to explore the risk characteristics of drug-related AKI in the real world. However, although the aforementioned studies provide quantitative AKI risk information of some drugs to varying degrees, it is almost impossible to comprehensively integrate the quantitative risk of drug-induced AKI based on these results due to the differences in drugs investigated, research methods, time span, and population selection. In addition, the potential AKI risks of many drugs have also not been quantitatively evaluated in pharmacovigilance research, which also hinders the comprehensive understanding and integration of drug-related AKI risk characteristics.
In this context, our objective is to assess the AKI risk of all the reported nephrotoxic drugs in the FDA Adverse Event Reporting System (FAERS) in a unified standard, trying to present the whole picture of drug AKI risks from the perspective of pharmacovigilance, so as to provide more comprehensive renal safety information for clinical AKI management.
The FAERS database is a post-marketing safety surveillance program run by the FDA, which records all AE reports received by the FDA since 2004 and is updated quarterly. The AE data recorded in the FAERS database mainly includes patient demographic characteristics, patient outcomes, report sources (reporter and reporting country), drug information, drug indications, reporting time, and adverse reactions involved [29]. These data are highly structured, and the target information can be called and obtained through the application program interface provided by the openFDA platform (https://open.fda.gov/apis/drug/) [30].
By using the Medical Dictionary for Regulatory Activities (MedDRA), the FAERS database uniformly converts adverse reaction information into standardized medical terms called Preferred Term (PT). Standardized MedDRA query (SMQ) is an embedded tool provided by MedDRA that can help retrieve the AE reports of interest in the MedDRA-coded pharmacovigilance database. An SMQ usually provides two retrieval strategies: narrow-scope search and broad-scope search. Typically, PTs in the narrow-scope search can more accurately represent the condition or area of interest [31], so we use PTs included in the narrow-scope search of “acute renal failure (SMQ)” in MedDRA version 27.0 to retrieve target reports. The specific PT and corresponding MedDRA codes can be found in Supplementary Table 1.
In this study, we used the reporting odds ratio (ROR) method to detect the risk signal and quantify the risk of AKI induced by different drugs [32]. The ROR method is a classical disproportionality analysis method, and we can calculate its ROR value and corresponding 95% confidence interval (CI) based on the two-by-two contingency table (Table 1). The specific calculation equation is as follows:
| Drug of interest | Other drugs | Total | |
| AE of interest | a | b | a+b |
| Other AEs | c | d | c+d |
| Total | a+c | b+d | a+b+c+d |
Abbreviation: AE, adverse event.
When target reported quantity (a in Table 1) is greater than or equal to 3 and the lower limit of 95% CI of the ROR value is lower than 1, a positive risk signal is generated, which means that the drug being evaluated has potential risk of inducing AKI; On the contrary, if the target reported quantity or the lower limit of 95% CI of the ROR value does not meet the above criteria, it means a non-positive risk signal, suggesting that there is no statistical association between the drug being evaluated and the occurrence of AKI [33].
Based on the co-reported PT, we marked the histological injury type of reports as glomerular injury, tubular injury, tubulointerstitial injury, and (or) thrombotic injury. The co-reported PT, indicating four types of histological injury, is detailed in Table 2. On this basis, we made statistics on the distribution of the frequent types of renal injuries for main drugs and drug classes to understand their risk difference in histological injury type.
| Histological injury type | PT (MedDRA code) |
| Glomerular injury | glomerulonephritis acute (10018366); glomerulonephritis rapidly progressive (10018378); mesangioproliferative glomerulonephritis (10066453); fibrillary glomerulonephritis (10068279); glomerulonephritis (10018364); glomerulonephritis minimal lesion (10018374); glomerulonephritis membranoproliferative (10018370); glomerulonephritis membranous (10018372); immunotactoid glomerulonephritis (10067871) |
| Tubular injury | renal tubular acidosis (10038535); renal tubular atrophy (10038536); renal tubular disorder (10038537); renal tubular necrosis (10038540); renal tubular dysfunction (10050335) |
| Tubulointerstitial injury | tubulointerstitial nephritis and uveitis syndrome (10069034); tubulointerstitial nephritis (10048302) |
| Thrombotic injury | renal vein thrombosis (10038548); renal vascular thrombosis (10072226); renal-limited thrombotic microangiopathy (10085346); renal artery thrombosis (10038380) |
Abbreviation: PT, Preferred Term; MedDRA, Medical Dictionary for Regulatory Activities.
In addition, we used the data on medication time and AKI occurrence time in the
report for onset time analysis. Onset time is defined as the interval from the
beginning date of drug use to the AKI occurrence date. To ensure the accuracy of
the data, we removed records missing drug beginning date or AKI occurrence date,
incorrect records (AKI occurrence date before the drug beginning date), and
suspected records (drug withdrawal date to AKI occurrence date exceeding 30
days). In this study, medians (interquartile ranges) and Weibull’s shape
parameter
Referring to the definition of AE report data fields provided by openFDA (https://open.fda.gov/apis/drug/event/searchable-fields/), we can realize the data collection, processing, analysis, and summary of AE report data. Detailed steps are as follows.
First, we used PTs in Supplementary Table 1 to search the field “patient.reaction.reactionmeddrapt.exact” and set the retrieval time field “receivedate” as “[20040101+TO+20231231]” to determine AE reports related to AKI in the FAERS database from January 1, 2004, to December 31, 2023. Correspondingly, all the AE reports returned by the retrieval will be downloaded and used for subsequent analysis.
Second, we extracted and integrated the basic information of the downloaded AE reports, including annual report quantity, submitter, reporting country, patient sex, patient age, patient outcome, and the report quantity for each PT.
Third, we collected the generic name information of drugs in the field of
“patient.drug.openfda.generic_name” and the reported role of the drug in the
field of “patient.drug.drugcharacterization”. After removing non-primary
suspected drugs (“patient.drug.drugcharacterization” field
Fourth, the Anatomical Therapeutic Chemical (ATC) classification system (https://atcddd.fhi.no/atc_ddd_index/) was used to code the drug list manually, and we classified drugs into pharmacological or therapeutic subgroups (ATC 2nd level) according to the ATC code definition. On this basis, the most commonly reported single drugs and drug classes in AKI-related reports were counted.
Fifth, the risk signals of each drug involved in the list were detected at the SMQ level and the PT level, respectively. In addition, the distribution characteristics of risk signals were summarized on the basis of the detection results.
Finally, based on the co-reported PT and time data, the histological analysis and onset time analysis were conducted.
In this study, R version 4.1.0 (R Foundation for Statistical Computing, Vienna, Austria) and Microsoft Excel 2019 were used for statistical analysis.
During the period from January 1, 2004, to December 31, 2023, the FAERS database accumulated 17,391,308 AE reports. Using 19 PTs in Supplementary Table 1 to identify target drug nephrotoxicity reports, 327,561 AKI-related reports were finally retrieved for analysis. The number of AKI annual reports received by the FAERS database is shown in Fig. 1a, among which 2018 was the year with the largest reported quantity. In terms of submitters, 208,030 (63.51%) AKI reports were submitted by health professionals (physicians, pharmacists, and other health professionals), among which physicians accounted for the highest proportion (Fig. 1b). The top 10 countries with the largest reported quantity of drug-induced AKI are shown in Fig. 1c, and the United States is the most important source of reports, contributing 154,327 (47.11%) AKI-related reports. The gender distribution of patients is shown in Fig. 1d, and there are more male patients (45.88%) than female patients (40.40%) suffering from drug-induced AKI. Among the AKI-related reports included in the analysis, 226,952 (69.29%) detailed patient age, and the statistical age distribution showed that the occurrence of AKI showed an increasing trend with the age of patients (Fig. 1e). With regard to patient outcomes, more than 50% of drug-induced AKI cases can be classified into serious AE, and even 59,804 (18.26%) cases died (Fig. 1f). The number of reports related to each PT is shown in Fig. 1g, in which “acute kidney injury” is the most frequently reported PT, followed by “renal failure” and “renal impairment”.
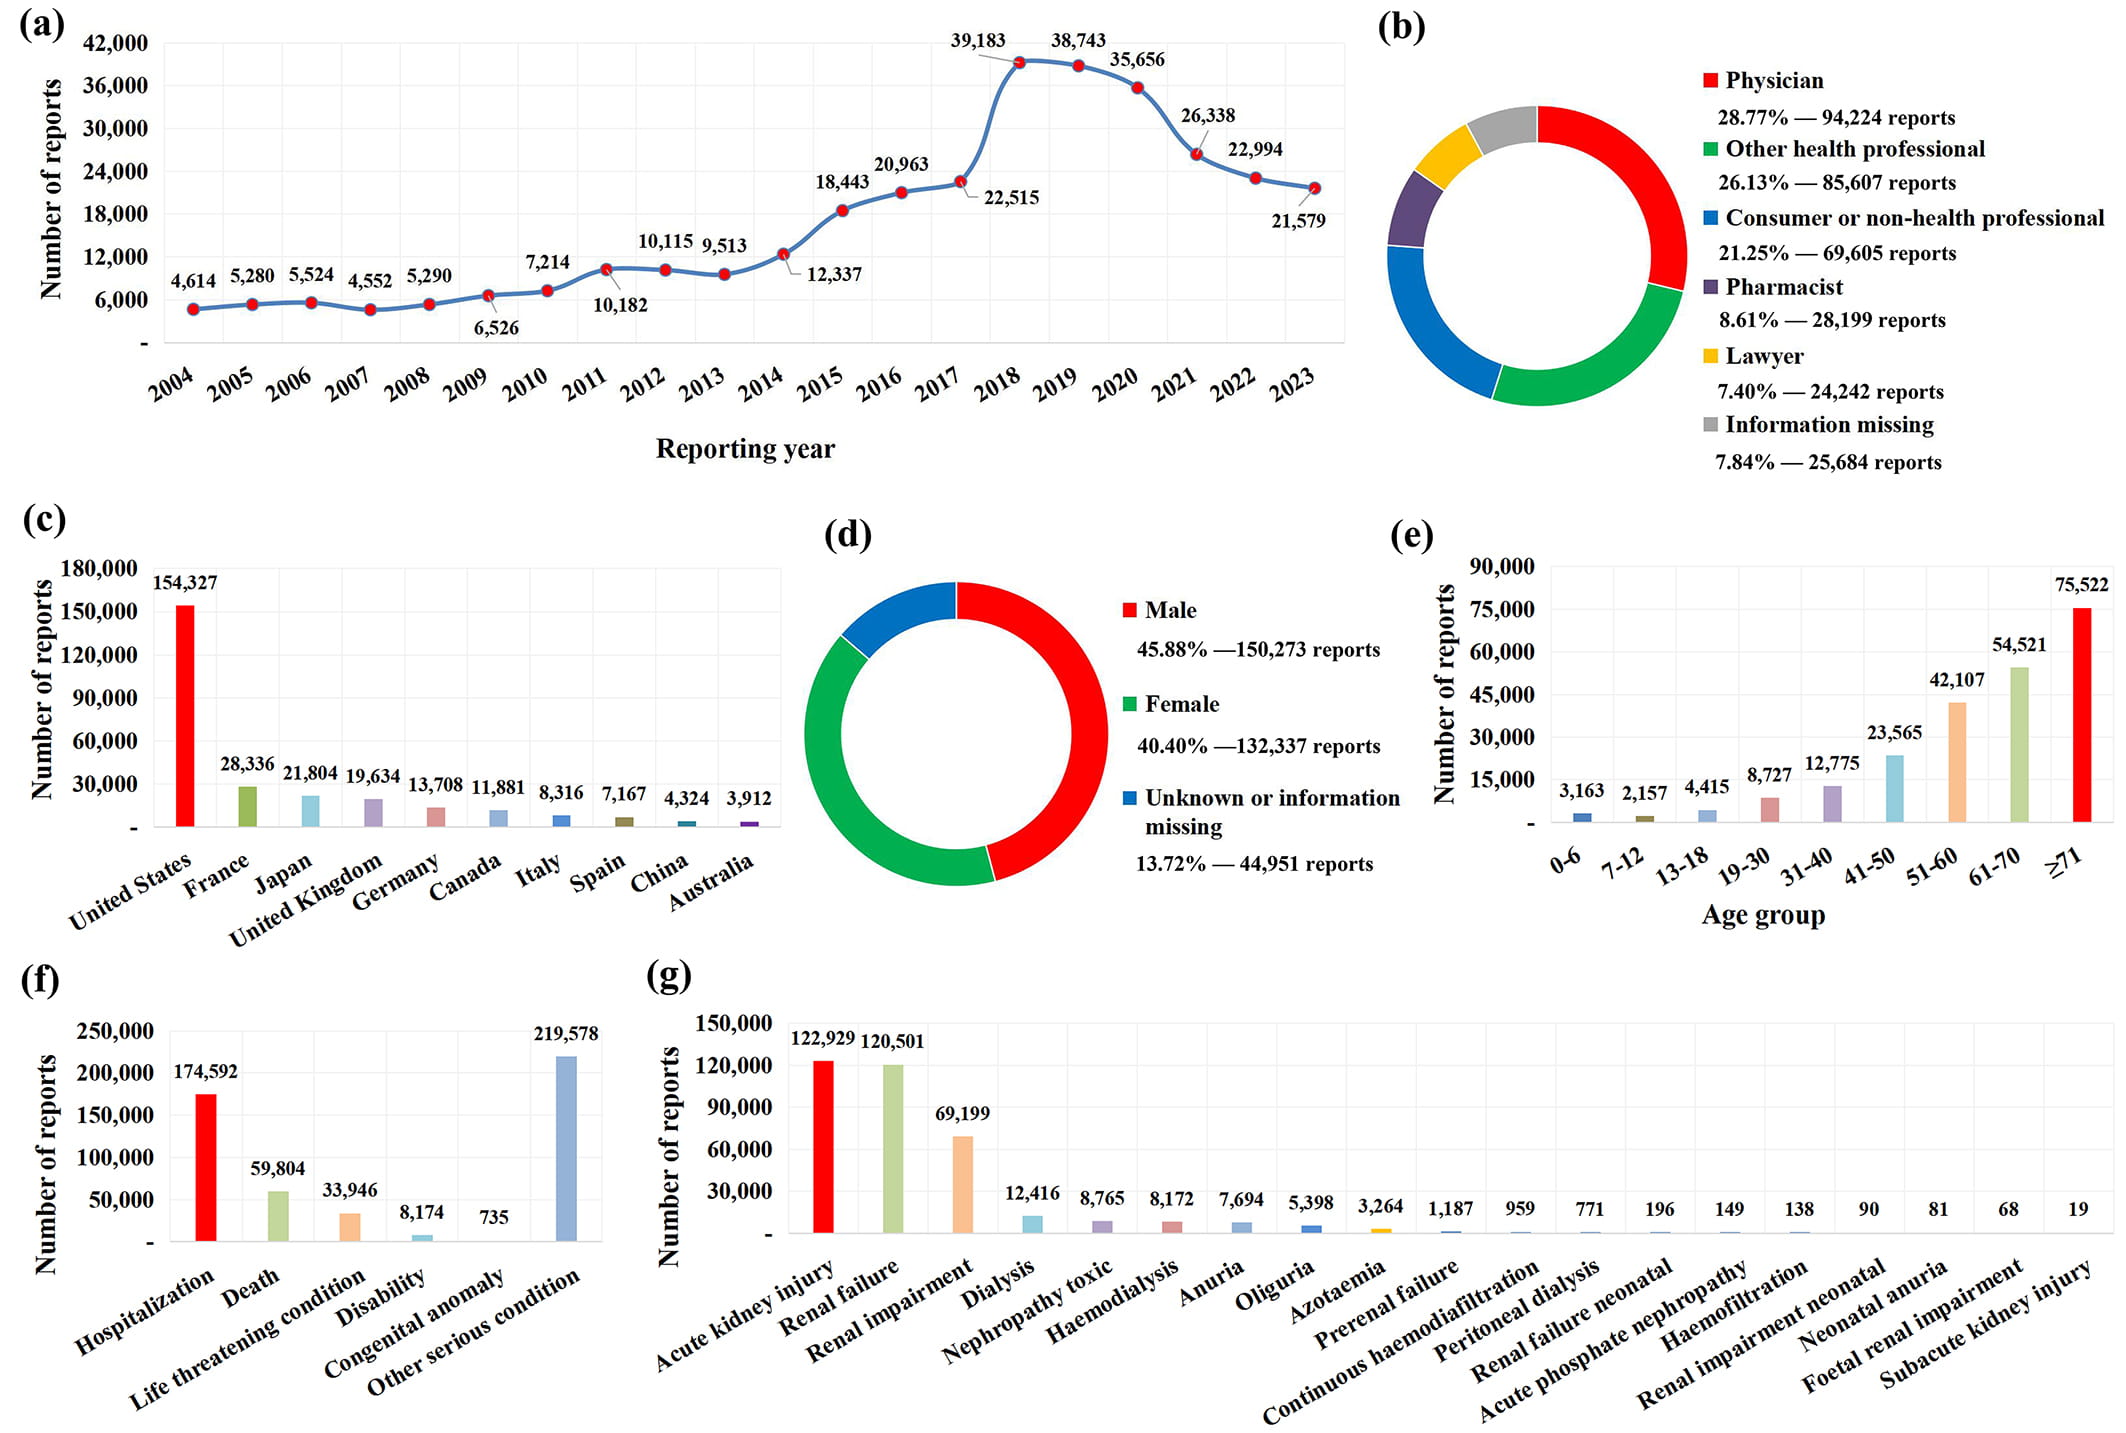 Fig. 1.
The basic information and patient characteristics of 327,561 AKI-related reports. (a) Distribution of annual report quantity. (b) The occupational distribution of the submitter. (c) The top 10 reporting countries. (d) The gender distribution of patients. (e) The age distribution of patients. (f) The out-come distribution of patients. (g) The number of adverse event reports associated with each PT.
To obtain a comprehensive list of potentially nephrotoxic drugs recorded in the FAERS database, we collected the generic name information of drugs recorded in the “patient.drug.openfda.generic_name” field of 327,561 AKI-related reports. Due to the existence of combined drugs and concomitant drugs, an AKI-related report usually records multiple drug information, so we finally extracted 2,478,666 pieces of drug generic name information. After excluding non-primary suspect drugs (n = 1,394,836), removing drugs missing generic name information (n = 200,724), and removing duplicate drug names (n = 881,032), we got a preliminary list containing 2074 drug names. Based on this preliminary list, we manually reviewed the generic names of drugs and coded them with the ATC classification system. After excluding ambiguous drug names (n = 263) and manually merging drugs with the same active ingredient (n = 355), we finally obtained a list containing 1456 potentially nephrotoxic drugs for subsequent analysis (Fig. 2a).
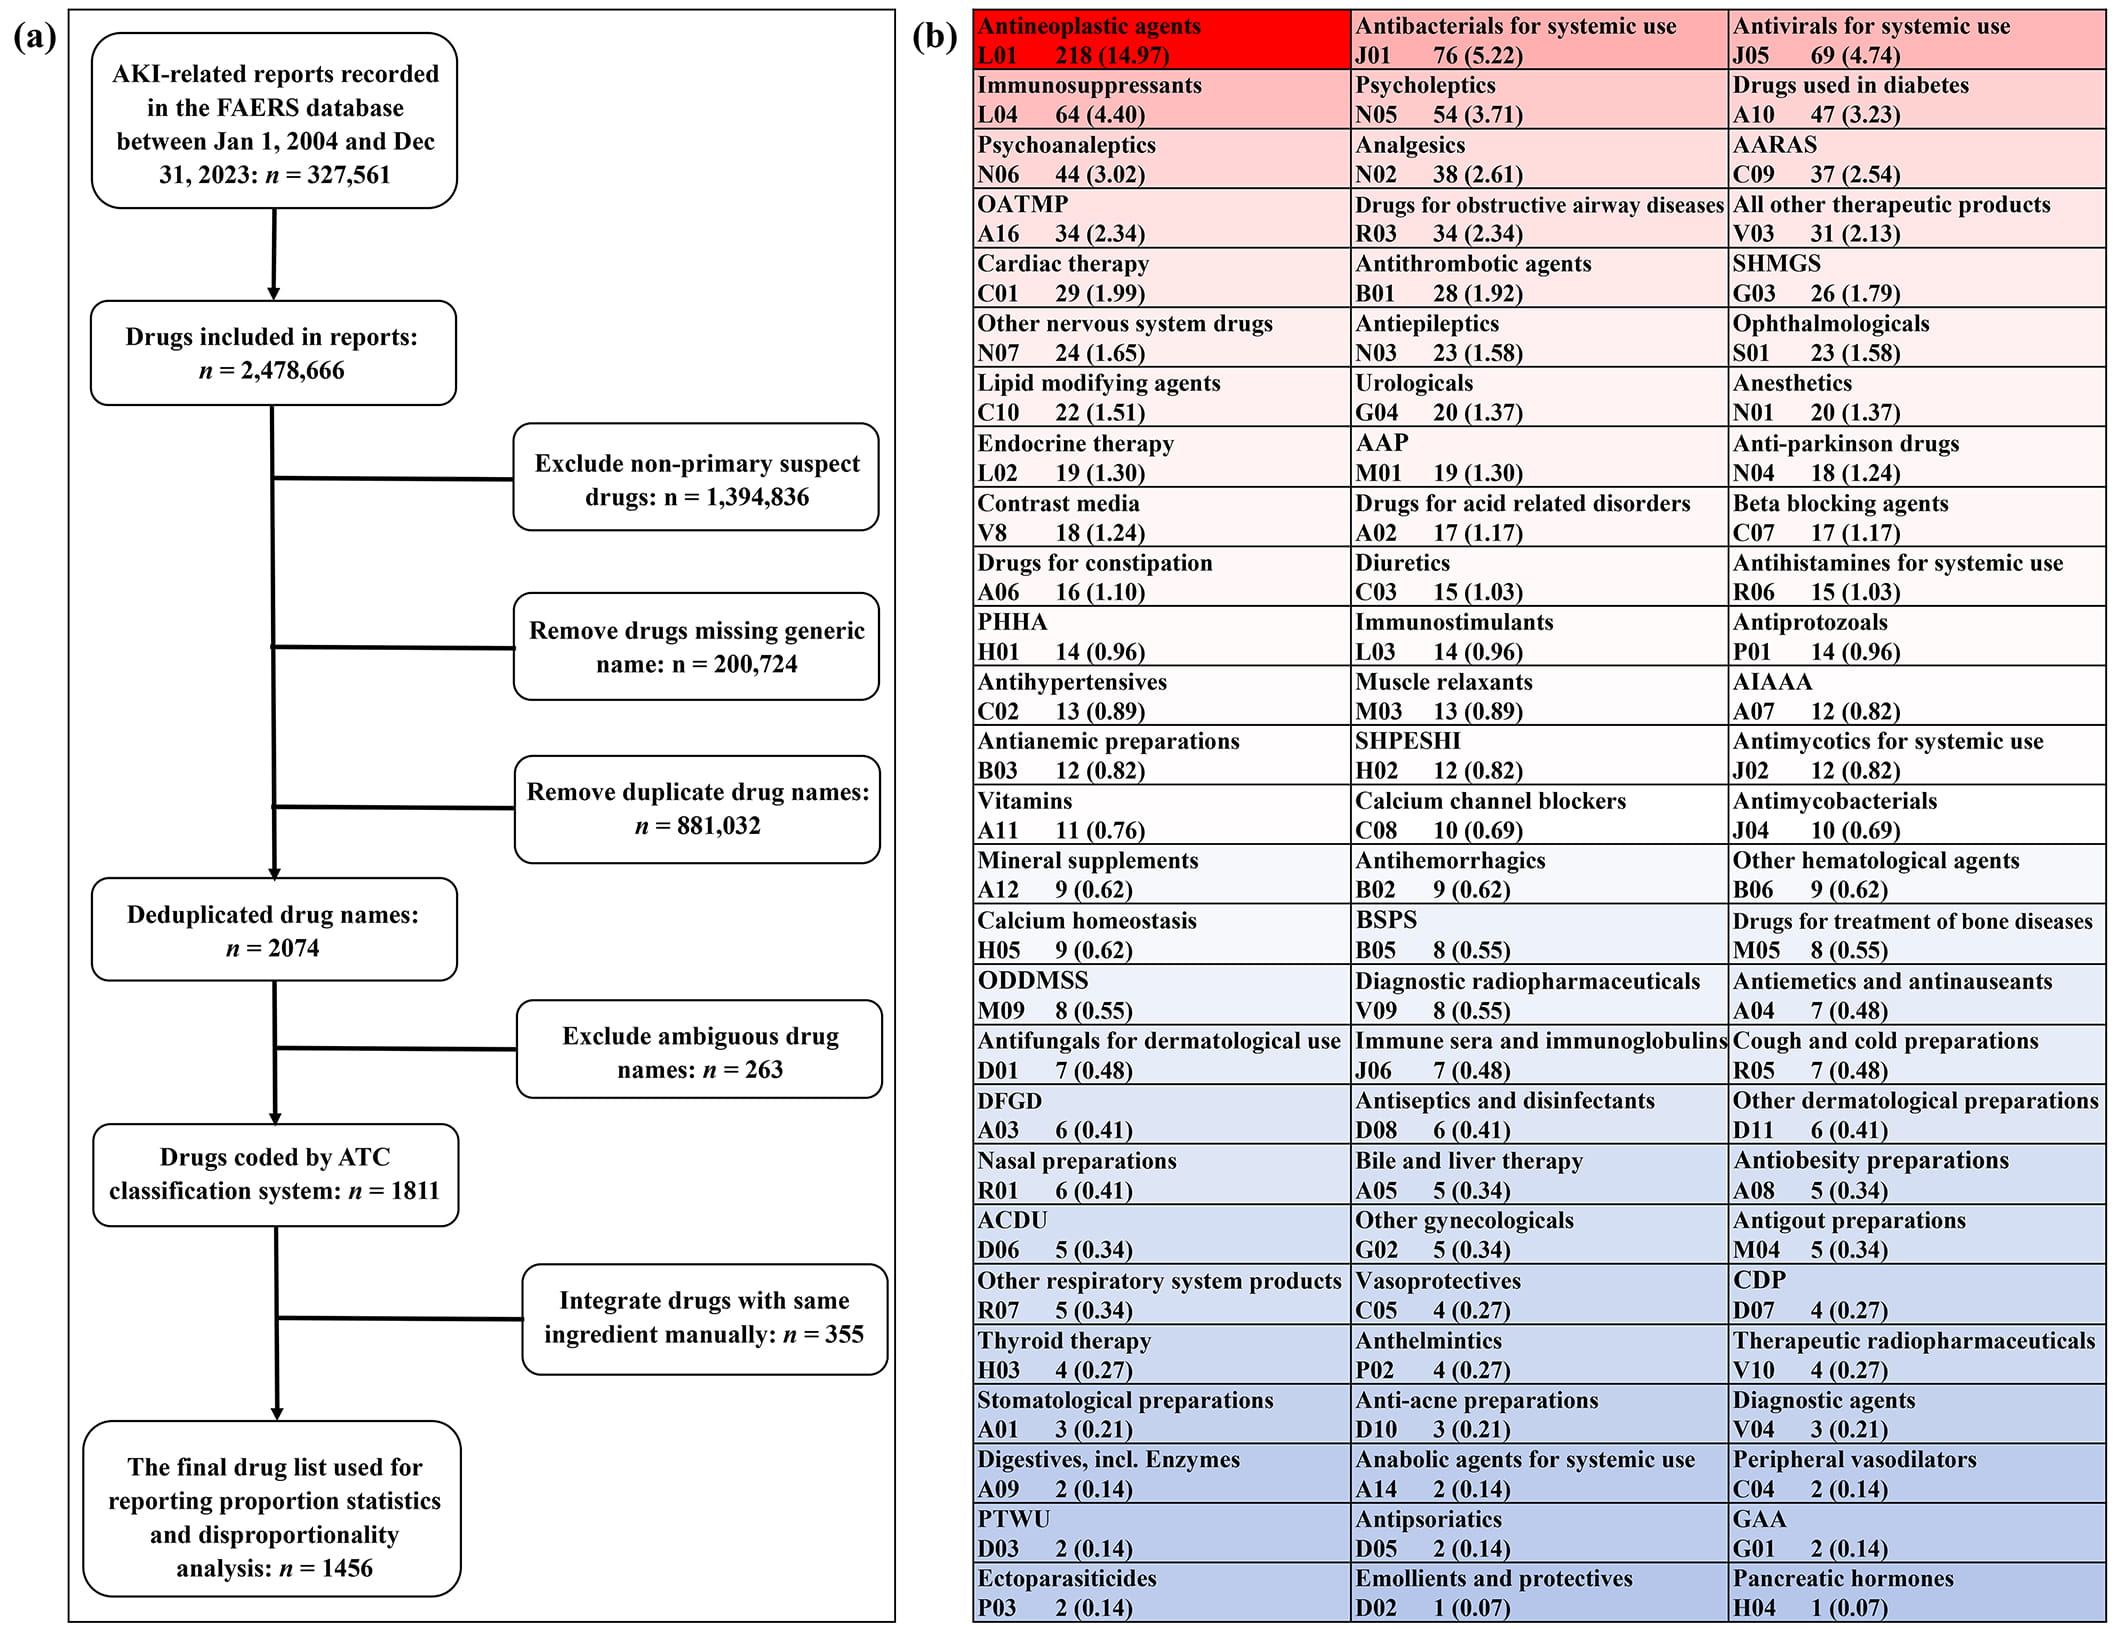 Fig. 2.
Identification and classification of reported potential nephrotoxic drugs. (a) Flowchart of reported nephrotoxic drugs identification. (b) Classification and summary of reported nephrotoxic drugs. Abbreviations: AAP, antiinflammatory and antirheumatic products; AARAS, agents acting on the renin-angiotensin system; ACDU, antibiotics and chemotherapeutics for dermatological use; AIAAA, Antidiarrheals, intestinal antiinflammatory and antiinfective agents; BSPS, blood substitutes and perfusion solutions; CDP, corticosteroidal dermatological preparations; DFGD, drugs for functional gastrointestinal disorders; GAA, gynecological antiinfectives and antiseptics; OATMP, other alimentary tract and metabolism products; ODDMSS, other drugs for disorders of the musculo-skeletal system; PHHA, pituitary and hypothalamic hormones and analogues; PTWU, preparations for treatment of wounds and ulcers; SHMGS, sex hormones and modulators of the genital system; SHPESHI, systemic hormonal preparations, excluding sex hormones and insulins.
Based on the ATC classification system, the 1456 potentially nephrotoxic drugs were further classified into 81 pharmacological or therapeutic subgroups (Fig. 2b). Of the 81 drug categories involved, the number of reported potential nephrotoxic drugs involved in different drug classes varies greatly, among which antineoplastic agents contain the largest number of reported nephrotoxic drugs (n = 218), while emollients and protectives (n = 1) and pancreatic hormones (n = 1) involve the fewest drugs. In addition, we further associated 1456 drugs with 19 PTs (Table 3), among which “renal failure” involved the largest number of reported nephrotoxic drugs (n = 1389), while “foetal renal impairment” involved the least drugs (n = 16).
| Group | No. (%) of reported nephrotoxic drugs |
| Acute renal failure (SMQ) 1 | 1456 (100.00) |
| Renal failure (PT) | 1389 (95.40) |
| Acute kidney injury (PT) | 1379 (94.71) |
| Renal impairment (PT) | 1330 (91.35) |
| Dialysis (PT) | 993 (68.20) |
| Oliguria (PT) | 924 (63.46) |
| Anuria (PT) | 920 (63.19) |
| Nephropathy toxic (PT) | 892 (61.26) |
| Haemodialysis (PT) | 873 (59.96) |
| Azotaemia (PT) | 821 (56.39) |
| Prerenal failure (PT) | 524 (35.99) |
| Continuous haemodiafiltration (PT) | 459 (31.52) |
| Peritoneal dialysis (PT) | 384 (26.37) |
| Acute phosphate nephropathy (PT) | 149 (10.23) |
| Haemofiltration (PT) | 136 (9.34) |
| Renal failure neonatal (PT) | 117 (8.04) |
| Neonatal anuria (PT) | 80 (5.49) |
| Renal impairment neonatal (PT) | 52 (3.57) |
| Subacute kidney injury (PT) | 34 (2.34) |
| Foetal renal impairment (PT) | 16 (1.10) |
1 This is an SMQ term that contains 19 PTs in this table. Abbreviations: SMQ, Standardized MedDRA Query.
Based on the number of AKI-related reports associated with each PT (Fig. 1g) and the corresponding potential nephrotoxic drugs involved (Table 3), we made statistics on the proportional distribution of reported nephrotoxic drugs in AKI-related cases. Fig. 3 shows 10 potential nephrotoxic drugs most frequently reported at the SMQ level and PT level. From the overall (at SMQ level) perspective, the top 10 most frequently reported potential nephrotoxic drugs are omeprazole (n = 36,601), furosemide (n = 32,529), pantoprazole (n = 30,802), esomeprazole (n = 30,272), lansoprazole (n = 27,633), metformin (n = 23,442), acetylsalicylic acid (n = 22,572), amlodipine (n = 21,192), lisinopril (n = 15,564), and metoprolol (n = 15,344) in turn. However, it is worth noting that the most frequently reported potential nephrotoxic drugs may vary greatly across SMQ and different PT levels.
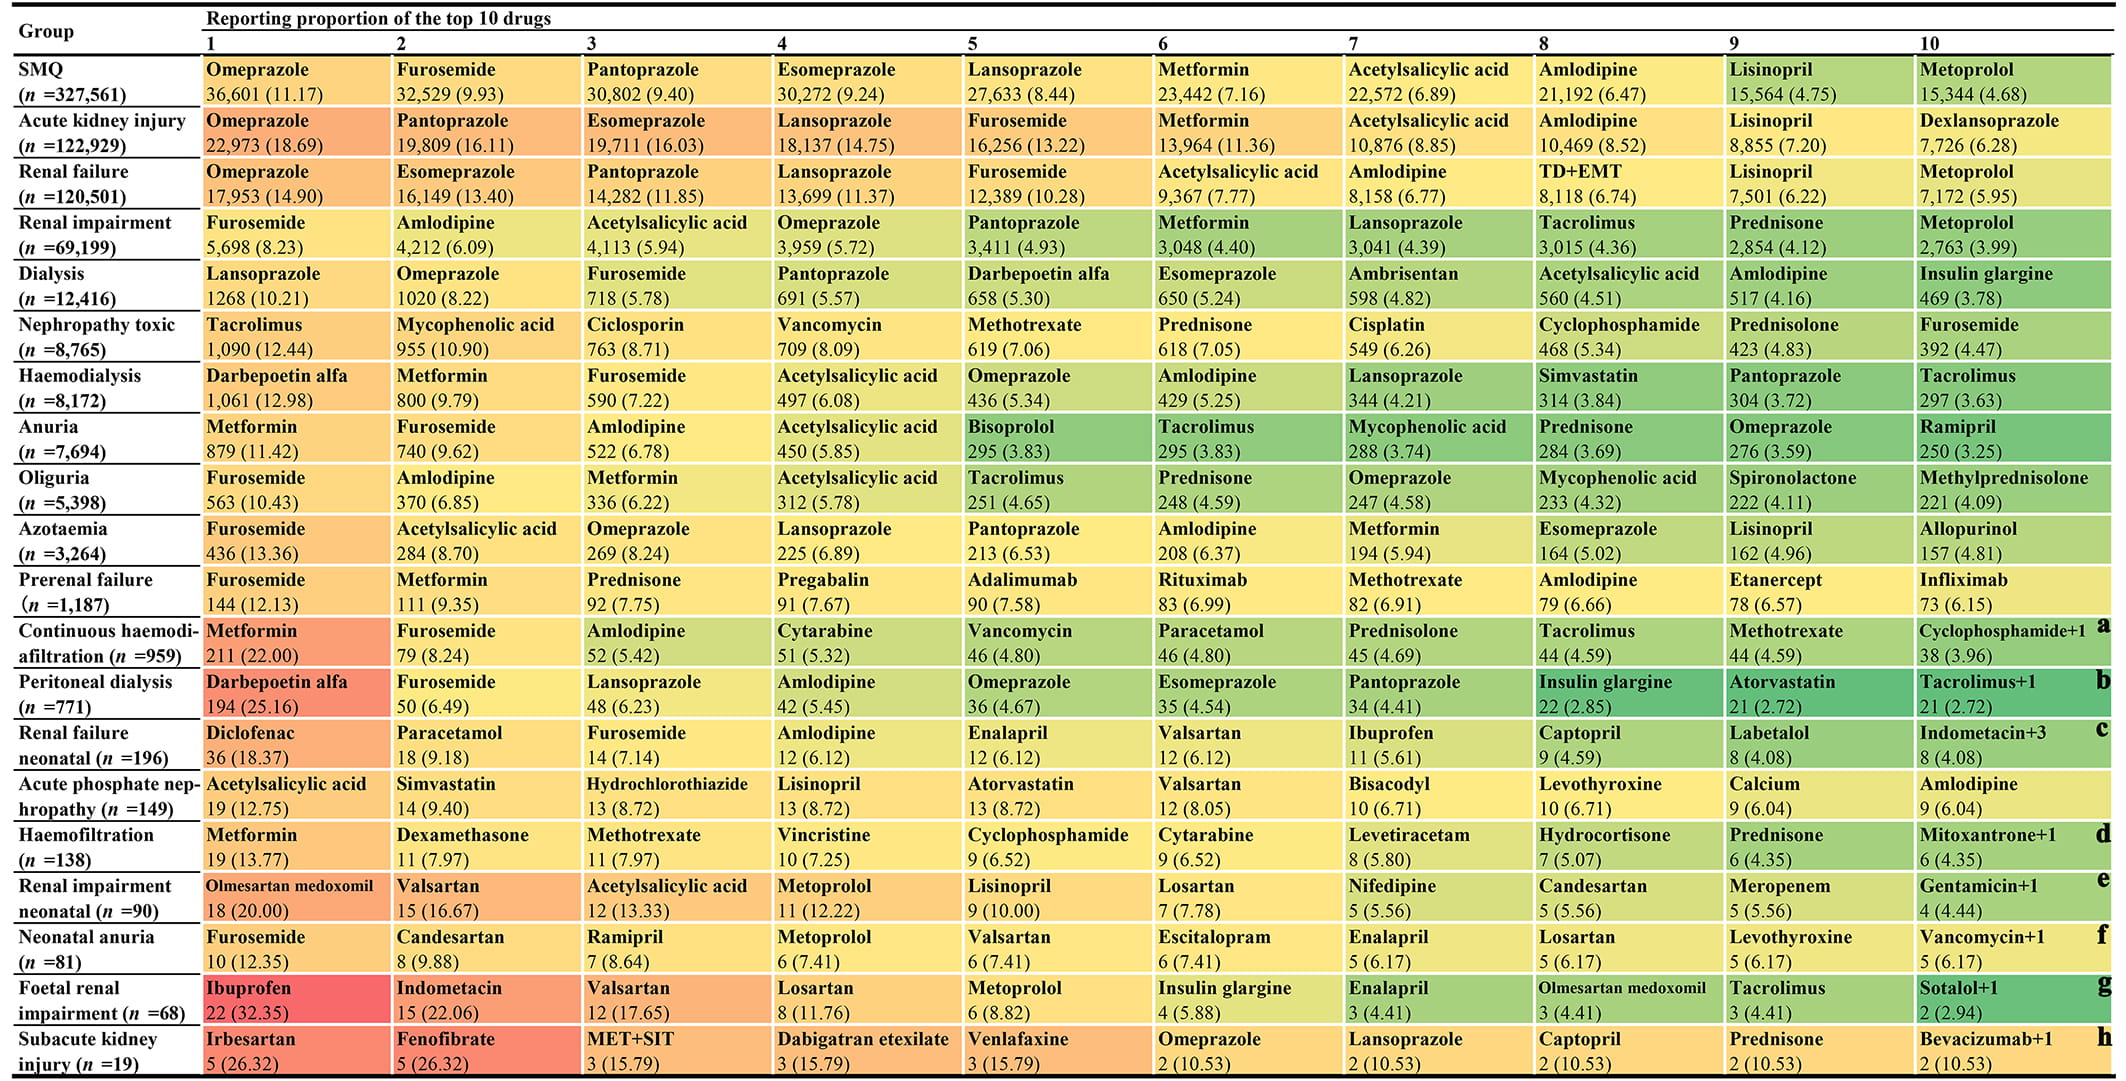 Fig. 3.
The top 10 most frequently reported single drugs at the SMQ level and PT level. Notes: (a) There is one other drug (acetylsalicylic acid) with the same reporting frequency as that of cyclophosphamide. (b) There is one other drug (cinacalcet) with the same reporting frequency as that of tacrolimus. (c) There are three other drugs (L-methyldopa, candesartan, and nifedipine) with the same reporting frequency as that of indomethacin. (d) There is one other drug (mycophenolic acid) with the same reporting frequency as that of mitoxantrone. (e) There is one other drug (ampicillin) with the same reporting frequency as that of gentamicin. (f) There is one other drug (naproxen) with the same reporting frequency as that of vancomycin. (g) There is one other drug (digoxin) with the same reporting frequency as that of sotalol. (h) There is one other drug (acetylsalicylic acid) with the same reporting frequency as that of bevacizumab. Abbreviations: PT, Preferred Term; TD+EMT, tenofovir disoproxil and emtricitabine; MET+SIT, metformin and sitagliptin; SMQ, Standardized MedDRA Query.
In addition, based on the ATC classification system, we further divided the drugs involved in each PT (Table 3) into 81 different pharmacological or therapeutic subgroups (Fig. 2b) and made statistics on the quantitative and proportional distribution of different drug classes in AKI-related reports. Fig. 4 shows 10 potential nephrotoxic drug classes most frequently reported at the SMQ level and PT level. From the overall (at SMQ level) perspective, the top 10 most frequently reported drug classes are drugs for acid related disorders (n = 67,540), agents acting on the renin-angiotensin system (n = 57,141), antineoplastic agents (n = 56,387), immunosuppressants (n = 53,508), analgesics (n = 49,752), diuretics (n = 48,973), drugs used in diabetes (n = 46,157), beta blocking agents (n = 41,825), antibacterials for systemic use (n = 40,288), and antithrombotic agents (n = 37,544) in turn. It is noteworthy that although most frequently reported drug classes also change across SMQ and different PT levels, the role of “drugs for acid related disorders” and “agents acting on the renin-angiotensin system” is particularly prominent.
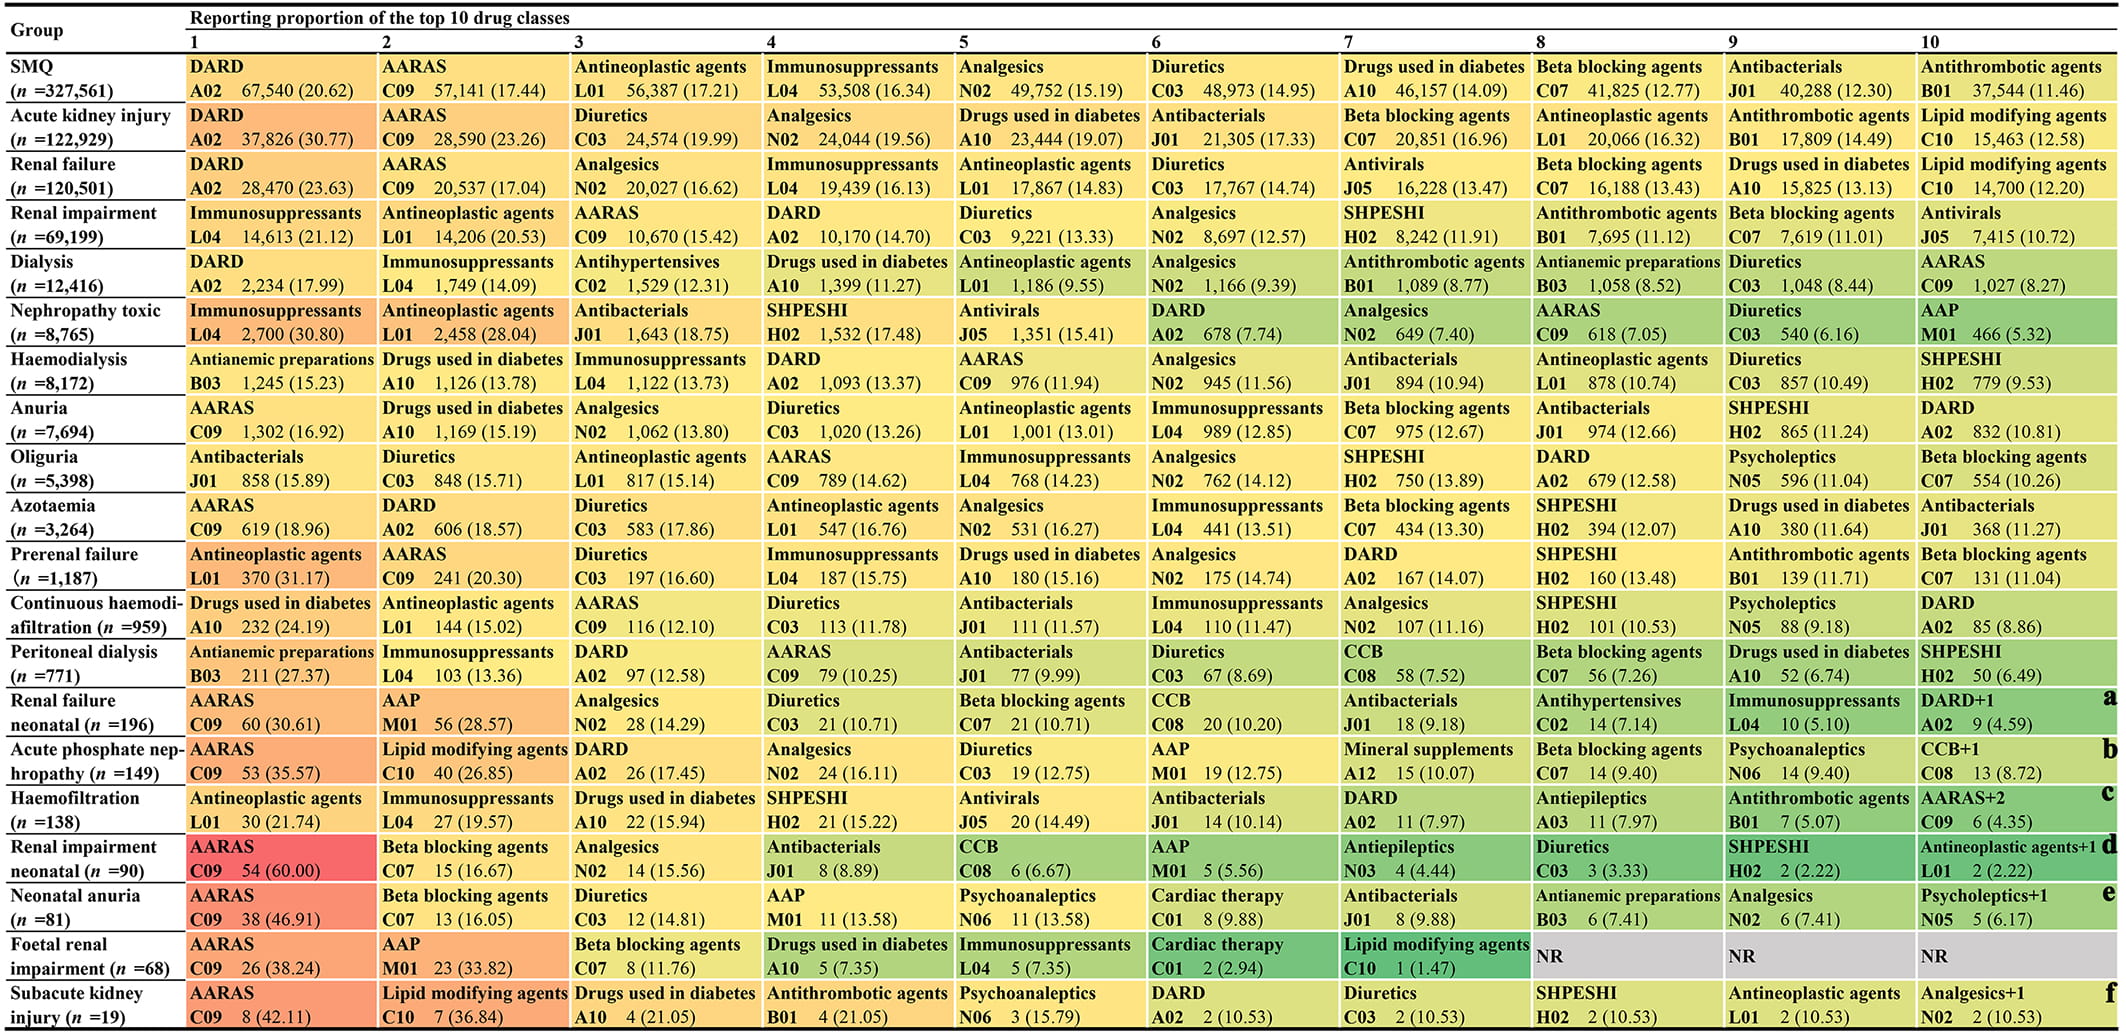 Fig. 4.
The top 10 most frequently reported drug classes at the SMQ level and PT level. Notes: (a) There is one other drug class, cardiac therapy (C01), with the same reporting frequency as that of drugs for acid related disorders (A02). (b) There is one other drug class, drugs for constipation (A06), with the same reporting frequency as that of calcium channel blockers (C08). (c) There are two other drug classes, beta blocking agents (C07) and analgesics (N02), with the same reporting frequency as that of drugs for agents acting on the renin-angiotensin system (C09). (d) There is one other drug class, antidiarrheals, intestinal antiinflammatory/antiinfective agents (A07), with the same reporting frequency as that of antineoplastic agents (L01). (e) There is one other drug class, thyroid therapy (H03), with the same reporting frequency as that of psycholeptics (N05). (f) There is one other drug class, immunosuppressants (L04), with the same reporting frequency as that of analgesics (N02). Abbreviations: CCB, calcium channel blockers; DARD, drugs for acid related disorders; NR, no report; SHPESHI, systemic hormonal preparations, excluding sex hormones and insulins.
To better identify high-risk AKI drugs and facilitate risk comparison, we used the ROR method to uniformly quantify the AKI risk of 1456 drugs at SMQ and PT levels. The risk signal detection results of 1456 reported nephrotoxic drugs are detailed in Supplementary Table 2. For each drug, there is one risk signal detection result at the SMQ level and 19 at the PT level.
On the basis of the risk signal detection results, we further summarized the risk signal distribution of 15 major drug classes at the SMQ level and PT level to better present the risk characteristics of reported nephrotoxic drugs (Fig. 5). Our results showed that at the SMQ level and most PT levels, the drug classes with the greatest number of positive risk signals were mainly antineoplastic agents, antibacterials for systemic use, and antivirals for systemic use. Meanwhile, we also noticed that the risk signal distribution was unbalanced in some drug classes. For example, most antibacterials for systemic use showed positive risk signals in the SMQ level and most PT levels, while most immunosuppressants showed non-positive risk signals.
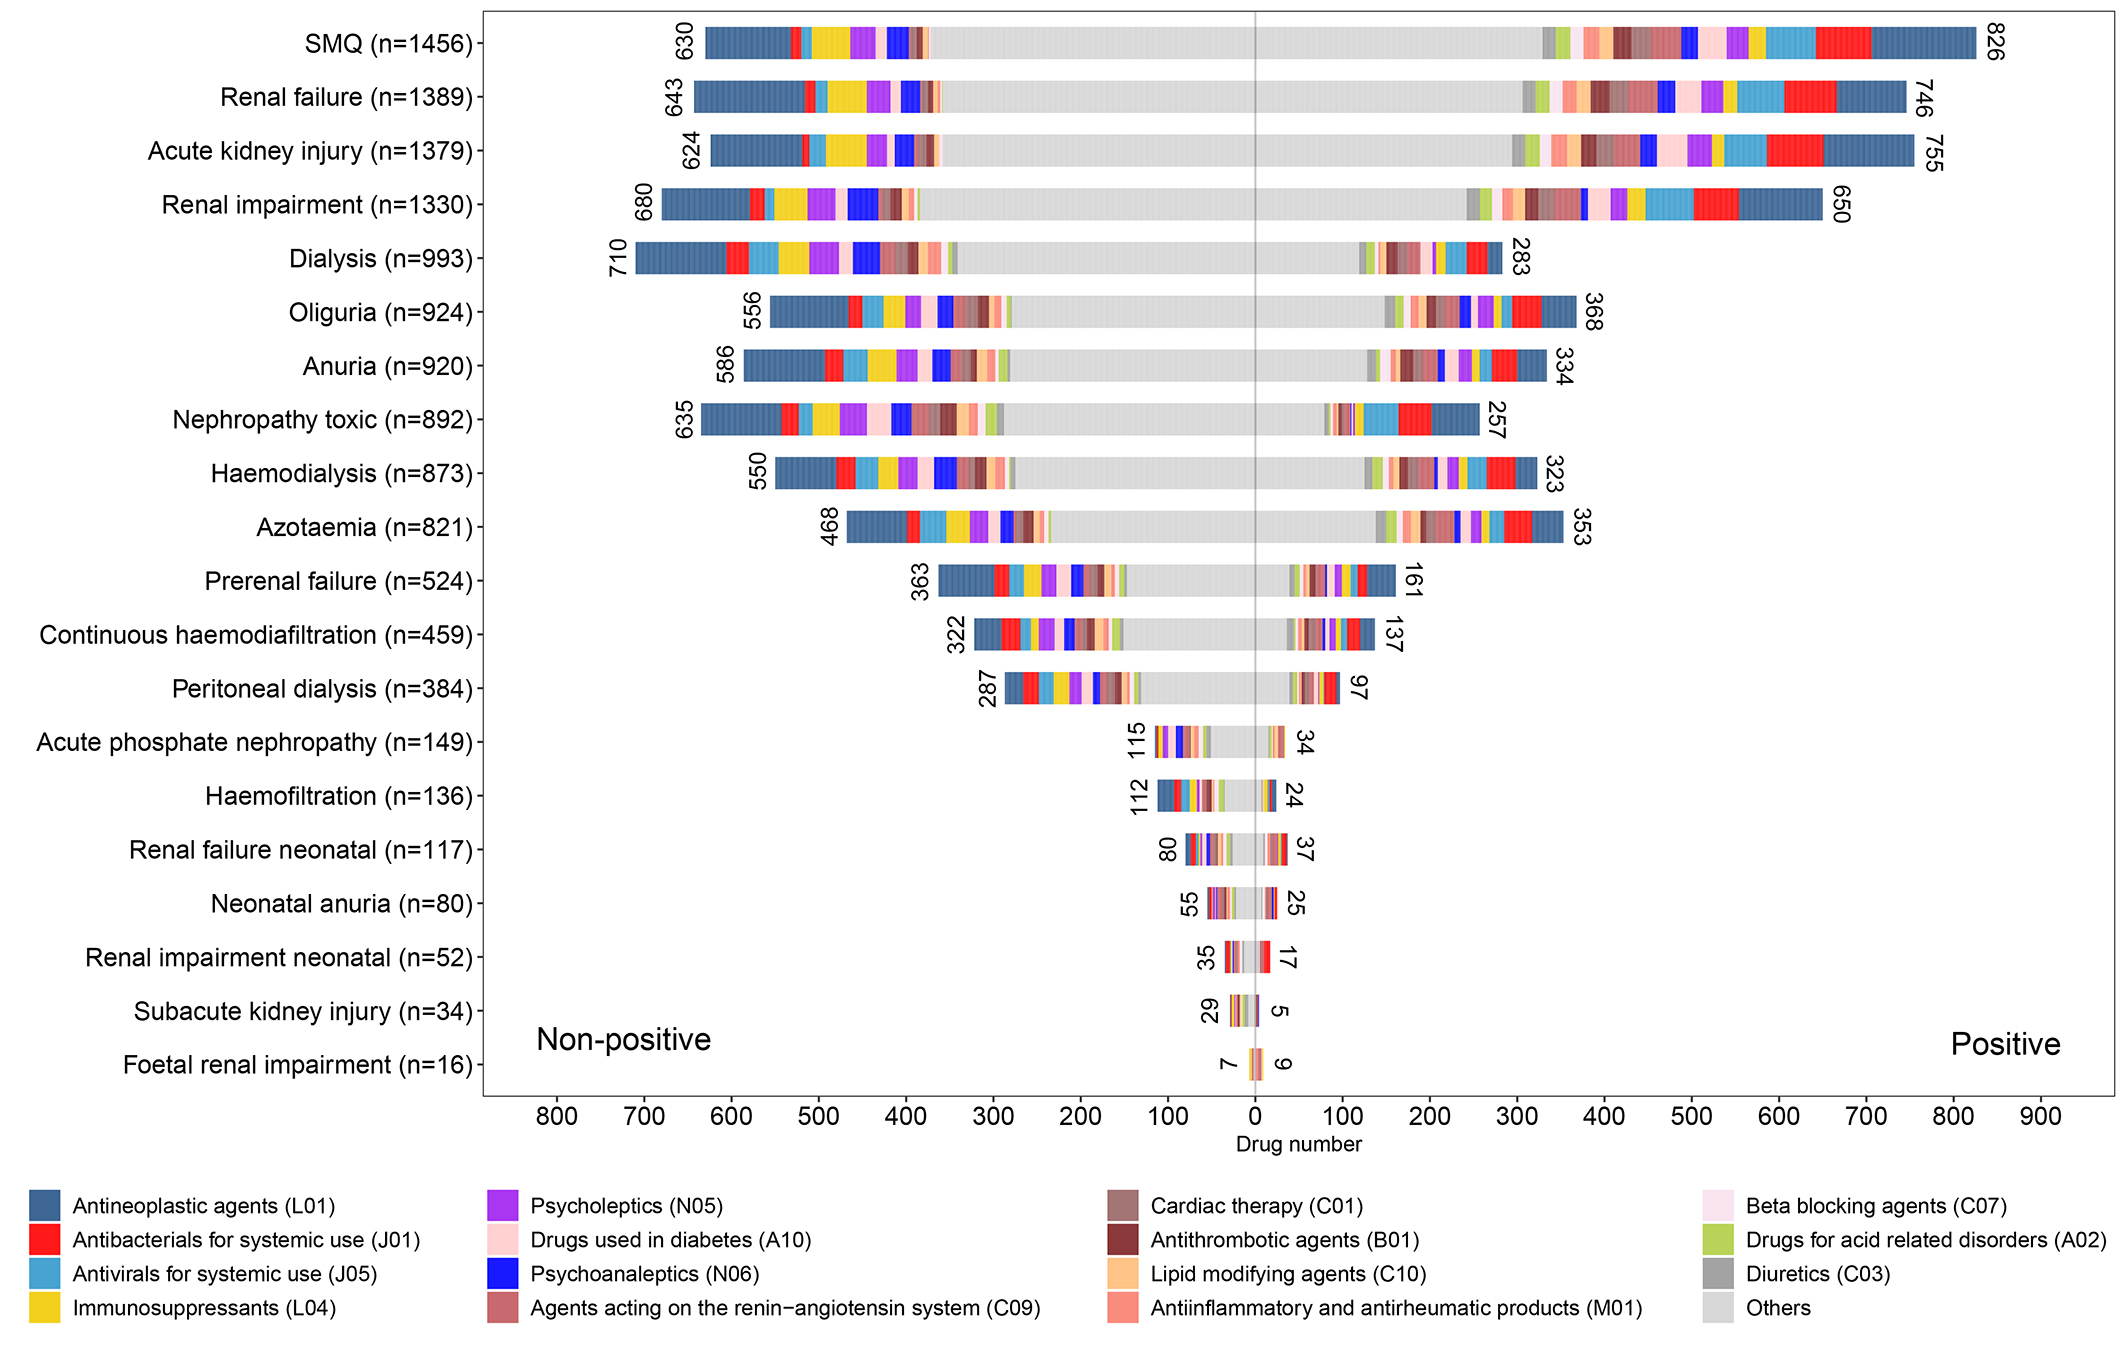 Fig. 5.
The risk signal distribution of 15 major drug classes at the SMQ level and PT level.
Furthermore, we counted the distribution of positive risk signals of 1456 reported nephrotoxic drugs. Our statistical results showed that the sum of positive risk signal counts of each reported nephrotoxic drug is between 0 and 15 (Table 4). Of the 1456 drugs evaluated, 1021 drugs have at least one positive risk signal, of which eight drugs (spironolactone, nifedipine, enalapril, valsartan, candesartan, gentamicin, vancomycin, and mycophenolic acid) have the largest number of positive risk signals. Correspondingly, there are 435 drugs did not detect any positive risk signals at the SMQ level and PT level, although they were reported as potential etiological drugs of AKI. The details of the sum of positive risk signal counts of each reported nephrotoxic drug are shown in Supplementary Table 2.
| No. of positive risk signals | No. (%) of reported nephrotoxic drugs |
| 15 | 8 (0.55) |
| 14 | 6 (0.41) |
| 13 | 14 (0.96) |
| 12 | 26 (1.79) |
| 11 | 38 (2.61) |
| 10 | 43 (2.95) |
| 9 | 62 (4.26) |
| 8 | 64 (4.40) |
| 7 | 70 (4.81) |
| 6 | 98 (6.73) |
| 5 | 93 (6.39) |
| 4 | 126 (8.65) |
| 3 | 132 (9.07) |
| 2 | 104 (7.14) |
| 1 | 137 (9.41) |
| 0 | 435 (29.88) |
| Total | 1456 (100.00) |
Based on the co-reported PT, we summarized the frequent types of renal injuries for the main drugs and drug classes (Table 5). According to the available data, tubulointerstitial injury is the most commonly reported histological injury type, followed by tubular injury, glomerular injury, and thrombotic injury. Notably, for certain drugs (acetylsalicylic acid) and drug classes (antineoplastic agents and immunosuppressants), renal tubular injury is the most frequently reported histological injury type.
| Medicine | Total cases* | Glomerular injury | Tubular injury | Tubulointerstitial injury | Thrombotic injury | |
| Single drug | ||||||
| Omeprazole | 4413 | 133 (3.01) | 702 (15.91) | 3776 (85.57) | 13 (0.29) | |
| Furosemide | 1465 | 84 (5.73) | 549 (37.47) | 908 (61.98) | 20 (1.37) | |
| Pantoprazole | 3600 | 122 (3.39) | 618 (17.17) | 3005 (83.47) | 20 (0.56) | |
| Esomeprazole | 3928 | 97 (2.47) | 621 (15.81) | 3373 (85.87) | 11 (0.28) | |
| Lansoprazole | 3848 | 142 (3.69) | 446 (11.59) | 3404 (88.46) | 9 (0.23) | |
| Metformin | 943 | 49 (5.20) | 447 (47.40) | 506 (53.66) | 16 (1.70) | |
| Acetylsalicylic acid | 1204 | 46 (3.82) | 842 (69.93) | 751 (62.38) | 11 (0.91) | |
| Amlodipine | 1300 | 114 (8.77) | 482 (37.08) | 798 (61.38) | 15 (1.15) | |
| Lisinopril | 1223 | 62 (5.07) | 482 (39.41) | 768 (62.80) | 2 (0.16) | |
| Metoprolol | 914 | 53 (5.80) | 330 (36.11) | 591 (64.66) | 4 (0.44) | |
| Main drug classes | ||||||
| Drugs for acid related disorders | 6259 | 250 (3.99) | 1260 (20.13) | 5034 (80.43) | 32 (0.51) | |
| AARAS | 2664 | 168 (6.31) | 1038 (38.96) | 1625 (61.00) | 31 (1.16) | |
| Antineoplastic agents | 1788 | 236 (13.20) | 886 (49.55) | 784 (43.85) | 41 (2.29) | |
| Immunosuppressants | 1813 | 338 (18.64) | 968 (53.39) | 625 (34.47) | 45 (2.48) | |
| Analgesics | 2665 | 110 (4.13) | 1073 (40.26) | 1632 (61.24) | 26 (0.98) | |
| Diuretics | 2167 | 127 (5.86) | 833 (38.44) | 1341 (61.88) | 27 (1.25) | |
| Drugs used in diabetes | 1735 | 73 (4.21) | 788 (45.42) | 966 (55.68) | 20 (1.15) | |
| Beta blocking agents | 1962 | 123 (6.27) | 734 (37.41) | 1216 (61.98) | 26 (1.33) | |
| Antibacterials for systemic use | 3384 | 124 (3.66) | 1453 (42.94) | 2066 (61.05) | 11 (0.33) | |
| Antithrombotic agents | 1138 | 63 (5.54) | 475 (41.74) | 646 (56.77) | 36 (3.16) | |
Abbreviations: AARAS, agents acting on the renin-angiotensin system.
* A case may record multiple histological injury types at the same time, so the total number of cases often exceeds the sum of the cases of the four histological injury types.
Based on the available time data, we described the onset time distribution characteristics for the top 50 most frequently reported single drugs (Table 6). The median onset time of different drugs varies greatly, among which the median time of vancomycin (5.00 days, 95% CI 2.00–11.00) is the shortest, and the median time of lansoprazole (1427.00 days, 95% CI 222.75–2924.50) is the longest. In Weibull’s parameter analysis, all 50 drugs showed early failure type.
| SN | Drugs | Cases | Median (IQR)/days | Weibull distribution parameter | ||
| Failure type | ||||||
| 1 | Omeprazole | 4784 | 841.50 (146.00–2313.25) | 1311.54 (1242.98–1380.11) | 0.61 (0.59–0.62) | Early failure |
| 2 | Furosemide | 3705 | 29.00 (4.00–294.00) | 117.23 (107.81–126.65) | 0.41 (0.40–0.42) | Early failure |
| 3 | Pantoprazole | 2722 | 266.00 (11.00–1360.50) | 445.45 (405.07–485.84) | 0.44 (0.43–0.46) | Early failure |
| 4 | Esomeprazole | 5036 | 990.00 (294.00–2137.25) | 1230.22 (1182.96–1277.48) | 0.75 (0.73–0.77) | Early failure |
| 5 | Lansoprazole | 1790 | 1427.00 (222.75–2924.50) | 1753.63 (1612.42–1894.85) | 0.65 (0.63–0.68) | Early failure |
| 6 | Metformin | 1595 | 355.00 (18.00–1593.50) | 533.04 (473.03–593.05) | 0.46 (0.44–0.48) | Early failure |
| 7 | Acetylsalicylic acid | 1064 | 235.00 (19.00–1070.75) | 464.41 (402.35–526.47) | 0.48 (0.46–0.51) | Early failure |
| 8 | Amlodipine | 1309 | 174.00 (28.00–837.00) | 371.86 (330.00–413.72) | 0.51 (0.49–0.54) | Early failure |
| 9 | Lisinopril | 1096 | 543.00 (70.00–1577.75) | 708.50 (633.26–783.74) | 0.58 (0.55–0.61) | Early failure |
| 10 | Metoprolol | 927 | 298.00 (26.00–1233.00) | 525.05 (448.40–601.71) | 0.47 (0.45–0.50) | Early failure |
| 11 | Prednisone | 976 | 41.00 (8.00–324.50) | 144.94 (123.93–165.96) | 0.45 (0.43–0.47) | Early failure |
| 12 | Paracetamol | 978 | 14.00 (1.00–104.00) | 55.30 (45.67–64.94) | 0.38 (0.36–0.40) | Early failure |
| 13 | Simvastatin | 692 | 745.00 (134.00–1946.00) | 975.00 (861.07–1088.93) | 0.67 (0.62–0.71) | Early failure |
| 14 | Levothyroxine sodium | 639 | 401.00 (96.00–1300.00) | 718.23 (614.69–821.77) | 0.59 (0.55–0.63) | Early failure |
| 15 | Allopurinol | 1050 | 31.00 (9.00–464.00) | 171.59 (146.26–196.92) | 0.42 (0.40–0.44) | Early failure |
| 16 | Dexlansoprazole | 397 | 625.00 (194.00–1234.00) | 974.31 (831.05–1117.58) | 0.77 (0.71–0.83) | Early failure |
| 17 | Gabapentin | 805 | 224.00 (13.00–922.00) | 348.87 (294.66–403.09) | 0.48 (0.45–0.50) | Early failure |
| 18 | Tacrolimus | 1268 | 31.00 (5.00–213.00) | 107.76 (92.87–122.66) | 0.41 (0.39–0.43) | Early failure |
| 19 | Spironolactone | 1190 | 50.00 (14.00–344.00) | 160.43 (141.48–179.38) | 0.50 (0.48–0.53) | Early failure |
| 20 | Ibuprofen | 1201 | 10.00 (3.00–160.00) | 80.70 (67.32–94.07) | 0.36 (0.35–0.38) | Early failure |
| 21 | Tenofovir disoproxil and emtricitabine | 2299 | 1078.00 (365.00–2191.00) | 1553.80 (1474.41–1633.19) | 0.91 (0.88–0.94) | Early failure |
| 22 | Clopidogrel | 585 | 172.00 (16.00–1040.00) | 366.82 (301.97–431.66) | 0.49 (0.46–0.52) | Early failure |
| 23 | Mycophenolic acid | 731 | 43.00 (7.00–286.00) | 124.85 (104.13–145.56) | 0.46 (0.43–0.48) | Early failure |
| 24 | Methotrexate | 1213 | 31.00 (2.00–596.00) | 138.84 (117.32–160.37) | 0.37 (0.36–0.39) | Early failure |
| 25 | Bisoprolol | 798 | 87.00 (15.00–423.75) | 215.86 (181.93–249.78) | 0.47 (0.44–0.49) | Early failure |
| 26 | Dexamethasone | 2341 | 14.00 (5.00–65.00) | 49.26 (44.85–53.67) | 0.48 (0.47–0.50) | Early failure |
| 27 | Ergocalciferol | 336 | 290.00 (67.75–987.50) | 542.14 (439.91–644.37) | 0.62 (0.57–0.67) | Early failure |
| 28 | Rosuvastatin | 598 | 160.00 (22.50–1002.50) | 401.55 (332.40–470.69) | 0.49 (0.46–0.53) | Early failure |
| 29 | Carvedilol | 532 | 294.00 (39.00–1279.50) | 568.19 (474.67–661.71) | 0.56 (0.52–0.60) | Early failure |
| 30 | Insulin glargine | 474 | 175.00 (11.00–820.00) | 316.83 (250.38–383.29) | 0.46 (0.42–0.49) | Early failure |
| 31 | Losartan | 572 | 311.50 (59.75–1105.50) | 625.89 (531.17–720.62) | 0.59 (0.55–0.63) | Early failure |
| 32 | Ramipril | 695 | 110.00 (16.00–791.50) | 313.45 (260.92–365.99) | 0.47 (0.44–0.50) | Early failure |
| 33 | Lenalidomide | 2404 | 35.00 (10.00–185.50) | 105.63 (97.30–113.96) | 0.54 (0.52–0.55) | Early failure |
| 34 | Tenofovir disoproxil | 614 | 1251.50 (369.00–2882.00) | 1895.44 (1687.83–2103.05) | 0.84 (0.78–0.90) | Early failure |
| 35 | Atorvastatin | 465 | 266.00 (26.00–1461.00) | 533.35 (430.59–636.11) | 0.51 (0.47–0.54) | Early failure |
| 36 | Vancomycin | 1107 | 5.00 (2.00–11.00) | 9.70 (8.66–10.73) | 0.59 (0.56–0.61) | Early failure |
| 37 | Hydrochlorothiazide | 536 | 268.50 (24.50–1380.25) | 509.34 (416.40–602.27) | 0.50 (0.46–0.53) | Early failure |
| 38 | Famotidine | 374 | 19.00 (3.00–376.00) | 113.10 (82.55–143.65) | 0.39 (0.36–0.42) | Early failure |
| 39 | Rivaroxaban | 2147 | 74.00 (13.00–310.00) | 147.34 (135.49–159.18) | 0.56 (0.54–0.58) | Early failure |
| 40 | Prednisolone | 597 | 28.00 (7.00–177.00) | 91.80 (75.15–108.44) | 0.46 (0.43–0.49) | Early failure |
| 41 | Ciprofloxacin | 689 | 17.00 (5.00–512.00) | 120.38 (96.26–144.51) | 0.38 (0.36–0.40) | Early failure |
| 42 | Salbutamol | 433 | 406.00 (81.00–1275.00) | 650.23 (537.32–763.15) | 0.57 (0.53–0.61) | Early failure |
| 43 | Apixaban | 886 | 39.00 (8.00–230.75) | 109.54 (94.70–124.38) | 0.51 (0.48–0.54) | Early failure |
| 44 | Methylprednisolone | 855 | 6.00 (2.00–25.00) | 28.43 (23.13–33.73) | 0.38 (0.37–0.40) | Early failure |
| 45 | Oxycodone | 640 | 37.00 (6.00–304.00) | 125.15 (102.63–147.68) | 0.45 (0.42–0.47) | Early failure |
| 46 | Pregabalin | 539 | 53.00 (4.00–343.00) | 135.48 (108.22–162.73) | 0.44 (0.41–0.47) | Early failure |
| 47 | Valsartan | 481 | 211.00 (16.00–571.00) | 315.54 (254.64–376.44) | 0.50 (0.46–0.53) | Early failure |
| 48 | Alprazolam | 444 | 95.50 (2.00–1094.25) | 241.98 (178.19–305.78) | 0.37 (0.34–0.40) | Early failure |
| 49 | Adalimumab | 604 | 438.50 (102.00–1155.25) | 698.68 (605.13–792.22) | 0.66 (0.62–0.70) | Early failure |
| 50 | Amoxicillin | 1030 | 11.50 (4.00–485.75) | 111.31 (91.88–130.74) | 0.37 (0.36–0.39) | Early failure |
Abbreviations: CI, confidence interval; IQR, interquartile range.
Drug-induced AKI is an important clinical problem widely concerned by health workers. In the clinical management of drug-induced AKI, timely identification and withdrawal of potential nephrotoxic drugs play a cornerstone role [11]. However, due to the lack of unified quantitative indicators to judge the risk of AKI caused by different drugs, the determination and withdrawal of pathogenic drugs are still highly dependent on the personal experience of medical staff. Aiming at this problem, we reviewed 327,561 AE reports related to AKI in the FAERS database over the past 20 years to investigate the association between the occurrence of AKI and drug use. To our knowledge, such a large sample is unprecedented, which provides a solid foundation for our comprehensive investigation of the nephrotoxicity risk of drugs.
In this study, we present the etiological drug characteristics of AKI from multiple dimensions. First, we summarized a list of 1456 reported nephrotoxic drugs, involving 81 drug classes (Fig. 2). Among the 1456 reported nephrotoxic drugs, our results showed that the largest number of drugs belong to antineoplastic agents (Fig. 2b). Although it is well-known that the kidney is one of the main target organs affected by the toxic effects of antineoplastic agents, either traditional chemotherapeutics or novel molecularly targeted agents [35], antineoplastic agents did not show an obvious dominant position among reported nephrotoxic drugs in previous pharmacoepidemiologic studies [9, 13, 14, 15, 24, 36]. There are two possible explanations for the high proportion of antineoplastic agents in the drug list. One possible explanation is that there is a large base of antineoplastic agents used in the real world, which may increase the proportion of antineoplastic agents in the integrated drug list. Another possible explanation is that antineoplastic agents do play an important role in the occurrence of AKI in the clinical setting, whereas our study opportunistically caught a glimpse of it. However, for whatever reason, with the development and application of new antineoplastic drugs and therapies, the problem of antineoplastic agent-induced AKI has become increasingly prominent and has attracted wide attention [37, 38, 39]. Therefore, it is necessary for medical staff to have a deeper understanding of the AKI risk related to antineoplastic agents and provide timely prevention and treatment.
To further understand the causative drugs of AKI, based on the integrated drug list obtained from the FAERS database, we made statistics on the most frequently reported nephrotoxic single drugs and drug classes at the SMQ level and PT level, respectively (Figs. 3,4). As a whole, “antineoplastic agents” is the drug class with the third largest number of AKI reports at the SMQ level (Fig. 4), which further demonstrates that the use of antineoplastic agents is an important trigger of AKI. In addition, it is noteworthy that although only 17 (1.17%) of the 1456 reported nephrotoxic drugs were classified as “drugs for acid related disorders” (Fig. 2b), it is still the drug class with the largest number of AKI reports among the 81 kinds of drug classes. Meanwhile, in the statistics of single drugs at the SMQ level, four drugs (omeprazole, pantoprazole, esomeprazole, and lansoprazole) are among the top 10 most frequently reported nephrotoxic drugs (Fig. 3). The existing literature also suggested that “drugs for acid related disorders” and the drugs they contain are closely related to AKI [40, 41, 42]. Therefore, the above evidence suggests that we should pay more attention to the use of “drugs for acid related disorders” in future clinical practice, to identify and intervene in possible renal damage in the process of drug use in time. Similarly, the AKI risks of some other listed high-reporting drug classes (e.g., diuretics [43], antibacterials [44], and agents acting on the renin-angiotensin system [45]) and drugs (e.g., furosemide [46], vancomycin [47], and enalapril [48]) have also been confirmed in previous literature. Therefore, to some extent, the results mentioned above reflect the most commonly reported nephrotoxic drugs in the real world and can provide some reference information for managing nephrotoxic drugs. However, we also noticed that some drugs that are considered to have low nephrotoxicity (e.g., metformin, amlodipine, and metoprolol) also have high reporting frequency. There are two possible explanations for this abnormal report accumulation. One possible explanation is that it reflects the unknown renal injury model. For example, a recent animal study showed that metformin, even at low doses, exacerbated experimentally induced AKI and increased mortality in mice [49], but this effect has not been confirmed in the population. Another possible explanation is that diabetes and cardiovascular disease are two of the four main types of chronic diseases [50], but as mainstream therapeutic drugs, metformin, amlodipine, and metoprolol inevitably have a huge consumption base and corresponding high AKI report accumulation, even though they have a low risk of kidney injury.
Therefore, it should be kept in mind that although the high reporting frequency of drugs in the FAERS database partly reflects the possible nephrotoxicity of some drugs, the high reporting frequency is not absolutely equivalent to the high AKI risk, because the difference in drug use base in the real world will greatly affect this figure. However, the inherent limitations of the spontaneous reporting database make it impossible for us to calculate the actual incidence of AKI of various drugs with existing data to evaluate and compare the AKI risks of various drugs. In this context, we introduced the disproportionality analysis to evaluate the risk of AKI caused by different drugs and used the risk signal detection result as an alternative quantitative index of incidence to represent the AKI risk of drugs [20]. Although previous studies have also tried to quantify the AKI risk of drugs by applying the disproportionality analysis, the drugs they evaluated were usually limited to a specific class, such as immune checkpoint inhibitors [39], antibiotics [51], and sodium-glucose-cotransporter-2 inhibitors [52]. Meanwhile, due to the differences in research methods and research time span, the above research results cannot be integrated to perform an AKI risk comparison across drug classes. By contrast, our study expanded the evaluated drugs to 1456 drugs reported in the FAERS database in the recent 20 years (Supplementary Table 2), which provides resources for comparing AKI risks among drugs in a wide range under a unified standard, thus providing better support for timely identification and withdrawal of drugs causing AKI. For example, if a patient suspected drug-induced AKI is using cefazolin and diclofenac at the same time, cefazolin (ROR, 5.36; 95% CI, 5.00–5.74) is more likely to be the culprit drug than diclofenac (ROR, 2.03; 95% CI, 1.97–2.09) according to the signal detection results (Supplementary Table 2). In this regard, we can stop cefazolin or adjust cefazolin to other alternative medications accordingly in clinical practice. Similarly, if we find that there are drugs with high AKI risk signal strength in the prescription, we can especially strengthen the monitoring of patients’ renal function, so as to identify emerging kidney injury in time.
In addition, based on the risk signal detection results at the SMQ level and PT levels, we further summarized the AKI risk characteristics of 1156 drugs. On the one hand, we made statistics on the sum of positive risk signal counts of each drug and found that 1021 drugs have at least one positive risk signal at the SMQ level or PT levels (Table 4), revealing the statistical relationship between these drugs and AKI. To some extent, the sum of positive risk signal counts of drugs can be used as a simplified indicator reflecting the correlation strength between drugs and AKI [31]. For example, vancomycin with 15 positive risk signals theoretically has a higher AKI risk than cefixime with three positive risk signals (Supplementary Table 2), suggesting that the nephrotoxicity of vancomycin should be focused on in clinical use. Accordingly, we can locate some key drugs, and paying attention to these drugs is beneficial to the prevention, diagnosis, and treatment of drug-induced AKI. However, for some drugs with a large number of positive risk signals, the interpretation of AKI risk still needs to be cautious. For example, although there are case reports suggesting that nifedipine can induce acute interstitial nephritis [53], larger studies have shown the beneficial effect of nifedipine (calcium channel blocker) on renal outcomes and can be used as a selectable first-line therapy in non-proteinuric chronic kidney disease [54, 55]. Therefore, for drugs that are potentially beneficial to renal outcomes or treat kidney-related diseases, positive risk signals should perhaps be understood as a statistical relationship between drugs and diseases rather than a causal relationship. On the other hand, we integrated the risk signal distribution characteristics of the main drug classes at the SMQ level and PT levels (Fig. 5). Our results showed that “antineoplastic agents” was the drug class with the largest number of positive signal drugs at the SMQ level and most PT levels, which once again highlights its triggering effect on AKI and reminds us to pay enough attention to it. Besides, our result also reveals the differences in the proportion of risk signal distribution between some drug classes. Theoretically, a drug class with a higher proportion of positive risk signals has a higher overall AKI risk than a drug class with a lower proportion [31]. In this regard, our results provide a new perspective to understand the AKI risk difference among drug classes.
Besides summarizing the reporting frequency and risk signals of drugs, we also explored the histological injury type distribution of the main drugs and drug classes (Table 5). In previous studies, although it is known that the same drug may cause multiple histological types of renal injury [56], the distribution of drugs for histological injury type is not clear. Our study showed that tubulointerstitial injury is the most commonly reported histological injury type for most drugs and drug classes. In drug-induced tubulointerstitial injury, the drugs for acid related disorders (omeprazole, pantoprazole, esomeprazole, and lansoprazole) were obviously dominant. In a previous study, Gérard AO and colleagues [57] used the World Health Organization Safety Database (VigiBase) to identify drugs responsible for tubulointerstitial nephritis and also highlighted the central role of proton pump inhibitors (PPIs), which also supported our results. Therefore, for patients with a rapid decline in renal function during drug (particularly PPIs) use, tubulointerstitial injury may be the primary suspicion after excluding other non-drug causes. However, it should also be noted that some other drugs may have different histological injury characteristics. For example, it is reported that both tubulointerstitial injury and tubular injury can be induced by non-steroidal anti-inflammatory drugs [56], but our results showed that tubular injury induced by acetylsalicylic acid is more frequently reported than tubulointerstitial injury. In this regard, it is necessary to understand the histological characteristics of renal injury caused by different drugs further because they are of great significance in treatment selection.
Additionally, we further evaluated the time relationship between the occurrence
of AKI and the start of medication. In previous studies, the average time of
vancomycin-induced AKI was 24.9 days from the start of therapy [58]. Our results
showed that the median time of vancomycin-induced AKI is 5 days, which is
significantly shorter than the above-mentioned time interval. However, it has
also been reported that the higher trough values of vancomycin are associated
with shorter time intervals and increased histopathological damage [47, 59]. For
the patients with initial vancomycin trough values exceeding 20 mg/L, the median
time to AKI of vancomycin is about 6 days [60], which is basically consistent
with our research results. Therefore, one possible explanation for the
discrepancy is that the reporting preference (more likely to do spontaneous
reports about severe reactions) makes the cases with high initial vancomycin
trough values concentrated [61], and leads to a significantly shorter time
interval. In our study, lansoprazole has the longest median time interval of AKI
(1724 days), and we noticed that other PPIs also have similar long-time
intervals. In previous studies, although the association between PPIs and AKI
occurrence has been widely confirmed, the time relationship has not been
elaborated in detail. In fact, due to unrecognized tubulointerstitial injury,
long-term PPI use was usually associated with an increased risk of chronic kidney
disease and kidney failure [56], which may partly explain the long-term interval
of PPIs. However, it is noteworthy that although the median time interval of
different drugs varies greatly, they are all classified as early failure types in
Weibull’s shape parameter
Although this study presents the etiological drug characteristics of AKI from multiple dimensions, it also has to emphasize its limitations. First, although multiple PTs were used in this study to enhance the identification of drug-induced AKI cases, a non-standard diagnostic approach may still bring bias, and it is also difficult to ensure that the inherent AKI in a specific clinical scenario (e.g., the COVID-19 pandemic) will not be wrongly attributed to drugs [62]. Second, as an AE reporting system with a voluntary nature, the problems of underreporting, duplicate reporting, Weber effect, and notoriety bias inevitably exist in the FAERS database, which may damage the accuracy of our AKI risk signal detection results [33]. Third, many factors (e.g., patient age, sex, and accompanying disease) can affect the occurrence of AKI [63], but we can’t shield the influence of these factors on the AKI risk signal detection results. Fourth, our study mainly focused on the AKI risk of a single drug, but an AKI report usually records multiple drugs. The drug-drug interaction may indeed influence the quantification of AKI risk of drugs, but it is not deeply explored in this study. Fifth, the Weibull distribution analysis was used to explore the changes of AKI risk caused by different drugs with time in this study, but this method is usually used to identify lifetime distribution in reliability engineering and may bring unexpected methodological bias, so it is necessary to supplement the verification of external validity in future research. Finally, due to the lack of a model linking drug report accumulation with drug prescription/drug use frequency data, we cannot precisely compare AKI risks of different drugs by calculating the incidence. Although the results of risk signal detection are used as a substitute index of incidence to quantitatively evaluate the AKI risk of different drugs, its essence is the statistical association between drugs and AKI occurrence rather than causality. In some cases, such an association is indirect or even misleading, so it is necessary to apply additional evaluation tools (e.g., Bradford-Hill criteria) to verify the causal relationship between drug use and AKI [64].
The FAERS database has a large population, wide geographic coverage, and publicly available accessibility, which have qualified it as an important resource for investigating the potential adverse reaction risk of drugs. In this study, we provided a comprehensive review of the culprit drugs of AKI in the FAERS database, summarized a list of 1456 reported nephrotoxic drugs in the past 20 years, and made statistics on the top 10 frequently reported nephrotoxic drugs and drug classes. In addition, we applied disproportionality analysis to evaluate the AKI analysis of 1456 drugs uniformly, integrated the distribution characteristics of AKI risk signals of drugs on this basis, and found that 1021 drugs were associated with the occurrence of AKI to different degrees. Meanwhile, based on co-reported PT and available time data, we further explored the histological injury characteristics and onset time characteristics of reported culprit drugs. Although our study has unavoidable limitations due to the inherent nature of spontaneous reporting databases, it also provides a real-world perspective for understanding the AKI risk of drugs and can provide reference information for the identification and withdrawal of causative drugs in the clinic.
The original contributions presented in the study are included in the article/Supplementary Material; further inquiries can be directed to the corresponding authors.
Conceptualization, DL and QD; methodology, JZ and RZ; software, JZ and DL; data curation, JZ, RZ, YW, FW, TZ and DL; formal analysis, JZ, RZ, YW, FW, TZ and DL; writing—original draft preparation, JZ and RZ; writing—review and editing, RZ, JZ, YW, FW, TZ, DL, QD; visualization, DL; funding acquisition, DL and QD. All authors read and approved the final manuscript. All authors have participated sufficiently in the work and agreed to be accountable for all aspects of the work.
Not Applicable.
The authors thank openFDA (https://open.fda.gov/) for providing their platforms and contributors for uploading their meaningful datasets.
This research was funded by the Research Incubation Project of the Third Affiliated Hospital of Chongqing Medical University (KY24038), Senior Medical Talents Program of Chongqing for Young and Middle-aged, and Key Specialty Construction Project of Clinical Pharmacy in Chongqing.
The authors declare no conflict of interest.
Supplementary material associated with this article can be found, in the online version, at https://doi.org/10.31083/IJP44094.
References
Publisher’s Note: IMR Press stays neutral with regard to jurisdictional claims in published maps and institutional affiliations.