


1 College of Pharmacy, Changchun University of Chinese Medicine, 130117 Changchun, Jilin, China
Abstract
Allergic asthma, a chronic respiratory illness, presents a significant healthcare burden. Honey-processed Chelidonium majus L. (HC), a traditional herbal formula, has shown promise as an anti-asthmatic treatment. However, the underlying mechanisms for these properties remain elusive. Thus, this study aimed to investigate the therapeutic potential and mechanisms of HC in a rat model of ovalbumin (OVA)-induced asthma.
Sprague-Dawley rats were randomly assigned to Control, Model (asthma), Dexamethasone (positive control), low-, medium-, and high-dose HC groups (n = 8). Lung histopathology, serum inflammatory marker (interleukin (IL)-10, IL-13 ,and IL-1β), serum metabolomics, and transcriptomic analyses were employed to assess the effects of HC on airway inflammation, mucus hypersecretion, and related metabolic and gene expression profiles.
HC treatment alleviated histological lung injury in asthmatic rats, downregulated the levels of proinflammatory cytokines (IL-13 and IL-1β), while upregulating the anti-inflammatory cytokine IL-10. Metabolomic analysis revealed 46 metabolic biomarkers while the transcriptome analysis identified 754 differentially expressed genes (DEGs) between the Model and Control groups. Moreover, 35 metabolites were reversed and 273 DEGs were identified following high-dose HC treatment. Integration analysis manifested that 7 DEGs and 11 metabolites were associated with several enriched metabolic pathways, including amino acid metabolism, fatty acid metabolism, glycometabolism, organic acid metabolism, and nucleotide metabolism.
HC treatment ameliorates OVA-induced asthma in rats by regulating the expression of specific genes to restore metabolic homeostasis and suppress inflammation. This study provides valuable insights into the therapeutic potential and mechanisms of HC for asthma treatment.
Keywords
- Chelidonium majus
- honey-processed
- ovalbumin-induced allergic asthma
- metabolomics
- transcriptomics
- inflammatory respiratory disorder
Asthma is a chronic inflammatory respiratory disorder that is influenced by a combination of hereditary and environmental variables [1]. It is usually induced by various allergens and characterized by chronic airway inflammation, airway hyperresponsiveness (AHR) and airway remodeling [2, 3]. Asthma is caused mainly by an imbalanced ratio of T helper type 1 (Th1) to Th2 cells, contributing to the T cells differentiating into Th2 cells. The Th2 lymphocytes can produce Th2 cytokines, which recruit multiple inflammatory cells and lead to airway inflammation [4, 5, 6].
Chronic airway inflammation is the key to the pathogenesis of asthma and is also
the basis of airway remodeling and AHR [7]. Interleukin (IL)-13, a Th2 cytokine,
plays a critical role in eosinophilic inflammation, airway remodeling and AHR
[8]. As a pro-inflammatory cytokine, the cytokine IL-1
Scientific statistics have shown that over 300 million people worldwide suffer
from asthma [14]. While corticosteroids,
A perennial herb in the Papaveraceae family, Chelidonium majus L. (greater celandine), boasts a long history in treating various ailments, such as asthma, bronchitis and inflammatory disorders [19]. Pharmacological interest stems from its diverse bioactive profile, encompassing alkaloids (e.g., sanguinarine, chelidonine and chelerythrine), flavonoids and phenolic acids [20, 21, 22]. These constituents contribute to its anti-inflammatory, antioxidant, immunomodulatory, antitumor and antispasmodic properties [21, 23, 24, 25, 26, 27, 28, 29, 30, 31]. A study using an asthma-induced mouse model have shown that C. majus extracts can inhibit eosinophil proliferation and activation, suggesting their therapeutic potential [32]. Furthermore, chelidonine, the main alkaloid in C. majus, effectively reduced eosinophilic airway inflammation by suppressing the production of key inflammatory mediators like IL-4 and eotaxin-2 in an allergic asthma mouse model [32, 33]. These findings suggest C. majus as a promising therapeutic agent for asthma. However, potential limitations exist. Some C. majus components may exhibit potential mild toxicity and many factors, like processing methods, can influence their efficacy. Further research to optimize processing techniques is crucial to address these limitations.
The TCM practitioners have long utilized processing techniques to refine crude herbs, aiming to improve their therapeutic efficacy and minimize potential toxicity [34, 35]. Processing methods encompass diverse techniques, including cleansing, size reduction, stir-frying and utilization of liquid additives [36]. Research has demonstrated that processing significantly alters the chemical profiles of herbal medicines, consequently impacting their pharmacological activity [37, 38]. While processing boasts a rich tradition, the mechanisms behind processing’s effects on most herbal medicines remain unclear. Recent studies have begun to unveil some of these mechanisms, including the reduction of toxic components, chemical transformations of active ingredients, increased solubility, physical alterations of the constituents and potential interactions with added excipients. Honey possesses multiple biological activities, including anti-inflammatory, antioxidant, antifungal and antibacterial properties [39, 40, 41]. As an alternative medicine, honey is used to treat asthma by Malaysians [42]. Processing with honey is a common practice in TCM herbal preparation. Understanding how this processing influences the mechanisms of action of these herbal medicines is essential for standardizing processing methodologies and ensuring the safety and effectiveness of herbal medicines in clinical practice. Further research is needed to explore the therapeutic mechanisms of processed herbal medicines and develop optimized processing methods. Therefore, considering the promise of C. majus for treating asthma and the potential advantages associated with honey processing in TCM, investigating the therapeutic mechanism of honey-processed C. majus (HC) for asthma holds significant promise.
Despite promising preclinical evidence suggesting the therapeutic potential of C. majus for allergic asthma, its clinical application is limited by concerns regarding its potential toxicity and variable efficacy. This study explored honey-processed C. majus (HC) as a potential strategy to address these limitations. The C. majus was processed with honey and metabolomics and transcriptomics were employed to investigate asthma-relevant metabolic profile changes, molecular hallmarks of asthma and molecular mechanisms involved in HC treatment. By investigating the therapeutic potential of HC, this work is expected to contribute to the development of improved asthma treatments with enhanced safety and efficacy. Therefore, this study investigated the therapeutic potential and mechanisms of HC in a rat model of ovalbumin (OVA)-induced asthma.
The experiments were conducted in the Microorganism and Biochemical Pharmacy Innovation Lab at College of Pharmacy, Changchun University of Chinese Medicine, during March to October, 2021.
Dexamethasone (Dex) and ovalbumin (OVA) were obtained from Suicheng Pharmaceutical Co., Ltd. (Zhengzhou, China) and Shanghai Yuanye Bio-Technology Co., Ltd. (Shanghai, China), respectively. Chelidonium majus samples were provided by Hebei Renxin Pharmaceutical Co., Ltd. (Hebei, China). The botanical identity of the samples was confirmed by Prof. Shumin Wang of Changchun University of Chinese Medicine. The honey-processing procedure for Chelidonium majus was conducted following the general rules of the Chinese Pharmacopeia 2020 Edition [43]. Refined honey was subjected to dilution using boiling water at a boiling water/refined honey ratio of 1:1.9 (w/w).
After stirring of obtained mixed sample (20.7:100, diluted honey/raw C. majus, w/w) till total moistening, the sample was put in a preheated pan, followed by mild fire frying to dryness. Before being stored in a desiccator, the honey-processed C. majus (HC) was cooled in the plate. The HC was ground into a powder and sieved through a 60 mesh filter. The precisely weighed powder (400 g) was subjected to reflux extraction with 80% methanol for two 1 hr cycles. After conflating, the filter liquor was concentrated under reduced pressure, freeze-dried into powder and finally storage at –80 °C.
The HC extract was dissolved in a solution of methanol containing 2-amino-3-(2-chloro-phenyl)-propionic acid (4 ppm) and was then passed through a 0.22 µm membrane. Composition identification was performed on a Vanquish UHPLC System (Thermo Fisher Scientific, Waltham, MA, USA) coupled with a Q-Exactive Focus mass spectrometer (Thermo Fisher Scientific, Waltham, MA, USA) equipped with an electrospray ionization (ESI) source [44]. The detailed instrument parameters for UPLC-Q-Exactive MS analysis are provided in Supplementary Table 1.
Composition was initially confirmed based on accurate molecular weight (MW error
Specific pathogen-free (SPF) male Sprague-Dawley (SD) rats (220
Forty-eight rats were randomized as 6 groups (n = 8): Control, Model (asthma), Dexamethasone (Dex, positive control) and low, medium and high-dose HC (HCL, HCM and HCH) groups. An asthma model was established after 7 days of routine feeding. The sensitizing solution was prepared by dissolving 100 mg OVA and 100 mg aluminum hydroxide in 1 mL of normal saline. Rats in each group (except control) received intraperitoneal injections of sensitization solution on days 1 and 8. Control rats were given injections of 1 mL of normal saline in an identical way. Following the last sensitization (day 15), each group was continuously gavaged for 7 days. The Control and Model groups received normal saline, the Dex group received dexamethasone (0.5 mg/kg) and the HC groups received their respective doses (0.81, 1.21 or 1.62 mg/kg) according to the regulations of Chinese Pharmacopoeia 2020 Edition [43]. The gavage volume was 10 mL/kg/day. Thirty minutes after each administration, the rats were challenged with 1% (w/v) OVA solution in a plexiglass chamber for 30 min once daily. Likewise, normal saline was given to control rats.
Following the final atomization inhalation, rats were fasted for 12 hrs. The next day, they were deeply anesthetized under intraperitoneal sodic pentobarbital anesthesia (100 mg/kg). After confirming the absence of a pedal reflex, the rats were euthanized via exsanguination or thoracotomy. A portion of lung tissue was collected for pathological analysis. After fixation with 4% paraformaldehyde, the lung tissues were dehydrated in ethylic alcohol, embedded in paraffin and sliced (4 µm). Hematoxylin and Eosin (H&E) staining was performed with sections for assessing inflammation. Periodic acid-Schiff (PAS) staining was performed to evaluate goblet cell hyperplasia. A scoring system (0–4 scale) was adopted to evaluate the severity of peribronchial and perivascular inflammation, while goblet cell hyperplasia was graded (0–4 scale) based on the number of PAS-positive cells in each airway [47, 48]. Masson staining was employed for assessing collagen fiber deposition in airways, which stained blue. ImageJ software version 1.54 (NIH, Bethesda, MD, USA) was utilized to quantify the percentage of collagen fiber area [49]. A double-blind approach was employed for the evaluation of inflammation.
Serum samples were collected and the supernatant was subjected to centrifugation
(3000 rpm, 10 min, 4 °C). The concentrations of inflammatory mediators
(IL-10, IL-13 and IL-1
Serum samples from the Control, Model and HCH groups were subjected to metabolomic analysis utilizing a Waters Acquity UPLC I-Class PLUS (Waters, Medford, MA, USA) with a Waters Xevo G2-XS QTOF mass spectrometer (Waters, Medford, MA, USA) (Supplementary Table 2) [50].
Raw data were processed with Progenesis QI software version 3.0 (Nonlinear
Dynamics, Wilmslow, UK) for peak extraction, alignment, or additional data
implementation, with mass deviation and theoretical fragment identification
within
Identified metabolites were subsequently searched in established databases
(KEGG, LipidMaps and HMDB) to retrieve pathway and classification information.
Differential multiples between groups were calculated and statistically evaluated
utilizing Student’s t-tests. To visualize overall separation between
groups, Principal Component Analysis (PCA) was employed. Orthogonal projection to
latent structures-discriminant analysis (OPLS-DA) modeling was completed using R
language package ropls. The model reliability was assessed through 200-fold
permutations and model variable importance projection (VIP) was determined
through multiple cross-validation. Differentially accumulated metabolites (DAMs)
were identified (fold change, FC
This work collected lung tissues from Control (n = 3), Model (n = 3) and HCH groups (n = 3) for RNA sequencing. The quality and quantity of the isolated RNA were analyzed with a NanoDrop 2000 spectrophotometer (Thermo Fisher Scientific, Waltham, MA, USA). The RNA integrity was evaluated utilizing an Agilent Bioanalyzer 2100 system (Agilent Technologies, Santa Clara, CA, USA) with an RNA Nano 6000 Assay Kit. The cDNA libraries were constructed and their quality was verified using an Agilent Bioanalyzer 2100 system (Agilent Technologies, Santa Clara, CA, USA). Raw reads were further processed using BMKCloud platform [51].
Differential gene expression analysis was performed using the DESeq2 R package
with the criteria of p
To validate the mRNA expression levels of hub genes, RT-qPCR was employed. Total
RNA was isolated from lung tissues utilizing TRIzol reagent (Cat. No. 15596026,
Thermo Fisher Scientific, Waltham, MA, USA). The mRNA levels were quantified
using SYBR Green Premix Ex TaqII (Cat. No. RR820A, TaKaRa, Dalian, China). The
cycling conditions were 95 °C for 30 sec, then 40 cycles of 95
°C for 15 sec and 60 °C for 30 sec. The relative levels of gene
expression were calculated by reference to the
| Gene name | Forward primer | Reverse primer |
| IL6 | GAGTTGTGCAATGGCAATTCTG | ACGGAACTCCAGAAGACCAGAG |
| IL10 | AGAAGCTGAAGACCCTCTGGATA | TTCATTTTGAGTGTCACGTAGGC |
| Ccl2 | TTCAAAACAGACCTGCGCTTC | ATGGATAGCACACAGGTTGGTATCT |
| Cxcl6 | TTGACCCAGAAGCTCCGTTG | TGCAAGTGCATTCCGCTTTG |
| Cxcl2 | CTGTACTGGTCCTGCTCCTCCT | AGTGGCTATGACTTCTGTCTGGG |
| Ptgs2 | CTGATGACTGCCCAACTCCC | CTGGGCAAAGAATGCGAACA |
| Pla2g16 | GATATGTGATCCACCTGGCTCC | GTTCAGAGGCAGCGGAGTGTA |
| Entpd8 | TCCCTGAACTACACCCAGAACCT | CATAGAACTGGCCATGCACG |
| Pde3a | CAGCATAAAGCCACATGAAGCC | ACAGCATAGGACGAAGTGAAGGAC |
| Pde5a | AAGCAGGCAAGATTCAGAACAAG | CTGGGCTGTTTAGAACCATCAA |
| Pde7b | GGCTCCTACCCGTTCATTGACT | GTCCAAGGTAGTCTTCGTCCAGC |
| P4ha1 | AGATCCAGAAGGGTTTGTCGG | CAACCTGGTCTTCGTCGTTAGG |
| Adcy9 | TGAGACCTTCGGTTACCATTTCC | GACCTCACCTGAGACATGACAAAC |
| Pck2 | TGCCATGGCTGCTATGTACC | TTTGGATGCTACGGCATGGT |
| Rrm2b | TTTCAGTACCTGGTAAACAAGCC | ATGACTGCAAATCGCTGATACTC |
| Actb ( |
GCGCTCGTCGTCGACAACGG | GTGTGGTGCCAAATCTTCTCC |
Notes: Hub genes: IL6, IL10, Ccl2, Cxcl6,
Cxcl2 and Ptgs2; Key genes: Pla2g16, Entpd8,
Pde3a, Pde5a, Pde7b, P4ha1, Adcy9,
Pck2, Rrm2b and Ptgs2; Reference gene: Actb
(
To elucidate the mechanism by which HCH alleviates OVA-induced asthma, 35 metabolic biomarkers and 273 DEGs were coanalyzed using the Cytoscape 3.9.1 software (Cytoscape Consortium, San Diego, CA, USA) plug-in Metscape 3.1.3 (University of Michigan, Ann Arbor, MI, USA) to generate a compound-reaction-enzyme-gene network. Spearman’s rank correlation coefficients were calculated between 35 metabolic biomarkers and 273 DEGs to identify key genes and metabolites with significant correlations. For validation purposes, RT-qPCR was conducted to verify mRNA levels of 8 key genes and primer sequences were shown in Table 1.
Data were represented as Mean
The UPLC-Q-Exactive MS analysis was performed to identify the chemical constituents present in the HC extract. This analysis revealed 28 compounds (Supplementary Fig. 1A,B). Under positive ion mode, 21 compounds were identified, including chelidonic acid, p-coumaric acid, caffeic acid, magnocurarine, magnoflorine, chelamine, protopine, chelidonine, tetrahydrocoptisine, coptisine, homochelidonine, berberine, quercetin, chelerythrine, chelilutine, kaempferol, isorhamnetin, oxysanguinarine, dihydrochelerythrine, dihydrosanguinafine and corysamine.
In negative ion mode, 7 compounds were identified, including citric acid, gallic acid, ferulic acid, genistein, luteolin, calycosin and formononetin (Table 2). Further analysis of these identified compounds using the Traditional Chinese Medicine Systems Pharmacology Database and Platform (TCMSP) and relevant literature exploration suggested that all 28 compounds were considered major contributors to the therapeutic effects of HC extract.
| No. | tR/min | Identification | Molecular formula | Experimental mass (MS) | Theoretical mass (m/z) | Fragment ion (MS/MS) m/z | |
| Positive ion mode | 1 | 1.364 | Chelidonic acid | C7H4O6 | 185.0081 | 185.0081 | 141.0181, 97.0288, 96.0447 |
| 2 | 1.511 | p-Coumaric acid | C9H8O3 | 165.0546 | 165.0546 | 148.0757, 120.0811, 119.0493, 91.0547 | |
| 3 | 1.936 | Caffeic acid | C9H8O4 | 181.0495 | 181.0495 | 163.0623, 135.9564, 117.0703, 111.0444, 98.9846, 89.0389, 79.0547 | |
| 4 | 3.463 | Magnocurarine | C19H24NO3+ | 314.1747 | 314.1751 | 269.1179, 175.0756, 143.0492, 107.0495 | |
| 5 | 3.834 | Magnoflorine | C20H24NO4+ | 342.1698 | 342.17 | 299.1275, 297.1119, 282.0882, 279.1026, 269.1169, 265.0857, 237.0907 | |
| 6 | 3.91 | Chelamine | C20H19NO6 | 370.1283 | 370.1285 | 352.1193, 321.0754, 291.0649 | |
| 7 | 4.591 | Protopine | C20H19NO5 | 354.1333 | 354.1336 | 336.1220, 206.0813, 189.0783, 188.0704, 149.0597 | |
| 8 | 4.732 | Chelidonine | C20H19NO5 | 354.1334 | 354.1336 | 336.1230, 323.0912, 305.0805, 275.0700 | |
| 9 | 4.779 | Tetrahydrocoptisine | C19H17NO4 | 324.1227 | 324.123 | 307.0960, 249.0906, 188.0702, 176.0705, 149.0596 | |
| 10 | 4.816 | Coptisine | C19H14NO4+ | 320.0916 | 320.0917 | 318.0760, 292.0966, 277.0733, 262.0861 | |
| 11 | 4.9 | Homochelidonine | C21H23NO5 | 370.1648 | 370.1649 | 352.1540, 336.1226, 290.0934, 275.0698, 188.0704 | |
| 12 | 5.171 | Berberine | C20H18NO4+ | 336.1228 | 336.123 | 321.0986, 320.0914, 306.0758, 292.0964, 278.0805 | |
| 13 | 5.318 | Quercetin | C15H10O7 | 303.0498 | 303.0499 | 302.0432, 301.0338, 257.0441, 229.0493 | |
| 14 | 5.364 | Chelerythrine | C21H18NO4+ | 348.1227 | 348.123 | 333.0977, 332.0914, 318.0759, 290.0813 | |
| 15 | 5.659 | Chelilutine | C22H20NO5+ | 378.1335 | 378.1336 | 363.1097, 362.1008, 348.0862, 332.0912, 320.0918 | |
| 16 | 5.767 | Kaempferol | C15H10O6 | 287.0548 | 287.055 | 285.0520, 165.0181, 153.0180 | |
| 17 | 5.86 | Isorhamnetin | C16H12O7 | 317.0655 | 317.0656 | 318.0737, 151.0388, 107.0860 | |
| 18 | 7.121 | Oxysanguinarine | C20H13NO5 | 348.0864 | 348.0866 | 333.0627, 320.0911, 319.0810, 305.0679, 275.0589, 262.0859, 248.0707, 247.0627, 291.0851 | |
| 19 | 8.496 | Dihydrochelerythrine | C21H19NO4 | 350.1384 | 350.1387 | 335.1138, 334.1070, 319.1196, 290.0860 | |
| 20 | 8.62 | Dihydrosanguinafine | C20H15NO4 | 334.1072 | 334.1074 | 319.0828, 318.0757, 304.0984, 276.1017 | |
| 21 | 8.621 | Corysamine | C20H16NO4+ | 334.1063 | 334.1074 | 319.0829, 304.0984, 276.1016, 261.0776 | |
| Negative ion mode | 1 | 0.693 | Citric acid | C6H8O7 | 191.0199 | 191.02 | 173.0091, 147.0299, 129.0193, 87.0088, 85.0295 |
| 2 | 1.468 | Gallic acid | C6H7O5 | 169.0143 | 169.014 | 125.0295, 97.0295, 81.0346 | |
| 3 | 4.338 | Ferulic acid | C10H10O4 | 193.0508 | 193.051 | 178.0262, 134.0685, 133.0648, 118.0415, 106.0735, 105.0702 | |
| 4 | 5.666 | Genistein | C15H10O5 | 269.0458 | 269.046 | 225.0559, 201.0560, 151.0041 | |
| 5 | 5.727 | Luteolin | C15H10O6 | 285.0407 | 285.041 | 257.0449, 241.2173, 151.0036 | |
| 6 | 5.889 | Calycosin | C16H12O5 | 285.0756 | 285.076 | 270.0522, 253.0493, 225.0544, 214.0621, 213.0545, 137.0233 | |
| 7 | 6.181 | Formononetin | C16H12O4 | 267.0664 | 267.066 | 253.0462, 252.0428, 251.0353, 224.0464, 223.0409, 195.0443, 132.0222 |
At the start of the experiment, there were no notable differences in body weight
and relative lung weight among rats in all six groups. Compared to Control group,
OVA challenge caused a notable decrease (p
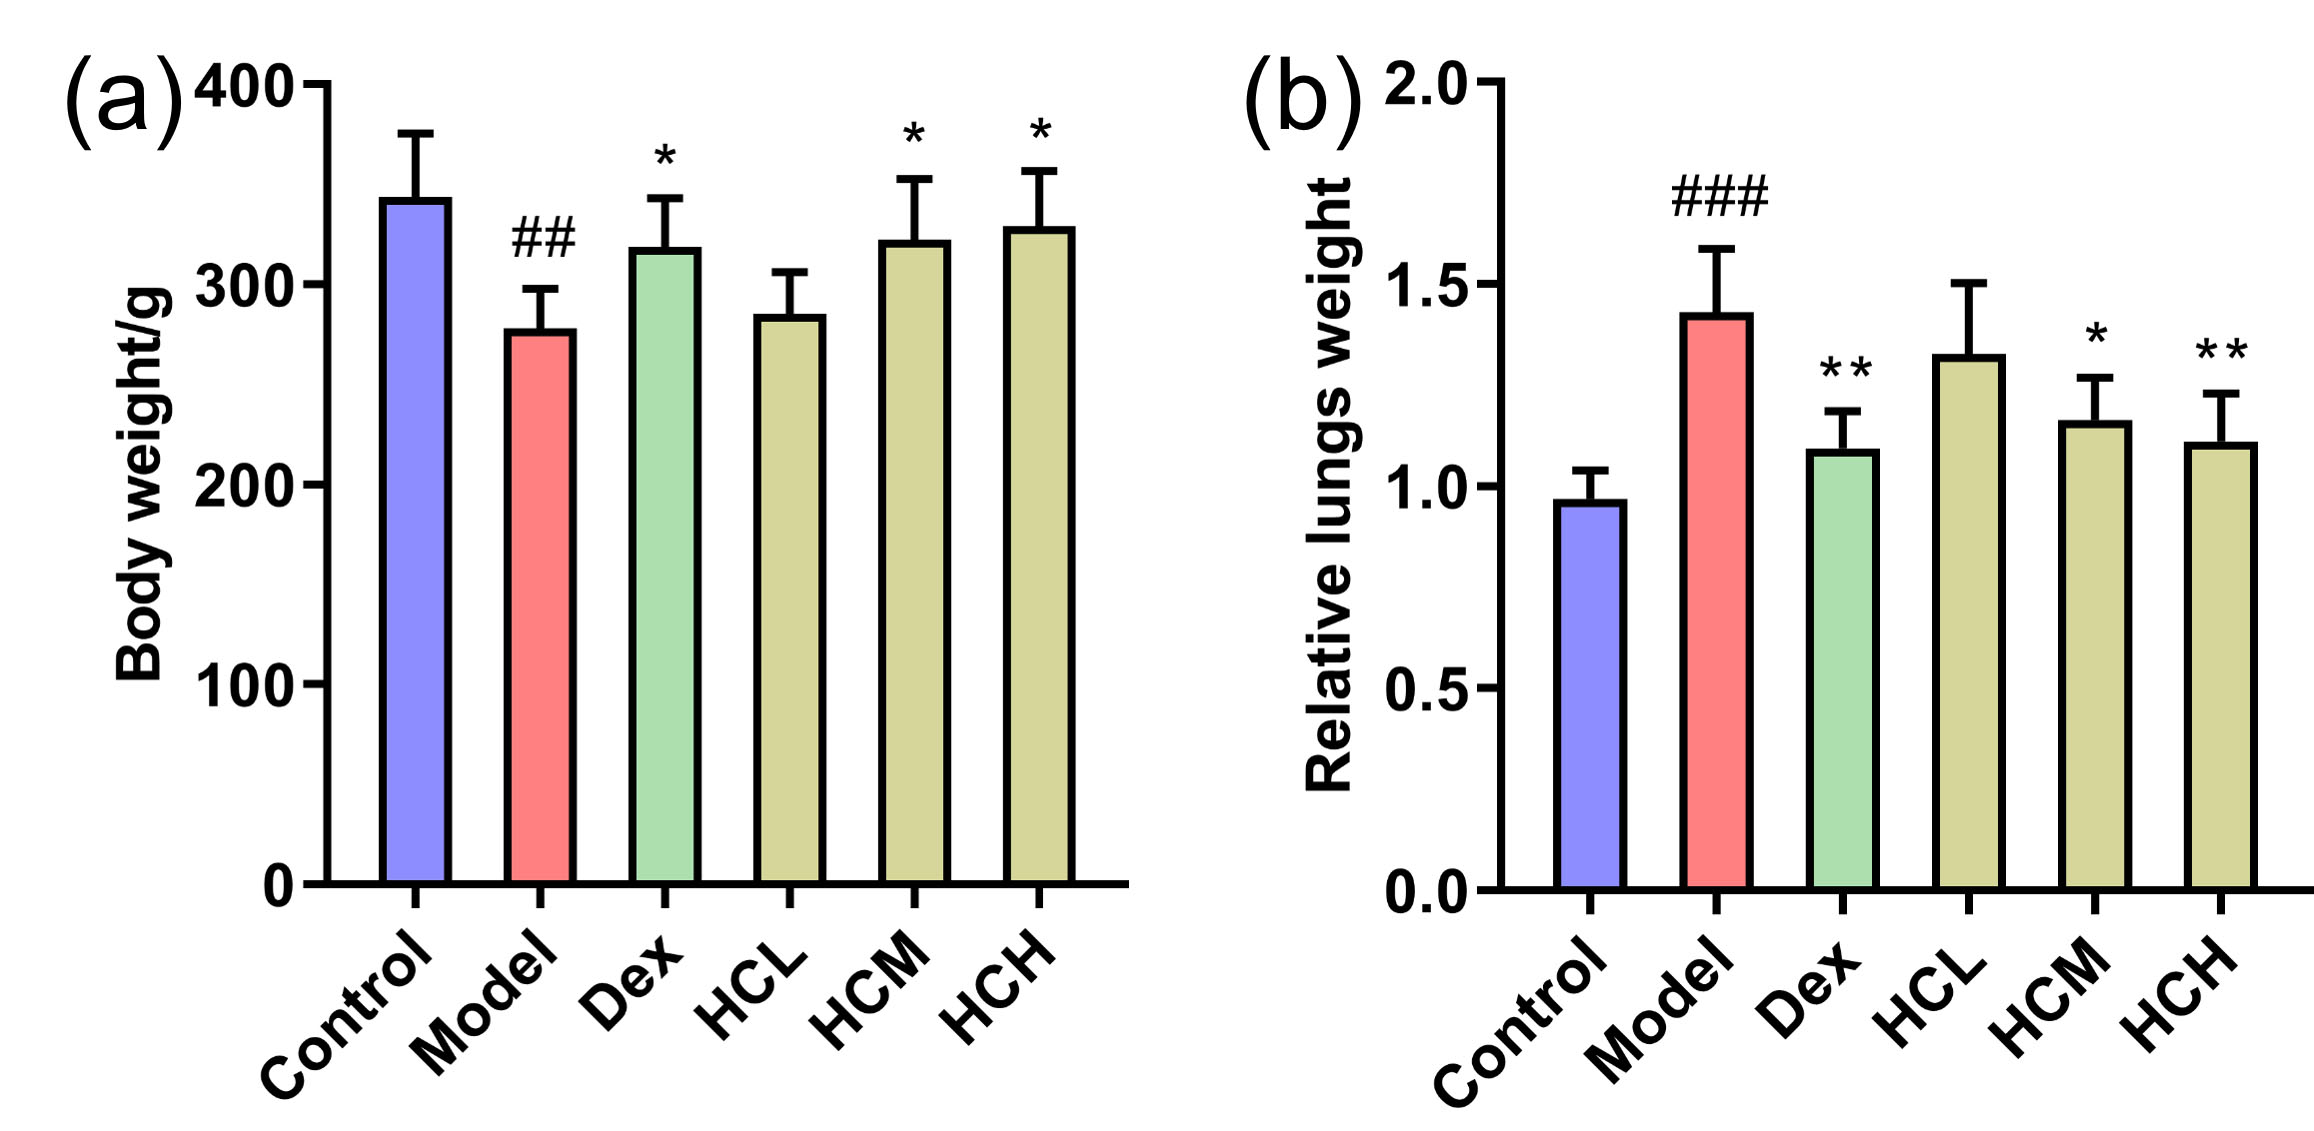 Fig. 1.
Effect of HC administration on body weight and relative lung
weight in OVA-induced asthmatic rats. (a) Body weight and (b) Relative lung
weight of groups after administration. Values are shown as Mean
Histological examination of bronchial tissues revealed no abnormalities in the Control group. In contrast, the Model group displayed marked infiltration of inflammatory cells in bronchi and perivascular. Administration of Dex, HCM and HCH obviously reduced the severity of inflammatory cell infiltration compared to Model group (Fig. 2a). Based on PAS staining, there was few goblet cells in Control group. On the contrary, the Model group displayed significant proliferation of goblet cells on airway epithelium. The Dex, HCL, HCM and HCH groups obviously attenuated goblet cell proliferation compared to the model group (Fig. 2b).
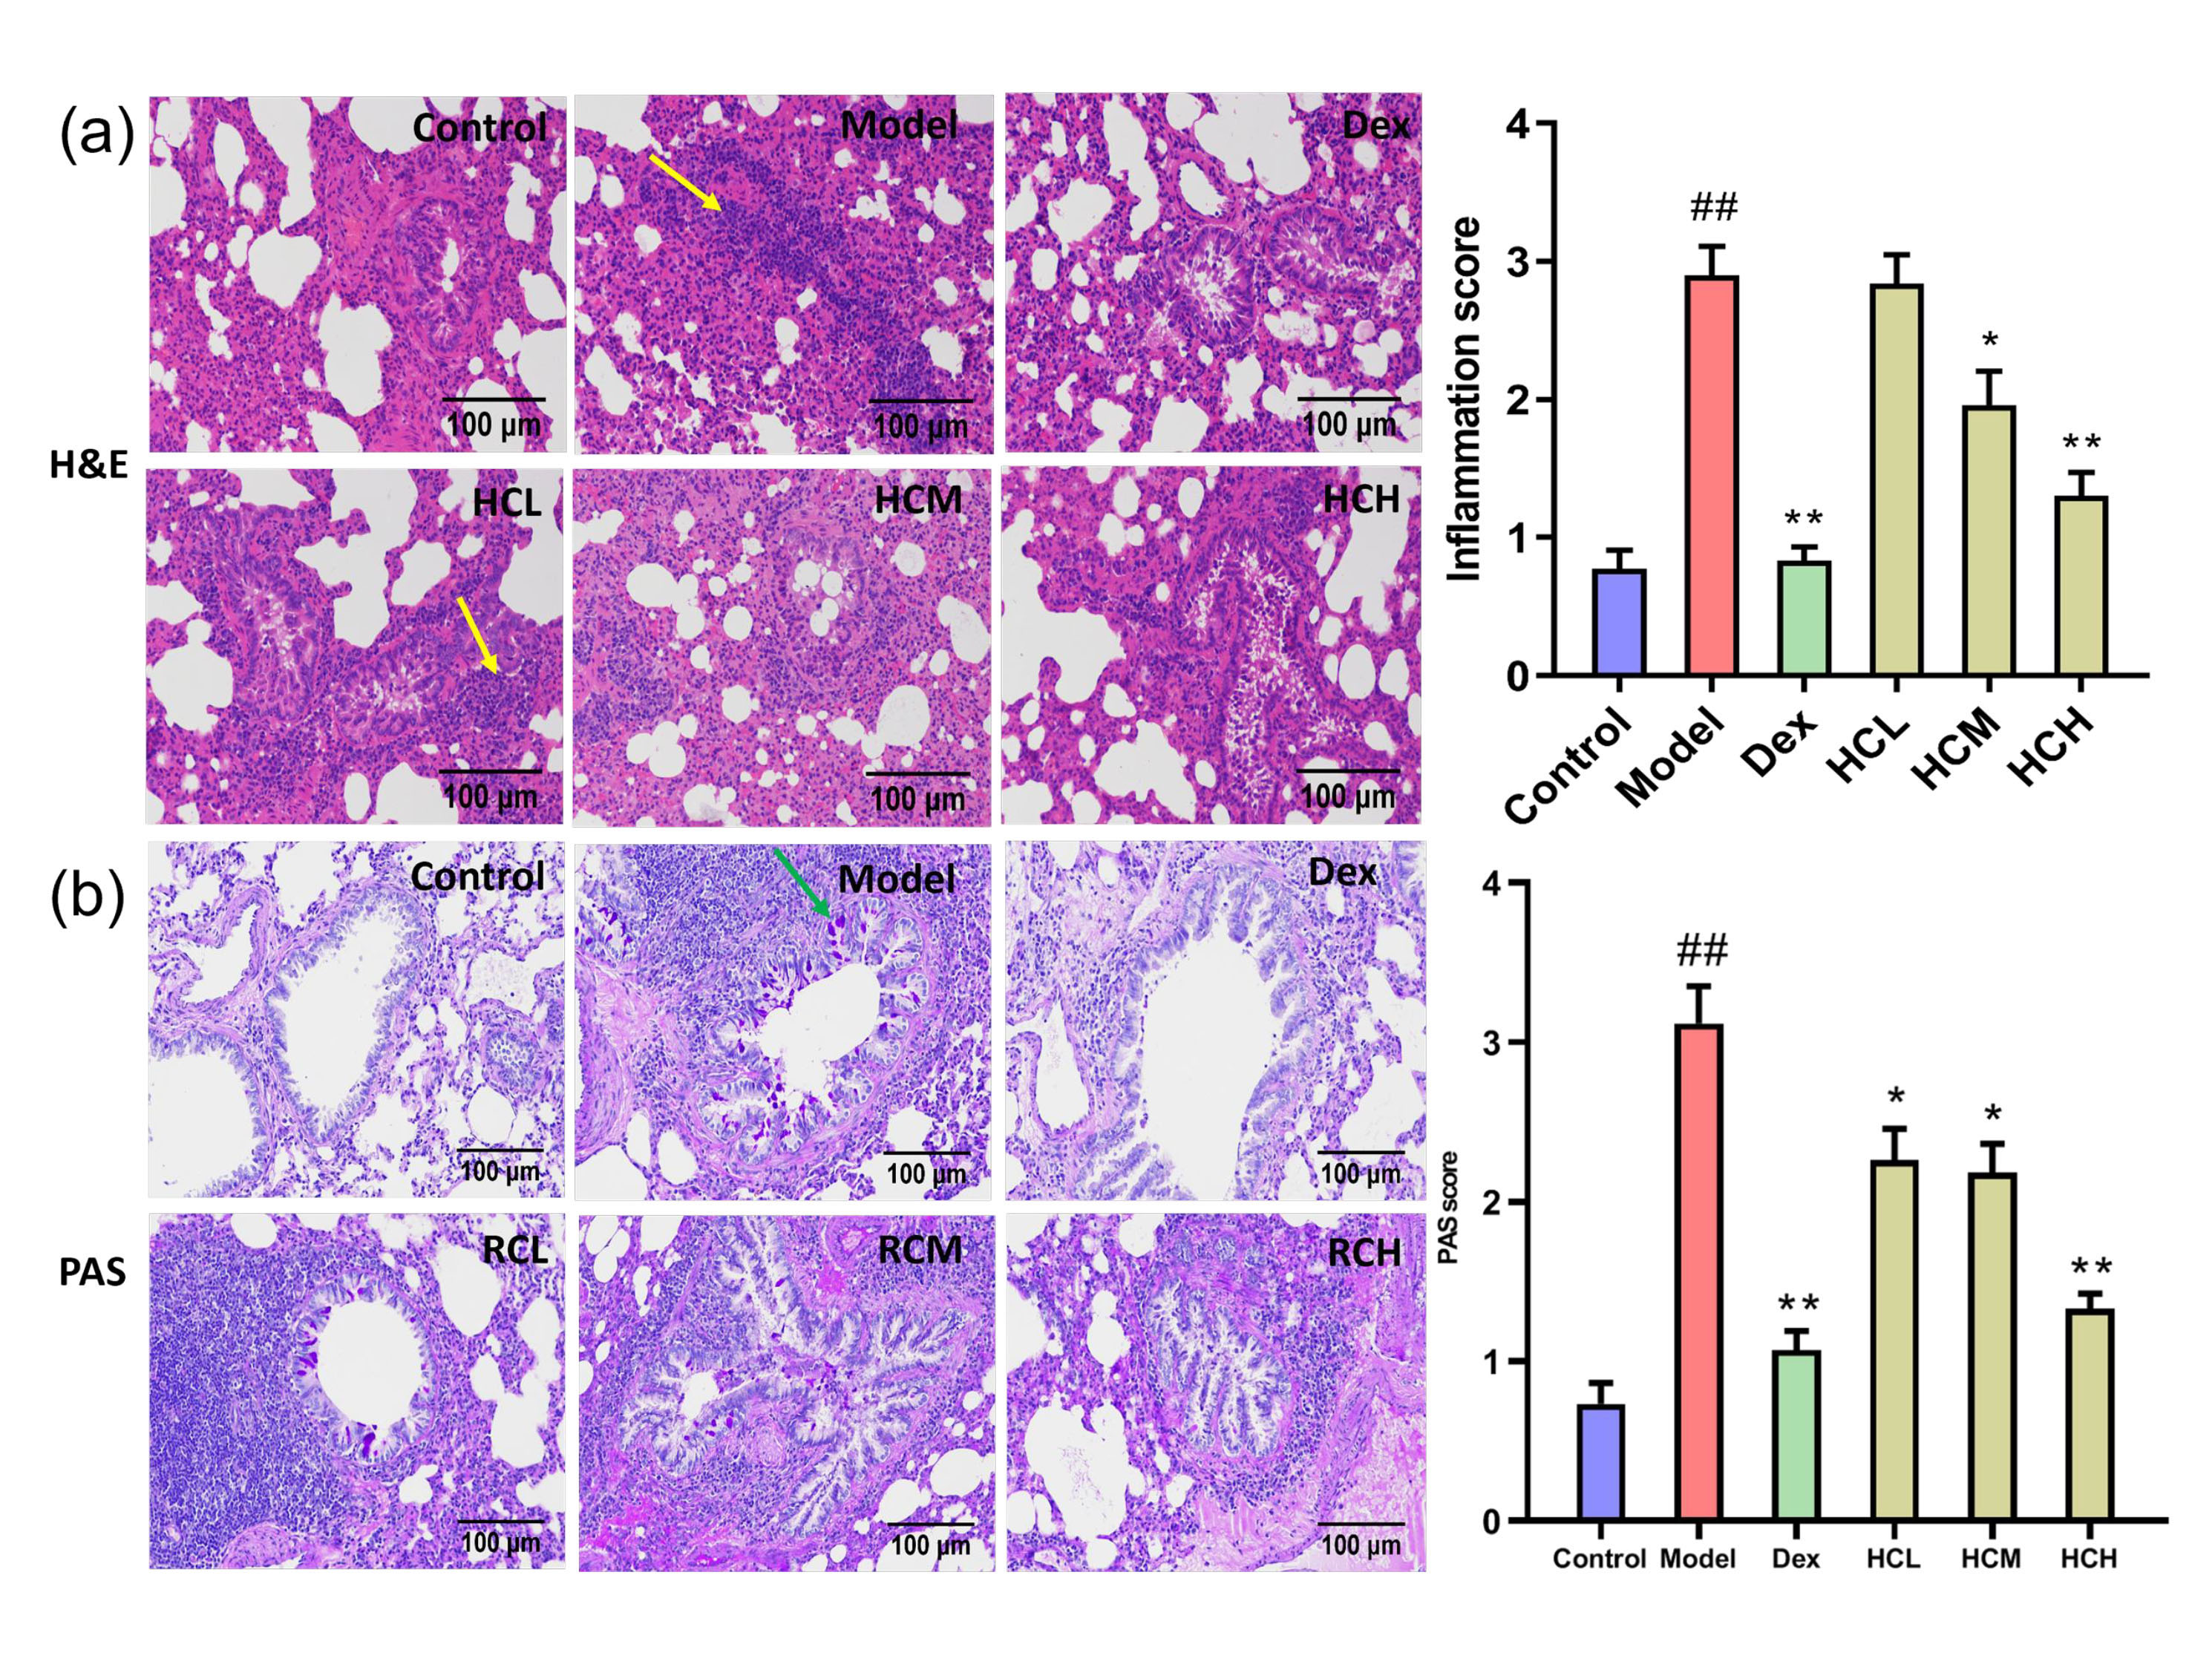 Fig. 2.
HC alleviates pulmonary inflammation and goblet cell
proliferation. (a) Hematoxylin and Eosin (H&E) staining of lung sections
(
In Model group, IL-13 and IL-1
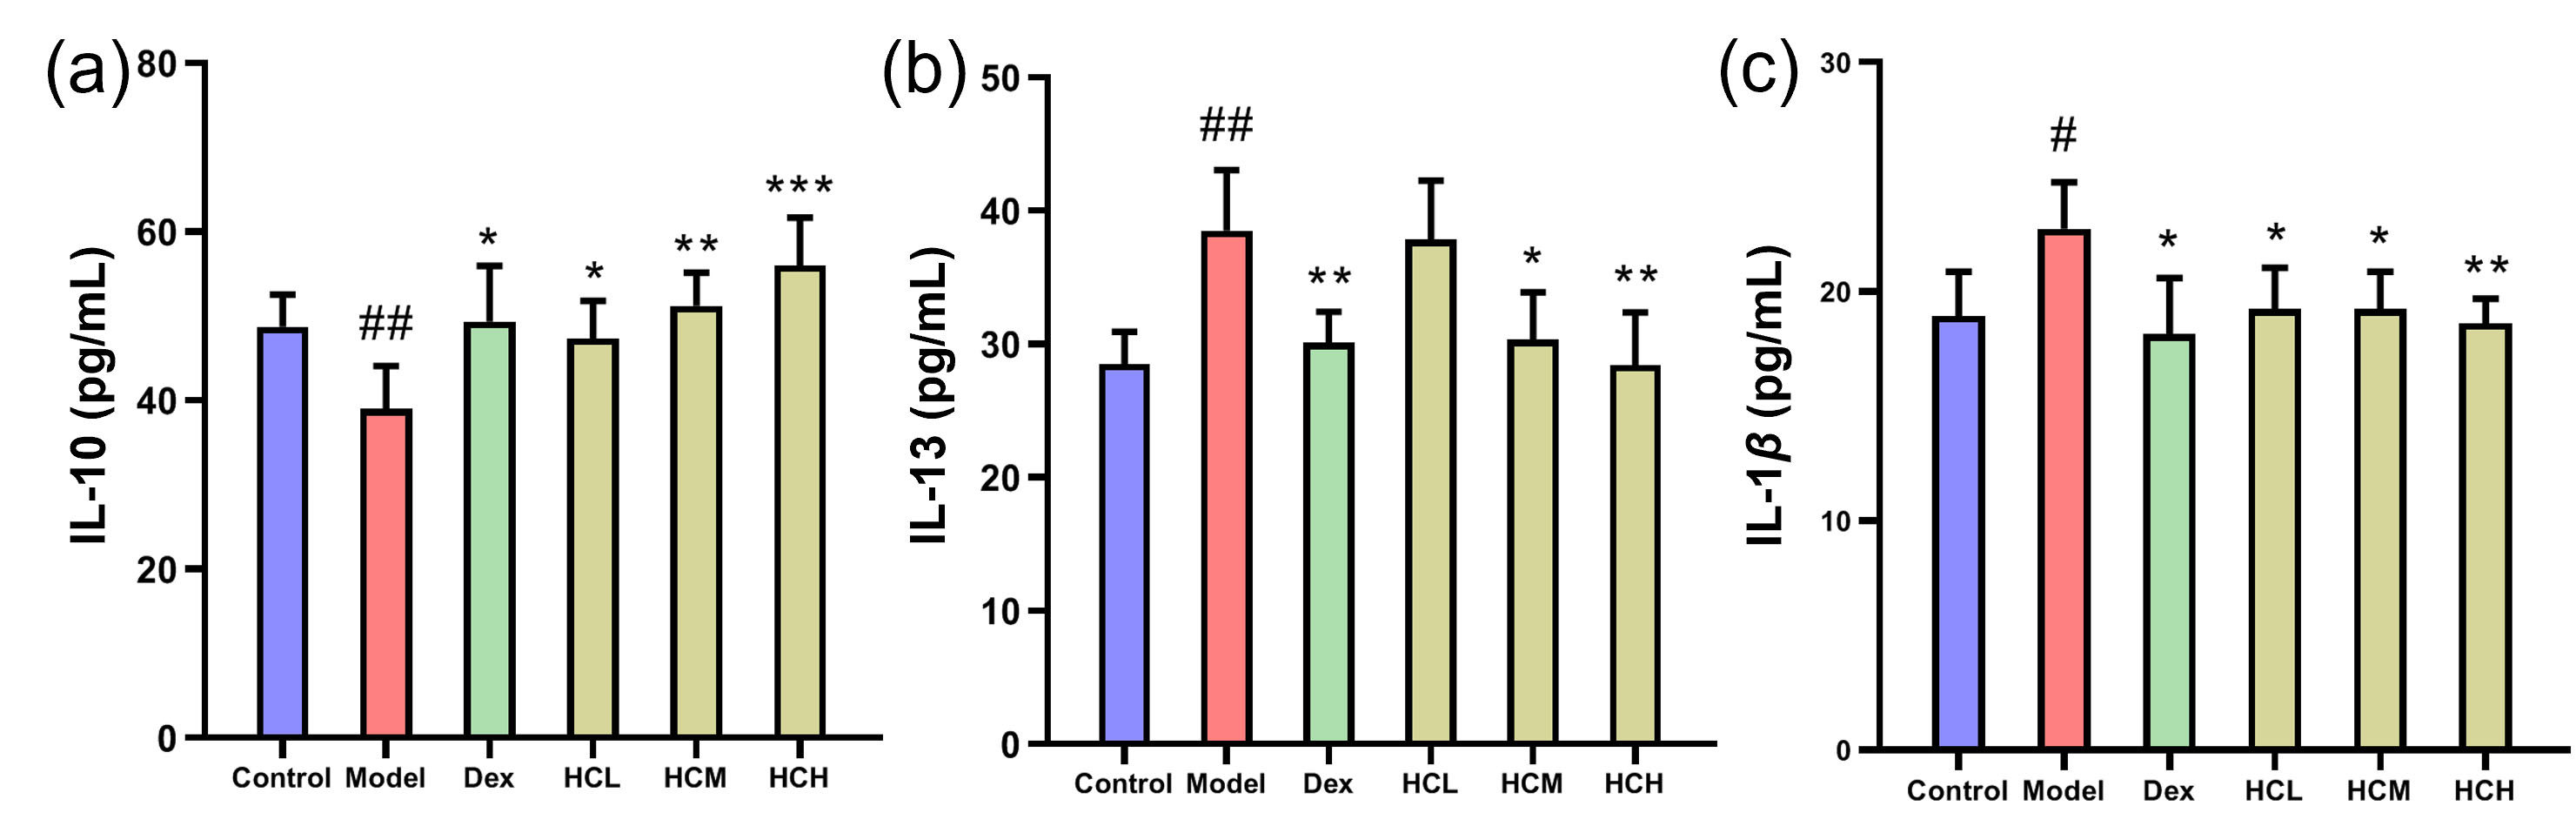 Fig. 3.
Serum levels of inflammatory markers. (a) IL-10, (b) IL-13 and
(c) IL-1
To assess the stability of the UPLC-MS method, three quality control (QC) samples, prepared by pooling equal aliquots of experimental samples from all groups, were run before initiating the experiment and then once every six samples throughout the analysis. Furthermore, polar and nonpolar tissue samples underwent analysis using negative and positive ion modes, respectively (Supplementary Fig. 2A–F). Following data calibration and normalization, PCA analysis was performed using datasets from all samples. The PCA score plots (Supplementary Fig. 2G,H) demonstrate tight clustering of QC samples in the center for both ion modes, suggesting good reproducibility and stability of the developed method.
The PCA score plots (Fig. 4a) revealed a basic separation between Control and
Model groups. Furthermore, HCH group clustered closer to Control group compared
to Model group. This suggested distinct metabolite profiles between Control and
Model groups, with HCH group exhibiting more similarity to Control group. OPLS-DA yielded R2Y and Q2 values of 0.990 and 0.902 for Control-vs-Model (Fig. 4b), as well as 0.962 and 0.859 for HCH-vs-Model (Fig. 4d), consistently showed clear discrimination. Permutation tests confirmed the reliability of models, with R2 and Q2 values well below the original values (Fig. 4c,e). Based on the
multivariate analysis of OPLS-DA (FC
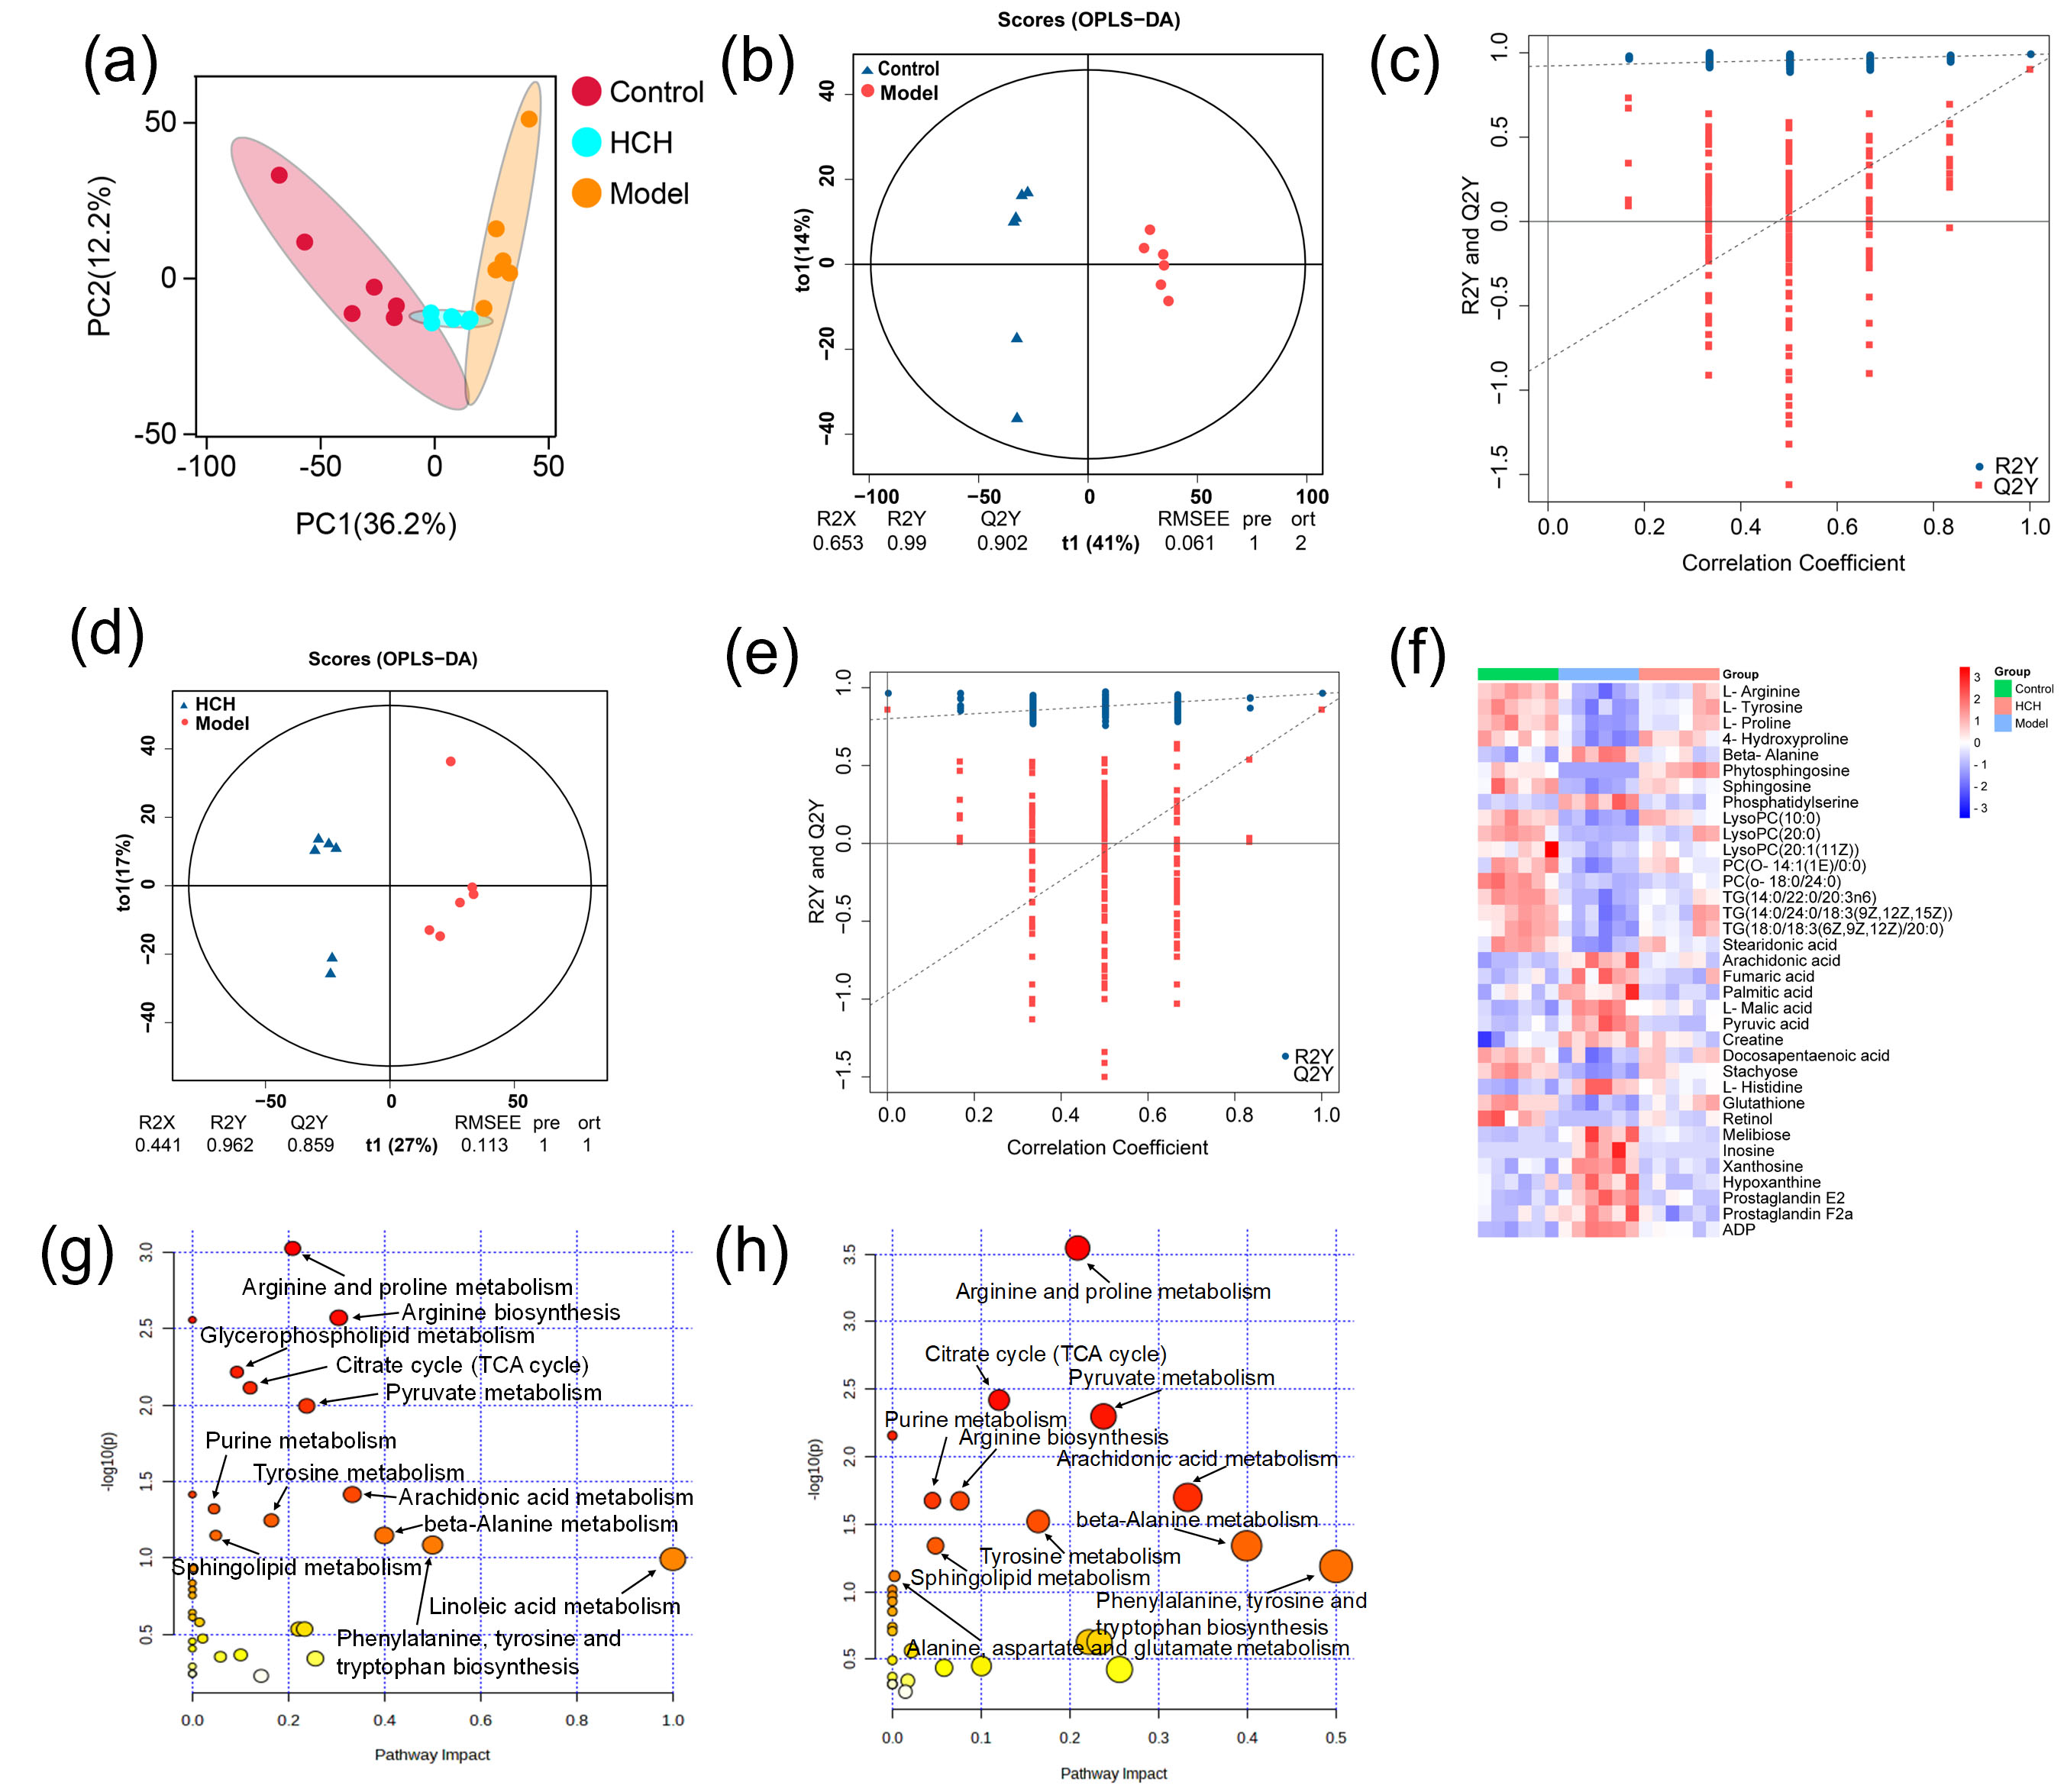 Fig. 4.
Metabolomic profiling among the Control, Model and HCH groups. (a) Principal component analysis (PCA) score plot showcasing the overall separation of metabolic profiles. (b–e) Orthogonal projections to latent structures discriminant analysis (OPLS-DA) score plots depicting model validation and group separation. (f) Heatmap visualization of metabolic biomarkers among groups (n = 6) and (g,h) Metabolic pathway analysis of Model-vs-Control group, Model-vs-Control and HCH-vs-Model groups. (g,h) Size of the bubble corresponds to the pathway impact score and the color intensity represents the –log(p-value).
Metabolic pathway analysis of the identified metabolites revealed distinct alterations across experimental groups. The Model group, compared to Control, exhibited remarkable enrichment in twelve key metabolic pathways, primarily related to lipid metabolism (glycerophospholipid, arachidonic acid, linoleic acid and sphingolipid), amino acid metabolism (arginine, proline, tyrosine, phenylalanine, tryptophan and beta-alanine) and energy metabolism (citrate cycle, pyruvate metabolism and purine metabolism) (Fig. 4g). Treatment with HCH partially reversed these, with 11 major pathways showing significant modulation, notably those associated with amino acid and energy metabolism (Fig. 4h).
To sum up, asthma induction disturbed these metabolic biomarkers as well as associated metabolic pathways. The alteration was mainly associated with lipid, amino acid and fatty acids metabolic disorders. After HCH intervention, the disorder reversed to some extent.
The RNA-seq was performed on lung tissues from Control, Model and HCH groups to identify major DEGs and functional pathways involved in HCH action against OVA-induced allergic asthma. In Model-vs-Control group comparison, 754 DEGs were detected, with 454 up-regulated and 300 down-regulated. The HCH group exhibited 273 DEGs compared to Model group, of which 167 up-regulated and 106 down-regulated (Fig. 5a). The 20 most significantly enriched pathways of KEGG enrichment analysis are presented in Fig. 5b,c. In Model-vs-Control group, the most enriched pathways were primarily related to inflammation pathways (cytokine-cytokine receptor interaction, chemokine signaling pathway, TNF signaling pathway and IL-17 signaling pathway), immune pathways (hematopoietic cell lineage, antigen processing and presentation, intestinal immune network for IgA production) and asthma. In Model-vs-Control and HCH-vs-Model groups, the enrichment pathways were mostly associated with airway mucus secretion (Hedgehog pathway), inflammation pathways (PI3K-Akt signaling pathway, MAPK signaling pathway, chemokine pathway, TNF signaling pathway and IL-17 signaling pathway) and airway remodeling (ECM-receptor interaction).
 Fig. 5.
Transcriptomic analysis revealing differentially expressed genes (DEGs), key pathways and hub genes modulated by HCH in the OVA-induced asthma model. (a) Heatmap showing DEGs in Control, Model and HCH groups. (b,c) Bubble chart showing Kyoto Encyclopedia of Genes and Genomes (KEGG) pathway enrichment analysis of DEGs in Model-vs-Control, HCH-vs-Model groups and (d) Protein-protein interaction (PPI) networks for DEGs in Model-vs-Control and HCH-vs-Model comparisons.
According to the degree centrality, the PPI network analysis identified 6 genes with the highest degree values, including Il6 (degree = 82), Il10 (degree = 62), Ccl2 (degree = 52), Cxcl2 (degree = 34), Ptgs2 (degree = 26) and Cxcl6 (degree = 26), in the Model-vs-Control and HCH-vs-Model groups (Fig. 5d).
To validate the functions of HC in asthma by those potential hub genes, RT-qPCR
was performed to assess Il6, Il10, Ccl2,
Cxcl2, Ptgs2 and Cxcl6 mRNA expression (Fig. 6). The
OVA-induced asthma resulted in a significant up-regulation of Il6,
Ccl2, Cxcl2, Ptgs2 and Cxcl6 relative to
Control group. Administration with HCH significantly down-regulated Il6,
Ccl2, Cxcl2 and Cxcl6 expressions (p
 Fig. 6.
Validation of hub gene expression by RT-qPCR. Relative mRNA
expression levels of (a) Il6, (b) Ccl2, (c) Cxcl2,
(d) Ptgs2, and (e) Cxcl6 in the lung tissues of Control, Model,
and HCH-treated rats. Results are represented by Mean
To elucidate potential connections between DEGs and metabolic biomarkers, a gene-metabolite network was constructed using Metscape software (Supplementary Fig. 3). This analysis revealed seven key targets (P4ha1, Pde3a, Pde5a, Adcy9, Pck2, Pla2g16 and Entpd8), corresponding to eleven differential metabolites (L-proline, L-arginine, L-malic acid, inosine, xanthosine, hypoxanthine, LysoPC(20:0), LysoPC(20:1(11Z)), arachidonic acid, PGE2 and PGF2a), involved in six important metabolic pathways (purine metabolism; arachidonic acid metabolism; urea cycle and metabolism of arginine, proline, glutamate, aspartate and asparagine; glycerophospholipid metabolism; glycolysis and gluconeogenesis; TCA cycle) in Model-vs-Control and HCH-vs-Model groups.
Spearman rank correlation was performed to assess the potential co-relationship
between DEGs and differential metabolites. The analysis revealed potential
correlations between DEGs and metabolites. Further analysis identified
statistically significant correlations between some metabolites and DEGs (Fig. 7a). P4ha1 was positively interrelated with L-proline and L-arginine
(p
 Fig. 7.
Correlation analysis of metabolites, differentially expressed
genes (DEGs) and validation of hub gene expression. (a) Significantly correlated
metabolic biomarkers and DEGs and (b) RT-qPCR validation of 10 genes. Data are
expressed as Mean
Furthermore, to evaluate the results of the network analysis, RT-qPCR was
performed to verify the mRNA expression levels of those 10 genes in lung tissues
(Fig. 7b). Compared with Control group, the expression of P4ha1,
Pde3a, Pde5a, Pde7b and Adcy9 were notably
reduced (p
 Fig. 8.
Changes of metabolites (blue squares) and DEGs (red circles) within five metabolic pathways based on correlation analysis. Red arrows indicate increased/decreased levels in Model-vs-Control group and blue arrows represent increased/decreased levels in HCH-vs-Model group.
Analysis using the TCMSP database revealed that a majority of the 28 identified
compounds were related to inflammatory diseases, indicating that HC may alleviate
asthma by exerting anti-inflammatory effects. The H&E staining revealed HC
effectively attenuated pulmonary inflammation. The ELISA assay showed that a high
dose of HC down-regulated the expression of pro-inflammatory cytokines IL-13 and
IL-1
Cytokines are well-established key players in asthma, contributing to AHR and airway blockage, mucus hyperproduction and airway remodeling [45]. The PPI network analysis of DEGs identified several hub genes that are classified as cytokines (Il6, Il10, Cxcl2, Cxcl6 and Ccl2) and Ptgs2 plays a typical part in regulating inflammatory responses by producing prostaglandins [46], which indicates HC’s therapeutic effects in allergic asthma may be closely associated with its anti-inflammatory effects.
The findings of this study reveal a remarkable metabolic and transcriptional feature in the lungs of asthmatic rats, with increased energy metabolism, reflected in both metabolite levels and gene expression (Fig. 8). Neutrophils have limited mitochondrial function and rely primarily on glycolysis and gluconeogenesis for ATP production [52]. Previous research found that the intermediate products of aerobic oxidation in asthma patients who were in a state of hypoxia increased significantly, such as malic acid [53]. The up-regulated expression of Pck2 and L-malic acid was restored after administration with a high dose of HC, which signified HC altered the state of hypoxia in asthmatic rats. Purine metabolism is essential for cellular energy homeostasis. Purine metabolites, including hypoxanthine, xanthine and inosine, were positively related to neutrophil inflammation in chronic obstructive pulmonary disease [49, 54]. In current study, the elevated expression of inosine in asthmatic rats indicated a potential state of relative hypoxia and potential association with inflammatory processes. The up-regulated expression of Entpd8, xanthosine, hypoxanthine and inosine and the down-regulated expression of Adcy9, Pde3a and Pde5a were all restored after administration of HCH, which signified HC altered the abnormal energy metabolism of asthmatic rats.
The arachidonic acid metabolism pathway is a critical player in immune responses and inflammatory diseases (such as asthma). Arachidonic acid metabolites have been proposed as potential biomarkers for both diagnosis and treatment monitoring in allergic asthma and a new biological target for monitoring subcutaneous immunotherapy’s therapeutic effect [55]. The PGE2 has been implicated in the exacerbation of several inflammatory responses and immune disorders [56]. The PGF2a has been linked to both acute and chronic inflammation [57]. Arachidonic acid represents the precursor to various strong pro-inflammatory [58]. In present study, HCH treatment also caused obvious decreased expression of arachidonic acid, PGE2, PGF2a and Pla2g16, indicating that the inflammatory response in asthmatic rats was alleviated.
Glycerophospholipid metabolism has been implicated in the pathogenesis of OVA-induced allergic asthma [59, 60]. Lysophosphatidylcholines (LysoPCs) are reportedly decreased in asthmatic rats and may possess immunosuppressive properties [61]. Asthma is also associated with reduced systemic levels of L-arginine [62]. Administration of HCH reversed the up-regulated expression of Pla2g16 and down-regulated the expression of P4ha1, L-proline, L-arginine, LysoPC(20:0) and LysoPC(20:1(11Z)), which revealed HC altered the abnormal of glycerophospholipid metabolism, glycolysis and gluconeogenesis.
Our findings demonstrated that HC treatment effectively inhibited airway inflammation and mucus hypersecretion in OVA-induced asthma. Integrative analysis of transcriptomic and metabolomic data suggested that HC may alleviate asthma by modulating energy metabolism and the inflammatory response. These results provide novel insights into the therapeutic mechanism of HC in asthma, potentially contributing to future pharmacological research and clinical applications on more effective herbal-based therapies for asthma.
The datasets used and analyzed during the current study are available from the corresponding author on reasonable request.
RW and SW conceived and designed the research study and methodology. RW, XS, XD, LH, and ZL performed the research and investigation. GJ provided validation, provided help and advice on the experiments. RW, XS, and ZL performed the formal analysis, software analysis, and data curation. XD and LH drafted the original manuscript. RW, XS and SW reviewed and edited the manuscript. SW provided supervision, project administration, and funding acquisition. All authors contributed to editorial changes in the manuscript. All authors read and approved the final manuscript. All authors have participated sufficiently in the work and agreed to be accountable for all aspects of the work.
All animal experimentation procedures adhered to the guidelines and were approved by the Animal Ethics Committee of Changchun University of Chinese Medicine (protocol no.: 2020345; approval date: October 11, 2020).
Not applicable.
This research was supported by the Jilin Province Science and Technology Development Plan Project (192485YY010358427).
The authors declare no conflict of interest.
Supplementary material associated with this article can be found, in the online version, at https://doi.org/10.31083/IJP44196.
References
Publisher’s Note: IMR Press stays neutral with regard to jurisdictional claims in published maps and institutional affiliations.