


1 Department of Cardiology, Aoyang Hospital Affiliated to Jiangsu University, 215600 Zhangjiagang, Jiangsu, China
†These authors contributed equally.
Abstract
Pulmonary congestion is a key manifestation of decompensated heart failure (HF) and contributes to adverse outcomes, especially in patients with permanent atrial fibrillation (AF). However, practical tools enabling bedside, repeatable, and real-time assessment of pulmonary congestion remain limited. To create and internally validate a non-invasive predictive model for pulmonary congestion in patients with HF and permanent AF utilizing hemodynamic, echocardiographic, and clinical parameters.
This retrospective study included 66 patients with HF and permanent AF, classified into pulmonary congestion and non-congestion groups based on standardized chest radiography criteria. Cardiography (ICG) parameters, echocardiographic indices, and laboratory markers were evaluated. A multivariable logistic regression model was developed using a backward elimination approach guided by the Akaike Information Criterion (AIC). Model performance was evaluated using the area under the curve (AUC), calibration, and decision curve analysis, with internal validation conducted through bootstrap resampling. Model interpretability was further assessed by comparing AUCs of individual predictors and examining risk stratification based on model-derived scores.
The final model identified independent associations of pulmonary congestion with left ventricular ejection fraction (LVEF) (OR = 0.934, 95% CI = 0.879–0.992), E/e′ ratio (OR = 1.229, 95% CI = 1.029–1.467), and thoracic fluid conductivity (TFC) (OR = 1.237, 95% CI = 1.070–1.431). The model showed strong discriminative ability (AUC = 0.865, 95% CI = 0.773–0.956), satisfactory calibration (Hosmer-Lemeshow test, p > 0.05), and clinical utility. Internal validation using 500 bootstrap resamples confirmed these results, with robust discrimination (corrected AUC = 0.853, 95% CI = 0.763–0.942), consistent calibration, and maintained net clinical benefit. Model interpretability analysis confirmed its added discriminative value over individual predictors and supported its utility in stratifying pulmonary congestion risk.
The proposed model provides a practical, non-invasive approach for identifying pulmonary congestion in patients with HF and AF. It may facilitate early bedside detection and support dynamic clinical decision-making.
Keywords
- thoracic fluid conductivity
- left ventricular ejection fraction
- E/e′ ratio
- pulmonary congestion
- heart failure
- permanent atrial fibrillation
Atrial fibrillation (AF) and heart failure (HF) are two cardiovascular disorders that commonly coexist, and this overlap contributes to worse outcomes and a rising global healthcare burden.
Their bidirectional pathophysiological relationship leads to hemodynamic deterioration, which contributes to elevated hospital readmission rates and increased all-cause mortality among affected patients [1, 2]. Mechanistically, chronic HF induces neurohormonal activation, oxidative stress, and inflammation, which facilitate atrial remodeling and the onset of AF. Conversely, persistent AF reduces ventricular filling due to the loss of atrial systole, leading to progressive deterioration of left ventricular function. This cascade more readily contributes to elevated left atrial pressure, myocardial degeneration, and increased pulmonary capillary wedge pressure, ultimately culminating in interstitial and alveolar fluid accumulation characteristic of pulmonary congestion [3].
Pulmonary congestion serves as both a hallmark of HF exacerbation and a standalone indicator of poor prognosis. Early detection and timely intervention are crucial for reducing hospitalization rates and improving long-term prognosis in HF patients [4]. However, clinical signs and symptoms such as dyspnea, rales, and jugular venous distension are notoriously nonspecific and prone to observer variability.
Chest X-ray remains a standard imaging approach used in the evaluation of pulmonary congestion; however, its limitations, such as radiation exposure and poor suitability for bedside use, reduce its value in continuous or point-of-care monitoring [5, 6].
In parallel, transthoracic impedance cardiography (ICG) has gained interest as a non-invasive and operator-independent modality for real-time assessment of thoracic fluid content and cardiac hemodynamics. By detecting fluctuations in impedance associated with changes in blood volume and flow, ICG can directly estimate parameters reflecting cardiac function and volume status [7, 8, 9, 10]. Despite its technical advantages and bedside accessibility, the diagnostic performance of ICG in detecting pulmonary congestion remains inadequately studied, particularly in patients with HF and permanent AF.
Therefore, the study aimed to assess the diagnostic effectiveness of non-invasive markers, such as ICG-derived parameters, echocardiographic indices, and standard clinical measures, in detecting pulmonary congestion in HF patients exhibiting permanent AF. By developing and internally validating a multivariable predictive model, we aimed to provide a simple, practical tool for individualized, bedside assessment of pulmonary congestion in this high-risk population.
This diagnostic modeling study was conducted retrospectively at a single cardiology center in Aoyang Hospital. The study focused on creating and internally validating a multivariable prediction model for pulmonary congestion in patients with HF and permanent AF, using non-invasive hemodynamic, echocardiographic, and clinical parameters.
Patients hospitalized from January 2021 to December 2022 were assessed using predefined eligibility criteria (Table 1). All included patients met the diagnostic criteria for HF and permanent AF based on the European Society of Cardiology (ESC) guidelines [11, 12]. Baseline clinical, echocardiographic, and impedance cardiography data were collected.
| Inclusion criteria | ||
| Age | ||
| HF defined as: | ||
| -Cardinal symptoms (breathlessness, ankle swelling, fatigue at rest or during exercise) | ||
| -Accompanied signs (elevated jugular venous pressure, pulmonary crackles, peripheral edema) | ||
| -Underlying causes (structural and/or functional abnormalities in the heart) | ||
| -Physiological effects (elevated intracardiac pressures and/or insufficient cardiac output) | ||
| Permanent AF defined as: | ||
| -ECG documentation (standard 12-lead recording or single-lead tracing of | ||
| -no discernible repeating P waves | ||
| -irregular R-R intervals (in the absence of impaired atrioventricular conduction) | ||
| -no plans for further attempts to restore or maintain sinus rhythm | ||
| Exclusion criteria | ||
| Weight-related condition (weight less than 40 kg or more than 100 kg) | ||
| Mental disorder (mental and psychological abnormalities unable to cooperate) | ||
| Cardiovascular system-related conditions (pacemaker installation, second-degree type II or third-degree AVB, ACS, HOCM, arteritis, aortic aneurysm, severe PAD, severe valvular stenosis or insufficiency, CHD, severe pulmonary hypertension, acute pulmonary embolism, constrictive pericarditis, massive pericardial effusion, shock status) | ||
| Other system-related conditions (chest wall skin ulceration, acute infectious or autoimmune disease, hyperthyroidism, malignant tumor, severe anemia, cachexia, dialysis status) | ||
Abbreviation: HF, heart failure; AF, atrial fibrillation; AVB, atrioventricular block; HOCM, hypertrophic obstructive cardiomyopathy; ACS, acute coronary syndrome; PAD, peripheral artery disease; CHD, congenital heart disease; ECG, electrocardiography.
Pulmonary congestion, as the study outcome, was defined based on admission chest X-ray findings, interpreted by a board-certified radiologist, and reviewed by two experienced cardiologists from the heart failure center, both of whom were blinded to the clinical data. Radiographic criteria included dilated pulmonary veins, interstitial or alveolar edema patterns (e.g., Kerley B lines, peribronchial cuffing), bilateral hilar blurring, and increased pulmonary vascular markings. Patients were then categorized into a pulmonary congestion group or a non-pulmonary congestion group accordingly (Fig. 1).
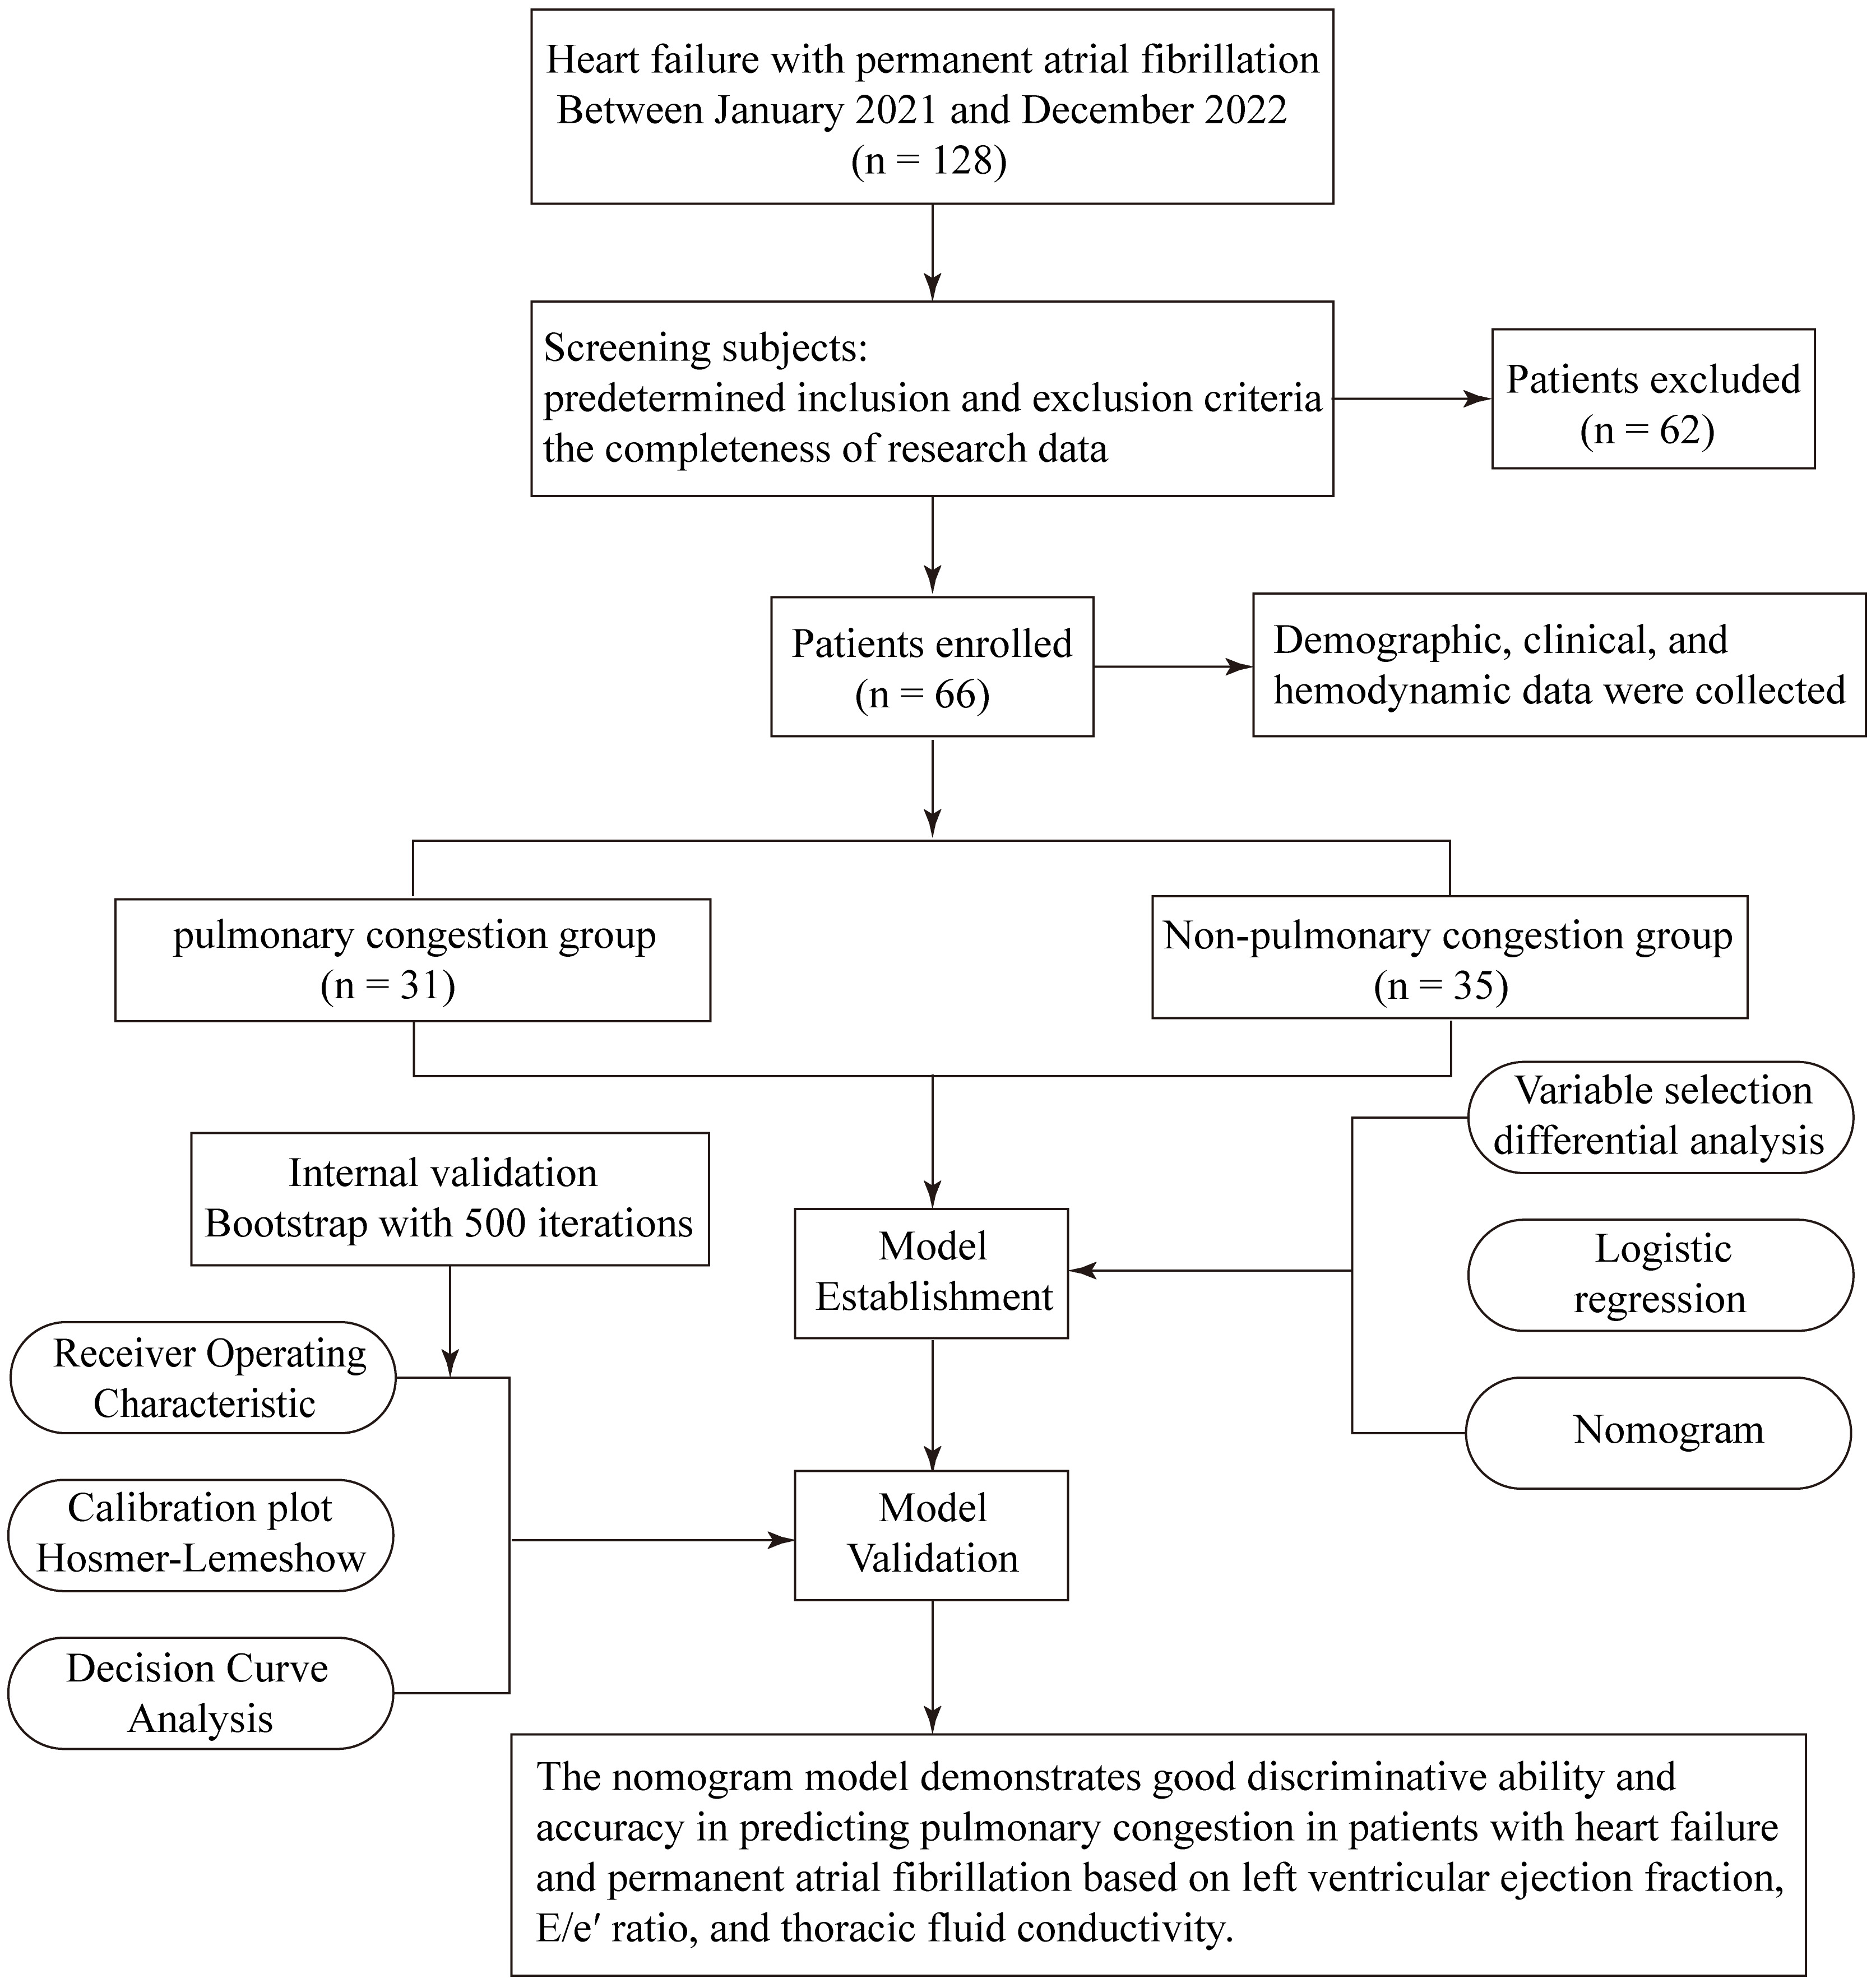 Fig. 1.
Study design and procedures.
Ethical approval was secured by Aoyang Hospital ((2024) Ethics Approval No. 003). Consent was waived due to retrospective data.
Candidate predictors were selected from three main domains: demographic and clinical characteristics, laboratory measurements, and non-invasive cardiovascular assessments, including transthoracic echocardiography and ICG. Data were collected within the initial 24 hours of admission from the institutional electronic medical records. Only patients with complete datasets for all candidate variables were included in the analysis to ensure data integrity and prevent bias due to imputation.
Blood pressure and cardiac rhythm metrics were obtained from 24-hour Holter monitoring. Laboratory markers included N-terminal pro-B-type natriuretic peptide (NT-pro-BNP), high-sensitivity cardiac troponin (Hs-cTn), estimated creatinine clearance (using the Cockcroft-Gault formula), serum albumin, hemoglobin, thyroid-stimulating hormone (TSH), total cholesterol, low-density lipoprotein (LDL), and alanine aminotransferase (ALT).
Transthoracic echocardiographic parameters comprised left atrial transverse diameter (LATD), left atrial volume index (LAVI), left ventricular end-diastolic diameter (LVEDD), left ventricular ejection fraction (LVEF), E/e′ ratio, and stroke volume. Given the irregular R-R intervals in patients with AF, echocardiographic measurements were acquired under specific methodological considerations to ensure reliability. For parameters sensitive to beat-to-beat variability, such as LVEF and E/e′ ratio, data were averaged across five consecutive cardiac cycles with visually stable heart rates and image quality following current echocardiographic guidelines for AF [13]. To minimize intra-observer variability, all echocardiographic measurements were conducted by certified senior sonographers and reviewed by two blinded cardiologists from the heart failure center. LVEF was determined via the biplane Simpson method, while the E/e′ ratio was calculated from the mean of the septal and lateral e′ velocities. Transthoracic echocardiography was conducted with the Philips iE33 system and QLAB software (Philips Medical Systems, Andover, MA, USA).
Thirteen hemodynamic variables derived from impedance cardiography (ICG) were considered as candidate predictors: cardiac index (CI), stroke index (SI), chronotropy, stroke volume variation (SVV), thoracic fluid conductivity (TFC), systemic vascular resistance (SVR), stroke systemic vascular resistance index (SSVRI), ejection-phase contraction index (EPCI), left ventricular stroke work index (LSWI), inotropic state index (ISI), contractile inotropy, left ventricular ejection time (LVET), and preejection phase (PEP). These measurements were acquired using the CSM3000 Hemodynamic Monitoring System (Qianfan Medical Co., Ltd, Shenzhen, China). Definitions of each variable are listed in Table 2.
| ICG parameters | Definition |
| Cardiac index (CI) | Cardiac output per body surface area to evaluate cardiac pumping function. |
| Stroke index (SI) | Stroke volume per body surface area for quantifying pumping function of left ventricular. |
| Chronotropy | Reflecting the autonomic nerve’s ability to adjust heart rate in accordance with changes in cardiac index. |
| Stroke volume variation (SVV) | A value to evaluate the distribution of pleural fluid. |
| Thoracic fluid conductivity (TFC) | An indicator to illustrate the increase of pleural fluid. |
| Systemic vascular resistance (SVR) | The average total resistance per minute of peripheral blood vessels. |
| Stroke systemic vascular resistance index (SSVRI) | A metric for assessing aortic compliance under afterload condition. |
| Ejection-phase contraction index (EPCI) | The change in impedance with aortic blood flow over time demonstrating myocardial contractility. |
| Left ventricular stroke work index (LSWI) | The mean left ventricular work over a single cardiac cycle. |
| Inotropic state index (ISI) | The velocity rate change equivalent to the maximum rising velocity during ejection for myocardial contractility assessment. |
| Contractile inotropy | Positive correlation to estimate myocardial contractility. |
| Left ventricular ejection time (LVET) | The time from the opening of the aortic valve to the closing of the aortic valve. |
| Preejection phase (PEP) | The period between mitral valve closure and aortic valve opening involving an increase in ventricular pressure, marking the initiation of myocardial contraction. |
Abbreviation: ICG, impedance cardiography.
ICG is a non-invasive technique for continuously evaluating thoracic hemodynamics through impedance changes. These variations reflect changes in tissue conductivity caused by fluctuations in intrathoracic blood volume and flow during the cardiac cycle.
The procedure was performed in a resting supine position, under stable hemodynamic conditions, and required minimal patient cooperation. Four pairs of surface electrodes were applied: two pairs positioned on the neck and two on the chest. At each site, one pair delivered an alternating current characterized by high frequency and low amplitude, while the other pair detected impedance changes. After signal rectification, real-time thoracic impedance waveforms were generated, from which hemodynamic indices were calculated by the internal algorithms [14]. The illustrative depiction of the electrode configuration is shown in Fig. 2. In patients with AF, irregular RR intervals may affect aortic blood volume fluctuations and subsequently influence ICG measurements. To minimize this impact, we implemented strict patient screening, included only ICG data recorded during relatively stable heart rate periods, and excluded recordings with poor signal quality or significant heart rate variability. Additionally, all ICG-derived parameters were calculated as the average of 5 to 10 cardiac cycles with visually stable RR intervals to ensure measurement reliability and reproducibility in the setting of AF. These measures enhance the reliability and validity of the ICG-derived parameters in this study.
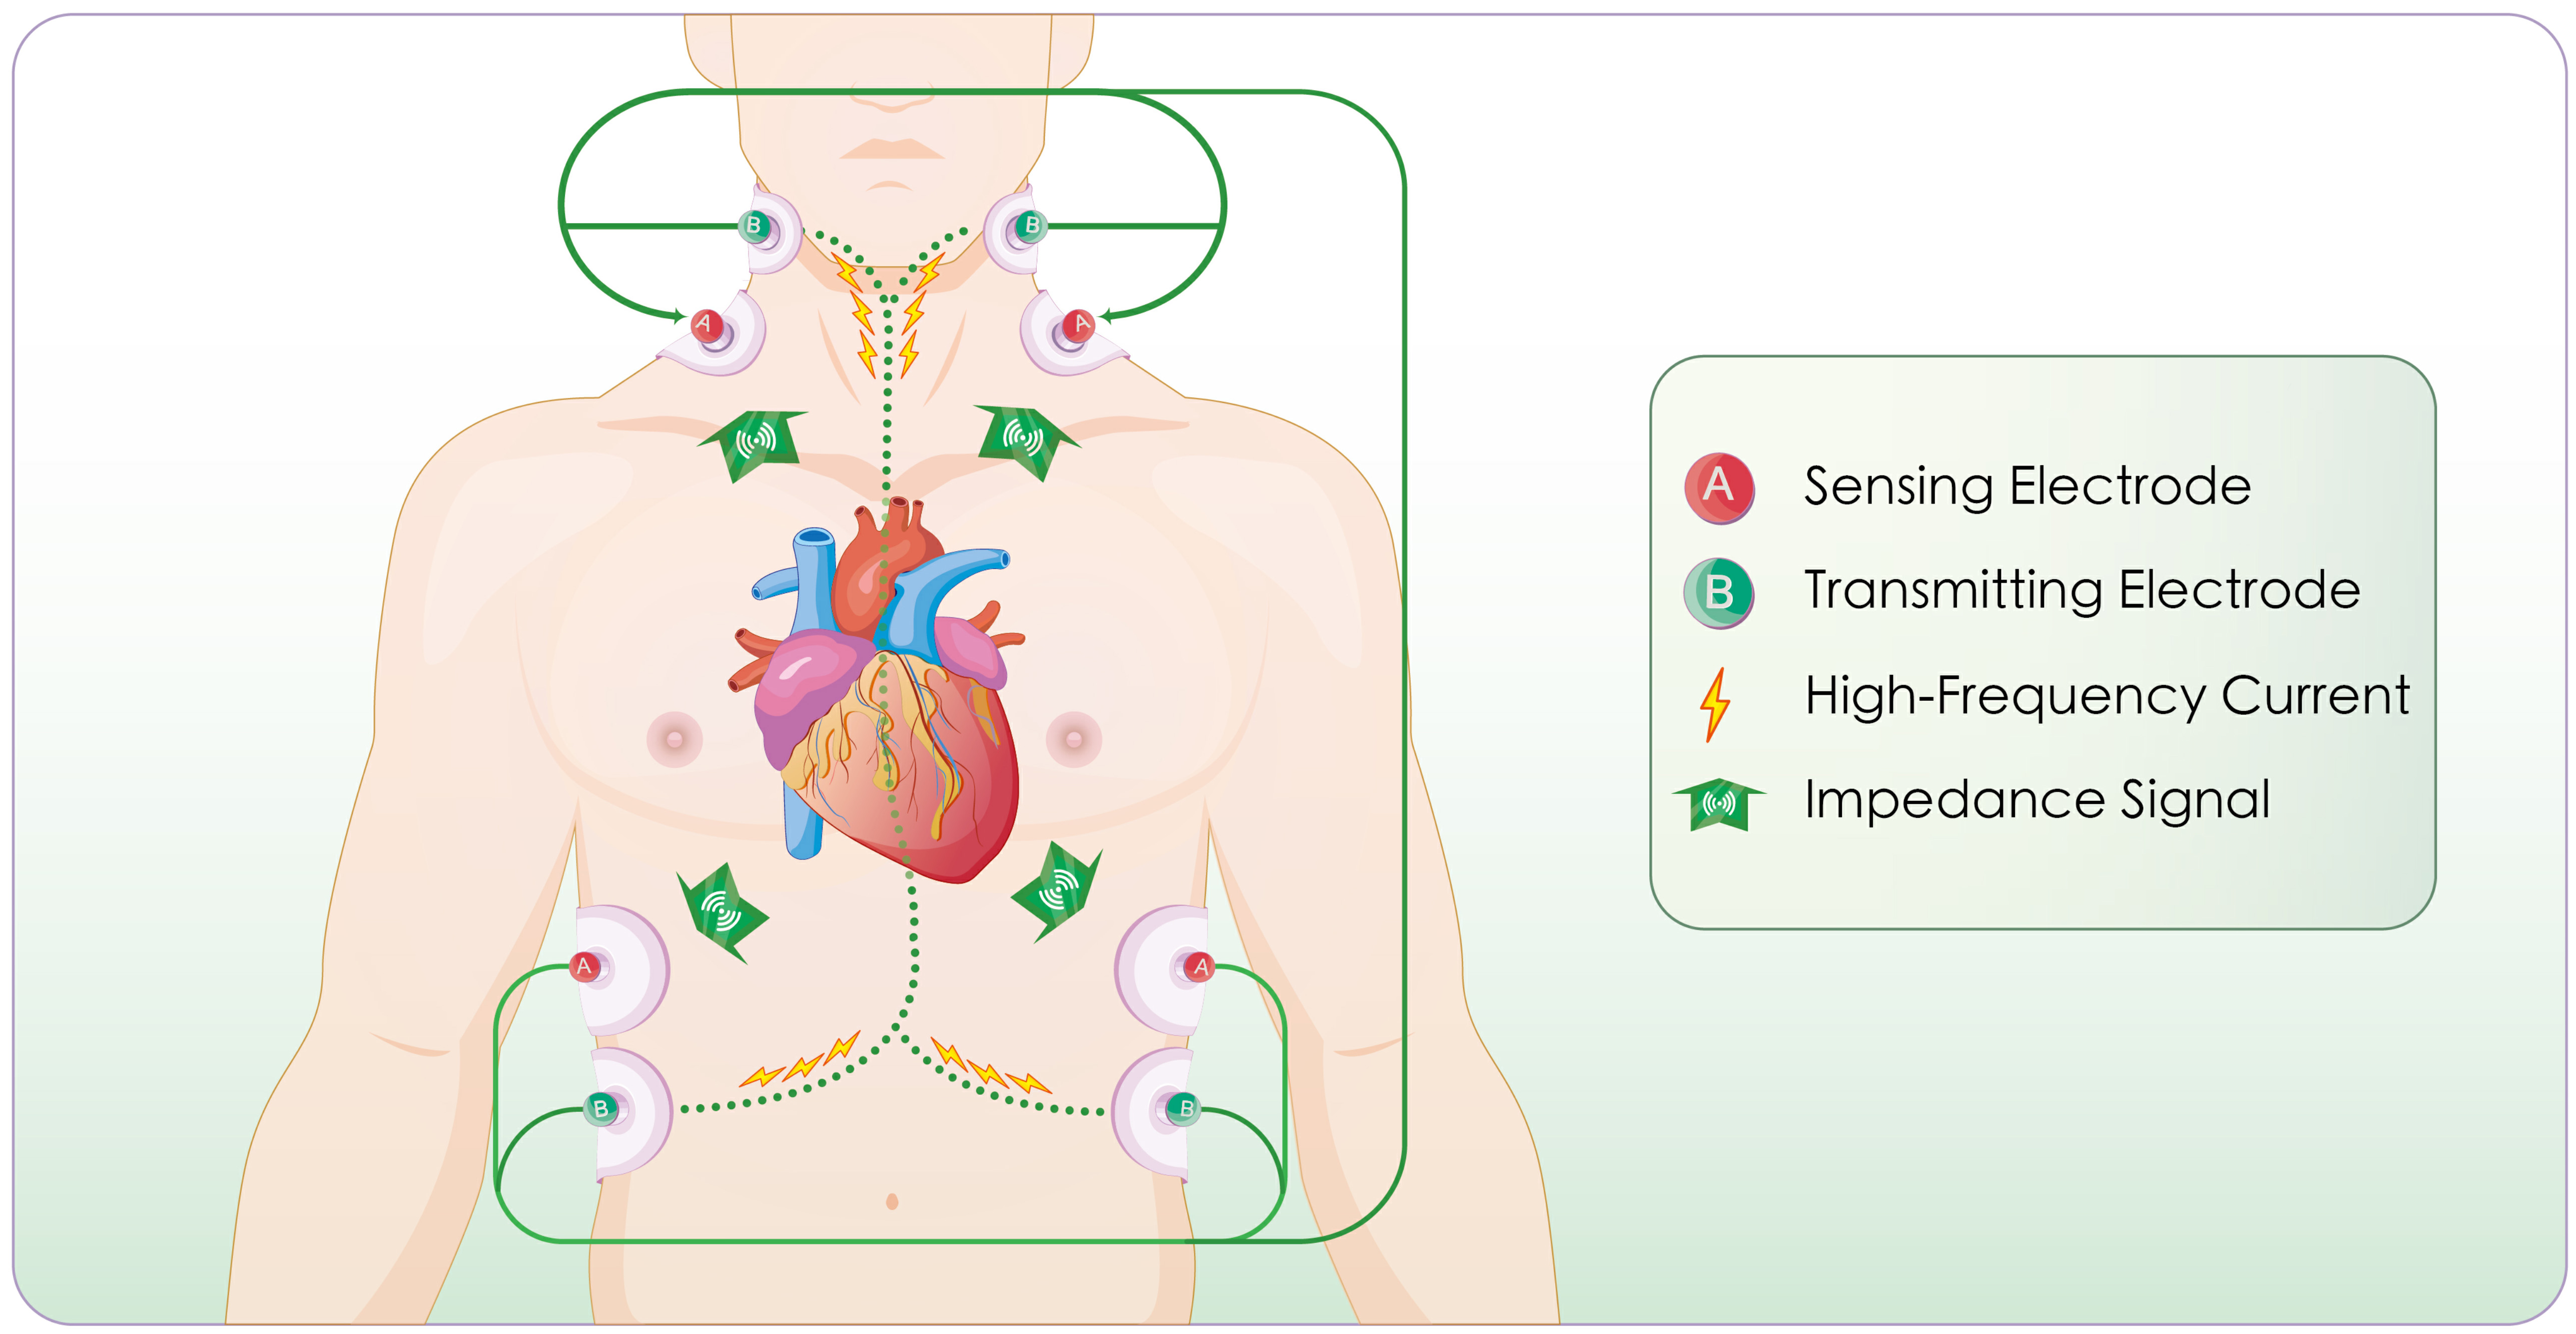 Fig. 2.
Schematic illustration of the impedance cardiography (ICG) principle and measurement workflow. Impedance is measured based on Ohm’s law. The process includes: delivery of a high-frequency low-amplitude current, selection of the aortic segment as the measurement pathway, monitoring of cardiac systole and diastole, detection of aortic blood volume fluctuations, calculation of thoracic impedance values, generation of impedance waveforms (impedance cardiogram), and derivation of hemodynamic parameters.
To construct the prediction model, candidate variables were first screened using univariate comparisons to identify differences between patients with and without pulmonary congestion.
Due to the limited sample size, the dataset was not split for cross-validation. Instead, all available cases were used for model development, and internal validation was performed using bootstrap resampling with 500 iterations to estimate the optimism of the model and assess the robustness of its predictive performance. Variables with a p-value less than 0.05 were incorporated into a multivariable logistic regression model. Backward stepwise variable selection, guided by the Akaike Information Criterion (AIC), was conducted to identify the simplest adequate model with optimal fit.
Model performance was assessed based on discrimination, calibration, and clinical utility. Discrimination was evaluated through receiver operating characteristic (ROC) curve analysis, with the area under the curve (AUC) used for quantification. Calibration was examined by the Hosmer-Lemeshow test and calibration plots that compared predicted and observed risks.
Clinical applicability was assessed with decision curve analysis (DCA), which plotted net benefit across various threshold probabilities. Additionally, a nomogram was constructed based on the final logistic regression model to facilitate individualized risk estimation in clinical practice.
To enhance interpretability and assess clinical value, we compared the model AUC with that of individual predictors. Besides, patients were divided into three equal risk categories (low, intermediate, and high) according to increasing total nomogram scores. Differences in the distribution of pulmonary congestion across these groups were then examined to assess the capacity of the model to distinguish risk levels.
Analyses were performed in IBM SPSS Statistics, version 25.0 (IBM Corp., Armonk,
NY, USA), GraphPad Prism, version 9.3 (GraphPad Software, San Diego, CA, USA), R,
version 4.4.2 (R Foundation for Statistical Computing, Vienna, Austria).
p
The Shapiro-Wilk test was employed to evaluate the normality of the continuous
variables. Data following a normal distribution were presented as mean
Univariate analysis was initially used to identify candidate predictors of
pulmonary congestion. Variables with p
The analysis included 66 patients, comprising 31 patients with pulmonary
congestion and 35 without. Groups were similar in demographics, comorbidities,
and laboratory parameters, with no significant differences detected (Table 3).
The echocardiographic evaluation showed that the pulmonary congestion group
exhibited markedly decreased LVEF (p
| Variables | All Subjects | Pulmonary congestion group | Non-pulmonary congestion group | Test statistic (t/Z/ |
p value | |
| N = 66 | N = 31 | N = 35 | ||||
| Demographics | ||||||
| Age, years | 71.97 |
73.71 |
70.43 |
–1.447 | 0.153 | |
| Male, n (%) | 34 (51.52) | 16 (51.61) | 18 (51.43) | 0.988 | ||
| BMI, Kg/m2 | 24.77 |
24.20 |
25.27 |
1.372 | 0.175 | |
| Heart rate, beat/min | 77.50 (27.00) | 77 (28.00) | 81 (27.00) | –0.411 | 0.681 | |
| SBP, mmHg | 119.39 |
120.55 |
118.37 |
–0.529 | 0.599 | |
| DBP, mmHg | 72.08 |
72.55 |
71.66 |
–0.302 | 0.763 | |
| MAP, mmHg | 85.16 |
85.77 |
84.61 |
–0.399 | 0.691 | |
| Preexisting clinical conditions | ||||||
| Smoking, n (%) | 15 (22.73) | 6 (19.35) | 9 (25.71) | 0.379 | 0.538 | |
| Alcohol, n (%) | 11 (16.67) | 5 (16.29) | 6 (17.14) | 0.012 | 0.912 | |
| Hypertension, n (%) | 44 (66.67) | 23 (74.19) | 21 (60.00) | 1.490 | 0.222 | |
| Diabetes, n (%) | 13 (19.70) | 8 (25.81) | 5 (14.29) | 1.379 | 0.240 | |
| COPD, n (%) | 9 (13.64) | 3 (9.68) | 6 (17.14) | 0.484 | ||
| Stroke History, n (%) | 4 (6.06) | 3 (9.68) | 1 (2.86) | 0.335 | ||
| CAD/MI History, n (%) | 19 (28.79) | 7 (22.58) | 12 (34.29) | 1.099 | 0.295 | |
| Blood test results | ||||||
| NT-pro BNP, pg/mL | 2137.25 (3080.50) | 3543.40 (3052.40) | 1710.60 (7010.00) | –1.757 | 0.079 | |
| Creatinine clearance, mL/min | 70.02 |
64.33 |
75.06 |
1.612 | 0.112 | |
| ALT, U/L | 18.50 (19.00) | 18 (23.00) | 19 (16.00) | –0.675 | 0.500 | |
| Total cholesterol, mmol/L | 3.91 |
3.72 |
4.07 |
1.722 | 0.090 | |
| LDL, mmol/L | 2.22 (1.05) | 2.17 (0.85) | 2.30 (1.19) | –1.240 | 0.215 | |
| TSH, mIU/L | 2.14 (1.86) | 2.27 (2.68) | 1.88 (1.54) | –1.465 | 0.143 | |
| HS-cTn, ng/L | 10.00 (14.30) | 12.00 (16.00) | 8.00 (9.00) | –1.736 | 0.083 | |
| Serum albumin, g/L | 39.40 (3.50) | 38.30 (4.50) | 40.10 (3.00) | –1.518 | 0.129 | |
| Hemoglobin, g/L | 134 (23) | 130 (17) | 137 (23) | –1.243 | 0.214 | |
| Echocardiographic findings | ||||||
| LATD, mm | 44 (6) | 45 (5) | 42 (8) | –1.405 | 0.160 | |
| LAVI, mL/m2 | 50.30 (17.90) | 52.10 (15.30) | 45.40 (14.80) | –1.959 | 0.051 | |
| LVEDD, mm | 51 (10) | 53 (8) | 49 (11) | –1.896 | 0.056 | |
| LVEF, % | 51.80 (18.80) | 43.00 (12.00) | 58.00 (11.40) | –3.615 | ||
| E/e′ ratio | 12.35 (5.60) | 14.11 (6.70) | 10.70 (4.60) | –3.013 | 0.003 | |
| Stroke volume, mL | 61 (22) | 62 (20) | 60 (27) | –0.122 | 0.903 | |
Data are expressed as mean
Abbreviations: BMI, body mass index; SBP, systolic blood pressure; DBP, diastolic blood pressure; MAP, mean arterial pressure; COPD, chronic obstructive pulmonary disease; CAD, coronary artery disease; MI, myocardial infarction; NT-proBNP, N-terminal pro-B-type natriuretic peptide; ALT, alanine aminotransferase; LDL, low-density lipoprotein; HS-cTn, high-sensitivity cardiac troponin; TSH, thyroid-stimulating hormone; LATD, left atrial transverse diameter; LAVI, left atrial volume index; LVEDD, left ventricular end-diastolic diameter; LVEF, left ventricular ejection fraction.
As shown in Table 4, among the thirteen non-invasive hemodynamic parameters derived from ICG, only TFC showed a significant between-group difference. Patients with pulmonary congestion exhibited substantially higher TFC values compared to those without congestion (p = 0.008). No meaningful group differences were detected for the remaining parameters.
| Variables | All subjects | Pulmonary congestion group | Non-pulmonary congestion group | Test statistic (Z) | p value |
| N = 66 | N = 31 | N = 35 | |||
| Cardiac index, L/min/m2 | 1.30 (0.60) | 1.20 (1.00) | 1.30 (0.50) | –0.090 | 0.928 |
| Stroke index, mL/beat/m2 | 17.50 (10.00) | 18.00 (7.00) | 17.00 (12.00) | –0.611 | 0.541 |
| Chronotropy, % | –167.50 (123.00) | –195.00 (162.00) | –162.00 (113.00) | –0.116 | 0.908 |
| TFC, 1/kΩ | 27.50 (7.30) | 30.00 (7.00) | 26.00 (5.00) | –2.654 | 0.008 |
| Stroke volume variation, % | 10.00 (15.30) | 8.60 (14.50) | 11.20 (17.50) | –0.540 | 0.589 |
| SVR, kPa·s/L | 2683.80 (1569.20) | 3018.20 (1984.40) | 2580.70 (1329.00) | –0.630 | 0.529 |
| SVRI, kPa·s/L/beat/m2 | 351.70 (216.40) | 358.20 (193.30) | 351.00 (225.80) | –0.418 | 0.676 |
| LVET, ms | 293 (29) | 295 (39) | 291 (23) | –1.035 | 0.301 |
| LSWI, g.m/beat/m2 | 17.95 (10.30) | 19.20 (8.80) | 17.20 (11.60) | –1.253 | 0.210 |
| EPCI, 1/s | 23.50 (12.30) | 24.00 (14.00) | 22.00 (10.00) | –0.946 | 0.344 |
| Inotropic state index, 1/s2 | 0.48 (0.23) | 0.50 (0.24) | 0.47 (0.24) | –0.553 | 0.580 |
| Contractile inotropy, % | –135 (109) | –129 (111) | –139 (138) | –0.687 | 0.492 |
| Preejection phase, ms | 86 (20) | 82 (16) | 89 (24) | –1.106 | 0.269 |
Data are expressed as median (interquartile range).
Abbreviations: TFC, thoracic fluid conductivity; SVR, systemic vascular resistance; SVRI, stroke systemic vascular resistance index; LVET, left ventricular ejection time; LSWI, left ventricular stroke work index; EPCI, ejection-phase contraction index.
Three variables, including LVEF (OR = 0.934, 95% CI = 0.879–0.992), TFC (OR = 1.237, 95% CI = 1.070–1.431), and E/e′ ratio (OR = 1.229, 95% CI = 1.029–1.467), were retained in the final multivariable logistic regression model after backward stepwise selection based on the AIC.
The established model achieved an AIC of 71.61 and explained a substantial
proportion of variability in pulmonary congestion (residual deviance: 63.61 vs.
null deviance: 91.25). The regression equation was as detailed below: logit(p) =
–5.413 – 0.069
Table 5 presents the statistical characteristics of the predictors included in the final model equation. No significant multicollinearity was observed among these predictors, with all variance inflation factors (VIFs) being less than 1.20, indicating good model stability (Table 5).
| Variables | Odds ratio | p value | VIF | |
| coefficient | (95% CI) | |||
| TFC | 0.213 | 1.237 (1.070–1.431) | 0.004 | 1.155 |
| LVEF | –0.069 | 0.934 (0.879–0.992) | 0.027 | 1.085 |
| E/e′ ratio | 0.206 | 1.229 (1.029–1.467) | 0.023 | 1.190 |
Abbreviations: CI, confidence interval; TFC, thoracic fluid conductivity; LVEF, left ventricular ejection fraction; VIF, variance inflation factor.
A nomogram was derived from the established model to facilitate individualized prediction of pulmonary congestion risk. The specific values of LVEF, E/e′, and TFC can be used to locate the corresponding points on the nomogram. By totaling the values for each factor, the final score maps to an estimated probability of pulmonary congestion, as illustrated in Fig. 3.
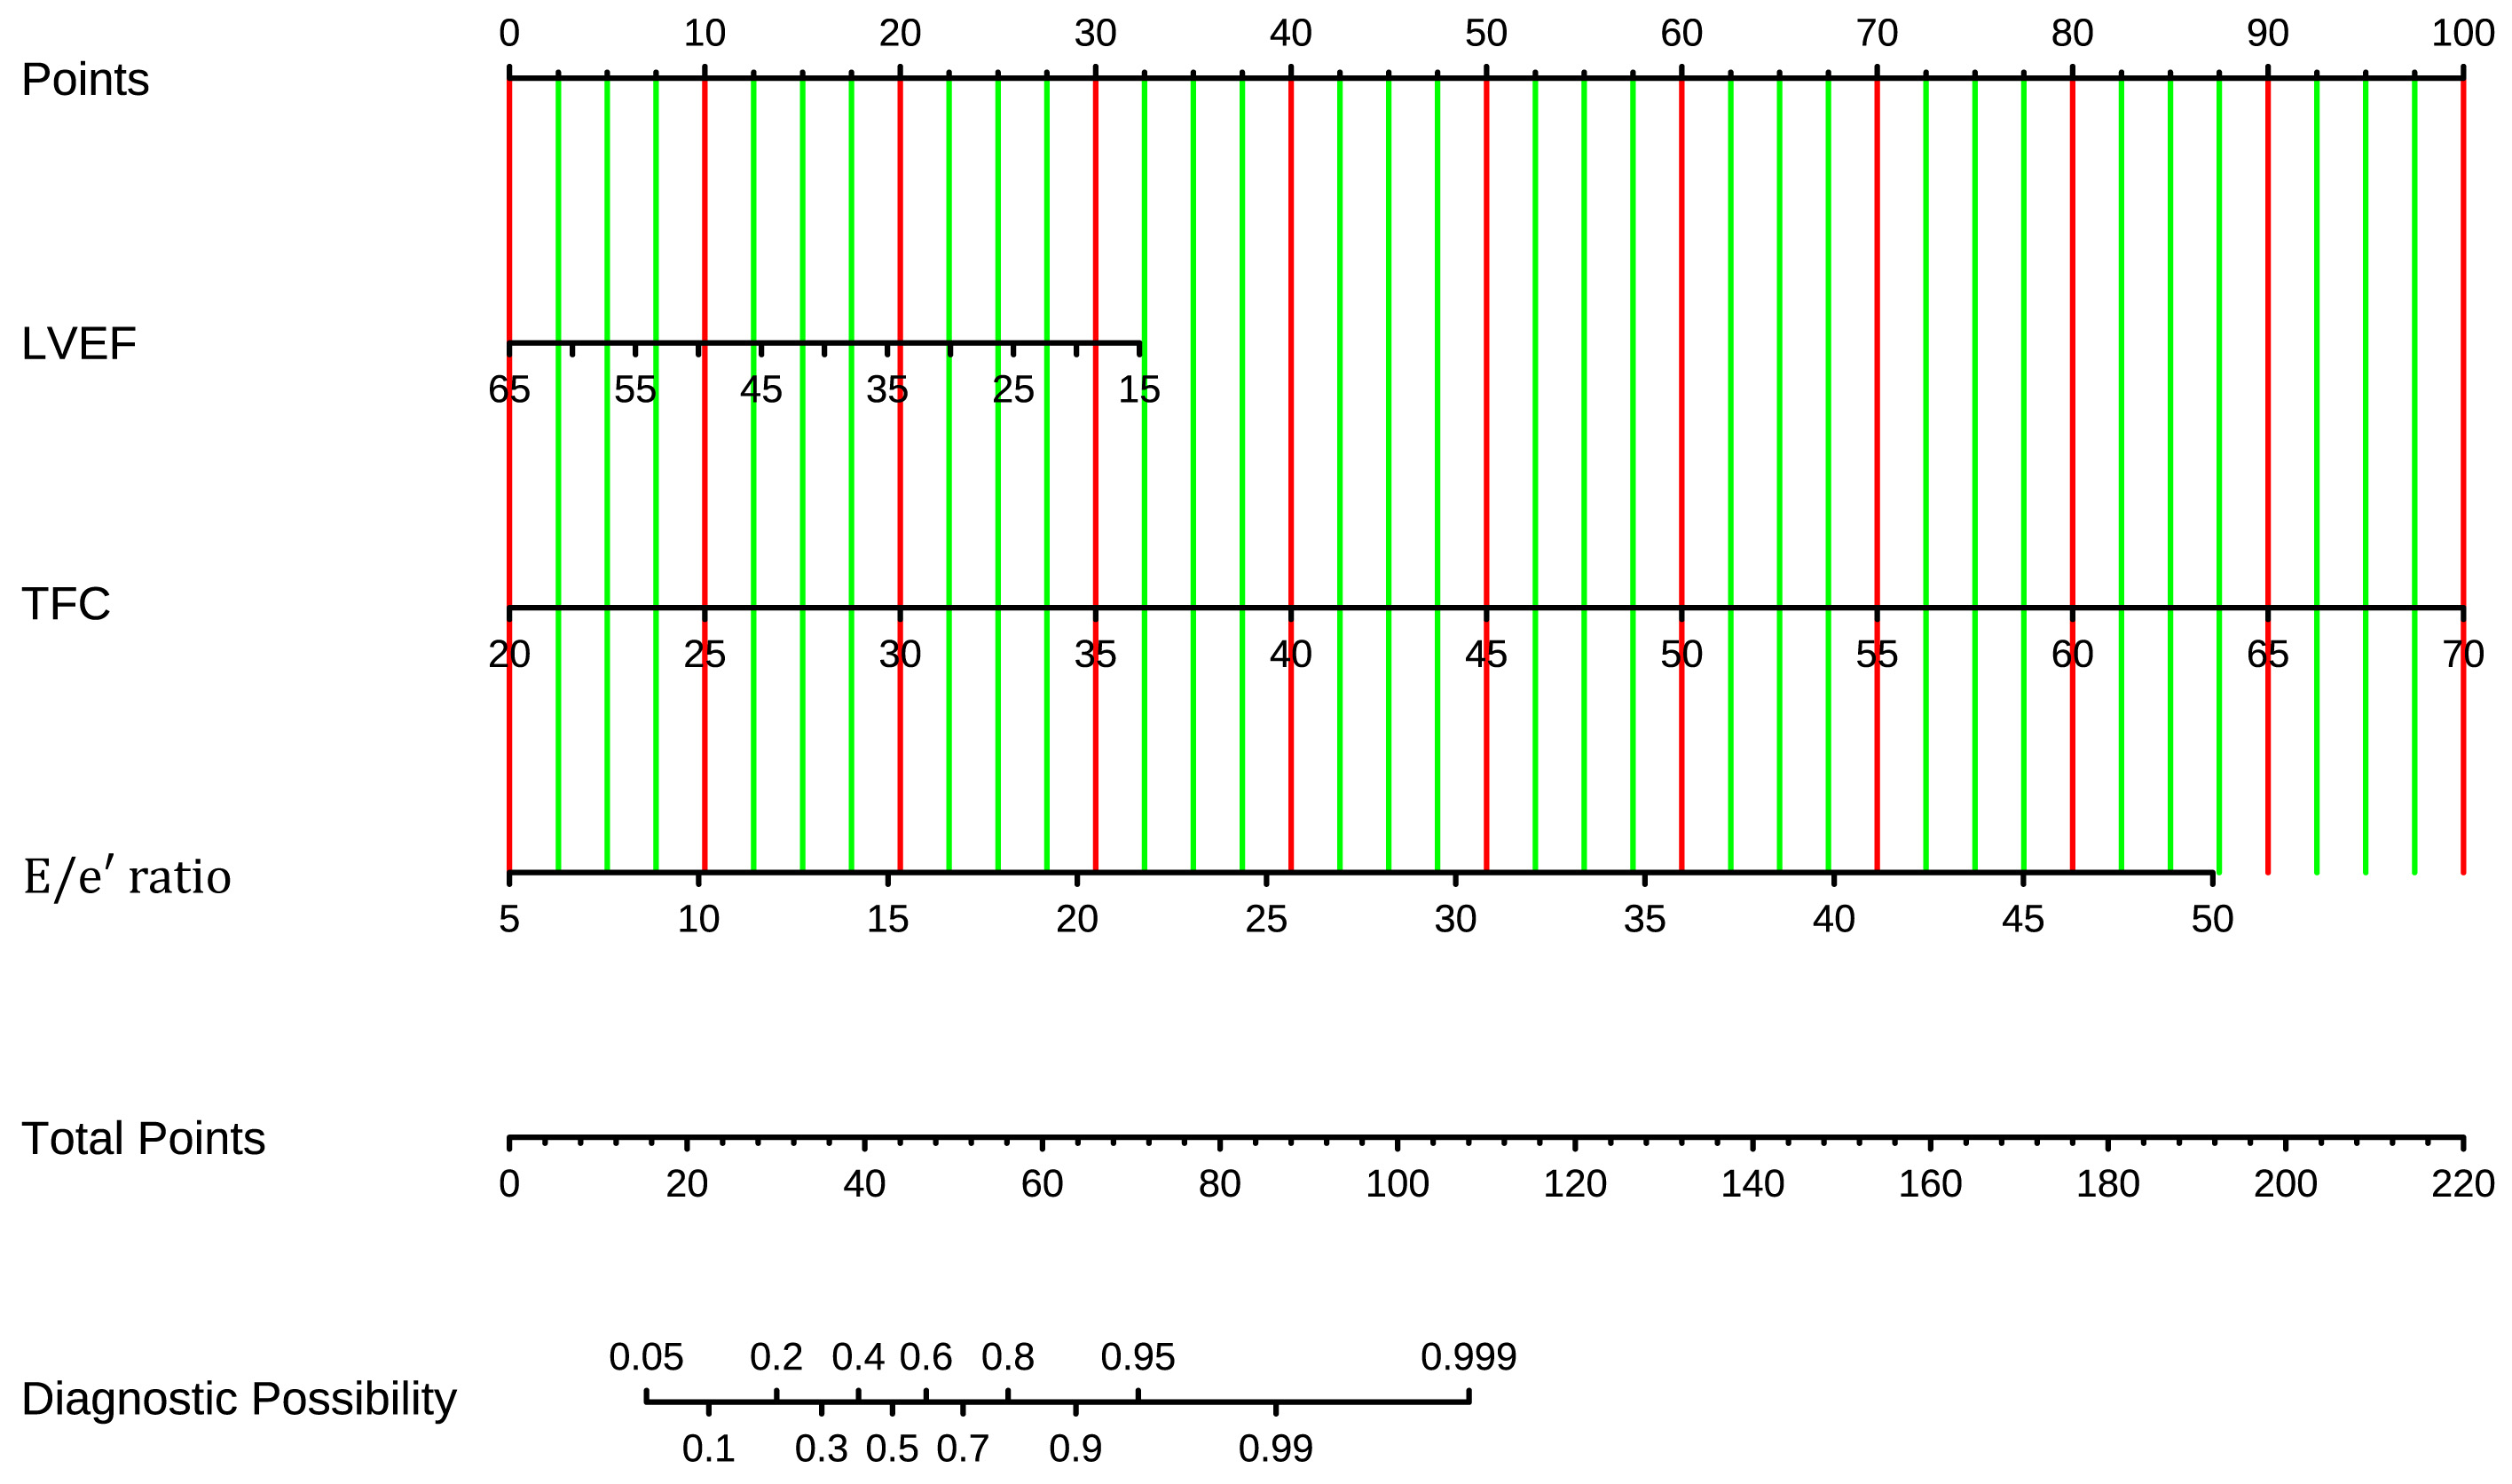 Fig. 3.
Nomogram of the prediction model for pulmonary congestion in patients with HF and permanent AF. The nomogram integrates TFC, E/e′ ratio, and LVEF. Points for each variable are summed to estimate the probability of pulmonary congestion. HF, heart failure; AF, atrial fibrillation; TFC, thoracic fluid conductivity; LVEF, left ventricular ejection fraction.
The prediction performance of the final model was appraised via multiple complementary metrics. The ROC curve analysis showed strong discriminative performance, achieving an AUC of 0.865 (95% CI = 0.773–0.956) (Fig. 4A). Bootstrap resampling (500 iterations) for internal validation produced a corrected AUC of 0.853 (95% CI = 0.763–0.942), supporting the robustness and generalizability of the model (Fig. 4B).
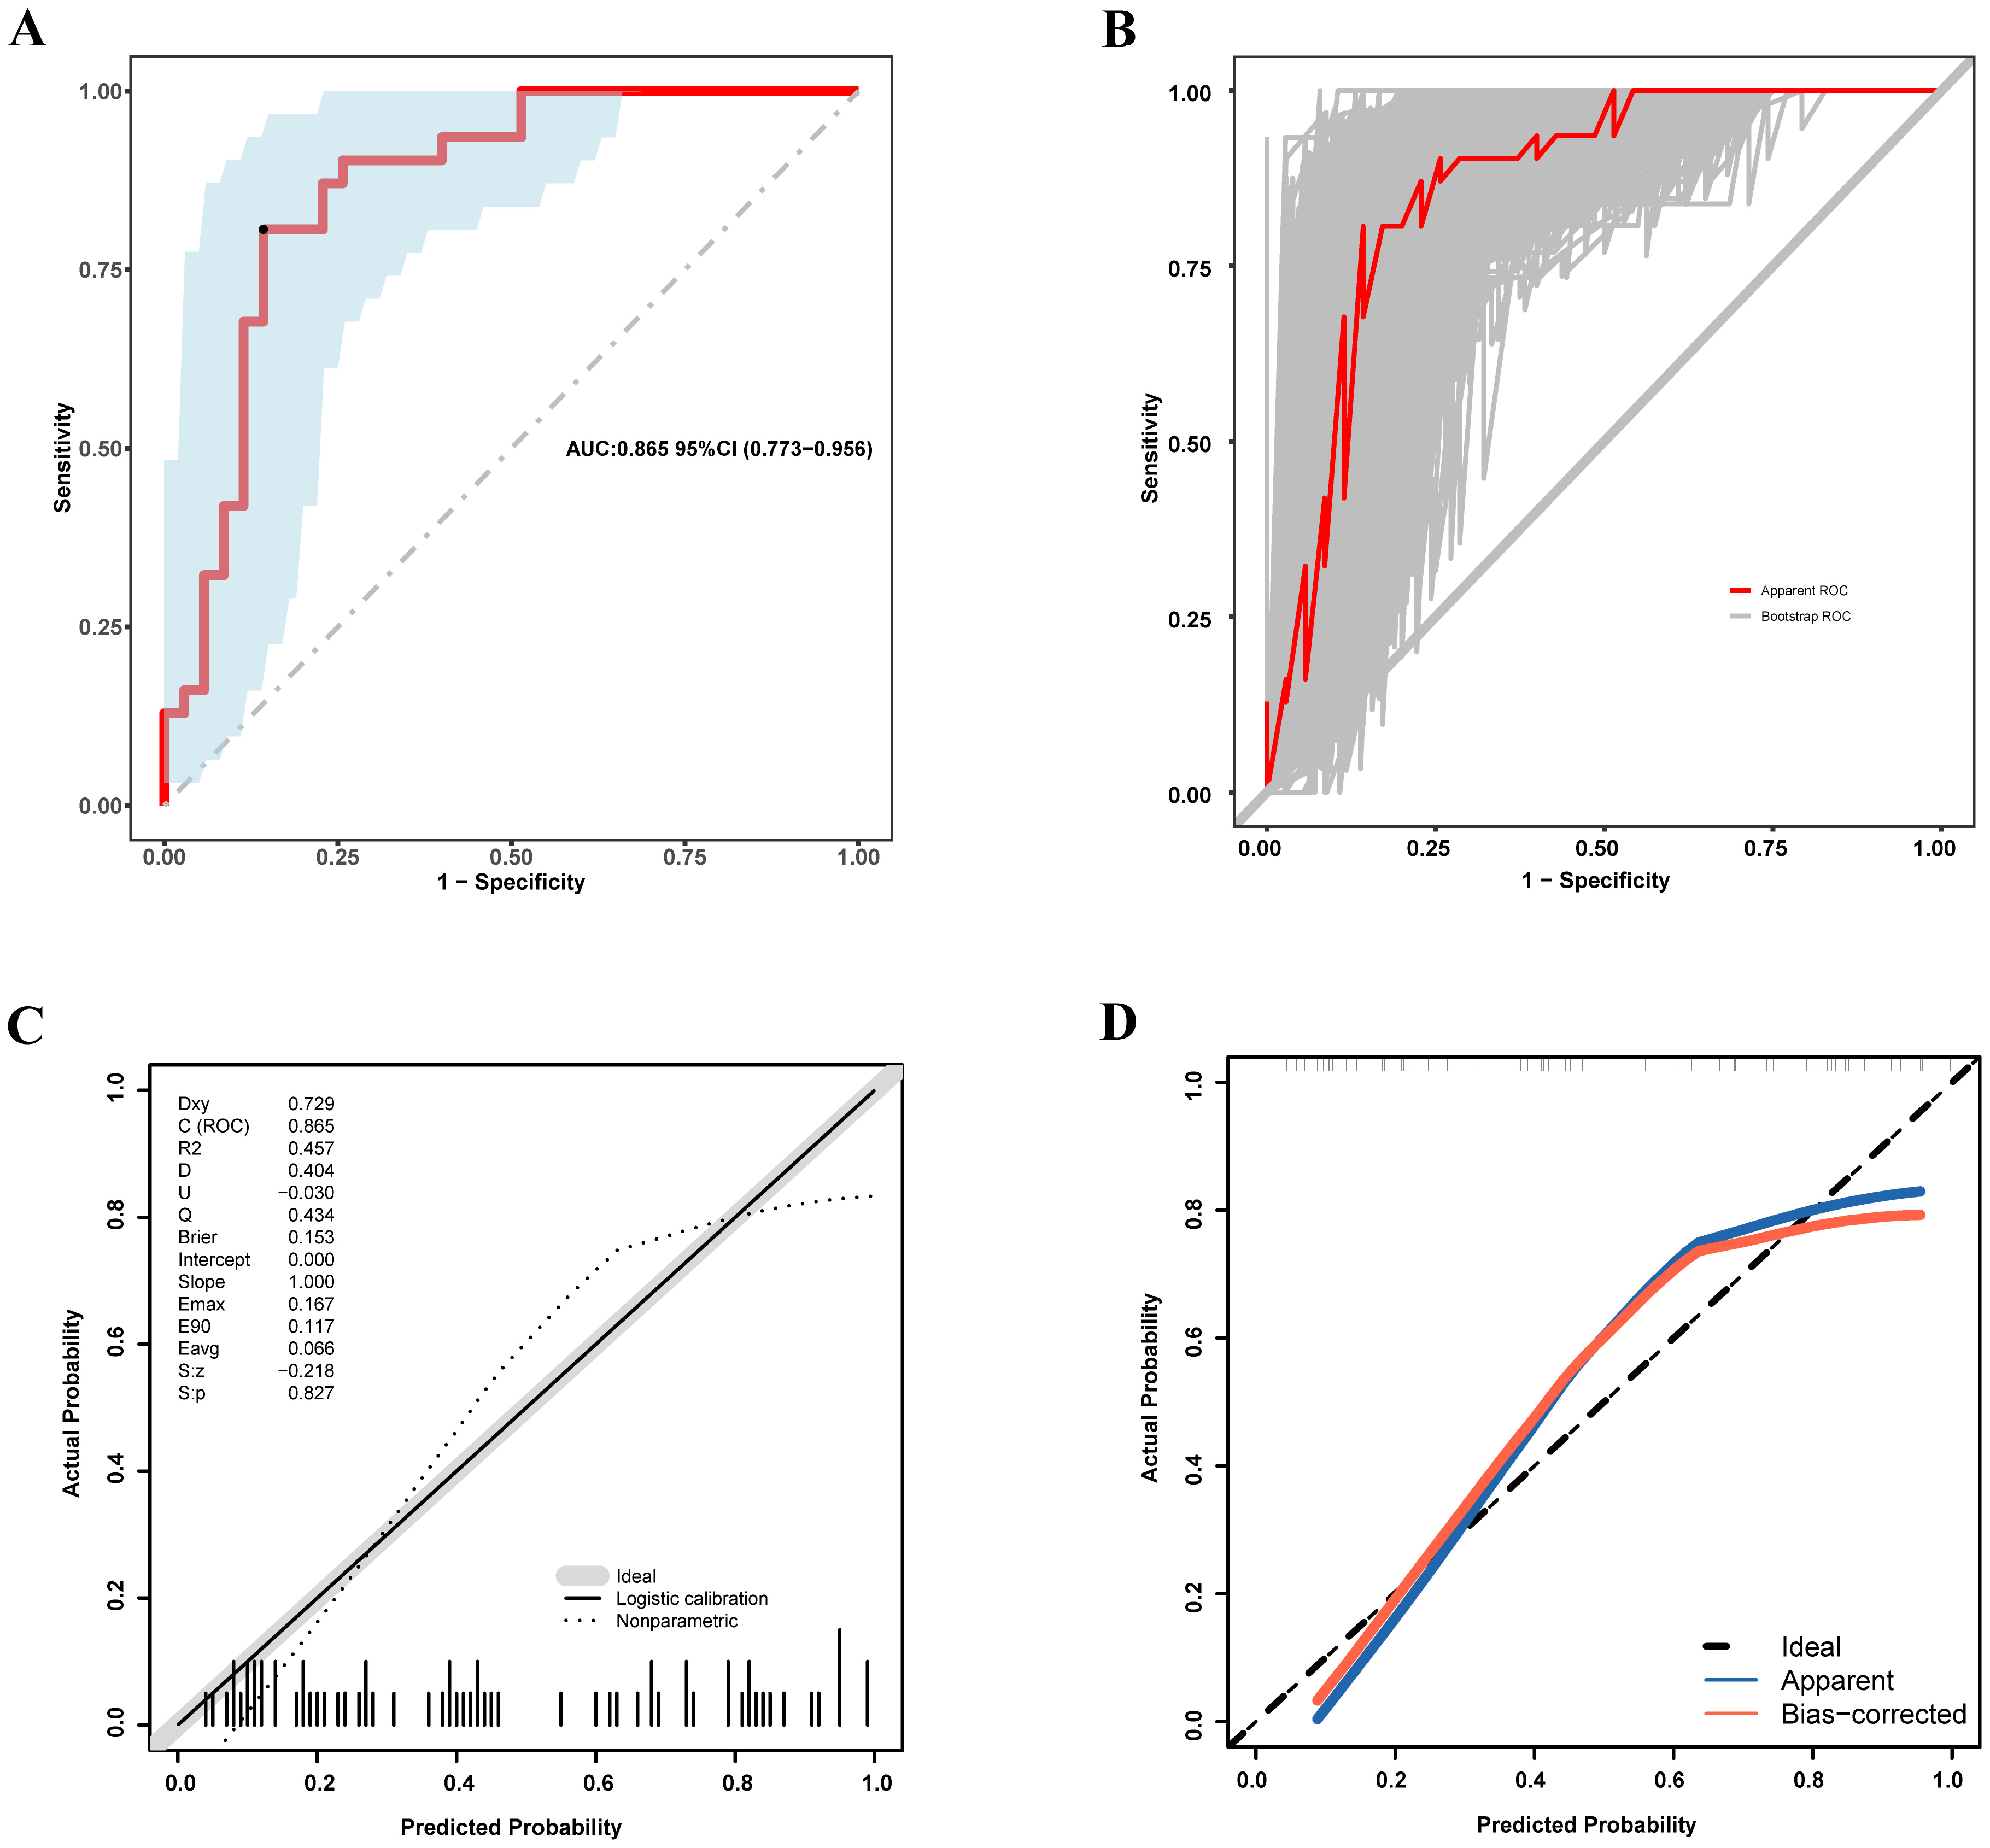 Fig. 4.
Discriminative performance and calibration of the nomogram for predicting pulmonary congestion in patients with HF and permanent AF. (A) ROC curve for the development cohort. (B) ROC curve for the internal validation cohort based on 500 bootstrap resamples. (C) Calibration plot for the development cohort. (D) Calibration plot for the internal validation cohort based on 500 bootstrap iterations. ROC, receiver operating characteristic; HF, heart failure; AF, atrial fibrillation.
Calibration was estimated via the Hosmer-Lemeshow goodness-of-fit test, which
indicated acceptable agreement between predicted and observed probabilities
(p
Clinical utility was assessed via DCA. The model demonstrated a net clinical benefit across a wide range of threshold probabilities, with maximum benefits observed between 0.04 and 0.80 in the development cohort (Fig. 5A) and between 0.06 and 0.78 in the bootstrap cohort (Fig. 5B). Notably, five-fold cross-validation was also performed during model construction, demonstrating high consistency between the original and cross-validated decision curves, further supporting the robustness of its clinical applicability (Fig. 5A). These findings collectively support the strong discriminative ability, reliable calibration, and potential clinical utility of the model in identifying pulmonary congestion risk among patients with HF and permanent AF.
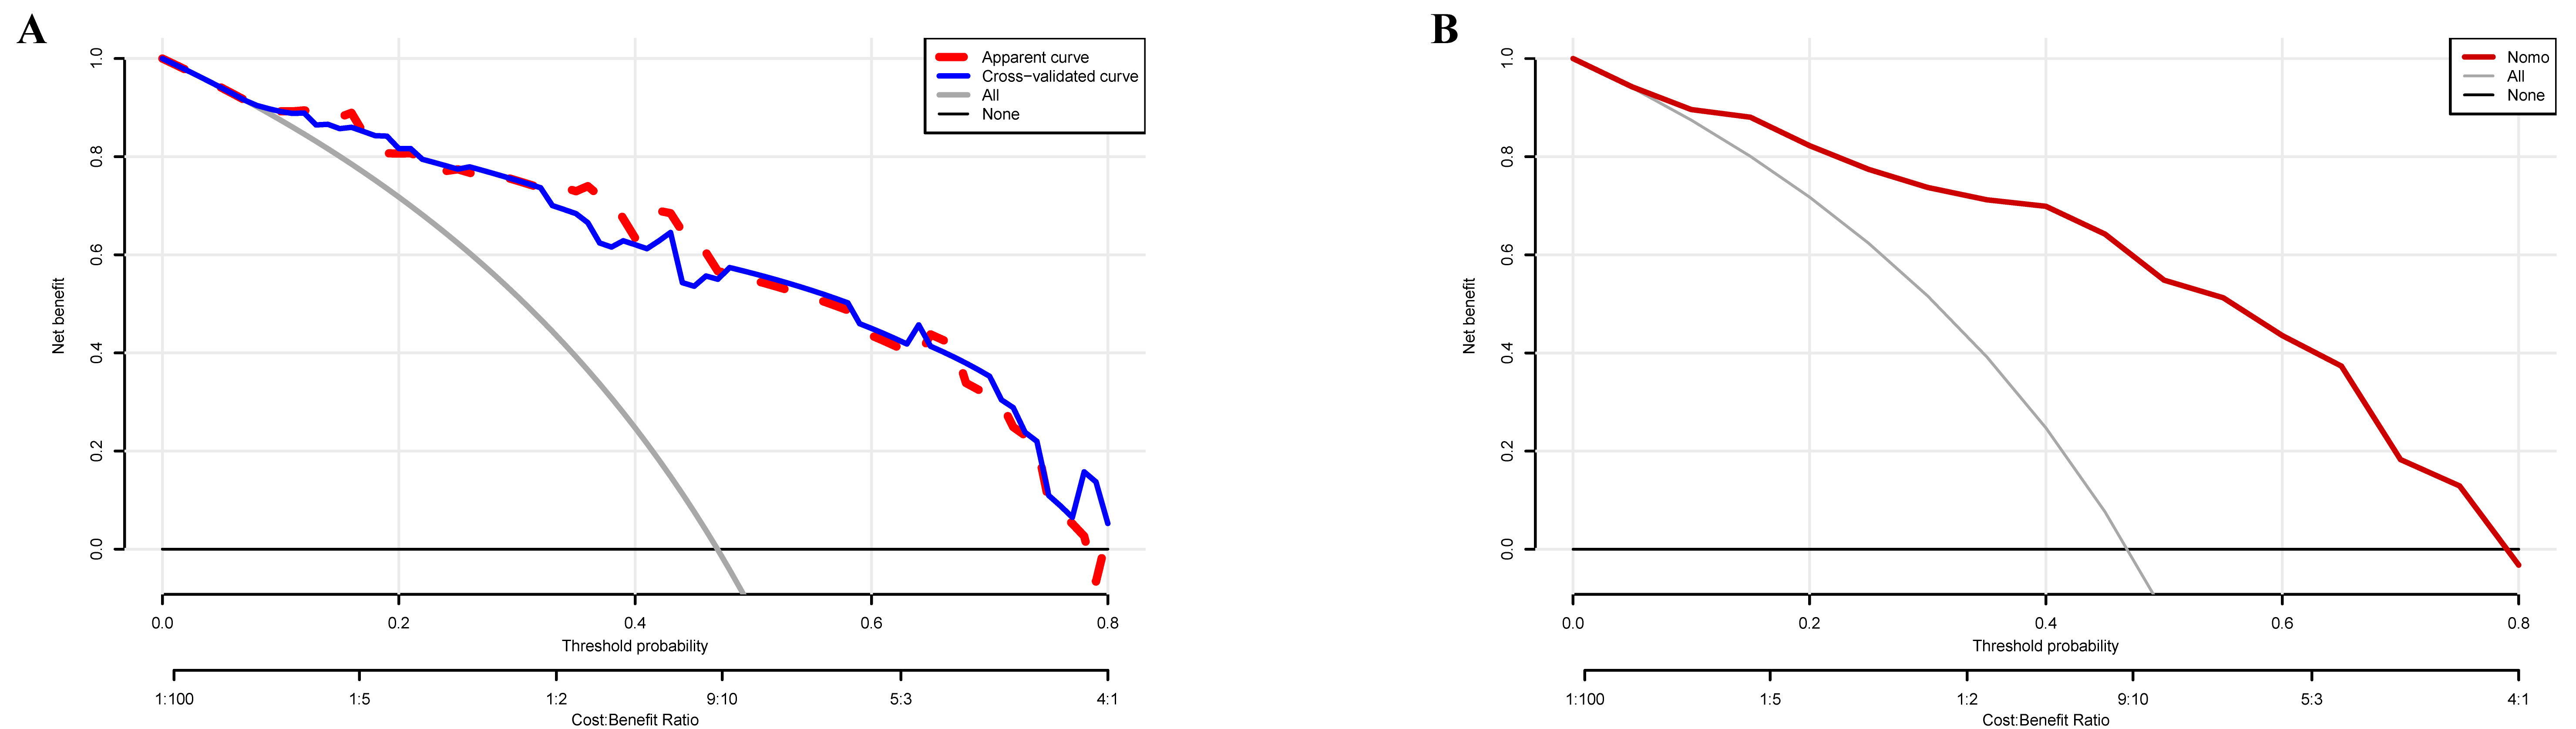 Fig. 5.
Clinical utility of the nomogram-based prediction model for pulmonary congestion. (A) Decision curve analysis (DCA) for the development cohort. The red dashed curve represents the original model; the blue solid curve corresponds to the five-fold cross-validation. (B) DCA for the internal validation cohort based on 500 bootstrap iterations.
To quantify the diagnostic enhancement offered by the tool, its discriminative
performance was compared with that of each predictor. The final model,
integrating LVEF, E/e′ ratio, and TFC, achieved an AUC of 0.865 (95% CI =
0.773–0.956). This value was notably greater than the AUCs of the individual
components: LVEF (AUC = 0.759, 95% CI = 0.638–0.880, p = 0.035),
E/e′ ratio (AUC = 0.716, 95% CI = 0.592–0.840, p = 0.012), and TFC
(AUC = 0.690, 95% CI = 0.561–0.819, p = 0.007). Fig. 6A shows no
statistically significant differences among the three predictive variables
(p
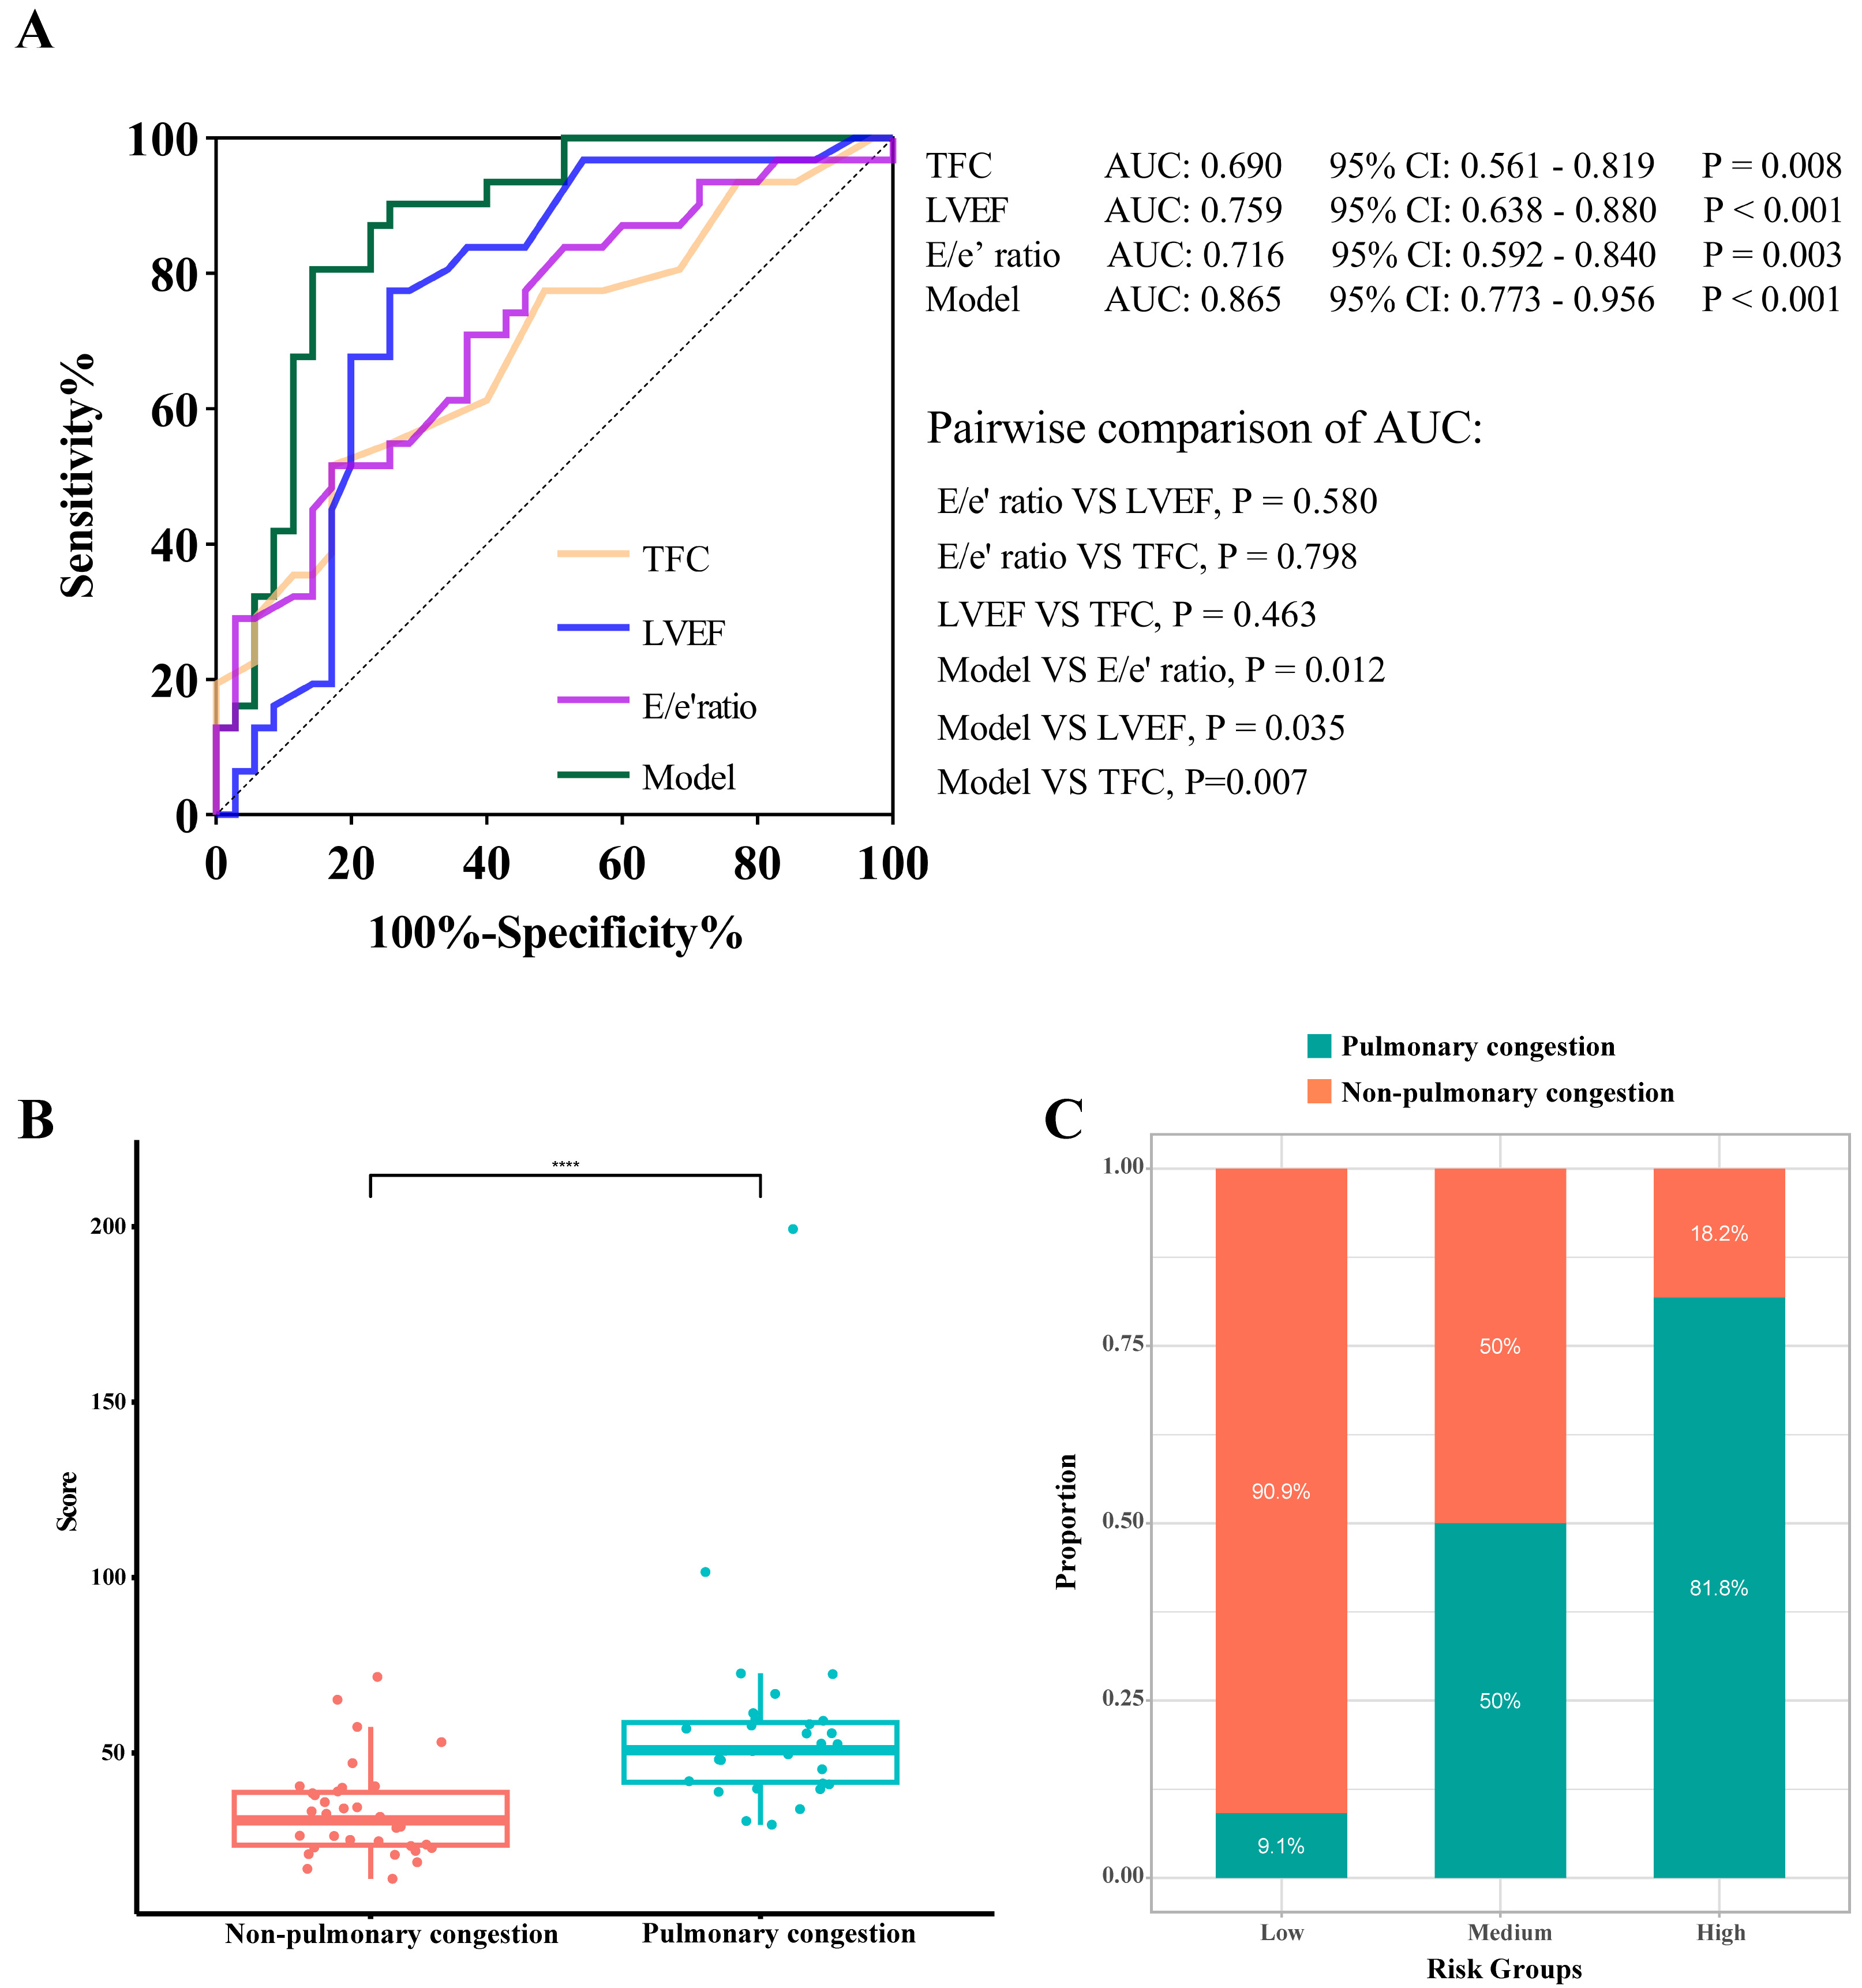 Fig. 6.
Model interpretability and risk-stratification performance of
the nomogram. (A) ROC curves comparing the complete model (TFC+ LVEF + E/e′)
with its predictors. (B) Distribution of total nomogram scores in patients with
and without pulmonary congestion. (C) Risk stratification based on the nomogram
score. ROC, Receiver operating characteristic; LVEF, left ventricular ejection
fraction; TFC, thoracic fluid conductivity. **** indicates p
To facilitate clinical interpretation, patients were stratified into three equal-sized risk groups (low, intermediate, and high) according to the total scores from the nomogram. The pulmonary congestion rates showed a consistent gradient: 9.1%, 50.0%, and 81.8% in the low-, intermediate-, and high-risk groups, respectively. This stepwise increase suggested that our model can differentiate risk levels meaningfully (Fig. 6C).
Furthermore, the total nomogram scores differed significantly between patients
classified as congested or non-congested (Fig. 6B). The median score within the
congested cohort was 50.78 (17.88), compared to 30.78 (15.55) within the
non-congested cohort (p
This retrospective study involved the development and internal validation of a multivariable prediction model for pulmonary congestion in individuals with HF and permanent AF. The final model incorporated three readily obtainable parameters, including TFC, E/e′ ratio, and LVEF, and demonstrated good discriminatory performance, acceptable calibration, and net clinical benefit across a wide range of decision thresholds. A nomogram derived from this model enables individualized risk estimation, offering a practical tool to support early bedside identification of pulmonary congestion in this high-risk population.
Catheter-based measurement of wedge pressure remains the gold standard for assessing pulmonary congestion [15, 16]. However, its invasive nature, procedural complexity, and associated risks limit its routine clinical use.
Non-invasive alternatives, including clinical symptom evaluation and natriuretic peptide levels, offer limited diagnostic accuracy. While NT-pro-BNP or BNP serve as conventional markers of cardiac dysfunction, their reliability in predicting pulmonary congestion has been questioned, particularly due to their variable correlation with pulmonary capillary wedge pressure obtained through invasive monitoring, especially in individuals with renal dysfunction or a preserved ejection fraction [17, 18, 19, 20].
Lung ultrasound (LUS) has emerged as an attractive alternative for bedside assessment of pulmonary congestion, as it visualizes B-lines that correlate with extravascular lung water. Compared to chest radiography, LUS offers bedside feasibility. Nonetheless, its diagnostic reliability can be affected by conditions like obesity, chest wall anatomy, and coexisting pulmonary disease. Moreover, LUS remains heavily operator-dependent, and the lack of standardized cut-off values, as well as inconsistencies in image acquisition, limits its widespread adoption in routine practice [21, 22]. Collectively, current diagnostic methods for pulmonary congestion each have inherent limitations. Therefore, there is a clear need to explore complementary tools that are less dependent on operator expertise, easy to perform, and suitable for repeated bedside application.
In this study, pulmonary congestion was classified based on admission chest radiography, a widely used tool for detecting pulmonary fluid overload in routine clinical practice. Radiographic features, such as vascular redistribution, interstitial edema, and hilar blurring, have been shown to correlate closely with invasive measurements of pulmonary capillary wedge pressure in decompensated heart failure [23].
Despite its widespread clinical use, chest radiography has inherent limitations in detecting pulmonary congestion, including variability in image acquisition, interobserver interpretation, limited sensitivity to dynamic changes in fluid status, and the requirement for patient cooperation to achieve optimal positioning. To minimize potential misclassification, we standardized image timing and interpretation procedures. All radiographs were obtained within 24 hours of admission, before the initiation of decongestive therapy, and were initially assessed by an experienced radiologist, with blinded adjudication by two independent cardiologists. Although chest radiography is not considered a definitive gold standard, it remains a practical and commonly used reference in real-world clinical settings. Given these considerations, we selected it as the reference standard for pulmonary congestion in this study, acknowledging its limitations but reinforcing its relevance in routine clinical decision-making.
Pulmonary congestion in heart failure primarily results from elevated left-sided filling pressures, which increase pulmonary capillary hydrostatic pressure and promote fluid transudation into the pulmonary interstitium and alveoli. In patients with AF, this cascade is further exacerbated by the loss of effective atrial contraction, resulting in impaired left ventricular filling, increased fluctuations in left atrial pressure, and a greater susceptibility to fluid overload.
The predictive model developed in this study integrates three non-invasive variables, LVEF, E/e′ ratio, and TFC, each of which corresponds to a distinct phase of the pulmonary congestion pathway. The E/e′ ratio serves as an indirect measure of left-sided preload and has been reported to correlate with pulmonary capillary wedge pressure [24, 25, 26]. It reflects the early hemodynamic burden associated with reduced ventricular compliance and increased preload, features particularly relevant in AF, where diastolic dysfunction is frequently observed. LVEF, as a marker of global systolic performance, contributes mechanistically to backward failure and elevated left atrial pressures when reduced. Its prognostic value in predicting pulmonary congestion has been demonstrated in large clinical cohorts [27].
TFC, measured via ICG, is a direct, non-invasive index of total thoracic fluid volume. ICG operates by transmitting a high-frequency, low-amplitude alternating current through the thorax using surface electrodes. As fluid conducts electricity more readily than air or tissue, changes in thoracic impedance are inversely proportional to the amount of intrathoracic fluid. A lower impedance reflects greater fluid accumulation, which is quantified as higher TFC values.
TFC specifically reflects the cumulative fluid content within the thoracic cavity, including both intravascular and extravascular compartments. It acts as a downstream marker of volume overload, detecting subclinical pulmonary congestion without obvious respiratory symptoms or radiographic alterations. Previous research has shown its association with pulmonary capillary wedge pressure and its capacity to dynamically monitor fluid status changes in HF patients [28, 29, 30].
In patients with AF, where beat-to-beat variability can complicate the interpretation of pressure- or flow-based indices, TFC offers an advantage due to its relative insensitivity to rhythm irregularity. Rather than relying on single-cycle measurements, ICG-derived TFC averages impedance changes over multiple cardiac cycles, thereby providing a more stable and reproducible signal even in the presence of RR interval variability. This makes TFC particularly suitable for evaluating pulmonary congestion in AF populations. Overall, TFC complements upstream pressure markers, such as E/e′, and structural indices, like LVEF, by providing a real-time estimate of thoracic fluid accumulation, thereby completing the pathophysiological profile from hemodynamic stress to end-organ congestion.
Cumulatively, these three parameters provide a physiologically coherent framework for assessing pulmonary congestion. By combining upstream (E/e′), central (LVEF), and downstream (TFC) markers, the model captures the continuum from hemodynamic stress to overt pulmonary fluid overload, thereby enhancing diagnostic precision in this complex patient population.
The predictive model developed in this study provides a practical and non-invasive approach for assessing pulmonary congestion in patients with HF and permanent AF. By combining LVEF, E/e′ ratio, and TFC, it integrates structural, functional, and hemodynamic insights into a single tool, facilitating more accurate and individualized evaluation of congestion.
All three variables are easily accessible using bedside technologies. With the increasing availability of portable echocardiography, both LVEF and E/e′ can be rapidly obtained at the point of care. Importantly, these two parameters require relatively simple acquisition protocols and are less dependent on operator expertise compared to comprehensive echocardiographic assessments. Similarly, ICG offers real-time thoracic fluid monitoring, eliminating operator variability and the need for invasive procedures. These features render the model particularly suitable for routine use in general wards, emergency settings, or outpatient clinics.
In terms of diagnostic performance, the model demonstrated excellent discrimination and calibration, with internal validation via bootstrap resampling confirming its robustness. Decision curve analysis further indicated a favorable net clinical benefit across a broad range of decision thresholds. Moreover, the derived nomogram provides a visually intuitive tool to support individualized bedside decision-making. Additionally, model interpretability analysis supported its added value and practical utility in risk stratification, showing a stepwise increase in congestion rates across risk groups.
This model complements existing methods by providing a rapid, repeatable, and less operator-dependent approach to assessing pulmonary congestion, particularly in HF patients with permanent AF. Its simplicity, non-invasiveness, and real-time feedback make it a promising adjunct for ongoing congestion surveillance, especially where continuous fluid status monitoring is essential.
This study is subject to several limitations. First, pulmonary congestion was defined based on chest radiography rather than invasive measurement of pulmonary capillary wedge pressure, which may introduce classification bias despite standardized imaging and blinded interpretation protocols. Second, this single-center study with a modest sample size and no external validation may restrict the generalizability of the results. Third, the study did not include a direct head-to-head comparison with techniques such as LUS, which may restrict conclusions regarding relative diagnostic performance. Additionally, due to the inherent limitations of observational design, causal inference cannot be established. Finally, the strict exclusion criteria improved internal reliability but limited generalizability; broader studies are needed to confirm applicability in various clinical settings and diverse HF subgroups.
We established and internally validated a simple, non-invasive model incorporating LVEF, E/e′ ratio, and TFC to predict pulmonary congestion in patients with HF and permanent AF. The model showed good diagnostic performance and bedside applicability. It may serve as a practical tool to support real-time and continuous identification and monitoring of pulmonary congestion, although further validation is needed in broader clinical settings.
HF, Heart failure; AF, Atrial fibrillation; ICG, Impedance cardiography; LVEF, Left ventricular ejection fraction; TFC, Thoracic fluid conductivity; AUC, Area under the curve; NT-pro BNP, N-terminal pro-B-type natriuretic peptide; HS-cTn, High-sensitivity cardiac troponin; TSH, Thyroid-stimulating hormone; LDL, Low-density lipoprotein; ALT, Alanine aminotransferase; LATD, Left atrial transverse diameter; LVEDD, Left ventricular end-diastolic diameter; LAVI, Left atrial volume index; LVEF, Left ventricular ejection fraction; TEG, Transthoracic echocardiography; IQRs, Interquartile ranges; BNP, B-type natriuretic peptide; LUS, Lung ultrasound; BMI, Body mass index; AMI, Myocardial infarction.
The datasets in our study are available from the corresponding author upon reasonable request.
All authors contributed to the study’s conception and design. ZQX, JJZ, ZPJ, QXZ, WGZ, and JJD performed data collection and analysis. ZQX, JJZ, and ZPJ drafted the first version of the manuscript. All authors critically revised the manuscript for important intellectual content, read and approved the final version, and agreed to be accountable for all aspects of the work.
The study was conducted in accordance with the Declaration of Helsinki and approved by the Medical Ethics Committee of Aoyang Hospital ((2024) Ethics Approval No. 003), Affiliated to Jiangsu University. Informed consent to participate in the study was waived for this retrospective study.
We are grateful to our colleagues in the Department of Cardiology at Aoyang Hospital Affiliated to Jiangsu University.
This work was supported by the Science and Technology Project of Zhangjiagang City (ZKYL2347), the Zhangjiagang City Health Youth Science and Technology Project (ZJGQNKJ202113), and Suzhou Science and Technology Development Plan (SKJYD2021006).
The authors declare no conflict of interest.
References
Publisher’s Note: IMR Press stays neutral with regard to jurisdictional claims in published maps and institutional affiliations.