


 , Anna Lena Bäuschlein 1, Markus Stiller 1, Andreas Simm 1, Gábor Szabó 1,2
1 Department of Cardiac Surgery, University Hospital Halle, University of Halle, 06120 Halle (Saale), Germany
2 Department of Cardiac Surgery, University Hospital Heidelberg, 69120 Heidelberg, Germany
Abstract
Minimally invasive cardiac surgery (MICS) offers several advantages that can be particularly beneficial for older patients. However, nothing is currently known about the impact of MICS on myocardial protection. Thus, this study aimed to compare myocardial protection in valve surgery between patients who received MICS and those who underwent conventional open cardiac surgery (OPEN).
We retrospectively included all adult patients (≥18 years) who received elective or urgent valve surgery in our department. We compared the peak value and area under the curve (AUC) of the high-sensitive troponin T (TnT) and creatine kinase muscle-brain type (CK-MB) concentrations during the first, second, and third 24 h period and the cumulative catecholamine dosages of adrenaline, noradrenaline, and enoximone at 72 h after removal of the aortic cross-clamp in patients who received valve replacement or reconstruction for MICS versus OPEN.
The peak TnT release in the first (p = 0.025) and second 24 h interval (p = 0.046), as well as the TnT AUC in the first 24 h (p = 0.024), were lower in the MICS group with reconstruction. The peak CK-MB release was relevantly lower in the first (p = 0.093) and third 24 h period (p = 0.067), as well as the CK-MB AUC between 48 and 72 h (p = 0.055). However, the peak release and AUC for TnT and CK-MB did not differ between MICS and OPEN in the replacement population. The noradrenaline dosage was lower (p = 0.023) for MICS in the replacement population. In the reconstruction population, the dosage of adrenaline (p = 0.036), noradrenaline (p = 0.043), and enoximone (p = 0.012) was lower in the MICS group than in the OPEN group.
In addition to known factors of myocardial protection, such as ischemia time and cardioplegia, MICS seems to promote improved myocardial protection during valve reconstruction, while the postoperative catecholamine requirement is reduced after valve reconstruction and replacement. These additional benefits of MICS might be especially advantageous for old and frail patients undergoing cardiac surgery.
Keywords
- minimally invasive surgery
- minimally invasive cardiac surgery
- open heart surgery
- open cardiac surgery
- aging
- frailty
- valve surgery
- myocardial protection
- cardioplegia
- Buckberg
- Calafiore
- Custodiol
- HTK
- histidine-tryptophane-ketoglutarate
- Bretschneider’s
Minimally invasive cardiac surgery (MICS) has evolved continuously and gained popularity within the last two to three decades [1]. MICS is associated with numerous advantages, such as less postoperative respiratory dysfunction, avoidance of chest instability, reduced incidence of deep sternal wound infection, and quicker mobilization of the patient compared to conventional open heart surgery (OPEN) [1]. MICS can be performed for valve surgery [2, 3, 4], coronary artery bypass grafting [5], and, to a certain extent, even when rarely performed, on the aorta [6].
The mean age of patients in cardiac surgery slowly increases [7]. Old age is often associated with a certain degree of frailty, meaning the patient is less resilient against stressors such as a major surgical intervention [8]. Considering this, MICS could become even more important in the future. Despite the mentioned benefits, myocardial protection during MICS is highly important to ensure that the heart can maintain circulation in the body after surgery. Based on the limited surgical access, MICS procedures commonly require longer aortic cross-clamping times and thus, longer periods of myocardial ischemia. Myocardial protection is therefore crucial in MICS. The literature shows that the existing studies compared different cardioplegic solutions for myocardial protection during MICS, including blood cardioplegia, Histidine-Tryptophane-Ketoglutarate (HTK), del Nido solution, and St. Thomas Hospital solution [9]. However, currently, nothing is known about the impact of the MICS procedure on myocardial protection independent of the cardioplegic solution. Thus, we compared myocardial protection in valve surgery in patients who received MICS compared to OPEN.
We retrospectively included all adult (
The type of cardioplegia was used based on the surgeon’s preference. Crystalloid HTK (Dr. Franz Köhler Chemie, Bensheim, Germany), as well as Buckberg (Dr. Franz Köhler Chemie, Bensheim, Germany), or Calafiore blood cardioplegia, was used. All types of cardioplegia were administered in antegrade fashion using a roller pump (Liva Nova S5, Munich, Germany) with a pump flow of 200–300 mL/min. For the HTK solution, the myocardium was perfused with an initial volume of 2000 mL of cardioplegia. A second dosage was given after 2–3 h of cardioplegic arrest. In the case of Calafiore blood cardioplegia, cardioplegic arrest was induced with a perfusor rate of 250 mL/h to add the KCl and MgCl2 mixture over 2 min. Additional dosages were given every 20 min with a perfusion rate of 150 mL/min over 2 min. In the case of Buckberg cardioplegia, a 4:1 mixture of oxygenated blood and crystalloid cardioplegic solution was given over 4 min. Additional dosages were given every 20 min over 2 min.
The postoperative hemodynamic stabilization was achieved using a catecholamine regimen according to the patient’s needs. Adrenaline, noradrenaline, and enoximone were given depending on the patient’s requirements.
The study endpoints were the peak value and area under the curve (AUC) of highly sensitive troponin T (TnT) and creatine kinase muscle brain-type (CK-MB) during 0–24 h, 24–48 h, and 48–72 h after removal of the aortic cross-clamp. The regimen of cardiac enzyme measurement changed over the observation period. Thus, TnT and CK-MB information were unfortunately not always available for every patient at every time point. We determined the cumulative dosage of the catecholamines adrenaline, noradrenaline, and enoximone.
For the three catecholamines, the total dose applied in the first 72 h after the cross-clamp removal was calculated for each agent. Therefore, the individual dose of each application was calculated by multiplying the concentration, volume applied, and duration of the application. The doses of individual applications were then cumulated.
For the cardiac enzymes TnT and CK-MB, the AUC was calculated for three consecutive 24-hour intervals after the end of the cross-clamp time to approximate the total amount secreted in each interval. Therefore, the AUC was calculated for each pair of consecutive data points within each 24-hour interval, assuming a linear behavior. These small areas were then summed up to calculate the total area under the curve. Due to the study’s retrospective nature, often no data points exist at exactly 0 h, 24 h, 48 h, or 72 h. Consequently, in these cases, the value of the closest existing data point within the respective interval next to the timepoint of 0 h, 24 h, 48 h, or 72 h was included in the analysis as the value for 0 h, 24 h, 48 h, or 72 h.
The statistical analysis was performed using IBM SPSS Statistics (Version
28.0.0.0, IBM Corp., Armonk, NY, USA). We performed a linear regression analysis
to compare the groups, including an adjustment of the group difference based on
age, sex, time of aortic cross-clamping, reperfusion time between removal of the
aortic cross-clamp and weaning from cardiopulmonary bypass (CPB), single or
multiple valve surgery, preoperative ventricular function categorized in normal
(ejection fraction
In the replacement population, the NYHA status, left-ventricular ejection fraction (LVEF), cardioplegia, number of operated valves, urgency, and the prevalence of smoking and diabetes differed between the MICS and the OPEN group (Table 1). In the MICS group, HTK was more frequently used, and surgery on one isolated valve was more prevalent. Endocarditis was more prevalent in the OPEN group compared to the MICS group. Aortic cross-clamp, reperfusion, and total operating time were longer in the OPEN group than in MICS. Days spent in the intensive care unit (ICU) and ventilation hours were also more in the OPEN group. More blood products were also transfused in patients who received open cardiac surgery.
| Parameter | Category | Patients with analyzed TnT | Patients with analyzed CK-MB | Patients with analyzed Catecholamines | ||||||
| MICS | OPEN | p-value | MICS | OPEN | p-value | MICS | OPEN | p-value | ||
| Sex | Male | 133 (62.7%) | 252 (63.2%) | 0.918 | 130 (63.4%) | 243 (63.1%) | 0.943 | 134 (62.6%) | 254 (62.6%) | 0.989 |
| Female | 79 (37.3%) | 147 (36.8%) | 75 (36.6%) | 142 (36.9%) | 80 (37.4%) | 152 (37.4%) | ||||
| Age | 65.9 |
66.6 |
0.419 | 65.9 |
67.0 |
0.207 | 65.8 |
66.7 |
0.325 | |
| Height (cm) | 171.3 |
171.0 |
0.738 | 171.3 |
171.0 |
0.714 | 171.3 |
170.9 |
0.676 | |
| Weight (kg) | 86.5 |
85.1 |
0.368 | 86.5 |
85.2 |
0.414 | 86.5 |
85.0 |
0.356 | |
| BMI | 29.5 |
29.1 |
0.389 | 29.5 |
29.1 |
0.441 | 29.5 |
29.1 |
0.402 | |
| NYHA | NYHA I | 14 (6.6%) | 19 (4.8%) | 0.001 | 14 (6.8%) | 19 (4.9%) | 0.005 | 14 (6.5%) | 19 (4.7%) | |
| NYHA II | 85 (40.1%) | 138 (34.6%) | 84 (41.0%) | 136 (35.3%) | 85 (39.7%) | 140 (34.5%) | ||||
| NYHA III | 107 (50.5%) | 192 (48.1%) | 101 (49.3%) | 186 (48.3%) | 109 (50.9%) | 194 (47.8%) | ||||
| NYHA IV | 6 (2.8%) | 31 (7.8%) | 6 (2.9%) | 28 (7.3%) | 6 (2.8%) | 34 (8.4%) | ||||
| Unknown | 0 (0.0%) | 19 (4.8%) | 0 (0.0%) | 16 (4.2%) | 0 (0.1%) | 19 (4.7%) | ||||
| LVEF | 157 (74.1%) | 239 (59.9%) | 0.001 | 152 (74.1%) | 234 (60.8%) | 0.003 | 158 (73.8%) | 245 (60.3%) | 0.002 | |
| 30–50% | 50 (23.6%) | 127 (31.8%) | 48 (23.4%) | 119 (30.9%) | 51 (23.8%) | 127 (31.3%) | ||||
| 3 (1.4%) | 24 (6.0%) | 3 (1.5%) | 23 (6.0%) | 3 (1.4%) | 25 (6.2%) | |||||
| Unknown | 2 (0.9%) | 9 (2.3%) | 2 (1.0%) | 9 (2.3%) | 2 (0.9%) | 9 (2.2%) | ||||
| Hypertension | Yes | 177 (83.5%) | 314 (78.7%) | 0.061 | 173 (84.4%) | 310 (80.5%) | 0.083 | 178 (83.2%) | 319 (78.6%) | 0.065 |
| No | 31 (14.6%) | 61 (15.3%) | 28 (13.7%) | 52 (13.5%) | 32 (15.0%) | 63 (15.5%) | ||||
| Unknown | 4 (1.9%) | 24 (6.0%) | 4 (2.0%) | 23 (6.0%) | 4 (1.9%) | 24 (5.9%) | ||||
| Smoker | Never | 93 (43.9%) | 132 (33.1%) | 89 (43.4%) | 124 (32.2%) | 95 (44.4%) | 136 (33.5%) | |||
| 54 (25.5%) | 86 (21.6%) | 53 (25.9%) | 85 (22.1%) | 54 (25.2%) | 86 (21.2%) | |||||
| Within 2 months | 26 (12.3%) | 47 (11.8%) | 25 (12.2%) | 45 (11.7%) | 26 (12.1%) | 47 (11.6%) | ||||
| Unknown | 39 (18.4%) | 134 (33.6%) | 38 (18.5%) | 131 (34.0%) | 39 (18.2%) | 137 (33.7%) | ||||
| COPD | Yes | 17 (8.0%) | 43 (10.8%) | 0.060 | 15 (7.3%) | 43 (11.2%) | 0.046 | 17 (7.9%) | 43 (10.6%) | 0.064 |
| No | 182 (85.8%) | 321 (80.5%) | 177 (86.3%) | 308 (80.0%) | 184 (86.0%) | 328 (80.8%) | ||||
| Other lung disease | 13 (6.1%) | 24 (6.0%) | 13 (6.3%) | 24 (6.2%) | 13 (6.1%) | 24 (5.9%) | ||||
| Unknown | 0 (0.0%) | 11 (2.8%) | 0 (0.0%) | 10 (2.6%) | 0 (0.0%) | 11 (2.7%) | ||||
| Diabetes | Yes | 68 (32.1%) | 127 (31.8%) | 0.007 | 64 (31.2%) | 123 (31.9%) | 0.006 | 68 (31.8%) | 129 (31.8%) | 0.007 |
| No | 144 (67.9%) | 254 (63.7%) | 141 (68.8%) | 244 (63.4%) | 146 (68.2%) | 259 (63.8%) | ||||
| Unknown | 0 (0.0%) | 18 (4.5%) | 0 (0.0%) | 18 (4.7%) | 0 (0.0%) | 18 (4.4%) | ||||
| Endocarditis | Yes | 15 (7.1%) | 127 (31.8%) | 15 (7.3%) | 123 (31.9%) | 15 (7.0%) | 128 (31.5%) | |||
| No | 197 (92.9%) | 272 (68.2%) | 190 (92.7%) | 262 (68.1%) | 199 (93.0%) | 278 (68.5%) | ||||
| Cardioplegia | HTK | 177 (83.5%) | 252 (63.2%) | 176 (85.9%) | 249 (64.7%) | 178 (83.2%) | 254 (62.6%) | |||
| Calafiore | 32 (15.1%) | 82 (20.6%) | 26 (12.7%) | 72 (18.7%) | 32 (15.0%) | 87 (21.4%) | ||||
| Buckberg | 3 (1.4%) | 65 (16.3%) | 3 (1.5%) | 64 (16.6%) | 4 (1.9%) | 65 (16.0%) | ||||
| Valve number | Single | 212 (100.0%) | 345 (86.5%) | 205 (100.0%) | 331 (86.0%) | 214 (100.0%) | 350 (86.2%) | |||
| Multiple | 0 (0.0%) | 54 (13.5%) | 0 (0.0%) | 54 (14.0%) | 0 (0.0%) | 56 (13.8%) | ||||
| Replacement type | Biological | 206 (97.2%) | 336 (97.4%) | 0.875 | 199 (97.1%) | 324 (97.9%) | 0.553 | 208 (97.2%) | 341 (97.4%) | 0.868 |
| Mechanical | 6 (2.8%) | 9 (2.6%) | 6 (2.9%) | 7 (2.1%) | 6 (2.8%) | 9 (2.6%) | ||||
| Urgency | Urgent | 33 (15.6%) | 171 (42.9%) | 33 (16.1%) | 169 (43.9%) | 33 (15.4%) | 173 (42.6%) | |||
| Elective | 179 (84.4%) | 228 (57.1%) | 172 (83.9%) | 216 (56.1%) | 181 (84.6%) | 233 (57.4%) | ||||
| Clamp time (min) | 79.9 |
90.1 |
80.3 |
90.7 |
79.8 |
90.5 |
||||
| Reperfusion time (min) | 23.4 |
27.6 |
0.023 | 23.6 |
27.8 |
0.270 | 23.3 |
27.9 |
0.012 | |
| Operating time (h) | 197.0 |
218.1 |
198.0 |
219.1 |
0.001 | 196.6 |
218.8 |
|||
| Days in ICU | 5.0 |
9.9 |
5.0 |
10.0 |
5.0 |
9.8 |
||||
| Days in hospital | 11.0 |
13.3 |
10.9 |
13.3 |
11.0 |
13.3 |
||||
| Ventilation hours | 34.6 |
87.5 |
35.4 |
86.2 |
34.5 |
86.7 |
||||
| pRBC units | 2.2 |
6.1 |
2.2 |
6.2 |
2.2 |
6.0 |
||||
| Platelets Units | 1.1 |
4.0 |
1.2 |
4.0 |
1.1 |
3.9 |
||||
| FFP Units | 0.2 |
1.1 |
0.2 |
1.1 |
0.2 |
1.1 |
||||
BMI, Body Mass Index; FFP, Fresh frozen plasma; HTK, Histidine-Tryptophan-Ketoglutarate; ICU, Intensive care unit; LVEF, Left-ventricular ejection fraction; NYHA, New York Heart Association; CK-MB, Creatinekinase muscle brain type; COPD, Chronic obstructive pulmonary disease; MICS, Minimally-invasive cardiac surgery; pRBC, Packed red blood cells; TnT, High-sensitive troponin T; OPEN, open heart surgery.
In the reconstruction population, body weight and Body Mass Index (BMI) were higher in OPEN (Table 2). Diabetes was also more prevalent in this group. HTK was also more often used than blood cardioplegia in the MICS group. Cross-clamp and operation times were longer in MICS. However, MICS patients spent less time in the ICU and were mechanically ventilated for a shorter time than the OPEN patients. Again, more blood products were used in OPEN. However, in both populations, reconstruction and replacement, the outcome parameters were adjusted to relevant confounders.
| Parameter | Category | TnT | CK-MB | Catecholamines | ||||||
| MICS | OPEN | p-value | MICS | OPEN | p-value | MICS | OPEN | p-value | ||
| Sex | Male | 49 (65.3%) | 34 (66.7%) | 0.877 | 49 (65.3%) | 30 (63.8%) | 0.866 | 49 (65.3%) | 34 (66.7%) | 0.877 |
| Female | 26 (34.7%) | 17 (33.3%) | 26 (34.7%) | 17 (36.2%) | 26 (34.7%) | 17 (33.3%) | ||||
| Age | 59.8 |
64.4 |
0.050 | 59.8 |
64.9 |
0.034 | 59.8 |
64.4 |
0.050 | |
| Height (cm) | 173.9 |
171.8 |
0.211 | 173.9 |
171.4 |
0.161 | 173.9 |
171.8 |
0.211 | |
| Weight (kg) | 76.1 |
85.7 |
0.003 | 76.1 |
85.7 |
0.005 | 76.1 |
85.7 |
0.001 | |
| BMI | 25.0 |
29.0 |
25.0 |
29.1 |
25.0 |
29.0 |
||||
| NYHA | NYHA I | 9 (12.0%) | 2 (3.9%) | 0.067 | 9 (12.0%) | 2 (4.3%) | 0.085 | 9 (12.0%) | 2 (3.9%) | 0.067 |
| NYHA II | 33 (44.0%) | 15 (29.4%) | 33 (44.0%) | 15 (31.9%) | 33 (44.0%) | 15 (29.4%) | ||||
| NYHA III | 26 (34.7%) | 24 (47.1%) | 26 (34.7%) | 23 (48.9%) | 26 (34.7%) | 24 (47.1%) | ||||
| NYHA IV | 3 (4.0%) | 7 (13.7%) | 3 (4.0%) | 6 (12.8%) | 3 (4.0%) | 7 (13.7%) | ||||
| Unknown | 4 (5.3%) | 3 (5.9%) | 4 (5.3%) | 1 (2.1%) | 4 (5.3%) | 3 (5.9%) | ||||
| LVEF | 55 (73.3%) | 31 (60.8%) | 0.122 | 55 (73.3%) | 29 (61.7%) | 0.124 | 55 (73.3%) | 31 (60.8%) | 0.122 | |
| 30–50% | 18 (24.0%) | 16 (31.4%) | 18 (24.0%) | 14 (29.8%) | 18 (24.0%) | 16 (31.4%) | ||||
| 0 (0.0%) | 3 (5.9%) | 0 (0.0%) | 3 (6.4%) | 0 (0.0%) | 3 (5.9%) | |||||
| Unknown | 2 (2.7%) | 1 (2.0%) | 2 (2.7%) | 1 (2.1%) | 2 (2.7%) | 1 (2.0%) | ||||
| Hypertension | Yes | 60 (80.0%) | 34 (66.7%) | 0.074 | 60 (80.0%) | 32 (68.1%) | 0.055 | 60 (80.0%) | 34 (66.7%) | 0.074 |
| No | 11 (14.7%) | 8 (15.7%) | 11 (14.7%) | 6 (12.8%) | 11 (14.7%) | 8 (15.7%) | ||||
| Unknown | 4 (5.3%) | 9 (17.6%) | 4 (5.3%) | 9 (19.1%) | 4 (5.3%) | 9 (17.6%) | ||||
| Smoker | Never | 36 (48.0%) | 17 (33.3%) | 0.433 | 36 (48.0%) | 14 (29.8%) | 0.248 | 36 (48.0%) | 17 (33.3%) | 0.433 |
| 15 (20.0%) | 14 (27.5%) | 15 (20.0%) | 14 (29.8%) | 15 (20.0%) | 14 (27.5%) | |||||
| Within 2 months | 7 (9.3%) | 6 (11.7%) | 7 (9.3%) | 5 (10.6%) | 7 (9.3%) | 6 (11.8%) | ||||
| Unknown | 17 (22.7%) | 14 (27.5%) | 17 (22.7%) | 14 (29.8%) | 17 (22.7%) | 14 (27.5%) | ||||
| COPD | Yes | 4 (5.3%) | 10 (19.6%) | 0.098 | 4 (5.3%) | 10 (21.3%) | 0.064 | 4 (5.3%) | 10 (19.6%) | 0.098 |
| No | 60 (80.0%) | 35 (68.6%) | 60 (80.0%) | 31 (66.0%) | 60 (80.0%) | 35 (68.6%) | ||||
| Other lung disease | 7 (9.3%) | 4 (7.8%) | 7 (9.3%) | 4 (8.5%) | 7 (9.3%) | 4 (7.8%) | ||||
| Unknown | 4 (5.4%) | 2 (4.0%) | 4 (5.3%) | 2 (4.3%) | 4 (5.3%) | 2 (3.9%) | ||||
| Diabetes | Yes | 4 (5.3%) | 11 (21.6%) | 0.012 | 4 (5.3%) | 11 (23.4%) | 0.006 | 4 (5.3%) | 11 (21.6%) | 0.012 |
| No | 69 (92.0%) | 37 (72.5%) | 69 (92.0%) | 33 (70.2%) | 69 (92.0%) | 37 (72.5%) | ||||
| Unknown | 2 (2.7%) | 3 (5.9%) | 2 (2.7%) | 3 (6.4%) | 2 (2.7%) | 3 (5.9%) | ||||
| Endocarditis | Yes | 2 (2.7%) | 5 (9.8%) | 0.086 | 2 (2.7%) | 5 (10.6%) | 0.065 | 2 (2.7%) | 5 (9.8%) | 0.086 |
| No | 73 (97.3%) | 46 (90.2%) | 73 (97.3%) | 42 (89.4%) | 73 (97.3%) | 46 (90.2%) | ||||
| Cardioplegia | HTK | 72 (96.0%) | 39 (76.5%) | 0.002 | 72 (96.0%) | 38 (80.9%) | 0.011 | 72 (96.0%) | 39 (76.5%) | 0.002 |
| Calafiore | 3 (4.0%) | 7 (13.7%) | 3 (4.0%) | 5 (10.6%) | 3 (4.0%) | 7 (13.7%) | ||||
| Buckberg | 0 (0.0%) | 5 (9.8%) | 0 (0.0%) | 4 (8.5%) | 0 (0.0%) | 5 (9.8%) | ||||
| Valve number | Single | 66 (88.0%) | 44 (86.3%) | 0.775 | 66 (88.0%) | 40 (85.1%) | 0.645 | 66 (88.0%) | 44 (86.3%) | 0.775 |
| Multiple | 9 (12.0%) | 7 (13.7%) | 9 (12.0%) | 7 (14.9%) | 9 (12.0%) | 7 (13.7%) | ||||
| Urgency | Urgent | 9 (12.0%) | 13 (25.5%) | 0.050 | 9 (12.0%) | 13 (27.7%) | 0.029 | 9 (12.0%) | 13 (25.5%) | 0.050 |
| Elective | 66 (88.0%) | 38 (74.5%) | 66 (88.0%) | 34 (72.3%) | 66 (88.0%) | 38 (74.5%) | ||||
| Clamp time (min) | 118.4 |
85.4 |
118.4 |
87.0 |
118.4 |
85.1 |
||||
| Reperfusion time (min) | 40.2 |
32.0 |
0.074 | 40.2 |
33.0 |
0.128 | 40.2 |
32.0 |
0.074 | |
| Operating time (h) | 267.6 |
223.7 |
267.6 |
229.5 |
267.6 |
223.7 |
||||
| Days in ICU | 5.5 |
9.3 |
0.030 | 5.5 |
9.8 |
0.021 | 5.5 |
9.3 |
0.030 | |
| Days in hospital | 11.5 |
11.6 |
0.921 | 11.5 |
11.4 |
0.949 | 11.5 |
11.6 |
0.921 | |
| Ventilation hours | 40.1 |
112.3 |
0.034 | 40.1 |
120.5 |
0.028 | 40.1 |
112.3 |
0.034 | |
| pRBC units | 2.3 |
7.2 |
0.032 | 2.3 |
7.7 |
0.027 | 2.3 |
7.2 |
0.032 | |
| Platelets Units | 1.6 |
7.3 |
0.031 | 1.6 |
7.9 |
0.026 | 1.6 |
7.3 |
0.031 | |
| FFP Units | 0.5 |
1.8 |
0.043 | 0.5 |
2.0 |
0.036 | 0.5 |
1.8 |
0.043 | |
BMI, Body Mass Index; FFP, Fresh frozen plasma; HTK, Histidine-Tryptophan-Ketoglutarate; ICU, Intensive care unit; LVEF, Left-ventricular ejection fraction; NYHA, New York Heart Association; CK-MB, Creatinekinase muscle brain type; COPD, Chronic obstructive pulmonary disease; MICS, Minimally-invasive cardiac surgery; pRBC, Packed red blood cells; TnT, High-sensitive troponin T.
The adjusted noradrenaline dosage was relevantly lower (adj. difference: –22.3 mg; p = 0.023) in the MICS group in the replacement population (Table 3). However, the adjusted release of TnT and CK-MB was not relevantly different. In the reconstruction population, the adjusted adrenaline (adj. difference: –14.2 mg; p = 0.036), noradrenaline (adj. difference: –46.8 mg; p = 0.043), and enoximone (adj. difference: –130.5 mg; p = 0.012) dosages were lower in the MICS group than in the OPEN group (Table 4). Considering the adjusted differences in all catecholamines, this result is clinically meaningful. The adjusted peak TnT release in the first 24 h (adj. difference: –845.4 ng/L; p = 0.025) and between 24 and 48 h (adj. difference: –631.9 ng/L; p = 0.046) after the onset of myocardial reperfusion and the adjusted TnT AUC (adj. difference: –15,183.3 (ng/L)*h); p = 0.024) were lower, and according to the absolute difference of release of clinical importance in the MICS group (Table 4). The adjusted peak CK-MB release was relevantly lower (adj. difference: –0.6 µkat/L) in the first 24 h and between 48 and 72 h, as well as the adjusted CK-MB AUC between 48 and 72 h after removal of the cross-clamp. A summary of the results is shown in Fig. 1.
| TnT | ||||||||||
| Timepoint | Type of surgery | unadjusted | adjusted | |||||||
| MICS | OPEN | Difference | p-value | 95% CI | Difference | p-value | 95% CI | |||
| low | high | low | high | |||||||
| Peak 1 (ng/L) | 1274.9 |
1184.9 |
90.0 | 0.806 | –628.2 | 808.1 | 143.3 | 0.719 | –638.1 | 924.6 |
| n = 211 | n = 399 | |||||||||
| Peak 2 (ng/L) | 927.1 |
898.8 |
28.3 | 0.939 | –698.4 | 755.0 | 153.2 | 0.705 | –641.8 | 948.3 |
| n = 205 | n = 390 | |||||||||
| Peak 3 (ng/L) | 983.8 |
718.4 |
265.4 | 0.525 | –554.0 | 1084.8 | 371.6 | 0.423 | –539.7 | 1283.0 |
| n = 171 | n = 351 | |||||||||
| AUC 1 ((ng/L)*h) | 23,919.2 |
21,267.6 |
2651.6 | 0.738 | –12,931.3 | 18,234.9 | 3814.5 | 0.661 | –13,265.4 | 20,894.4 |
| n = 211 | n = 399 | |||||||||
| AUC 2 ((ng/L)*h) | 21,857.5 |
20,180.3 |
1677.1 | 0.849 | –15,567.5 | 18,921.7 | 4704.7 | 0.626 | –14,231.1 | 23,640.6 |
| n = 205 | n = 390 | |||||||||
| AUC 3 ((ng/L)*h) | 15,170.4 |
17,069.1 |
–1898.7 | 0.681 | –10,964.7 | 7167.3 | 1013.2 | 0.839 | –8794.4 | 10,820.8 |
| n = 171 | n = 351 | |||||||||
| CK-MB | ||||||||||
| Peak 1 (µkat/L) | 1.9 |
1.4 |
0.5 | 0.411 | –0.7 | 1.7 | 0.6 | 0.290 | –0.5 | 1.7 |
| n = 202 | n = 381 | |||||||||
| Peak 2 (µkat/L) | 0.6 |
0.9 |
–0.2 | 0.189 | –0.5 | 0.1 | –0.1 | 0.580 | –0.4 | 0.2 |
| n = 132 | n = 259 | |||||||||
| Peak 3 (µkat/L) | 0.4 |
0.4 |
0.002 | 0.976 | –0.1 | 0.1 | 0.03 | 0.675 | –0.1 | 0.1 |
| n = 115 | n = 232 | |||||||||
| AUC 1 ((µkat/L)*h) | 28.0 |
22.2 |
5.9 | 0.428 | –8.7 | 20.4 | 7.6 | 0.208 | –4.2 | 19.4 |
| n = 202 | n = 381 | |||||||||
| AUC 2 ((µkat/L)*h) | 13.5 |
18.6 |
–5.0 | 0.063 | –10.6 | 0.3 | –2.4 | 0.456 | –8.7 | 3.9 |
| n = 132 | n = 259 | |||||||||
| AUC 3 ((µkat/L)*h) | 9.4 |
9.4 |
–0.03 | 0.978 | –2.5 | 2.4 | 0.5 | 0.683 | –2.0 | 3.0 |
| n = 115 | n = 232 | |||||||||
| Catecholamines (mg) | ||||||||||
| Type of surgery | unadjusted | adjusted | ||||||||
| MICS | OPEN | Difference | p-value | 95% CI | Difference | p-value | 95% CI | |||
| n = 214 | n = 406 | low | high | low | high | |||||
| Adrenaline | 1.1 |
5.1 |
–4.0 | –6.1 | –1.9 | –1.7 | 0.213 | –4.5 | 1.0 | |
| Noradrenaline | 7.2 |
37.2 |
–29.9 | –43.0 | –16.8 | –22.3 | 0.023 | –41.5 | –3.1 | |
| Enoximone | 15.4 |
19.1 |
–3.8 | 0.361 | –24.4 | 16.9 | 5.8 | 0.613 | –16.8 | 28.5 |
Peak or AUC 1 to 3 represent the respective value in the first, second, and third 24 h period after removal of the aortic cross clamp. AUC, Area under curve; CK-MB, Creatinekinase muscle brain type; MICS, Minimally-invasive cardiac surgery; TnT, High-sensitive troponin T.
| TnT | ||||||||||
| Timepoint | Type of surgery | unadjusted | adjusted | |||||||
| MICS | OPEN | Difference | p-value | 95% CI | Difference | p-value | 95% CI | |||
| low | high | low | high | |||||||
| Peak 1 (ng/L) | 1495.4 |
1499.7 |
–4.3 | 0.990 | –659.3 | 650.6 | –845.4 | 0.025 | –1584.8 | –106.0 |
| n = 75 | n = 51 | |||||||||
| Peak 2 (ng/L) | 998.2 |
1031.3 |
–33.1 | 0.905 | –580.7 | 514.5 | –631.9 | 0.046 | –1253.2 | –10.6 |
| n = 73 | n = 50 | |||||||||
| Peak 3 (ng/L) | 937.7 |
778.6 |
159.0 | 0.582 | –411.8 | 729.9 | –437.0 | 0.190 | –1095.3 | 221.3 |
| n = 56 | n = 44 | |||||||||
| AUC 1 ((ng/L)*h) | 26,837.5 |
26,854.2 |
–16.7 | 0.998 | –11,788.9 | 11,755.4 | –15,183.3 | 0.024 | –28,330.2 | 2036.4 |
| n = 75 | n = 51 | |||||||||
| AUC 2 ((ng/L)*h) | 22,962.2 |
23,305.6 |
–343.3 | 0.956 | –12,526.5 | 11,839.8 | –13,122.6 | 0.063 | –26,946.4 | 701.2 |
| n = 73 | n = 50 | |||||||||
| AUC 3 ((ng/L)*h) | 21,920.9 |
18,567.4 |
3353.4 | 0.615 | –9846.1 | 16,553.0 | –10,003.7 | 0.194 | –25,198.9 | 5191.4 |
| n = 56 | n = 44 | |||||||||
| CK-MB | ||||||||||
| Peak 1 (µkat/L) | 1.9 |
1.6 |
0.3 | 0.307 | –0.3 | 1.0 | –0.6 | 0.093 | –1.2 | 0.1 |
| n = 73 | n = 46 | |||||||||
| Peak 2 (µkat/L) | 1.0 |
0.8 |
0.2 | 0.507 | –0.4 | 0.8 | –0.4 | 0.240 | –1.1 | 0.3 |
| n = 50 | n = 31 | |||||||||
| Peak 3 (µkat/L) | 0.4 |
0.5 |
–0.1 | 0.363 | –0.3 | 0.1 | –0.2 | 0.067 | –0.5 | 0.02 |
| n = 42 | n = 28 | |||||||||
| AuC 1 ((µkat/L)*h) | 35.0 |
28.2 |
6.8 | 0.236 | –4.5 | 18.2 | –9.7 | 0.109 | –21.5 | 2.2 |
| n = 73 | n = 46 | |||||||||
| AuC 2 ((µkat/L)*h) | 21.4 |
17.6 |
3.8 | 0.520 | –8.0 | 15.6 | –7.8 | 0.260 | –21.6 | 6.0 |
| n = 50 | n = 31 | |||||||||
| AuC 3 ((µkat/L)*h) | 9.8 |
12.3 |
–2.5 | 0.350 | –7.8 | 2.8 | –6.0 | 0.055 | –12.2 | 0.1 |
| n = 42 | n = 28 | |||||||||
| Catecholamines (mg) | ||||||||||
| Type of surgery | unadjusted | adjusted | ||||||||
| MICS | OPEN | Difference | p-value | 95% CI | Difference | p-value | 95% CI | |||
| n = 75 | n = 51 | low | high | low | high | |||||
| Adrenaline | 1.1 |
15.6 |
–14.6 | 0.043 | –28.7 | –0.4 | –14.2 | 0.036 | –27.4 | –1.0 |
| Noradrenaline | 6.2 |
62.7 |
–56.5 | 0.017 | –102.4 | –10.7 | –46.8 | 0.043 | –92.0 | –1.5 |
| Enoximone | 9.4 |
108.1 |
–98.7 | 0.061 | –202.0 | 4.7 | –130.5 | 0.012 | –231.5 | –29.5 |
Peak or AUC 1 to 3 represent the respective value in the first, second, and third 24 h period after removal of the aortic cross clamp. AUC, Area under curve; CK-MB, Creatinekinase muscle brain type; MICS, Minimally-invasive cardiac surgery; TnT, High-sensitive troponin T.
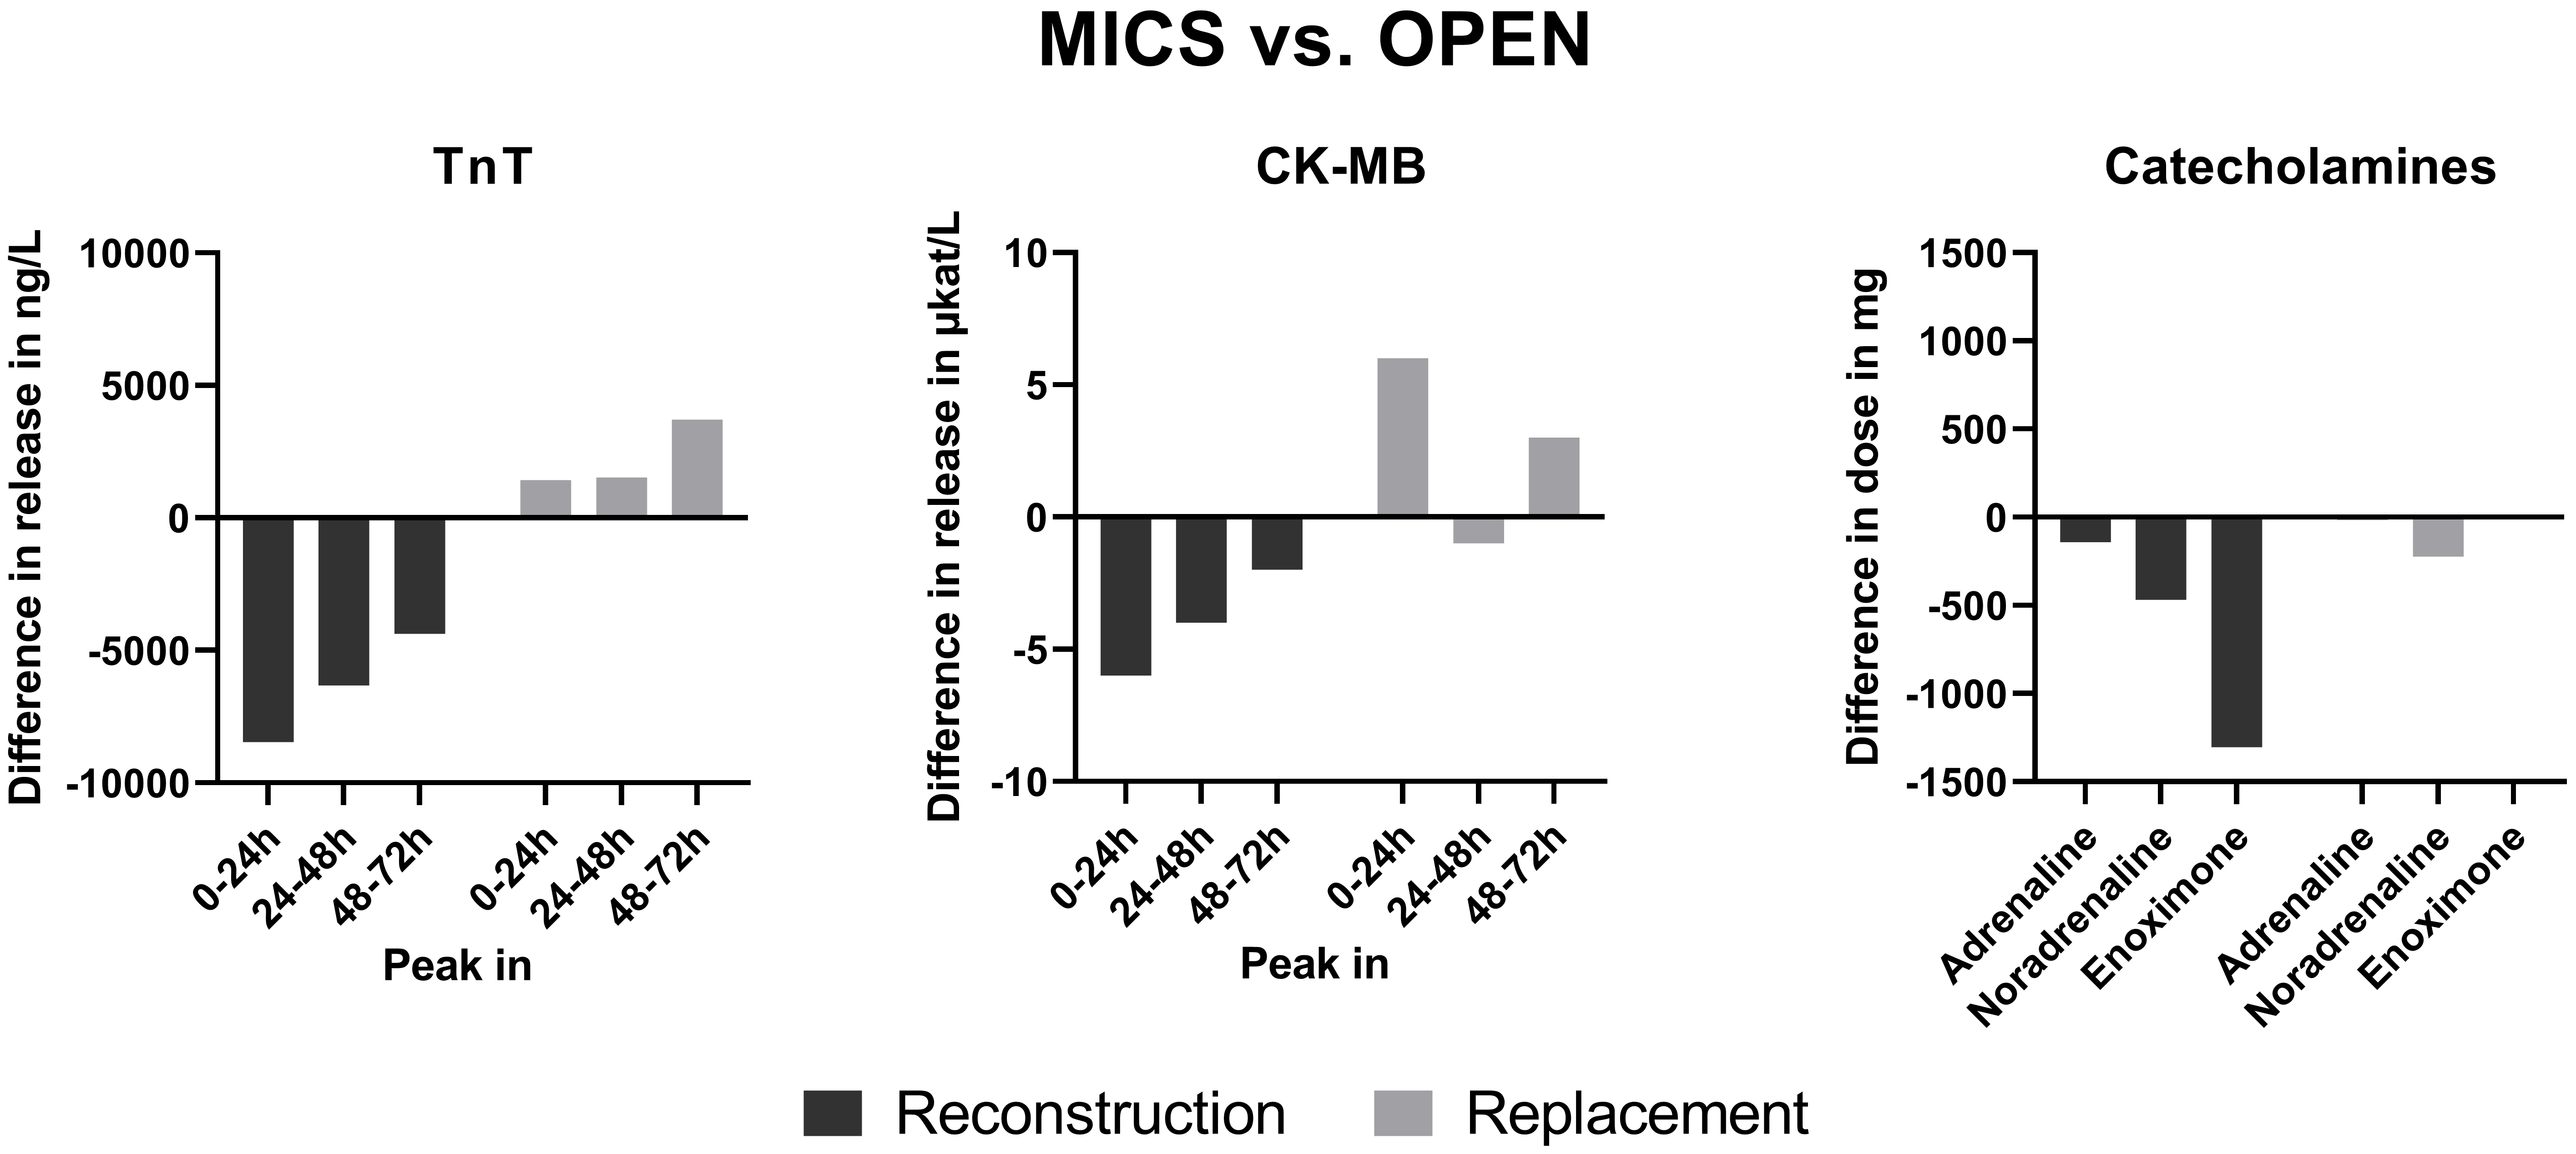 Fig. 1.
Summary of results. Negative values indicate a lower release or dosage in MICS than in OPEN. MICS, Minimally-invasive cardiac surgery; TnT, High-sensitive troponin T; CK-MB, Creatinekinase muscle brain type.
In this retrospective single-center comparison, we could show a decreased release of cardiac enzymes after valve reconstruction and a decreased catecholamine requirement after both valve replacement and reconstruction by MICS compared to OPEN. From this, we conclude that myocardial protection is more effective in MICS during valve surgery and is associated with a more stable hemodynamic situation for the patient after valve surgery.
The analysis was adjusted for multiple covariates because myocardial contractility and hemodynamics also depend on various patient-specific and treatment-associated factors. Based on the literature, cardiac enzyme release depends on ischemia time, which is reflected by the aortic cross-clamping time [10]. The effects of myocardial ischemia also depend on sex [11]. During aortic cross-clamping, the myocardium is protected by the cardioplegic solution, which is also likely to affect cardiac enzyme release. Thus, cross-clamping time, sex, and cardioplegia were included as covariates. The number of operated valves affects the aortic cross-clamping time and was therefore also considered for the adjustment. The reperfusion time between removal of the aortic cross-clamp and weaning from CPB might have an effect, especially on the catecholamine dosage, and was therefore also included as a covariate. The stage of heart insufficiency and ventricular function correlates with the general state and potential resilience of the patient against certain stress, such as cardiac surgery, and was consequently also included as a covariate [12]. Although propensity score matching is often applied to create comparable populations, it has been shown by Cepeda et al. [13] that in the case of a higher number of events per confounder, which is the given reality in the present populations, regression is the more robust approach.
In the replacement population, the aortic cross-clamping time, which determines the myocardial ischemia time, was not relevantly different between MICS and OPEN. This finding was unexpected but might be based on the fact that complicated cases, such as surgery on multiple valves, are preferably operated in OPEN fashion. Consequently, more patients with multiple operated valves were included in the OPEN group.
In contrast, in the reconstruction population, the percentage of patients with single or multiple operated valves was comparable between MICS and OPEN. Thus, based on the limited operating space in MICS, the operating and ischemia time was longer than that of OPEN, as known from the literature [14]. Considering the prolonged ischemia time in the MICS population, we expected a more pronounced myocardial injury and, thus, higher cardiac enzyme release. However, the outcome measures were adjusted for this factor, and even after adjustment, the TnT release was lower and of clinical relevance in the MICS group. From this, we conclude that myocardial protection is not only time-dependent but also depends on surgical access and trauma, which is smaller and reduced in MICS. The obviously improved myocardial protection can also be a reason for the reduced postoperative catecholamine dosage in MICS, which can also be based on other secondary effects that promote stable hemodynamics after cardiac surgery. Sufficient circulation in the body based on low catecholamine requirement and short ventilation times enables early mobilization of the patient, which is especially beneficial for old and often frail patients [15].
The missing difference of cardiac enzyme release in the replacement group might be based on other factors of relevance for myocardial protection that might have overshadowed the potential protective effects of MICS. Accordingly, patients with valve replacement sometimes have a more complicated ventricular geometry that can make the surgical procedure more complicated and indirectly affect myocardial protection. In the literature, it has also been suggested that valve replacement can have a counterbeneficial effect on myocardial protection when ventricular geometry cannot be fully preserved or may have a more severe primary disease [16, 17, 18].
Other observed advantages of MICS are the shorter ICU and ventilation times and the decreased use of blood products compared to OPEN. This observation is congruent with other studies and might be based on decreased chest trauma because no median sternotomy is performed [19].
Due to the retrospective nature of this study, not all outcome measures were available at every time point. However, we performed a commonly known mathematical approximation to minimize this limitation. We were unfortunately not able to compare the effect of different cardioplegic solutions within the subgroups due to the limited number of patients per cardioplegia.
Prospective studies, ideally using only one type of cardioplegia, are needed to prove the conclusions of the present retrospective study. TnT and CK-MB are clinically relevant biomarkers that correlate with clinically relevant outcomes such as arrhythmias or survival [20]. Other clinical outcomes, such as survival, ideally long-term, should also be assessed and correlated with myocardial injury markers. Additionally, further studies are needed to investigate if the improved myocardial protection also occurs in other cardiovascular surgery procedures that can also be performed minimally-invasive.
Our single-center retrospective study concludes that the surgical access seems to have an impact on myocardial protection. Therefore, MICS, compared to OPEN, shows improved myocardial protection, at least during valve reconstruction. Consequently, if possible, MICS should be preferred over OPEN in order to achieve improved myocardial protection. Additionally, MICS is associated with improved postoperative hemodynamics in valve reconstruction and replacement. Thus, this study provides novel insights into the additional benefits of MICS that might be especially in favor for old and frail patients in cardiac surgery. However, prospective studies are needed to confirm these results.
Data and more information on materials are available upon reasonable request.
LS and ALB performed the research. LS designed the research study, interpreted data, wrote the manuscript. ALB performed data extraction and analysis. MS assisted during data extraction. AS and GS performed critical review of the manuscript. GS and AS interpreted the results. All authors contributed to editorial changes in the manuscript. All authors read and approved the final manuscript. All authors have participated sufficiently in the work and agreed to be accountable for all aspects of the work.
The study was carried out in accordance with the guidelines of the Declaration of Helsinki. The institutional ethical review committee of the University Hospital Halle reviewed and approved this investigation (reference: 2022-137; approval: 05 December 2022). Due to the retrospective nature of this study, no informed consent was necessary.
Not applicable.
This project was supported by the German Research Foundation (DFG; project number 530557324; to Dr. Lars Saemann), by the Wilhelm-Roux funding program of the Medical Faculty of the Martin Luther University Halle-Wittenberg (to Dr. Lars Saemann), and by the Bundesminesterium für Bildung und Forschung (BMBF; project Thera4Age; to Prof. Dr. Andreas Simm).
The authors declare no conflict of interest.
References
Publisher’s Note: IMR Press stays neutral with regard to jurisdictional claims in published maps and institutional affiliations.