


 , Zhen Guo 2, Jun Zhou 2, Lin Mou 3, Dongchuan Zuo 4,*
 , Junguo Duan 1,5,*
1 Eye School of Chengdu University of TCM, 611137 Chengdu, Sichuan, China
2 School of Integrated Traditional and Western Medicine, Southwest Medical University, 646000 Luzhou, Sichuan, China
3 Department of Ophthalmology, The Affiliated Traditional Chinese Medicine Hospital of Southwest Medical University, 646000 Luzhou, Sichuan, China
4 Key Laboratory of Medical Electrophysiology, Southwest Medical University, 646000 Luzhou, Sichuan, China
5 Eye Health With Traditional Chinese Medicine Key Laboratory of Sichuan Province, 610084 Chengdu, Sichuan, China
Abstract
Clinical epidemiological data have shown that hypomagnesemia, defined as a serum Mg2+ concentration of <0.7 mmol/L, independently increases the risk of diabetic retinopathy (DR) in patients with type 2 diabetes mellitus (T2DM). The molecular and cellular mechanisms through which hypomagnesemia accelerates the onset and progression of DR remain largely undefined. The Transient Receptor Potential Cation Channel, Subfamily M, Member 7 (TRPM7) channel is expressed in the retina and is integral to the pathophysiological processes associated with hypomagnesemia. However, whether TRPM7 affects DR progression through its regulation of hypomagnesemia has not been established. Müller cells span the retina and are crucial for maintaining retinal homeostasis. Moreover, these cells significantly influence the onset and progression of DR. The current study assessed the impact of combined treatment with high-glucose (HG) and low-Mg2+ (LM) on retinal Müller cells, and also investigated the underlying molecular mechanism.
Müller cells were treated with HG or HG combined with LM (HG/LM). TRPM7-silenced Müller cells were generated by transduction with shRNA. Quantitative real-time PCR and Western blot analysis were performed to measure the levels of related genes and proteins, respectively. Cell viability, apoptosis, mitochondrial function, oxidative stress, and intracellular Ca2+ levels in Müller cells were analyzed using relevant assays.
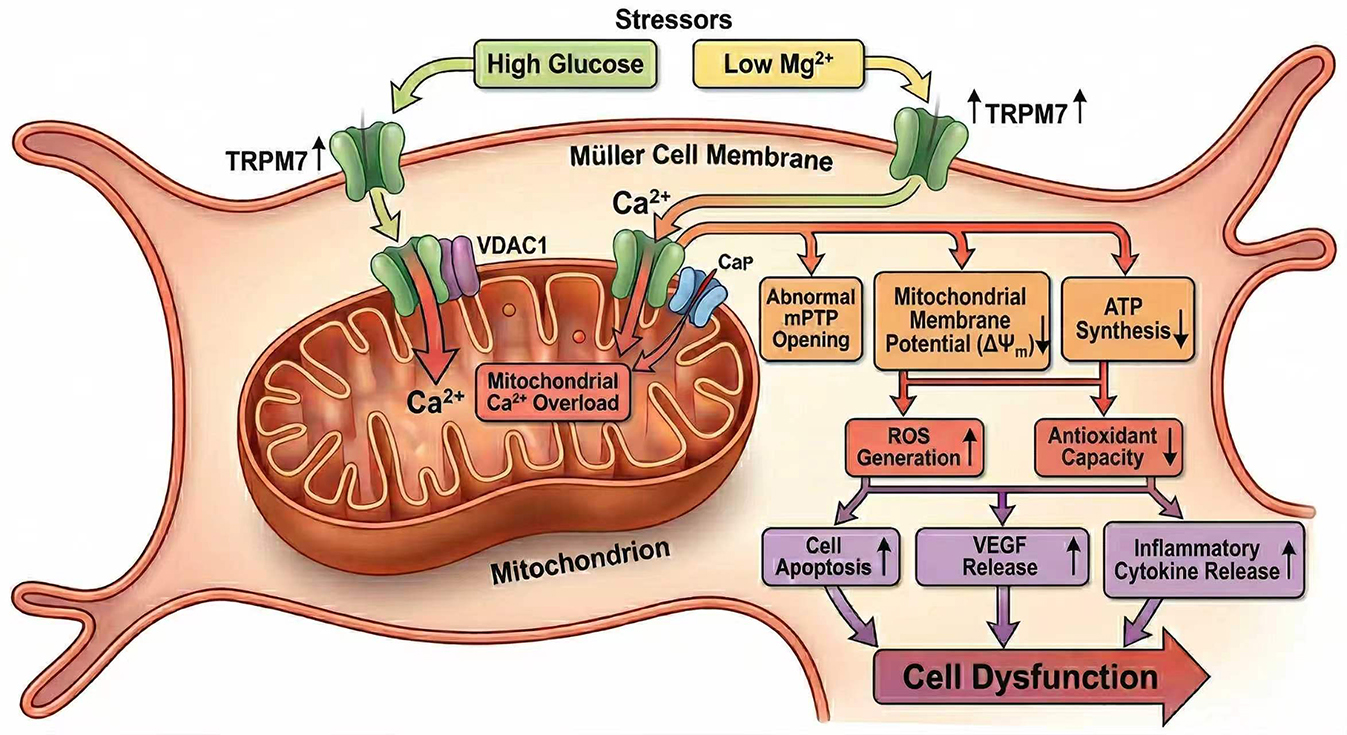
Low Mg2+ was found to aggravate oxidative stress and mitochondrial dysfunction in Müller cells under HG stress, leading to decreased cell viability, increased apoptosis, and elevated expression of vascular endothelial growth factor. These effects were accompanied by the upregulation of TRPM7 and mitochondrial voltage-dependent anion channel 1 (VDAC1), as well as increased intracellular Ca2+ levels. Silencing of TRPM7 expression in Müller cells significantly decreased intracellular Ca2+, oxidative stress, mitochondrial dysfunction, and cell dysfunction under HG/LM stress.
Low Mg2+ exacerbates the dysfunction of Müller cells under HG stress via TRPM7/Ca2+/VDAC1 axis-mediated mitochondrial oxidative stress.
Graphical Abstract
Keywords
- diabetic retinopathy
- magnesium
- TRPM cation channel
- oxidative stress
Improvements in living standards have led to an increased prevalence of type 2 diabetes mellitus (T2DM). The complications from T2DM pose a serious threat to both health and life. Although an increasing number of oral hypoglycemic agents and various types of insulin are currently being utilized in the clinic to manage T2DM, challenges remain in delaying the progression of complications [1]. Hypomagnesemia (serum Mg2+ concentration <0.7 mmol/L) is a common complication in T2DM patients and an independent risk factor for its development. Moreover, hypomagnesemia is closely linked to the onset and progression of complications from T2DM [2]. Reports indicate that the prevalence of hypomagnesemia in T2DM patients can be as high as 47.7% [3]. Abnormal glucose metabolism and insulin resistance in T2DM patients leads to reduced serum Mg2+ levels. This in turn can further elevate blood glucose by exacerbating insulin resistance and inhibiting insulin secretion, thereby forming a vicious cycle in which each aggravates the other [4,5,6]. Mg2+ supplementation may represent a promising approach for the treatment of hypomagnesemia. However, the efficacy of Mg2+ supplementation for treating T2DM and its complications is still unclear and requires further clinical studies. Importantly, long-term supplementation with high-dose Mg2+ may cause adverse effects, such as diarrhea and hypermagnesemia [7,8]. Therefore, it is crucial to elucidate the cellular mechanisms and molecular protein targets through which hypomagnesemia exacerbates T2DM and its complications.
One of the most serious complications of diabetes and a leading cause of blindness is diabetic retinopathy (DR) [9]. T2DM patients with DR exhibit significantly lower serum Mg2+ levels compared to those without DR [10]. Moreover, cohort studies have shown an increased risk of DR in T2DM patients with hypomagnesemia [11]. However, the cellular and molecular mechanisms by which hypomagnesemia accelerates the development and progression of DR remain unclear.
Transient Receptor Potential Cation Channel, Subfamily M, Member 7 (TRPM7) channel, a member of the TRP channels, is expressed in the retina [12]. Despite extensive research in other systems, the function of TRPM7 in the retina remains largely unknown. TRPM7 channels are integral to the pathophysiological processes associated with hypomagnesemia. For instance, TRPM7 is implicated in seizure-related mortality induced by hypomagnesemia [13]. Additionally, TRPM7 modulates inflammatory responses in the context of hypomagnesemia-induced cardiac diastolic dysfunction [14]. Martínez-Gil et al. [15] reported that TRPM7 expression in mouse retinal Müller cells is increased following ischemia–reperfusion. Hu et al. [16] demonstrated that blue light triggers the apoptosis of retinal pigment epithelium cells, which could be partially mitigated by the synergistic action of TRPM7 and PEDF through the PKC/ERK signaling pathway . These studies show that TRPM7 channels regulate significant pathophysiological functions in the retina. However, it is still unclear whether they also participate in the process by which hypomagnesemia accelerates the progression of DR.
The predominant type of glial cell in the retina are Müller cells. These cells secrete trophic factors, recycle neurotransmitters, prevent glutamate excitotoxicity, participate in the retinoid cycle, redistribute ions via spatial buffering, and regulate nutrient supply via several mechanisms [17,18,19]. DR induces a series of pathological changes in Müller cells, including reactive gliosis, apoptosis, decreased synthesis of glutamine synthetase, massive secretion of vascular endothelial growth factor (VEGF), as well as the release of inflammatory factors that create a chronic inflammatory retinal milieu [20,21,22,23,24]. These pathological alterations contribute substantially to the retinal neurodegeneration and microcirculatory dysregulation observed in DR. The role of Müller cells in the hypomagnesemia-induced acceleration of DR progression remains unclear, however. In the current study, we therefore explored the effects of high glucose (HG) and low Mg2+ (LM) on retinal Müller cells, together with the underlying mechanism.
Primary mouse Müller cells (MIC-iCELL-m018) were purchased from iCell Bioscience Inc., Shanghai) [25,26]. Their identity was validated by surface marker analysis with immunofluorescence staining (see Supplementary Materials for details). All cells tested negative for mycoplasma. Cells were maintained in DMEM/F12 medium (Boster Biological Technology, Wuhan, China; Catalog#DZPYG0074) containing 10% fetal bovine serum and 1% penicillin–streptomycin. This medium contains 17.17 mg/L (≈0.7 mmol/L) Mg2+ and 3151 mg/L (≈17.5 mmol/L) glucose. For the high glucose (HG) condition, glucose was added to DMEM/F12 medium to give a final concentration of 25 mmol/L [27]. For the HG and low Mg2+ (LM) condition, a customized Mg2+-free DMEM/F12 medium was used (Boster Biological Technology, Wuhan, China; Catalog#DZPYG0313). Glucose and MgSO4 were added to this medium to achieve final glucose and Mg2+concentrations of 25 mmol/L and 0.5 mmol/L, respectively [28].
Oligonucleotides encoding murine TRPM7-specific shRNA (CCTTATCAAACG) or scrambled non-effective shRNA were cloned into the pAAV-U6-CMV-Kozak-EGFP vector (Cyagen, Guangzhou, China) to produce recombinant AAV vectors in which green fluorescent protein (GFP) functioned as the expression reporter. Cells were transduced with AAVs at concentrations between 1.8 and 3 × 10⁷ PFUs/mL. Following a 48-h transduction period, the cells were utilized in subsequent experiments.
Total RNA was extracted from Müller cells using the SteadyPure Quick RNA Extraction kit (Accurate Biotechnology, Changsha, China). This was subsequently reverse transcribed into complementary DNA using a Reverse Transcription kit as recommended by the manufacturer. Quantitative real-time PCR (qPCR) was carried out with the SYBR Green Premix Pro Taq HS qPCR kit (Accurate Biotechnology) and the QuantStudio™ 5 Real-Time PCR System (Thermo, MA, USA). The primer sequences for qPCR were: TRPM7, forward (F): 5′-CAGCTTTGTTACCGGATTGGTT-3′; reverse (R): 5′-GTGGAGGTACAGGAACGAAGG-3′; VEGF, F: 5′-CTGCTGTAACGATGAAGCCCTG-3′; R: 5′-GCTGTAGGAAGCTCATCTCTCC-3′; VDAC-1, F: 5′-TGTCGCCAAATGCAACTGTG-3′; R: 5′-AAGGTGAGCTTCAGTCCACG-3′; GAPDH, F: 5′-CAATGACCCCTTCATTGACC-3′; R: 5′-GACAAGCTTCCCGTTCTCAG-3′. The 2-ΔΔCt method was used to calculate the relative expression level of various genes.
RIPA lysis buffer was used to extract total protein from Müller cells, as recommended by the manufacturer (Epizyme Biotech, Shanghai, China). A BCA protein assay kit was used to determine the protein concentration (Epizyme Biotech). Proteins were separated using SDS-PAGE and then transferred to PVDF membranes. QuickBlock™ Western blocking solution (Beyotime Institute of Biotechnology, Shanghai, China) was used to block the membranes for 15 min at 37 °C, after which they were incubated for 16 h at 4 °C with the following anti-mouse primary antibodies: TRPM7 (Cat#: ab245408, 1:5000, Abcam, Cambridge, UK), VEGF (Cat#: ab32152, 1:5000, Abcam, Cambridge, UK), voltage-dependent anion channel 1 (VDAC1) (Cat#: AF1027, 1:1000, Beyotime, China) and β-actin (Cat#: ab8227, 1:5000, Abcam, Cambridge, UK). The membranes were then incubated for 1 h at room temperature with corresponding secondary antibody, and the protein bands visualized with a chemiluminescence reagent (Beyotime, China).
The Cell Counting Kit-8 (CCK-8) assay was used to assess cell viability, as recommended by the manufacturer (Beyotime, China). Cells cultured in 96-well plates (1000 cells/well) were incubated at 37 °C for 2 h with CCK-8 solution (10 μL/well), followed by measurement of the absorbance at 450 nm using a microplate reader (Biotek Instruments Inc., USA).
For the analysis of apoptosis, cells were grown in 6-well plates and the culture medium containing floating cells was collected into centrifuge tubes. Adherent cells were washed once with phosphate-buffered saline (PBS), and the wash buffer was combined with the previously collected medium. Cells were detached by adding a 0.25% trypsin solution without EDTA to each well, causing them to round up. Trypsinization was stopped by adding complete culture medium. Cells were gently pipetted to ensure a single-cell suspension and then added to the same centrifuge tubes containing the original medium and washes. The cell suspension was centrifuged for 5 min at 4 °C at a speed of 300–400 ×g. After carefully discarding the supernatant, the cell pellet was resuspended in cold PBS and the cells were washed twice by repeating the centrifugation step.
The Annexin V-fluorescein isothiocyanate (FITC) apoptosis kit (Beyotime, China) was subsequently used to evaluate apoptosis in the Müller cells by flow cytometry. Briefly, cells were resuspended in Annexin V binding buffer (1×) at a density of 1 × 10⁶ cells/mL. One hundred µL of this cell suspension was then stained by incubating with FITC Annexin V (5 µL) and propidium iodide (5 µL) in the dark for 15 minutes at room temperature. After incubation, 400 µL of binding buffer (1×) was added and the samples analyzed with a BD Accuri™ C6 Plus Cytometer (BD Biosciences, USA).
Measurement of MMP was performed using an enhanced MMP assay kit with JC-1 (Beyotime, China) and flow cytometry. Following collection and resuspension in PBS, cells were incubated for 20 min with JC-1 solution at 37 °C in 5% CO2, as recommended by the manufacturer. Subsequently, a microplate reader (Biotek Instruments Inc., USA) was used to measure fluorescence at 527 nm (JC-1 monomers) and 590 nm (JC-1 aggregates). The ratio of the fluorescence intensity of aggregates to that of monomers indicated changes in MMP, with a decreasing ratio indicating mitochondrial depolarization.
Opening of the mPTP was examined by cobalt quenching of Calcein-(acetoxymethyl ester) AM fluorescence with an mPTP Assay Kit (Beyotime, China). This green fluorescent dye accumulates in the mitochondria of living cells. When the mPTP opens, cytosolic Co2+ enters the mitochondria and forms a complex with Calcein-AM, causing the mitochondrial green fluorescent to diminish or disappear. In brief, cells were collected, resuspended in PBS, then incubated in the dark with Calcein-AM and CoCl2 for 30 min at 37 °C, as recommended by the manufacturer. After washing 2–3 times with PBS, cell fluorescence was detected with a laser scanning confocal microscope (40×, Leica, Germany) and an Olympus FluoView FV1000 Confocal Microscope. The analysis of fluorescence was conducted with ImageJ software version 1.53i (https://imagej.nih.gov/ij/; Bethesda, USA).
Fura-2 AM is a membrane-permeable, Ca2+-sensitive fluorescent dye (Thermo Fisher Scientific, USA). It was used in this study to measure intracellular Ca2+ levels in Müller cells using a microplate reader (Tecan Infinite M200®, Switzerland), as previously reported [29]. Therefore, intracellular Ca2+ levels in individual wells are determined by the fluorescence emission intensity at 510 nm at alternating excitation wavelengths of 340 and 380 nm. In brief, cells were seeded into 96-well culture plates at a density of 3.0 × 10⁴ cells/well. After washing with PBS, they were loaded with dye solution and incubated in the dark for 1 h at room temperature. The fluorescence emission intensity at 510 nm at alternating excitation wavelengths of 340 and 380 nm was then determined for individual wells in a microplate reader with Tecan i-Control software (Männedorf, Switzerland). The ratio of the 510 nm emission in response to 340/380 nm excitation was calculated and normalized to the control.
The intracellular Adenosine triphosphate (ATP) level in Müller cells was measured with an enhanced ATP Assay Kit (Beyotime, China) as recommended by the manufacturer. In brief, cells were first lysed with lysis buffer and the supernatant collected. Standard working solutions of ATP were made by serial dilutions of the ATP stock solution. The samples and ATP standard working solutions were subsequently added to individual wells, and the bioluminescence measured utilizing a microplate reader (Biotek Instruments Inc., USA) in luminometer mode. The ATP concentration was then calculated based on an ATP standard curve.
The intracellular ROS level in Müller cells was measured with a Reactive Oxygen Species kit (Beyotime, China). Briefly, cells were incubated in the dark with 10 μM DCFH-DA for 20 min at 37 °C, then washed with PBS. The fluorescence intensity, representing the intracellular ROS level, was determined with an Olympus IX 73 microscope (Olympus, Japan).
The levels of cellular malondialdehyde (MDA), superoxide dismutase (SOD), and glutathione (GSH), as well as the nicotinamide adenine dinucleotide phosphate (NADP+)/nicotinamide adenine dinucleotide hydrogen (NADPH) ratio, were evaluated using corresponding assay kits for MDA, SOD, GSH, and NADP+/NADPH, as recommended by the manufacturer (Beyotime, China). Measurements were obtained with a microplate reader (Biotek Instruments Inc., USA), and corresponding standard curves were used to calculate the concentration.
Measurement data were analyzed by two-way ANOVA and SPSS 25 statistical analysis software (IBM Corp. Armonk, New York, USA). The least significant difference method (LSD) was used to compare homogeneity of variance, and a non-parametric test to determine non-uniformity of variance. Data are presented as the mean ± standard error of the mean (SEM). Results with a p-value of <0.05 were considered significantly different, and those with a p-value of <0.01 as highly significant.
We first evaluated the effects of low Mg2+ on cell viability and VEGF expression in Müller cells under HG conditions. LM/HG treatment for 48 h was found to markedly reduce cell viability and increase apoptosis compared with HG treatment alone (Fig. 1A–C). WB and PCR analyses revealed that both VEGF mRNA and protein levels were significantly increased by LM/HG treatment compared with HG treatment alone (Fig. 1D–F). These data demonstrate that low Mg2+ exacerbates injury to Müller cells under HG stress.
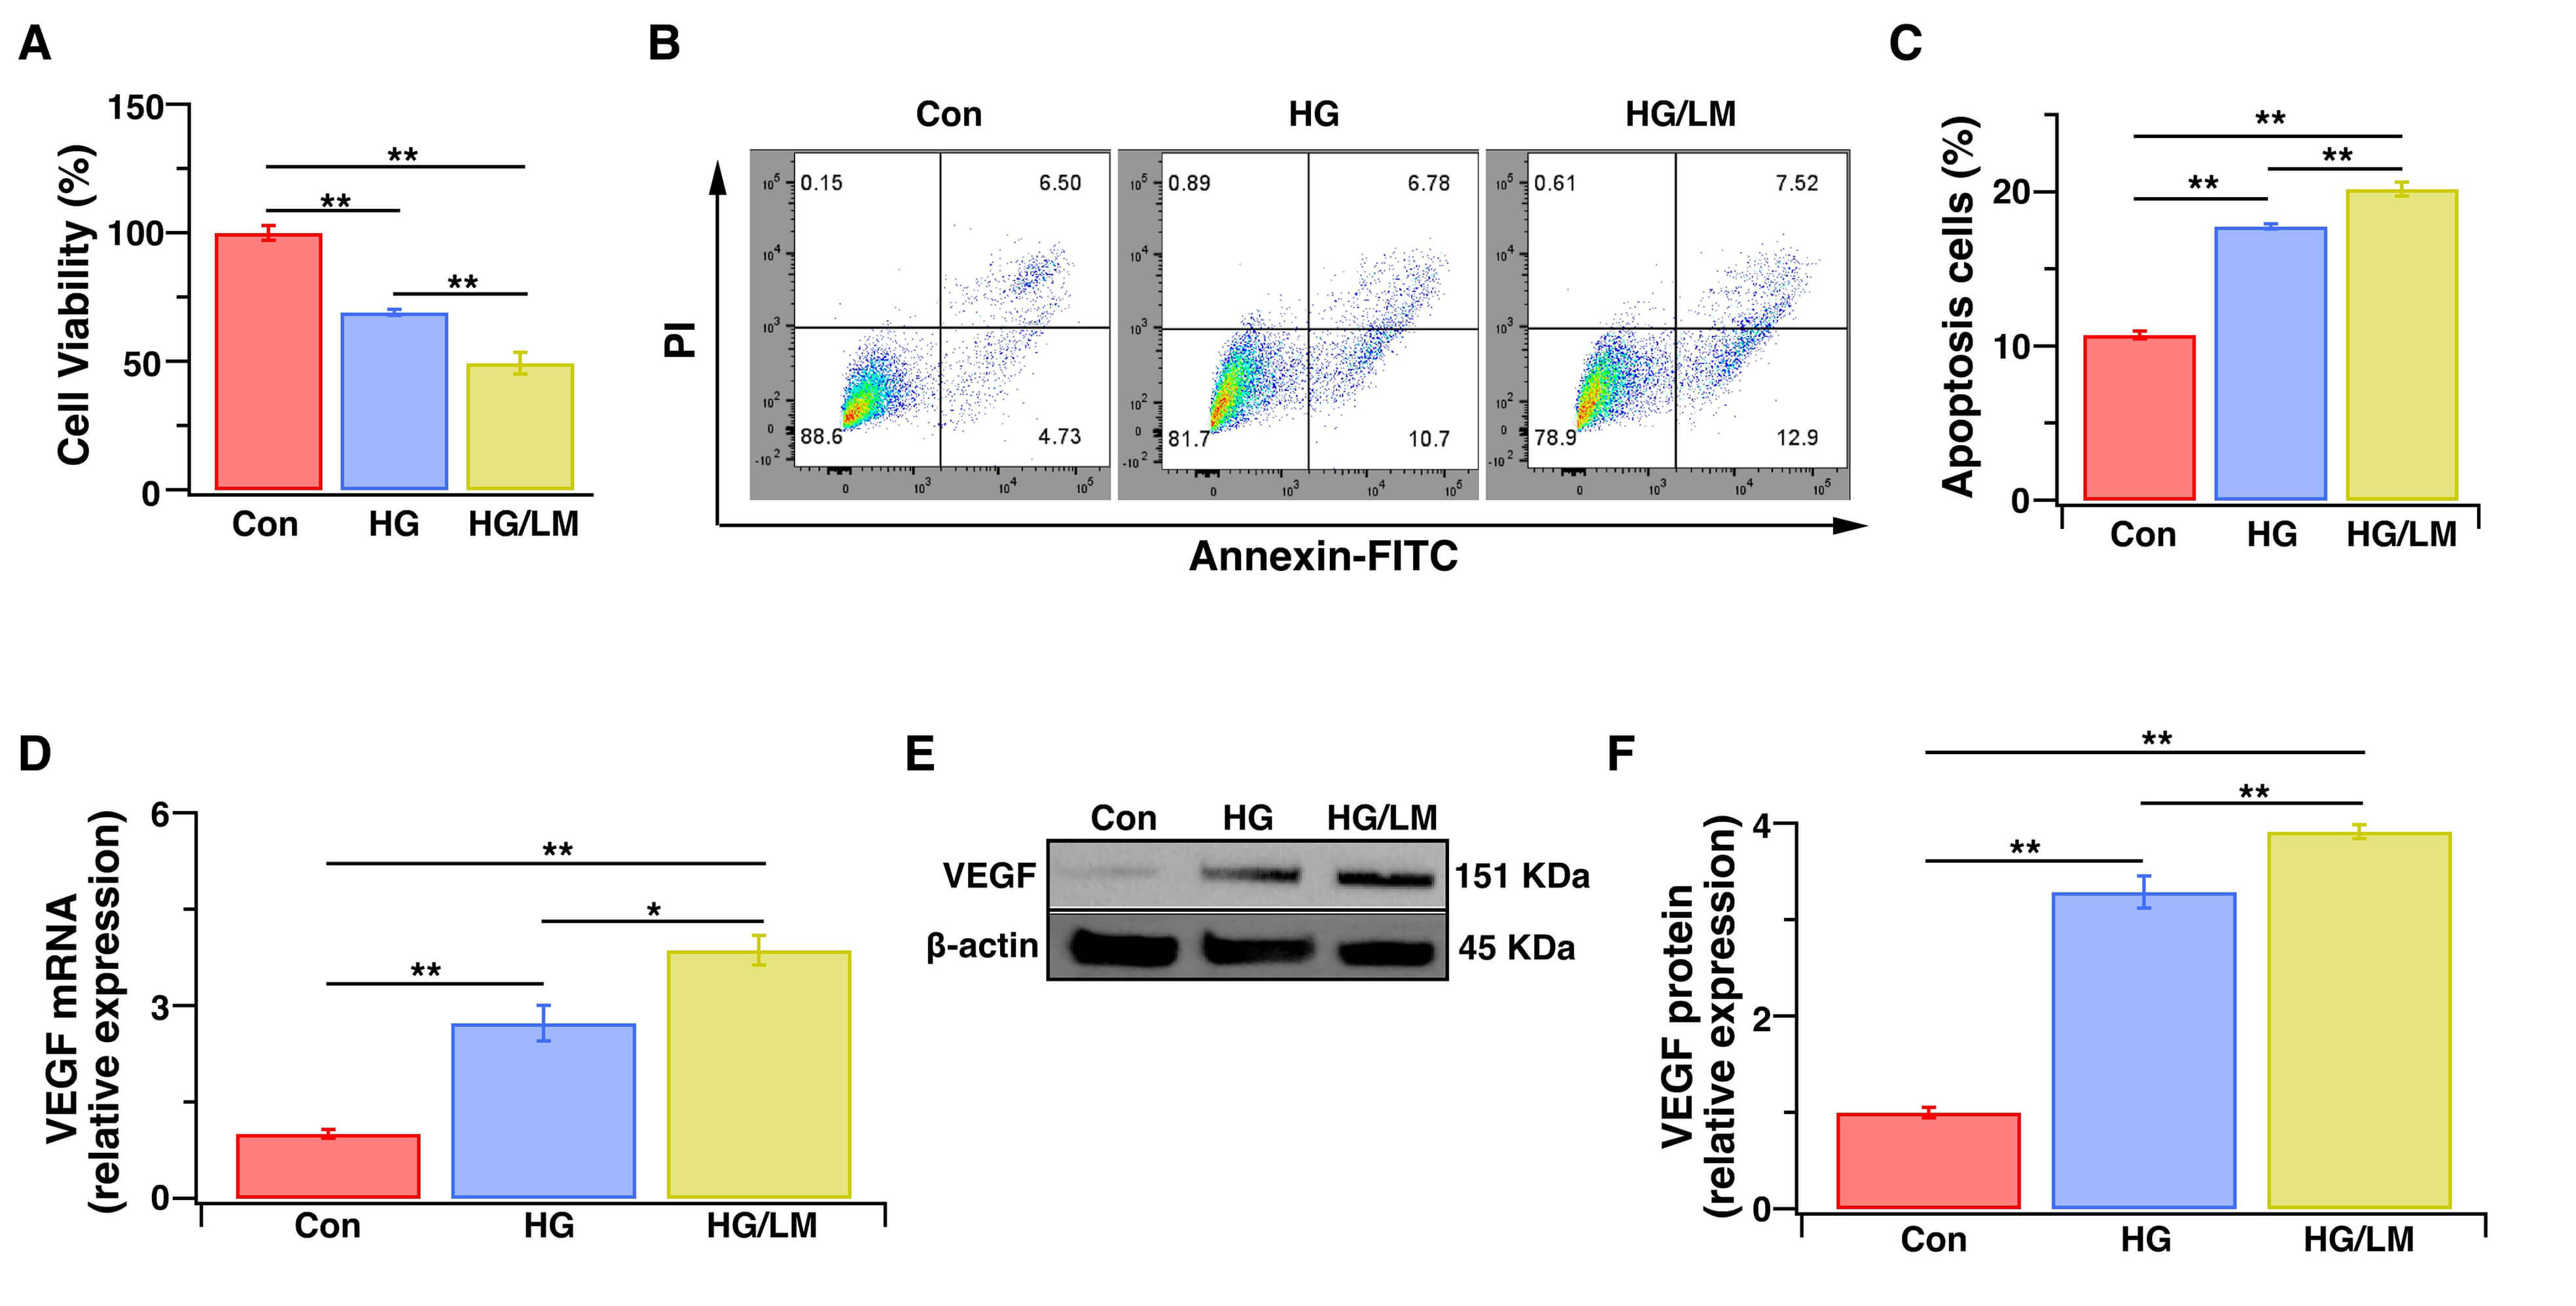 Fig. 1.
Low Mg2+ exacerbates the injury of Müller cells under HG stress. Müller cells were treated for 48 h with HG (25 mM), with or without LM (0.5 mM). (A) The CCK-8 assay was used to evaluate cell viability, expressed as the percentage of optical density relative to control cells (100%) (n = 5). (B) Flow cytometry: representative image of dot plot analysis. Flow cytometry was used to analyze cell apoptosis with the Annexin V-FITC/PI assay. (C) Histogram showing the percentage of apoptotic cells (n = 5 independent experiments). (D) VEGF gene expression level as determined by qPCR (n = 5). (E,F) VEGF protein expression level as determined by WB analysis (n = 3). Relative gene and protein expression levels were normalized to the level of β-actin. Con, cells cultured in basal media containing normal glucose and Mg2+; HG, cells cultured in media containing high glucose; HG/LM, cells cultured in media containing high glucose and low Mg2+; PI, propidium iodide; FITC, fluorescein isothiocyanate; VEGF, vascular endothelial growth factor; qPCR, quantitative real-time PCR; SEM, standard error of the mean. Data are presented as mean ± SEM. *p < 0.05, **p < 0.01.
Oxidative stress is a major pathogenic mechanism through which low Mg2+ disrupts cellular function, and also plays a central role in DR [30,31]. Therefore, we evaluated the impact of low Mg2+ on oxidative stress in Müller cells exposed to HG. LM/HG treatment for 48 h induced more severe oxidative damage, as manifested by increased ROS compared with HG treatment alone (Fig. 2A,B). Moreover, LM/HG reduced SOD activity (Fig. 2C) and GSH (Fig. 2D), increased MDA production (Fig. 2E), and increased the NADP⁺/NADPH ratio (Fig. 2F). These findings indicate that low Mg2+ amplifies oxidative stress, thereby compromising the function of Müller cells under HG conditions.
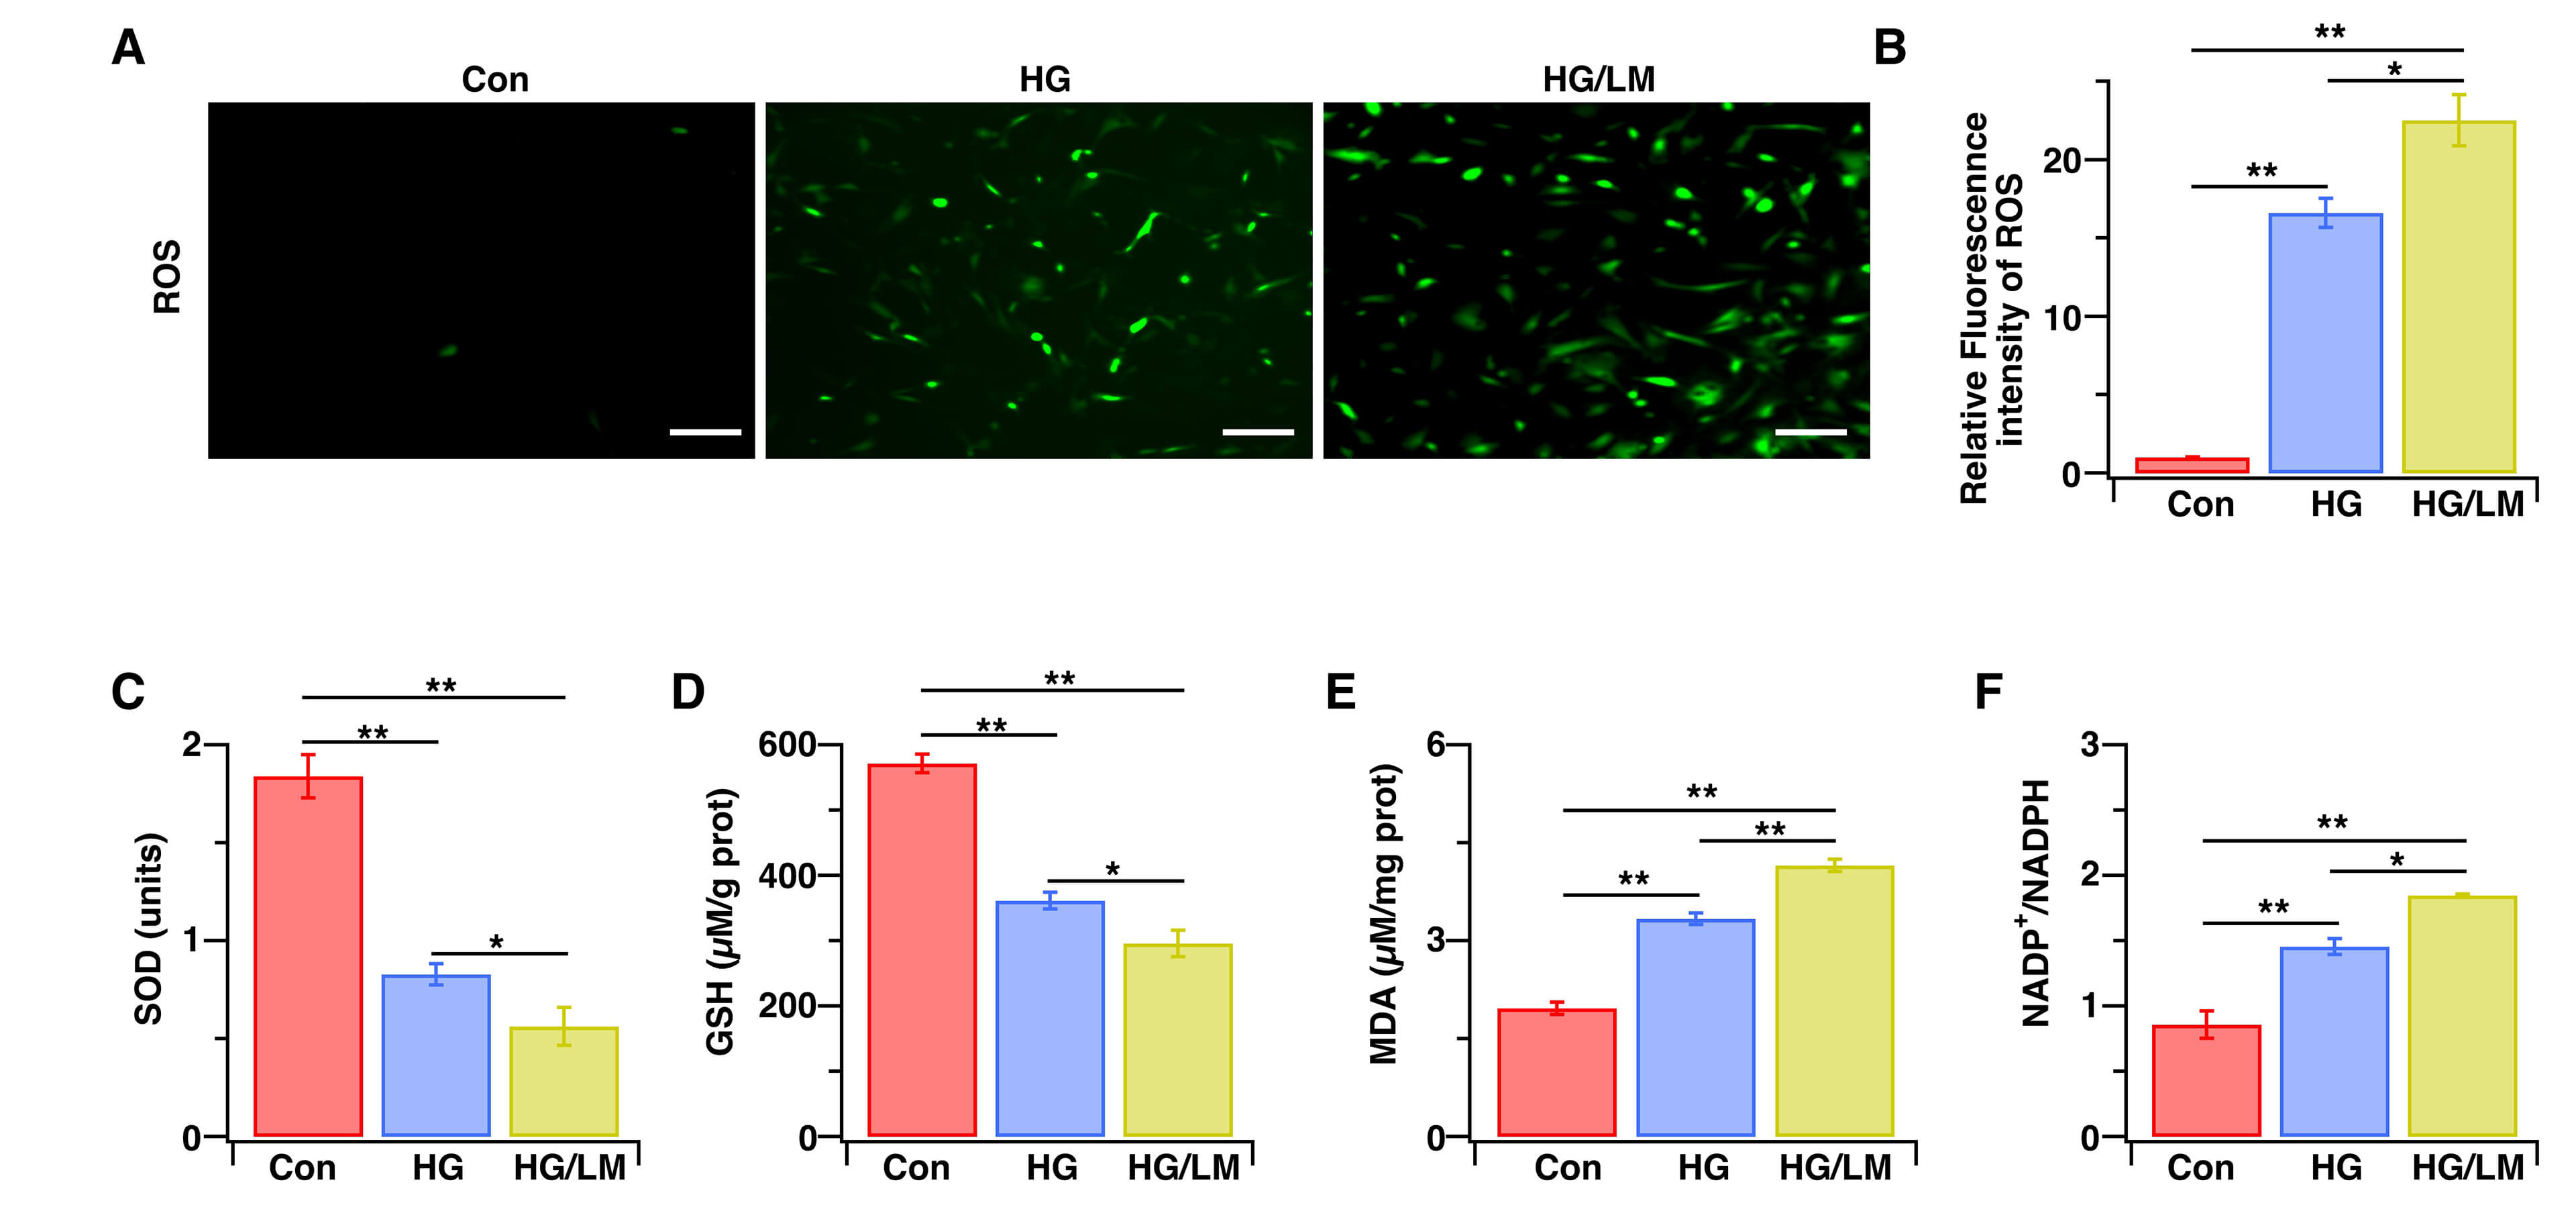 Fig. 2.
Low Mg2+ aggravates oxidative stress in Müller cells under HG stress. Müller cells were treated for 48 h with HG (25 mM), with or without LM (0.5 mM). (A) Representative fluorescent images of ROS. (B) Intracellular ROS levels were measured by immunofluorescence intensity and then normalized to control cells (n = 6). (C–F) SOD, GSH, and MDA levels, as well as the NADP+/NADPH ratio, were evaluated using corresponding assay kits (n = 4–5). Data are presented as the mean ± SEM; **p < 0.01, *p < 0.05. Scale bars: 200 μm. ROS, reactive oxygen species; SOD, superoxide dismutase; GSH, glutathione; MDA, malondialdehyde; NADP+/NADPH, nicotinamide adenine dinucleotide phosphate/nicotinamide adenine dinucleotide hydrogen.
TRPM7-mediated Ca2+ signaling is a key factor in oxidative stress-dependent cell death [32,33]. Ca2+-induced up-regulation of VDAC1 expression is also associated with the induction of cell death [34]. We next examined whether low Mg2+ worsens HG toxicity in Müller cells through TRPM7-mediated Ca2+ signaling, which subsequently induces VDAC1-mediated mitochondrial dysfunction. We therefore evaluated TRPM7 expression and the intracellular Ca2+ level, as well as the mitochondrial function markers of intracellular ATP, mPTP opening, MMP, and mitochondrial VDAC1. Compared with HG treatment alone, LM/HG treatment for 48 h markedly upregulated TRPM7 gene and protein expression (Fig. 3A–C), enhanced mPTP opening (Fig. 3D), and increased VDAC1 gene and protein expression (Fig. 3E–G). Moreover, LM/HG treatment resulted in more severe mitochondrial dysfunction, as evidenced by reduced MMP (Fig. 3H), decreased ATP production (Fig. 3I), and increased intracellular Ca2+ levels (Fig. 3J). To determine whether TRPM7 upregulation connects Ca2+ overload to mitochondrial injury, we transduced Müller cells with TRPM7-specific shRNA and validated the knockdown efficiency (Fig. 4A–C). Under LM/HG conditions, the silencing of TRPM7 largely preserved mitochondrial function (Fig. 4D–I) and significantly attenuated the increase in intracellular Ca2+ level (Fig. 4J). These data indicate that low Mg2+ activates the TRPM7/Ca2+/VDAC1 axis, leading to mitochondrial dysfunction in Müller cells during HG stress.
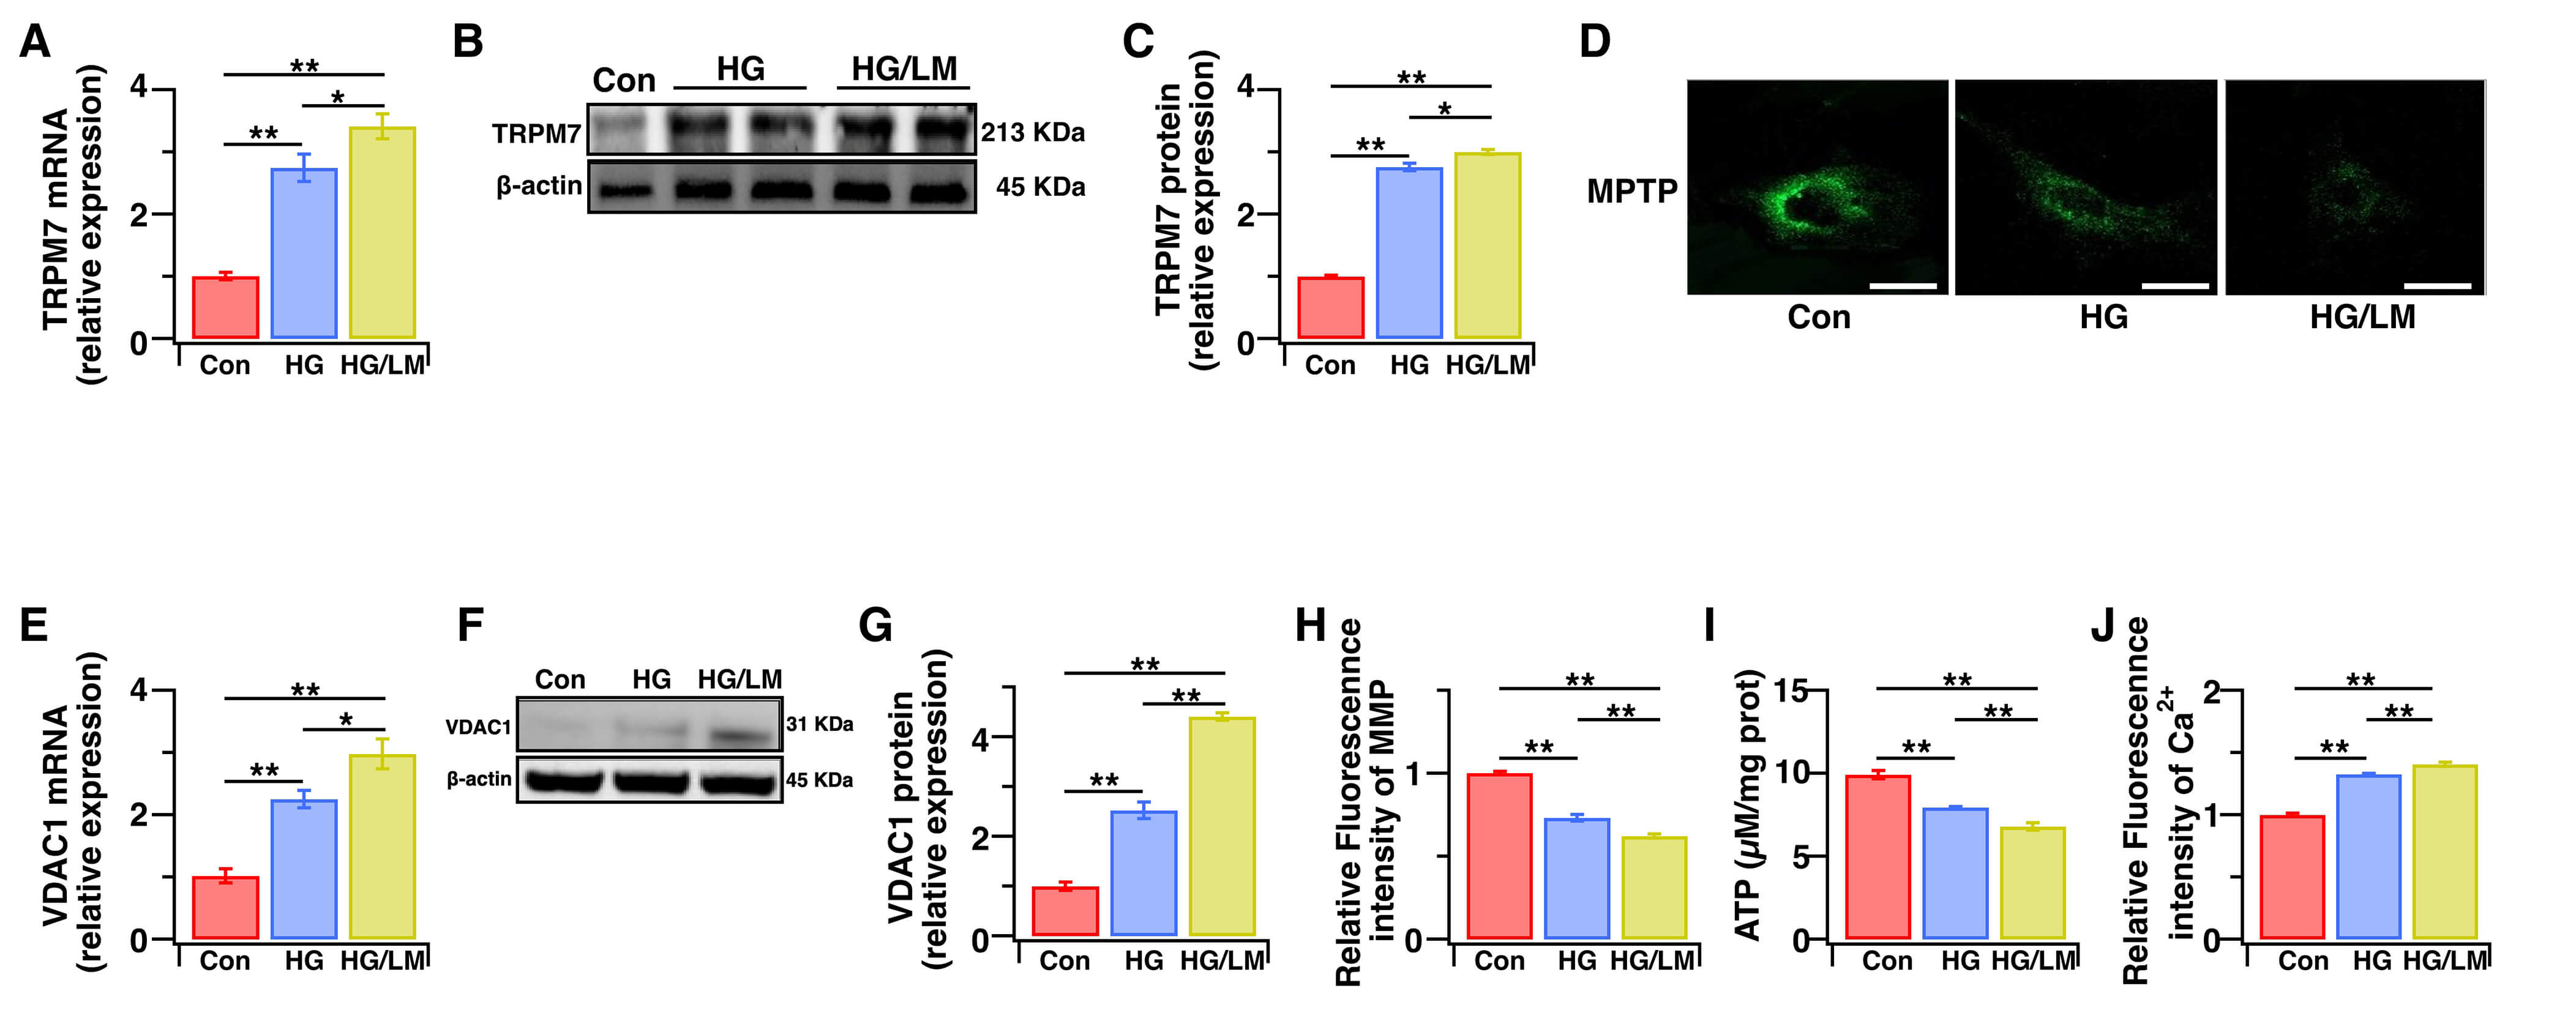 Fig. 3.
Low Mg2+ upregulates the TRPM7/Ca2+/VDAC1 axis, leading to mitochondrial dysfunction in Müller cells under HG stress. Müller cells were treated for 48 h with HG (25 mM), with or without LM (0.5 mM). (A) The TRPM7 gene expression level was quantified using qPCR (n = 6). (B,C) The TRPM7 protein expression level was determined using WB analysis (n = 4). (D) Opening of mPTP was determined by cobalt quenching of Calcein-AM fluorescence using an mPTP Assay Kit. (E) The VDAC1 gene expression level was determined by qPCR (n = 5). (F,G) The VDAC1 protein expression level was determined using WB analysis (n = 4). (H) Relative levels of MMP were quantified by measuring JC-1 fluorescence intensity and then normalizing to the control cells (n = 5). (I) The intracellular levels of ATP were measured with an ATP kit (n = 5). (J) Relative intracellular Ca2+ levels were quantified by measuring Fura-2 AM fluorescence intensity and then normalizing to the control cells (n = 5). The relative levels of gene and protein expression were normalized to β-actin. Data are presented as the mean ± SEM, **p < 0.01, *p < 0.05. Scale bars: 50 μm. TRPM7, Transient Receptor Potential Cation Channel, Subfamily M, Member 7; VDAC1, voltage-dependent anion channel 1; ATP, Adenosine triphosphate; mPTP, Mitochondrial Permeability Transition Pore; WB, Western Blot; MMP, Mitochondrial Membrane Potential; AM, acetoxymethyl ester.
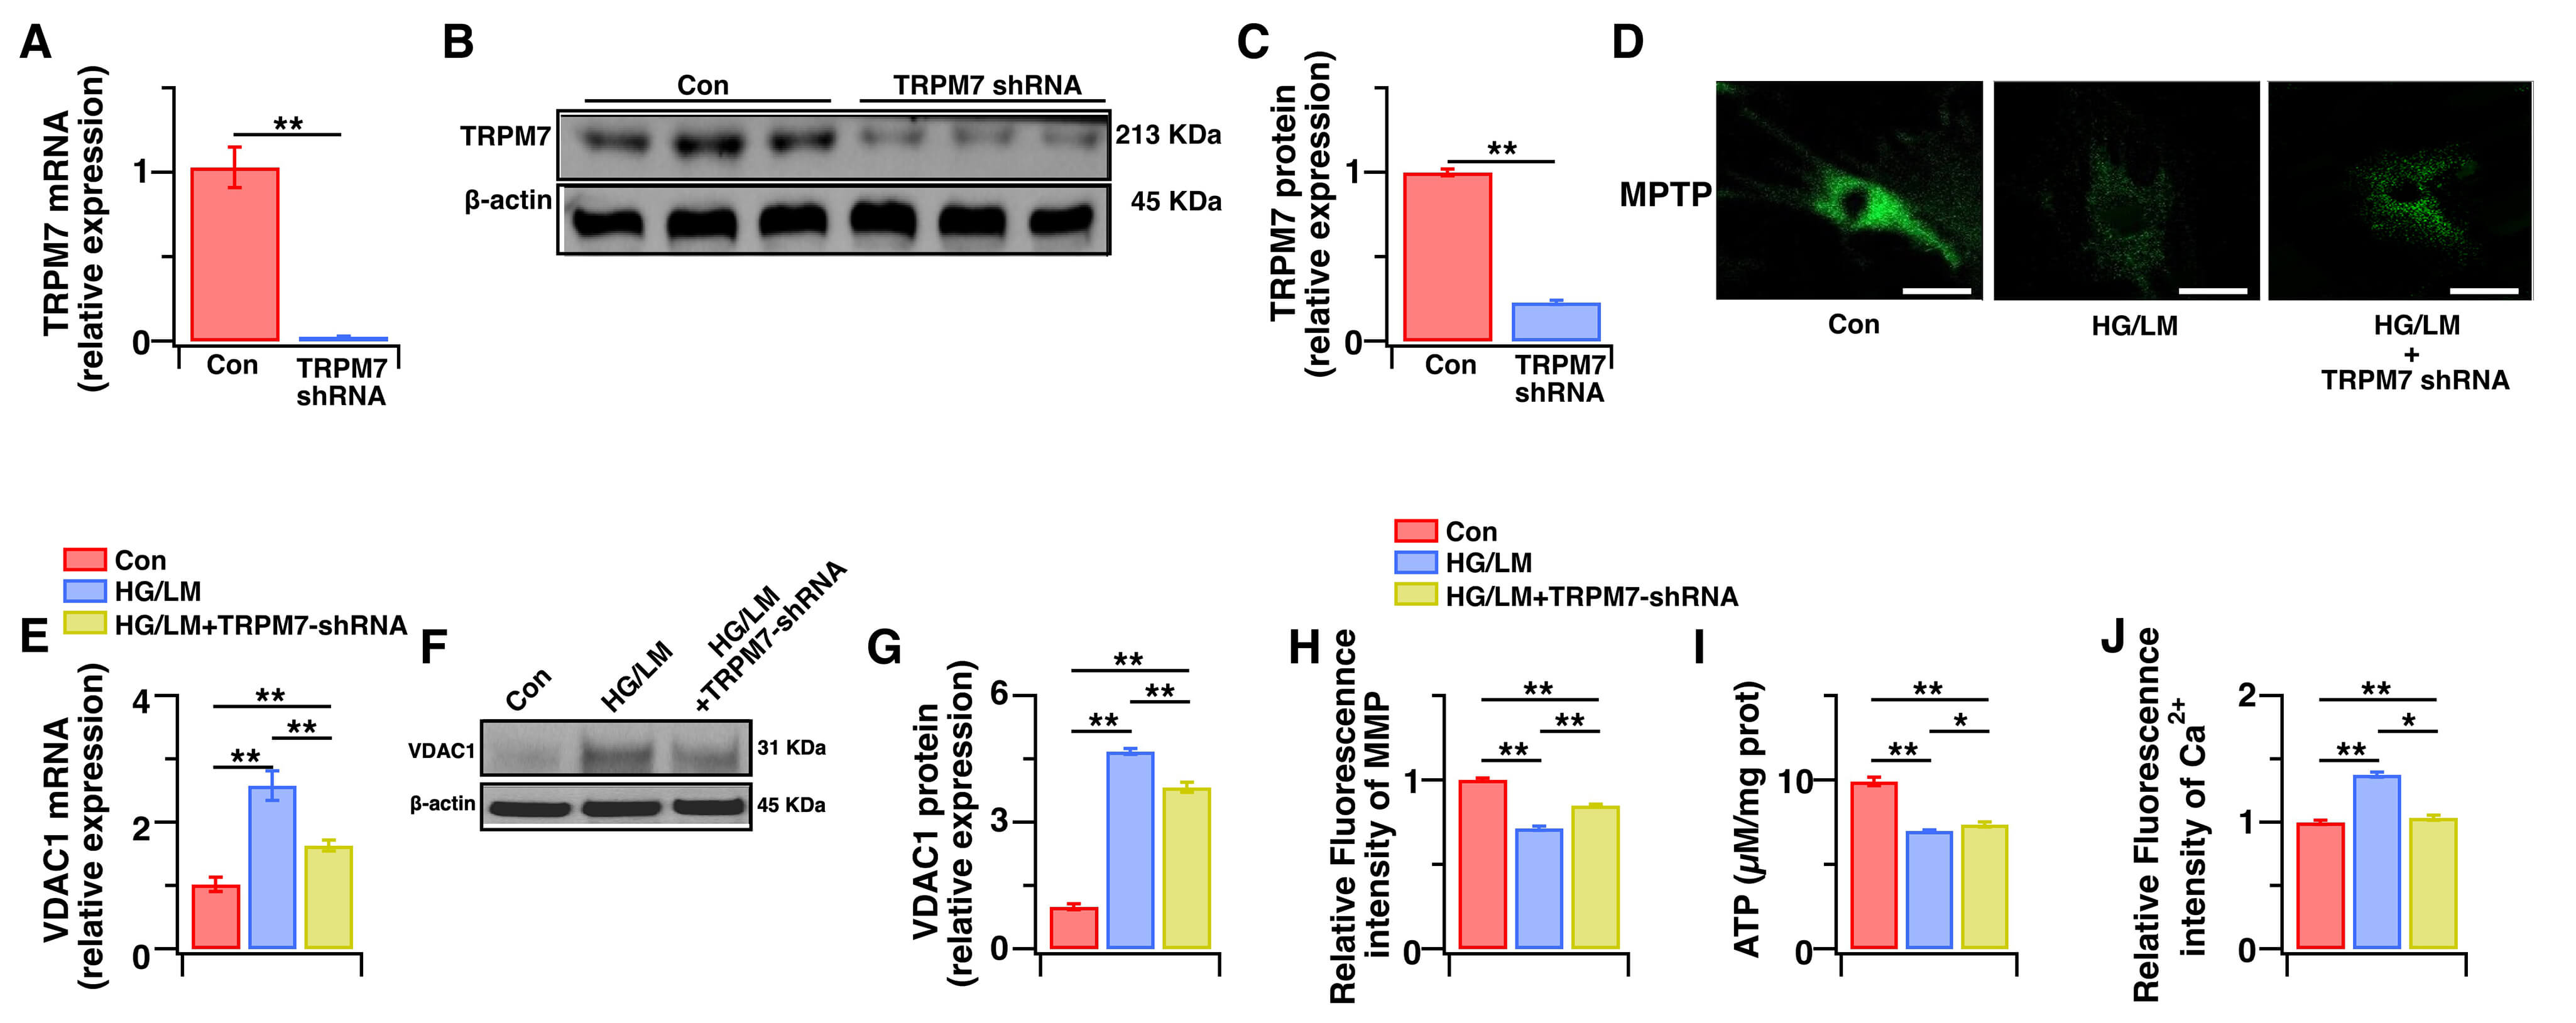 Fig. 4.
The effects of TRPM7 silencing on intracellular Ca2+ levels and mitochondrial function in Müller cells under HG and LM stress. Control Müller cells, or Müller cells transfected with TRPM7-specific shRNA were treated for 48 h with HG (25 mM), with or without LM (0.5 mM). (A) The TRPM7 gene expression level was determined by qPCR (n = 5). (B,C) The TRPM7 protein expression level was determined by WB analysis (n = 4). (D) Opening of mPTP was determined by cobalt quenching of Calcein-AM fluorescence using the mPTP Assay Kit. (E–G) VDAC1 gene and protein expression levels were evaluated using qPCR and WB analysis, respectively (n = 4–5). (H) Relative levels of MMP were quantified by measuring JC-1 fluorescence intensity and then normalizing to the control cells (n = 5). (I) The intracellular levels of ATP were measured with an ATP kit (n = 5). (J) Relative intracellular Ca2+ levels were quantified by measuring Fura-2 AM fluorescence intensity and then normalizing to the control cells (n = 5). Relative levels of gene and protein expression were normalized to β-actin. Data are presented as mean ± SEM. **p < 0.01, *p < 0.05. Scale bars: 50 μm.
Finally, we examined whether TRPM7 knockdown protects Müller cells from oxidative stress and functional impairment under LM/HG conditions. After LM/HG treatment for 48 h, TRPM7-silenced cells exhibited significantly lower oxidative-stress indices (Fig. 5A–F), a pronounced rescue from apoptosis (Fig. 6A,B), and a marked reduction in VEGF expression (Fig. 6C–E) compared with the control. These results demonstrate that TRPM7 mediates both the oxidative stress and dysfunction observed in Müller cells under HG/LM stress.
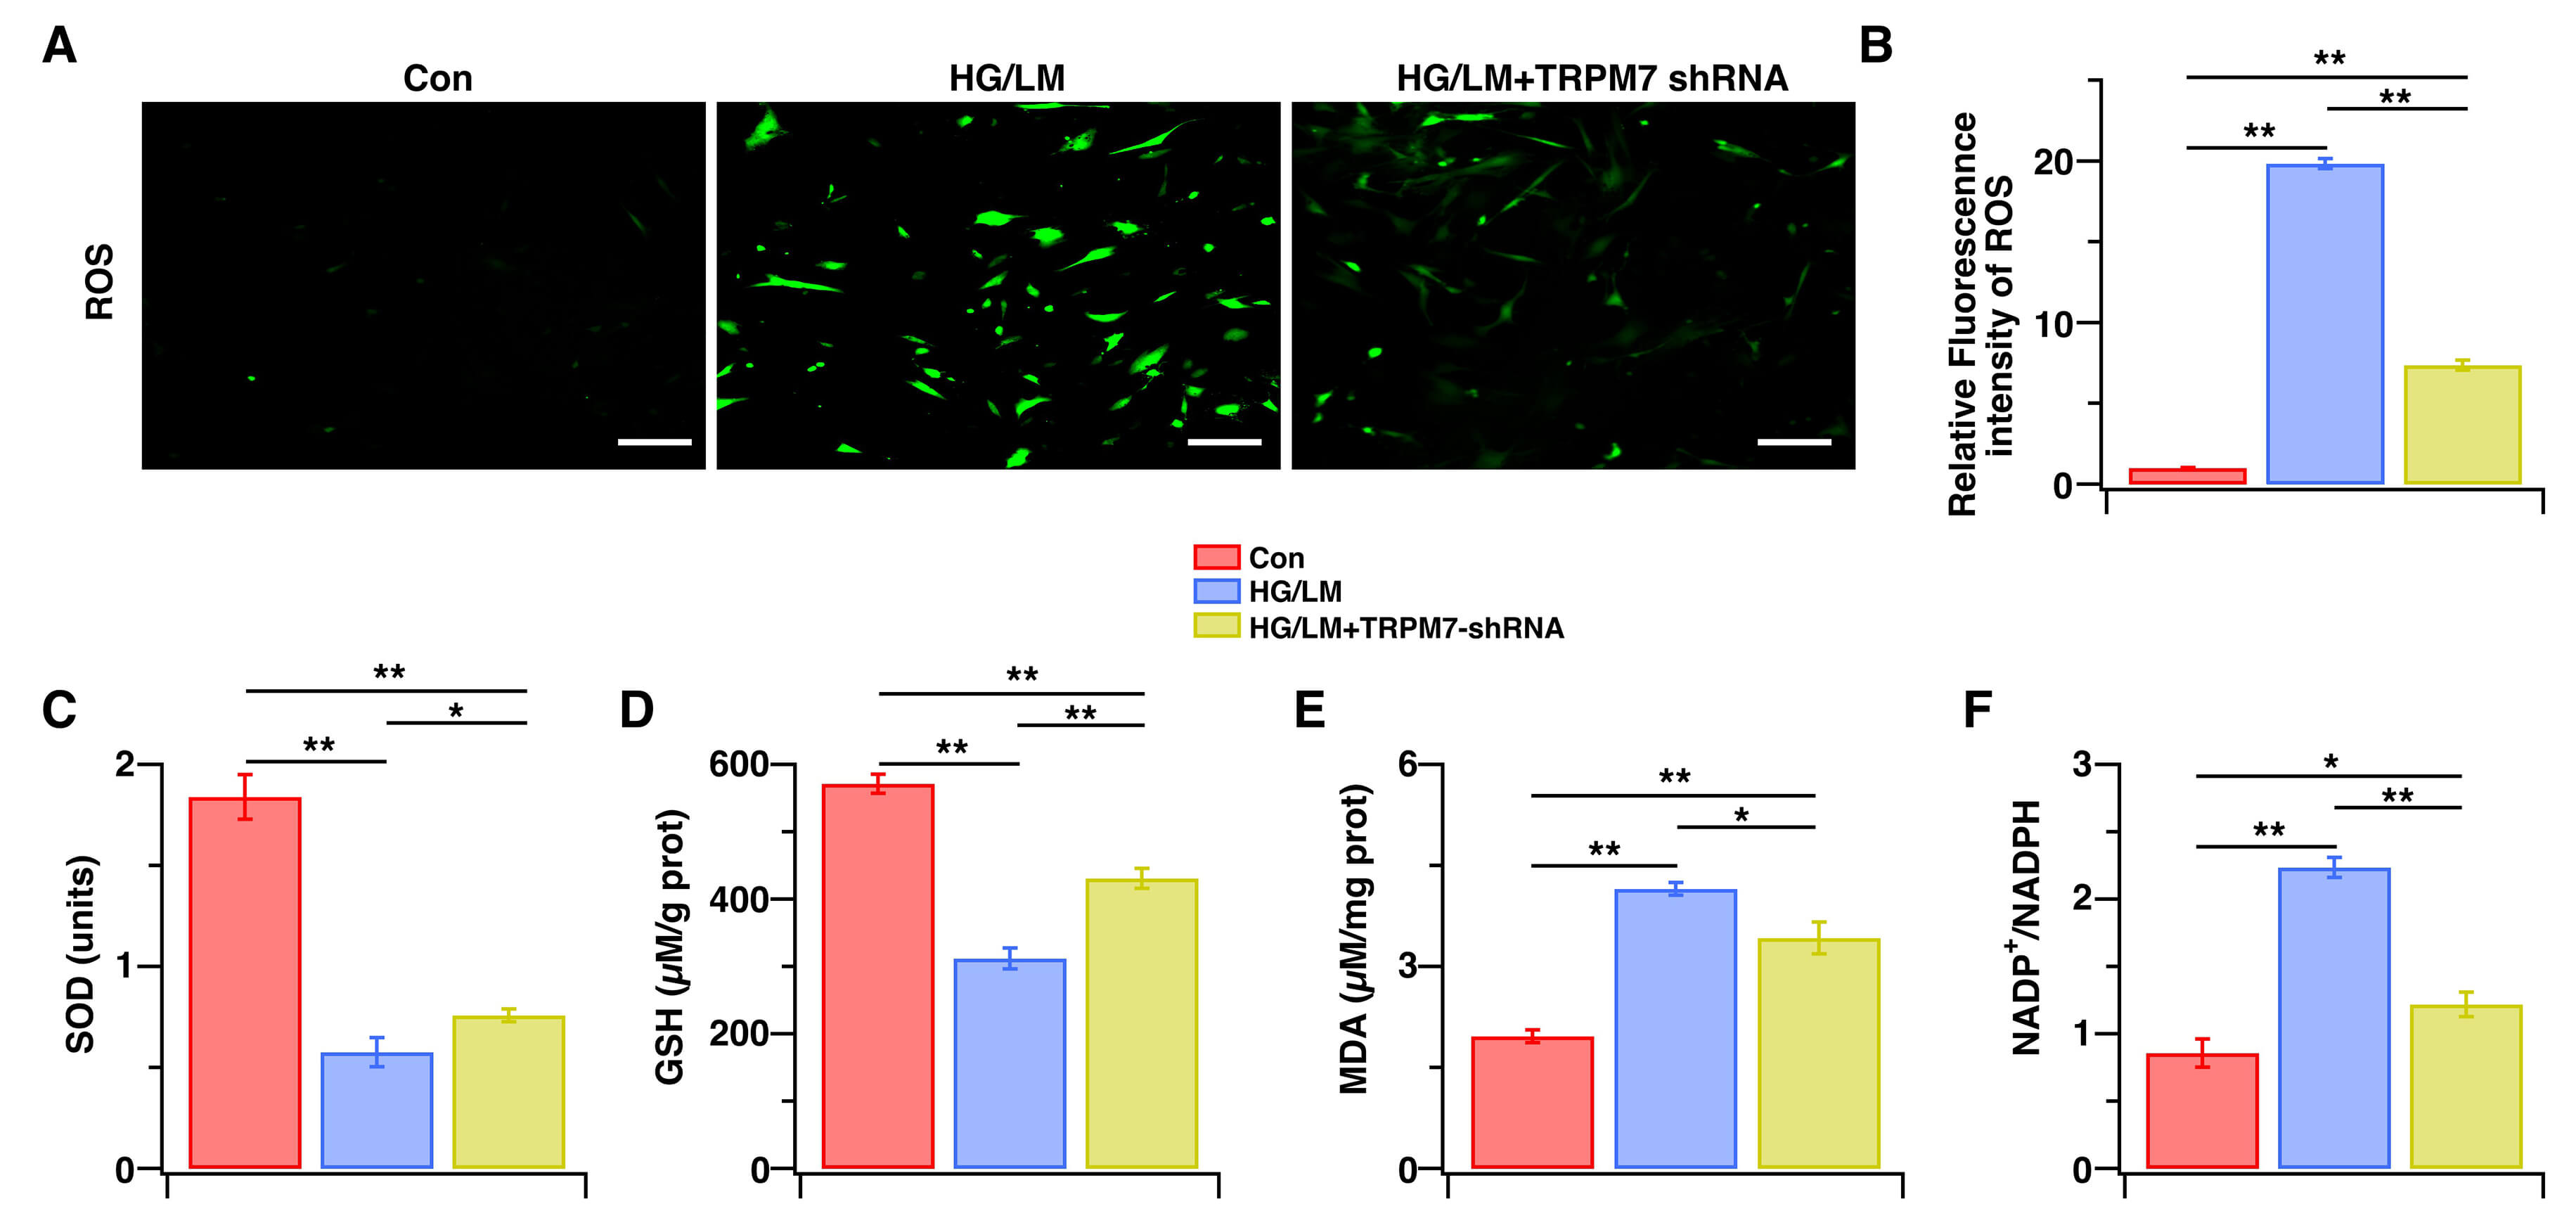 Fig. 5.
The effects of TRPM7 silencing on oxidative stress in Müller cells under HG and LM Stress. Control Müller cells, or Müller cells transfected with TRPM7-specific shRNA were treated for 48 h with HG (25 mM), with or without LM (0.5 mM). (A) Representative fluorescent images of ROS. (B) Intracellular ROS levels were measured by immunofluorescence intensity and then normalized to control cells (n = 5). (C–F) SOD, GSH, and MDA levels, as well as the NADP+/NADPH ratio, were measured with the corresponding assay kit (n = 4–5). Data are presented as mean ± SEM, **p < 0.01, *p < 0.05. Scale bars: 200 μm.
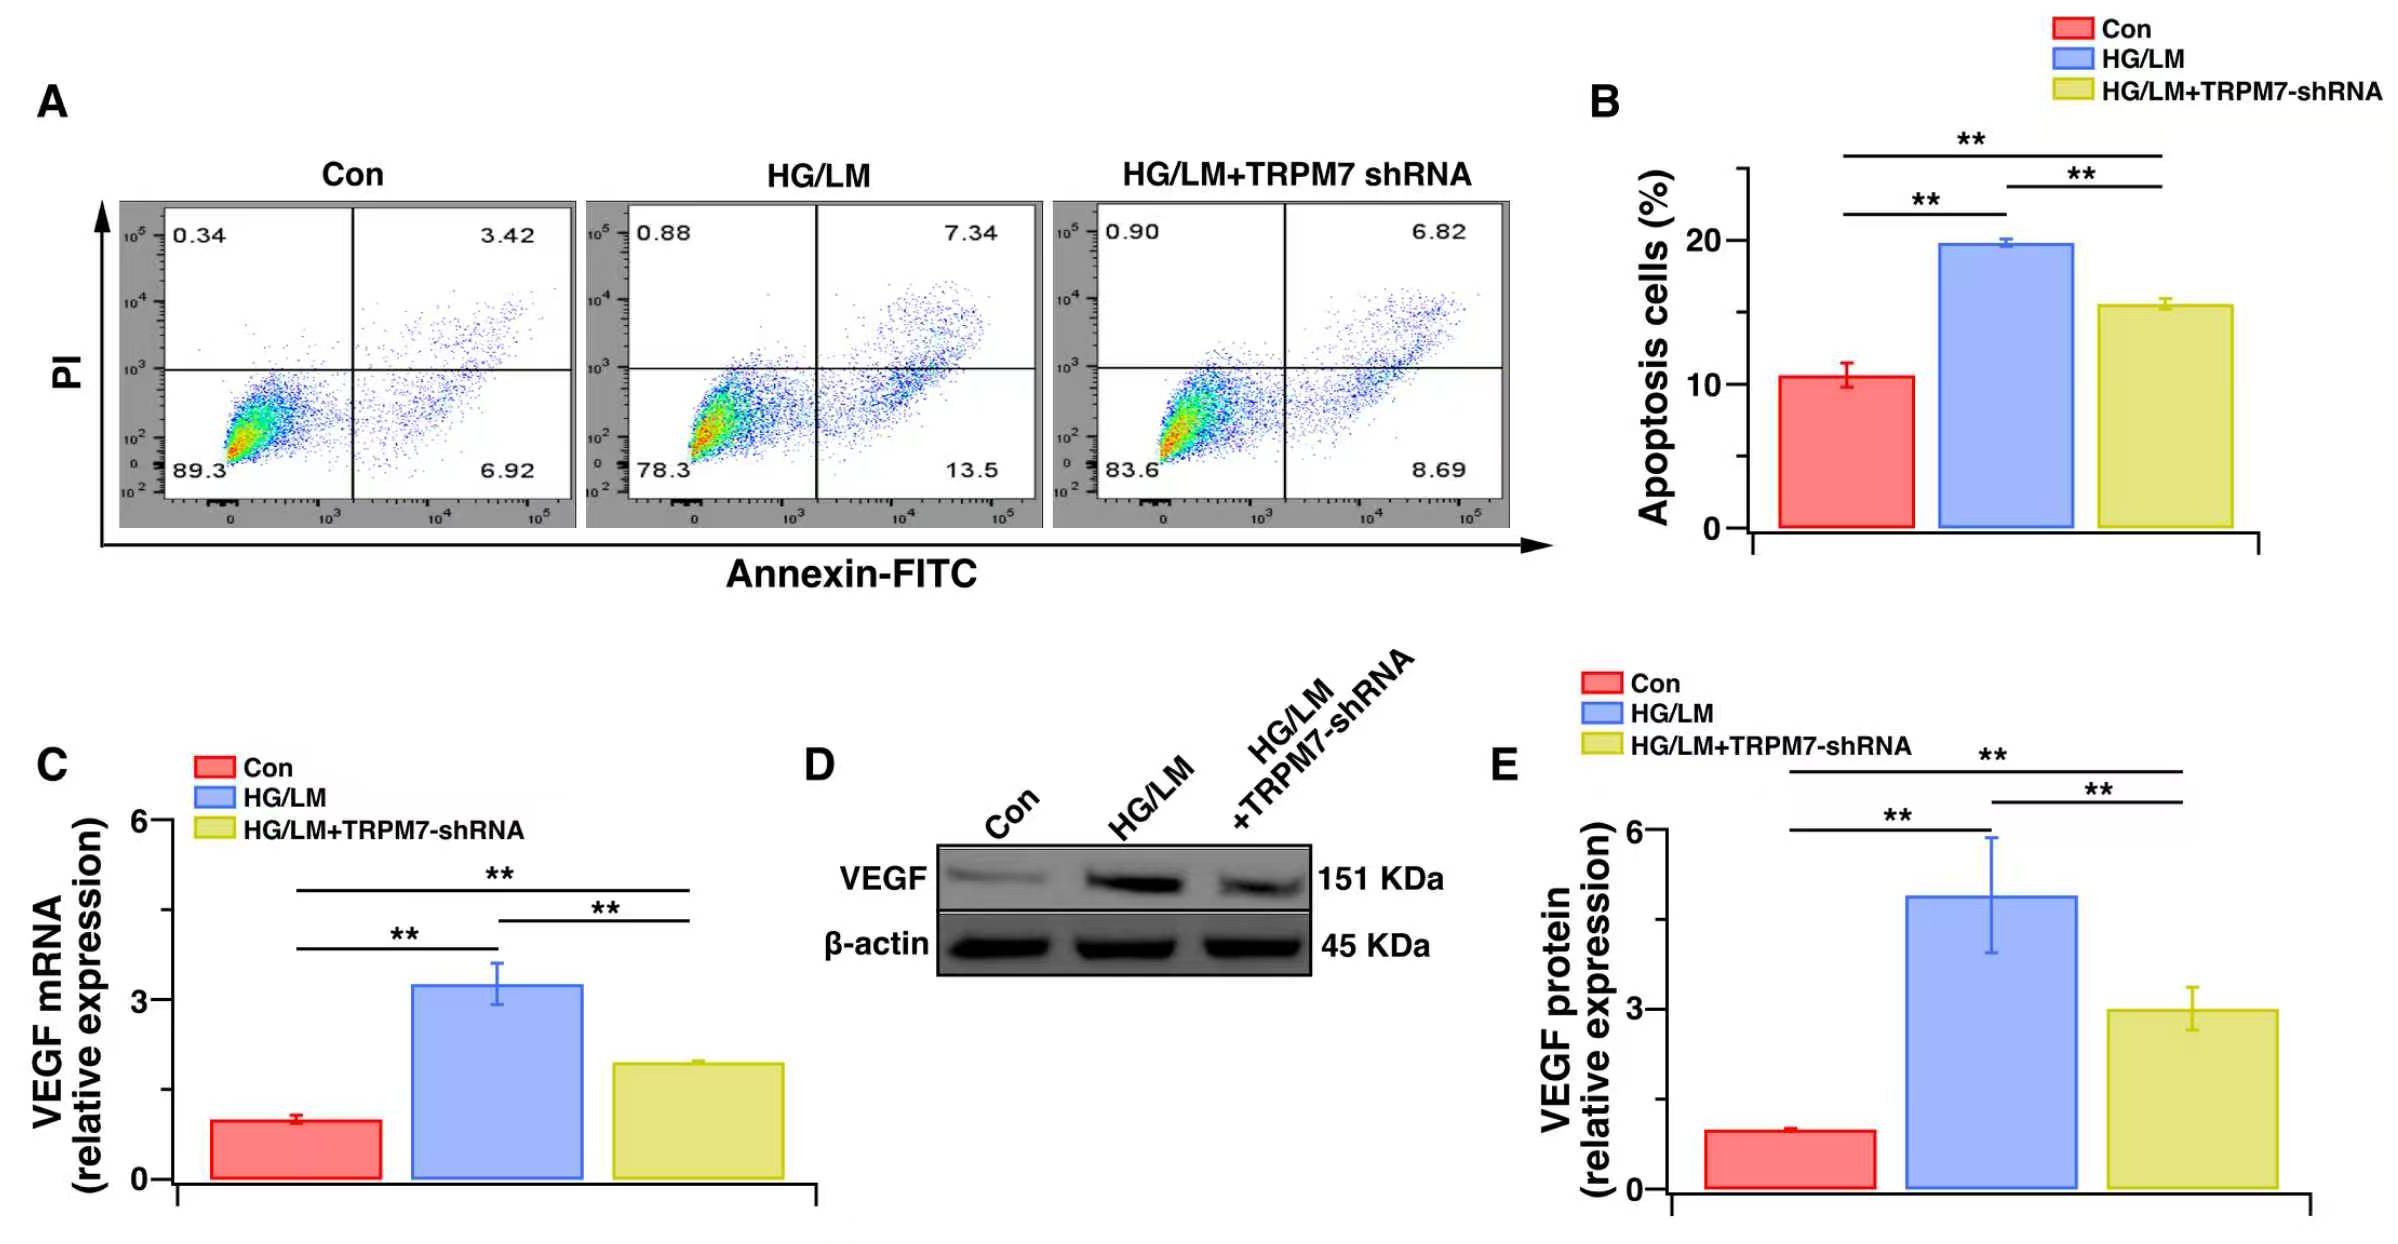 Fig. 6.
The effects of TRPM7 silencing on function and apoptosis levels in Müller cells under HG and LM Stress. Control Müller cells or Müller cells transfected with TRPM7-specific shRNA were treated for 48 h with HG (25 mM), with or without LM (0.5 mM). (A) Flow cytometry: representative image of dot plot analysis. Flow cytometry was used to analyze cellular apoptosis with Annexin V-FITC/PI staining. (B) Histogram showing the percentage of cell apoptosis (n = 4). (C) The VEGF gene expression level was determined by qPCR (n = 5). (D,E) The VEGF protein expression level was determined by WB analysis (n = 4). Relative levels of gene and protein expression were normalized to β-actin. Data are presented as mean ± SEM. **p < 0.01.
Hypomagnesemia is known to constitute an additional risk factor for DR. However, the molecular and cellular mechanisms through which low Mg2+ accelerates the onset and progression of DR remain poorly understood. The current study found that low Mg2+ exacerbates HG-induced injury of Müller cells by inducing mitochondrial dysfunction and oxidative stress. Moreover, activation of the TRPM7/Ca2+/VDAC1 axis was shown to play a major role in this process.
A key driver of DR is oxidative stress. HG-induced ROS induces mitochondrial failure, apoptosis, inflammation, and structural-functional remodeling. Together, these processes create the DR phenotype [31]. Previous studies have shown that HG-induced mitochondrial oxidative stress triggers Müller cell apoptosis, release of proinflammatory cytokines, and VEGF secretion, thereby fostering retinal neovascularization [35,36]. In the current study, we demonstrated that combined HG and LM treatment of Müller cells evokes greater mitochondrial oxidative stress, apoptosis and VEGF production compared with HG treatment alone. Thus, hypomagnesemia amplifies HG injury by intensifying mitochondrial dysfunction and oxidative stress. This is biologically plausible, since Mg2+ is an essential mitochondrial cofactor that acts as an antioxidant, anti-inflammatory, and anti-apoptotic ion. In addition, Mg2+ deficiency boosts mitochondrial ROS production while suppressing antioxidant defenses, inevitably leading to oxidative stress [37]. Similarly, Kaliaperumal et al. [38] reported that low Mg2+ increases oxidative stress, contributing to the early development of cataract formation in T2DM.
VDAC1 controls mitochondrial Ca2+ transport and is vital for mitochondria-mediated apoptosis. Weisthal et al. [34] reported that over-expression of VDAC1 caused by various apoptosis stimuli was induced by increases in the intracellular Ca2+ level. TRPM7 is a Ca2+-permeable, nonselective cation channel. TRPM7 channels, via Ca2+ signals, are implicated in a number of physiological and pathological processes, including cell adhesion and migration, anoxic neuronal death, and cardiac fibroblast differentiation [33,39,40,41]. In the present study, we found that TRPM7 and VDAC1 expression were up-regulated and accompanied by elevated intracellular Ca2+ levels in Müller cells under LM/HG conditions. These changes could be reversed by TRPM7 knockdown, indicating that activation of the TRPM7/Ca2+/VDAC1 axis underlies the mitochondrial dysfunction, oxidative stress and injury to Müller cells induced by LM/HG. A major finding of our study was that LM led to the upregulation of TRPM7 expression under HG conditions, in line with the conclusions of a related study. Liu et al. [42] reported that TRPM7 expression was upregulated in the brains of a mouse model of hypomagnesemia, and further demonstrated that TRPM7 mediates hypomagnesemia-induced, seizure-related death. These authors suggest that TRPM7 kinase may regulate changes in the TRPM7 level in response to LM. Further supporting our hypothesis, expression of the TRPs TRPV1 and TRPV4 has been reported in Müller cells. TRPV1 converts hydrostatic pressure into Ca2+ influx, causes mitochondrial oxidative stress, and induces apoptosis of Müller cells [43]. Similarly, TRPV4, another Ca2+-permeable TRP channel, is highly expressed in Müller cells under high intraocular pressure, leading to increased gliosis upon activation [44]. Consistent with our data, a recent study reported that diabetic mouse hearts develop hypomagnesemia concomitant with elevated TRPM7 expression, thereby mediating mitochondrial dysfunction and excess mitochondrial ROS [14].
Our study has several limitations. First, the function of TRPM7 in retinal Müller cells was studied only in primary cultured cells, which may differ from the corresponding in vivo cell populations in both their expression profiles and function. Consequently, it remains uncertain whether the observed phenomena also occur under in vivo conditions. However, recent studies have reported that TRPM7 is highly expressed in the murine retina, and that ischemia decreased the retinal light response. This was accompanied by reactive gliosis, as well as significantly increased expression of TRPM7, specifically within Müller cells [15]. Second, the role of TRPM7 channels in Müller cells was demonstrated here under HG/LM conditions. Considering that DR is usually linked to endothelial dysfunction, the impairment of retinal endothelial cell function mediated by TRPM7 channels and the underlying molecular mechanisms still need to be elucidated in future work.
Low Mg2+ exacerbates the dysfunction of Müller cells under HG stress via TRPM7/Ca2+/VDAC1 axis-mediated mitochondrial oxidative stress. These findings position TRPM7 as a potential novel drug target for ischemic and diabetes-related retinopathies.
The datasets used and analyzed during the current study are available from the corresponding author on reasonable request.
PL, ZG, JZ, LM, and DZ conducted experiments. PL and JD designed the research study, performed the research, wrote the manuscript, and analyzed the data. All authors contributed to editorial changes in the manuscript. All authors read and approved the final manuscript. All authors have participated sufficiently in the work and agreed to be accountable for all aspects of the work.
Not applicable.
We would like to express our gratitude to all those who helped me during the writing of this manuscript and thanks to all the peer reviewers for their opinions and suggestions.
This work was supported by the grants from the project from major project of Sichuan provincial administration of traditional Chinese medicine (2024ZD001), and the Luzhou science and technology bureau program (2023SYF128; 2023JYJ056).
The authors declare no conflicts of interest.
Supplementary material associated with this article can be found, in the online version, at https://doi.org/10.31083/FBL50306.
References
Publisher’s Note: IMR Press stays neutral with regard to jurisdictional claims in published maps and institutional affiliations.