


 , Mateusz Kwitniewski 2, Hubert Rybka 3,4, Ivan Sinkevich 2,3, Grzegorz Porebski 1,*
1 Department of Clinical and Environmental Allergology, Jagiellonian University Medical College, 31-503 Krakow, Poland
2 Department of Immunology, Jagiellonian University, 30-387 Krakow, Poland
3 Doctoral School of Exact and Natural Sciences, Jagiellonian University, 30-387 Krakow, Poland
4 Department of Organic Chemistry, Jagiellonian University, 30-348 Krakow, Poland
Abstract
Recent evidence indicates that the Mas-related G protein–coupled receptor X2 (MRGPRX2) can be activated by several drugs, including neuromuscular blocking agents, fluoroquinolones, and vancomycin. However, the contribution of this mechanism to drug hypersensitivity reactions (DHRs) observed in clinical practice remains incompletely understood. Single-nucleotide polymorphisms (SNPs) in the MRGPRX2 gene may alter receptor reactivity and thereby influence drug tolerance. In this study, we investigated whether selected SNPs—previously described in patients with DHRs (N62S, S313R), known but not previously tested with drugs (S325L, E164R), and predicted in silico (W248L)—affect in vitro responses to representative drug ligands.
RBL-2H3 cells were transiently transfected with wild-type (WT) MRGPRX2 or its variants. Cell-surface expression of MRGPRX2 was assessed by flow cytometry. Intracellular calcium mobilization was measured after stimulation with ciprofloxacin, atracurium, and vancomycin; substance P served as a reference agonist and assay buffer as a negative control.
All variants exhibited comparable levels of cell-surface expression. No responses were observed in the presence of assay buffer. The S313R and S325L variants showed responses comparable to WT, with a tendency toward enhanced responses to substance P. In contrast, the E164R variant displayed a loss-of-function phenotype (p < 0.05 for all ligands vs. WT, S313R, and S325L variants), as did the in silico-predicted W248L variant (p < 0.05 for all ligands vs. WT, S313R, and S325L variants). The N62S variant demonstrated slightly reduced responses to the tested agonists compared with WT.
Our findings indicate that under the investigated experimental conditions with ciprofloxacin, atracurium, and vancomycin: (1) N62S-transfected RBL-2H3 cells did not exhibit enhanced responses to the tested drug ligands; (2) the W248L variant exhibited the predicted loss-of-function phenotype, suggesting that in silico modeling may help assess the pathogenicity of specific MRGPRX2 variants; and (3) the remaining variants showed only partial concordance with previously published data, possibly reflecting differences in experimental design or assay conditions and highlighting the need for replication studies.
Graphical Abstract
Keywords
- drug hypersensitivity reaction
- drug-related side effects
- drug-related adverse reactions
- fluoroquinolone
- hypersensitivity
- immediate
- mast cell
- neuromuscular blocking agent
In recent years, the Mas-related G protein–coupled receptor X2 (MRGPRX2) has emerged as an important mast cell receptor involved in innate immune responses. It is activated by substance P (SP), eosinophil-derived products, and other cationic peptides, and has been implicated in neurogenic inflammation, pain, pruritus, and allergic responses [1, 2, 3]. A seminal study by McNeil et al. [4] demonstrated that MRGPRX2 can also be activated by exogenous ligands, including commonly used drugs such as fluoroquinolones and neuromuscular blocking agents (NMBAs), which may trigger severe and even life-threatening hypersensitivity reactions. These findings stimulated considerable interest and led to extensive research exploring MRGPRX2-dependent mast cell degranulation as a potential novel mechanism underlying immediate drug-induced hypersensitivity reactions (DHRs), particularly in drug-naïve patients [5, 6, 7, 8, 9, 10]. However, this mechanism does not fully explain why such reactions occur only in a subset of exposed individuals. One possible explanation involves genetic variability within the MRGPRX2 gene. In particular, single-nucleotide polymorphisms (SNPs) may alter receptor responsiveness to specific ligands and thereby influence susceptibility to drug-induced reactions [3]. Despite this hypothesis, experimental data on the functional consequences of MRGPRX2 genetic variants remain limited. While numerous studies have investigated the responsiveness of wild-type MRGPRX2 to a wide range of classical agonists in vitro, comparatively little is known about how specific MRGPRX2 variants respond to clinically relevant drugs [11, 12, 13, 14, 15, 16].
In this short communication, we address gaps in the current knowledge on this topic. Using a calcium mobilization assay, we examined RBL-2H3 cell lines transfected with the MRGPRX2 N62S variant, identified in patients who experienced immediate hypersensitivity reactions to NMBAs and fluoroquinolones [9, 16], as well as the S313R variant, reported in a case of vancomycin-induced anaphylaxis [16]. The transfected cells were stimulated with representative drug ligands, including the fluoroquinolone ciprofloxacin, the NMBA atracurium, and vancomycin. Furthermore, we evaluated two additional receptor variants, S325L and E164R, which in previous studies demonstrated gain- and loss-of-function properties, respectively, in response to SP (a standard control agonist of MRGPRX2) but had not been tested with drug ligands to date [17, 18]. Our earlier studies using a computational alanine scan identified position W248 as a site that may play an important role in ligand–MRGPRX2 interactions [19]. In the present report, using the MRGPRX2 W248L variant, we investigated whether these in silico findings translate into cellular responses to the tested ligands.
Rat basophilic leukemia cells (RBL-2H3, #CRL-2256) were purchased directly from
the American Type Culture Collection (ATCC, Manassas, VA, USA). Upon receipt, the
cells were cultured as previously described [19], expanded, and cryopreserved in
Bambanker freezing medium (NIPPON Genetics EUROPE GmbH). Experiments were
performed using cells recovered from these early stocks and maintained for no
more than 20 passages. Cells were routinely tested negative for mycoplasma
contamination. Culture quality and phenotypic consistency were confirmed by
morphological feature analysis and the expected
To generate RBL-2H3 cells expressing the wild-type MRGPRX2 receptor, we used the pReceiver-M06 plasmid encoding hemagglutinin-tagged human MRGPRX2 (#EX-T3417-M06, GeneCopoeia, Rockville, MD, USA). MRGPRX2 variants were generated using the QuikChange II Site-Directed Mutagenesis Kit (#200523, Agilent Technologies, Inc., Santa Clara, CA, USA) according to the manufacturer’s instructions. Briefly, mutagenic primers were designed using the Agilent web-based primer design tool [20]. The forward and reverse primers used to generate each variant were as follows:
N62S: Forward: 5′-CAGAGAAGGCGCTCCTGCGCATGCGGAA-3′
Reverse: 5′-TTCCGCATGCGCAGGAGCGCCTTCTCTG-3′
E164R: Forward: 5′-AAGCCACAGAACTTCCCTCGCAAGATGCTCAGCAGTAG-3′
Reverse: 5′-CTACTGCTGAGCATCTTGCGAGGGAAGTTCTGTGGCTT-3′
W248L: Forward: 5′-GAATCCTTCCAGATCAATAATATTAGGAACCACTGAATGCCA-3′
Reverse: 5′-TGGCATTCAGTGGTTCCTAATATTATTGATCTGGAAGGATTC-3′
S313R: Forward: 5′-GACGGAAGCATCCTTCCCTGTGATCCACCTCAG-3′
Reverse: 5′-CTGAGGTGGATCACAGGGAAGGATGCTTCCGTC-3′
S325L: Forward: 5′-CCAGACTGCTTCTCAACATCTCCGGGGTG-3′
Reverse: 5′-CACCCCGGAGATGTTGAGAAGCAGTCTGG-3′
Polymerase Chain Reactions (PCR) were performed using 25 ng of dsDNA template with the extension conditions described above (16 cycles, 8 min per cycle). The remaining PCR parameters were applied according to the manufacturer’s instructions. Following amplification, the parental methylated plasmid DNA was digested with DpnI, and the reaction mixture was transformed into chemically competent E. coli cells (XL1-Blue Supercompetent Cells). Bacterial colonies were selected on LB agar (#L3022, Sigma-Aldrich, St. Louis, MO, USA; #AGR001, BioShop, Burlington, ON, Canada) supplemented with ampicillin (#AMP201, BioShop, Burlington, ON, Canada). Positive clones were expanded, and plasmid DNA was purified using the Plasmid Midi AX Endotoxin-Free kit (#092EF-10, A&A Biotechnology, Gdańsk, Poland). Prior to transfection, the correct nucleotide sequences of all constructs were confirmed by Sanger sequencing (Genomed, Warsaw, Poland).
RBL-2H3 cells (0.8
The day after transfection, the cells were plated at a density of 0.05
Fluorescence was measured at an excitation wavelength of 485 nm and an emission
wavelength of 530 nm. The measurements were recorded for 60 s to obtain baseline
values (F0; 0–59 s) and then for 200 s after stimulus addition (F; 60–260
s), with readings collected every 4 s. Data were normalized as
Cells were stimulated with the following reagents: SP (#1156, Tocris Bioscience, Bio-Techne, Bristol, UK; used as a positive control for MRGPRX2-dependent stimulation), vancomycin (Vancomycin-MIP, MiP Pharma, Gdańsk, Poland), atracurium (atracurium besilate, Tracrium, Aspen Pharma, Durban, South Africa), and ciprofloxacin (Ciprofloxacin Kabi, Fresenius Kabi, Warsaw, Poland). Immediately before stimulation, all reagents were prepared in assay buffer (from the Fluo-4 NW Calcium Assay Kit), which was also used as a negative control. The tested ligands were used at the following final concentrations: SP, 25 µM; vancomycin, 1 mg/mL; atracurium, 500 µg/mL; and ciprofloxacin, 250 µg/mL. The concentrations were selected based on previous publications, choosing those reported to elicit the maximal response [16, 19]. The numbers of biological replicates for each condition were as follows: atracurium (n = 16, 7, 10, 10, 7, 10 for WT, N62S, E164R, W248L, S313R, and S325L, respectively); ciprofloxacin (n = 22, 9, 10, 10, 7, 12, respectively); vancomycin (n = 19, 7, 8, 11, 10, 8, respectively); negative control (n = 16, 7, 4, 4, 7, 5, respectively); and substance P (n = 18, 6, 6, 5, 6, 7, respectively).
Data were analyzed using Prism software 8.0.1 (GraphPad Software, Inc., La
Jolla, CA, USA). Data distribution was assessed with the Shapiro–Wilk test. Data
are presented as medians and interquartile ranges (IQRs). Multiple comparisons
were conducted using the Kruskal–Wallis test followed by Dunn’s post hoc test.
Differences were considered statistically significant at p
In the Ca2+ mobilization assay, responses of cells expressing distinct SNP variants were compared with those of cells expressing wild-type MRGPRX2 (WT) and non-transfected RBL-2H3 cells (NC) after stimulation with selected drug ligands. The tested SNPs are shown in Fig. 1A,B (Ref. [21, 22]). None of the introduced point mutations affected cell surface receptor expression, as transfected RBL-2H3 cells displayed comparable levels of surface expression for WT MRGPRX2 and all tested variants (Fig. 1C). Further analysis of the proportion of MRGPRX2-positive cells and the geometric mean fluorescence intensity across independent experiments did not reveal statistically significant differences among the variants under investigation (Supplementary Fig. 1). Representative traces of fluorescence intensity changes reflecting Ca2+ influx for WT-expressing cells and for all remaining variants under investigation are shown in Supplementary Fig. 2. NC cells showed no activation after stimulation with SP, a positive control for MRGPRX2-dependent stimulation, or with any of the tested drugs (data not shown).
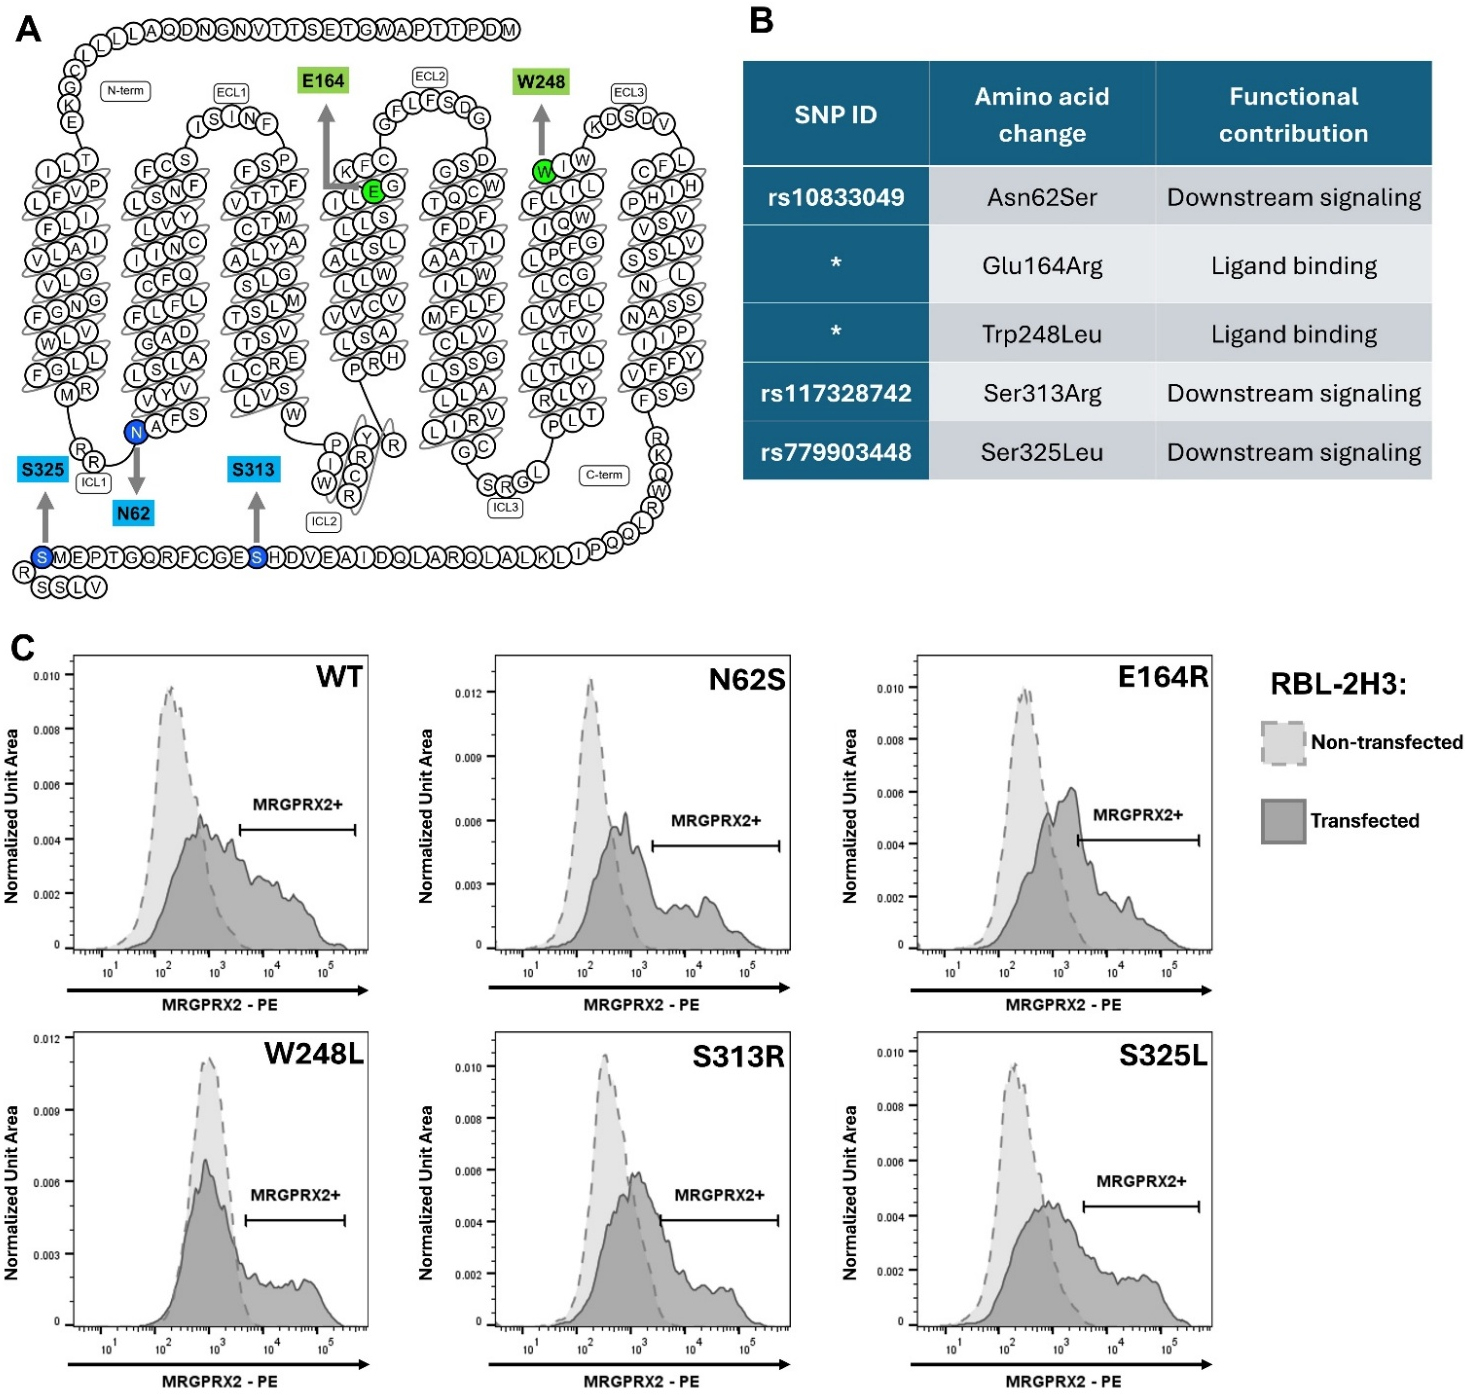 Fig. 1.
Tested SNPs of the MRGPRX2 receptor. (A) Snake diagram of human MRGPRX2 secondary structure [21]. Green indicates residues within (E164) or adjacent to (W248) the binding pocket; blue indicates intracellular residues involved in downstream signaling (N62, S313, S325). (B) Table of tested SNPs. SNP ID refers to NCBI dbSNP [22]; (*) asterisks denote SNPs not recorded in the database. (C) Representative flow cytometry histograms of MRGPRX2 surface expression. Variant-transfected cells are shown in solid gray; non-transfected RBL-2H3 cells in dashed light gray. The MRGPRX2⁺ gate marks cells expressing surface receptor. Comparable MRGPRX2 surface expression levels were observed across the variants. SNP, single-nucleotide polymorphism; C-term, carboxyl terminus; E164R, Glu164Arg; ECL, extracellular loop; ICL, intracellular loop; MRGPRX2-PE, phycoerythrin-conjugated anti-MRGPRX2 antibodies; N62S, Asn62Ser; N-term, amino terminus; S313R, Ser313Arg; S325L, Ser325Leu; W248L, Trp248Leu; WT, wild-type.
The WT receptor showed significantly increased responses to all tested ligands compared with the negative control. Among the analyzed SNPs, N62S, S313R, and S325L exhibited significantly enhanced responses to SP and most tested drugs compared with the negative control. In contrast, E164R and W248L showed no relevant differences in Ca2+ dynamics between negative control and stimulation with any of the tested ligands. Side-by-side comparisons of ligand-induced responses between WT and the variants under investigation are shown in Fig. 2.
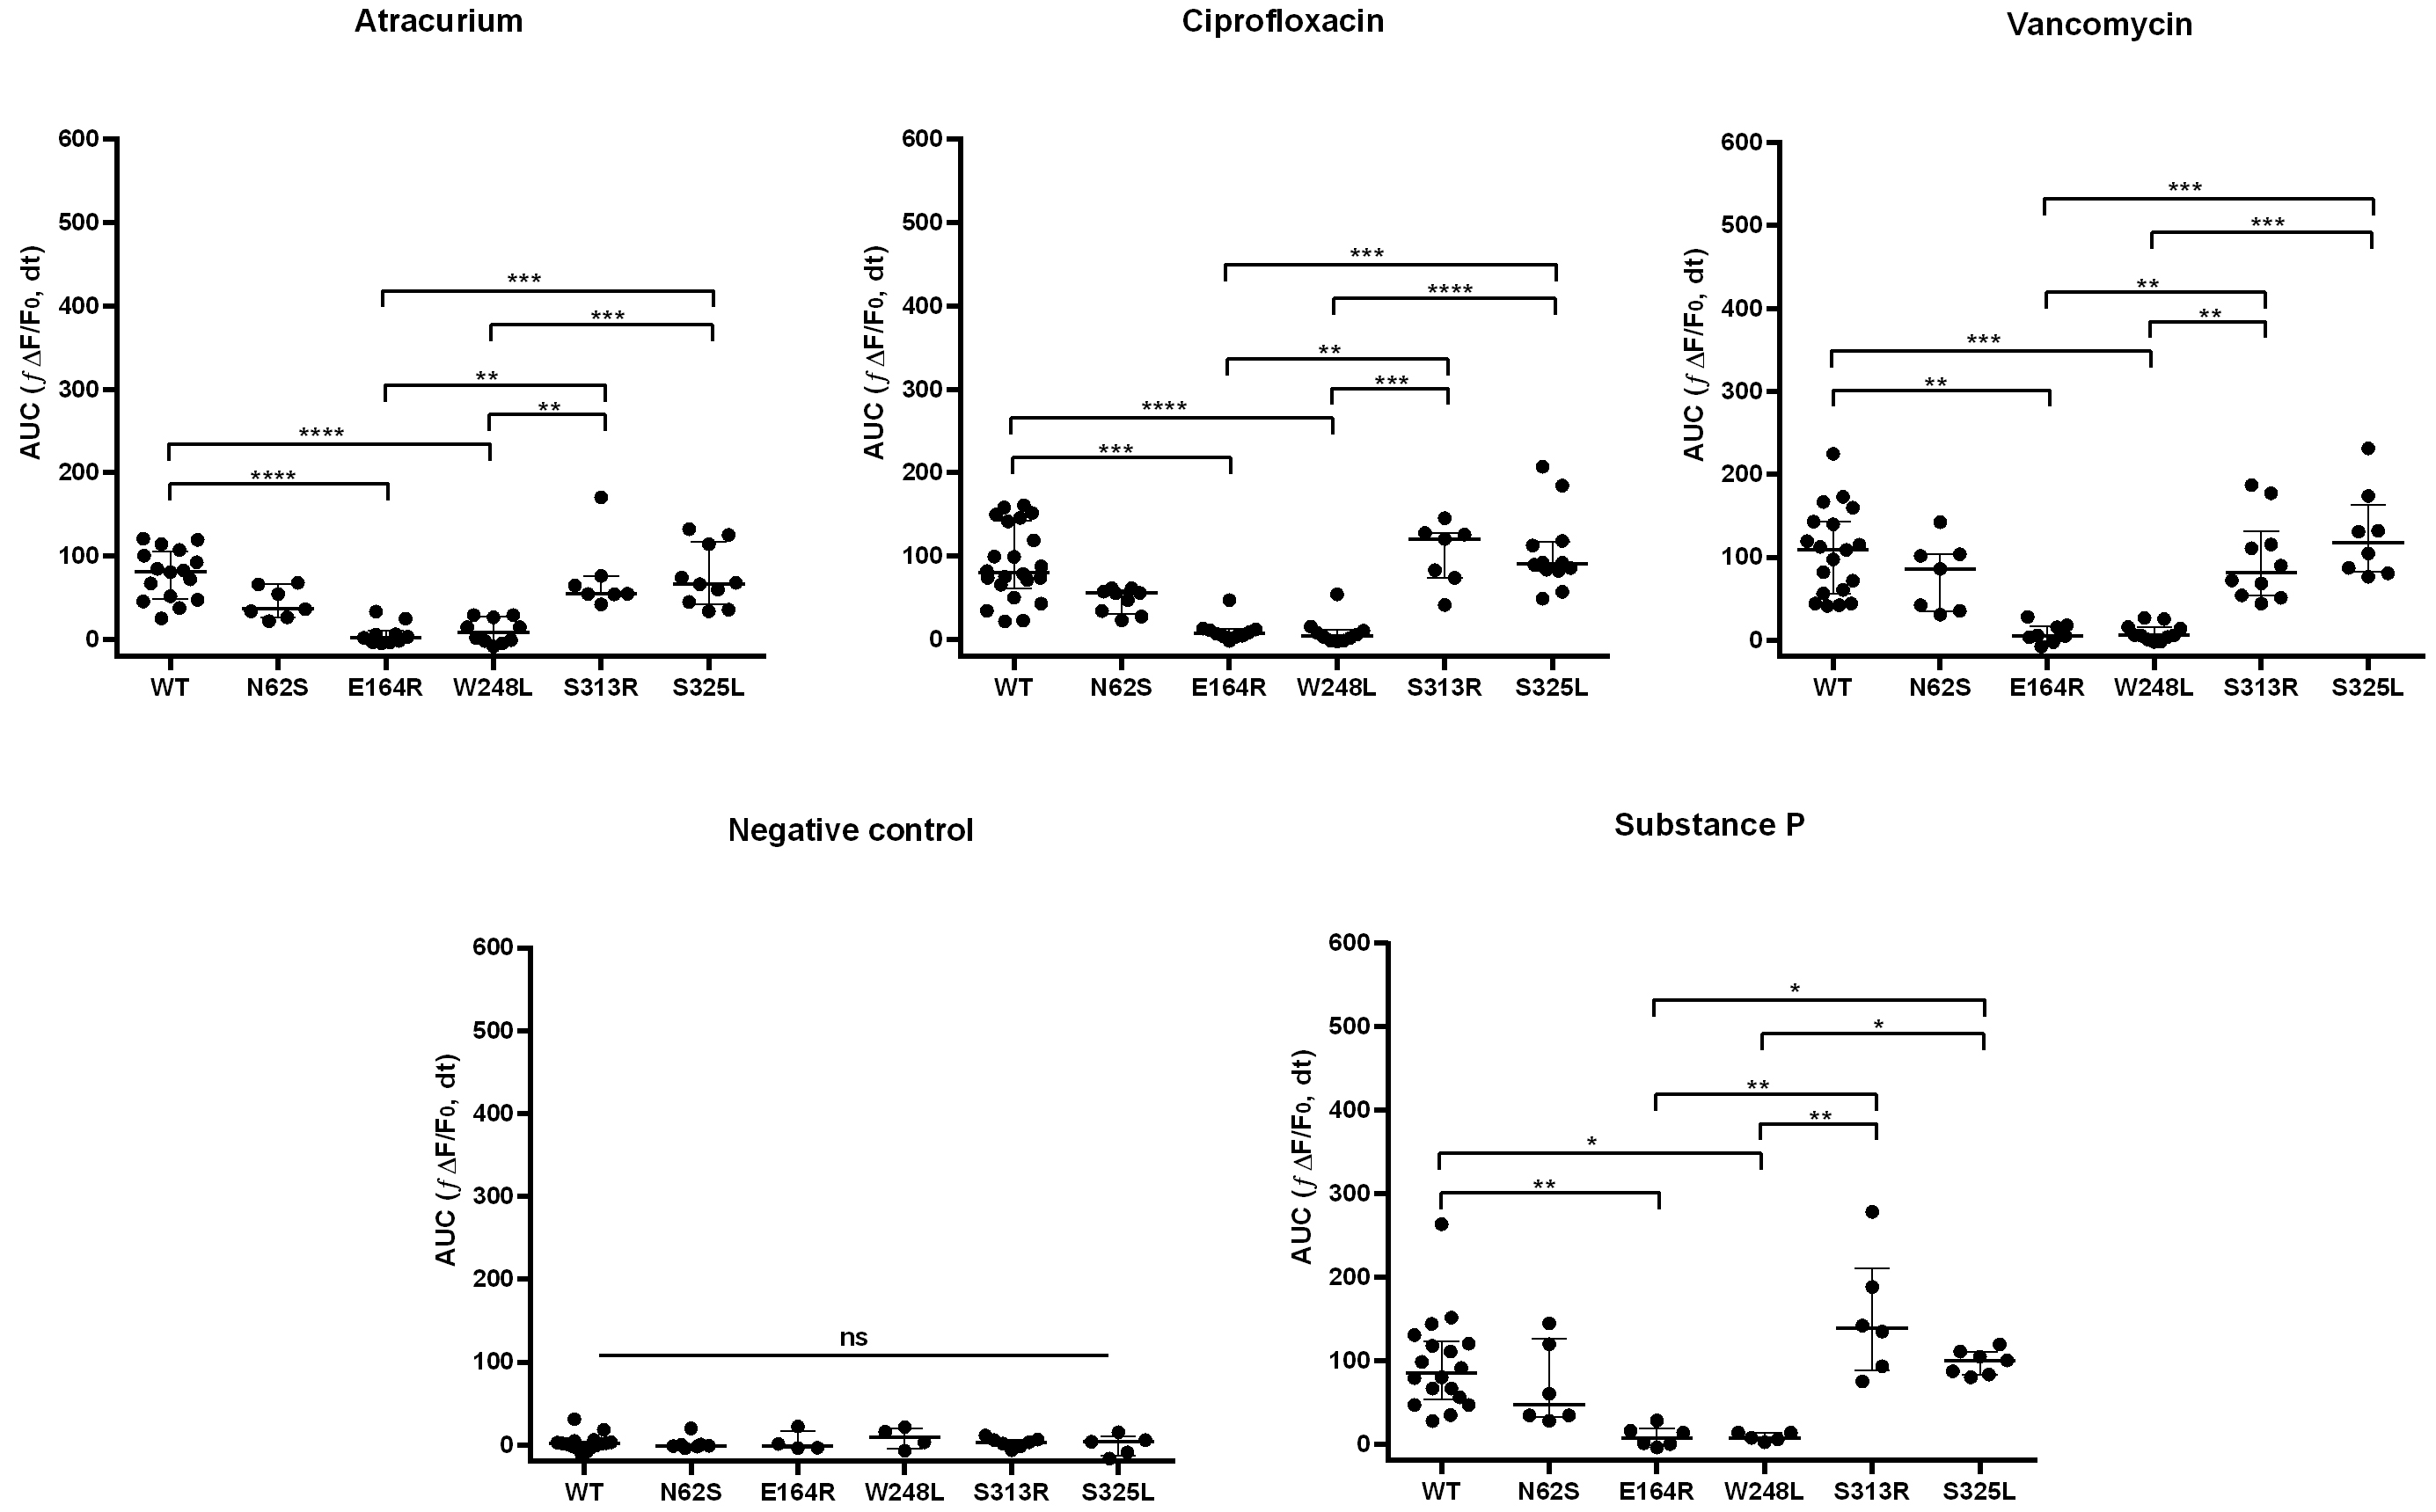 Fig. 2.
Ca2+ mobilization in RBL-2H3 cells expressing MRGPRX2
variants in response to drug stimulation. The E164R and W248L variants
demonstrate loss-of-function effects. Scatter plots with medians and
interquartile ranges (IQRs) of cellular responses, measured as AUC after ligand
addition. Each plotted point corresponds to a biological replicate. Statistical
significance was assessed by the Kruskal–Wallis followed by Dunn’s post hoc
test. Data represent
The E164R variant showed markedly reduced activation in response to all ligands
when compared with WT, S313R, and S325L (SP, vancomycin, atracurium, and
ciprofloxacin; all p
Our results show that the S313R variant displays a response profile largely comparable to WT across all tested ligands, with a tendency toward enhanced activation upon SP stimulation (Fig. 2). This variant was first described by Quan et al. [16] in a patient with vancomycin-induced immediate hypersensitivity. In that study, functional analyses were performed in HEK293LTV cells using Ca2+ mobilization and inositol 1-phosphate production assays as readouts. Consistent with our findings, S313R-transfected cells showed stronger responses to SP and weaker responses to ciprofloxacin compared with WT. The authors also reported enhanced activation by vancomycin in this variant [16]. To date, however, no further experimental validation of drug responses in S313R-expressing cells has been reported by other research groups.
More extensive data are available for the N62S variant. It has been reported in
patients with perioperative anaphylaxis to NMBAs and in individuals with
immediate DHRs to fluoroquinolones, although it also occurs at a comparable
frequency in the general population [9, 16]. In our experiments, N62S-transfected
cells displayed responses similar to or slightly numerically lower than those
observed in WT-transfected cells, but not reaching statistical significance. Yang
et al. [15], using HEK293-G
Functional characterization of MRGPRX2 variants has typically relied on classical agonists, such as SP or compound 48/80. Drug ligands were evaluated only in a limited number of studies, although, as noted above, the same variant may exhibit ligand-specific responses. Therefore, we extended our analysis to variants previously characterized as gain-of-function (S325L) [17] and loss-of-function (E164R) [18].
S325L is a missense mutation located in the C-terminal region of MRGPRX2, which
is involved in downstream signaling processes, including G-protein
phosphorylation and
W248 is a pocket residue located on the extracellular segment of transmembrane
helix 6 (TM6) of MRGPRX2. In our previous computational study [19], we
demonstrated that alanine substitution at this position leads to reduced binding
free energies of the receptor for relevant drug molecules—specifically,
fluoroquinolones and laudanosine (a metabolite of atracurium)—relative to the
wild-type receptor. This diminished binding affinity was attributed to the loss
of
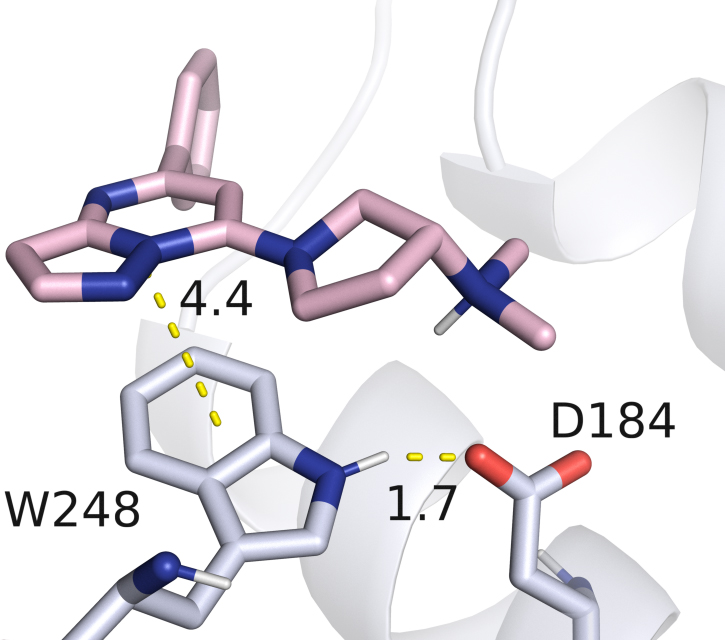
Although no direct contact is observed between W248 and the neuropeptide SP in the MRGPRX2 complex (PDB ID: 7VDM) [25], our experimental data demonstrate that the W248L substitution renders the receptor completely unresponsive to activation by this ligand, which served as a positive control in our assays. We hypothesize that this loss of function does not result from disruption of a direct protein–ligand interaction, but rather from a role of W248 in maintaining the receptor’s tertiary helix bundle structure. Inspection of available MRGPRX2 structural data [25] reveals a strong hydrogen bond between the N–H group of W248 and the carboxylate moiety of D184 (Fig. 3), a transmembrane helix 5 (TM5) residue previously shown to be critical for ligand binding through electrostatic interactions with the positively charged nitrogen atom of MRGPRX2 ligands [19, 25]. Notably, this hydrogen bond also constitutes the sole polar contact between TM5 and TM6 in the entire protein, highlighting its potential importance in stabilizing the relative orientation of these two helices, preserving the native conformation of the binding pocket, and thereby maintaining the functional integrity of the receptor.
 Fig. 3.
Detailed view of the interaction between the MRGPRX2 agonist (R)-ZINC-3573 and residue W248 within the receptor binding pocket (PDB ID: 7S8N). In addition to direct contact with the ligand, W248 contributes to stabilization of the binding pocket by forming a hydrogen bond with D184.
For a comprehensive interpretation of the presented results, the study’s
limitations must be taken into account. First, their potential clinical
significance should be interpreted with caution, as the study relies solely on a
calcium mobilization assay, which does not directly assess mast cell effector
responses, including cytokine production and degranulation with subsequent
release of histamine and other mediators of clinical reactions. The model of
transiently MRGPRX2-transfected RBL-2H3 cells is not equivalent to primary human
mast cells or a stable human mast cell model, which limits the extent to which
the results can be extrapolated to human DHRs. Furthermore, as the ligands were
tested at a single fixed concentration, it is difficult to determine whether
specific variants differ in sensitivity, activation threshold, or maximal
response, which is particularly important when the observed differences are
modest. The concentrations tested here, as in many in vitro studies, are
also generally substantially higher than those observed in clinical settings
[26]. Additionally, while non-transfected cells and assay buffer controls were
used, additional controls, such as empty-vector transfection or receptor-specific
inhibition, would further strengthen the specificity of the observed responses.
Finally, the potential effects related to
The concept that MRGPRX2 SNPs contribute to heightened mast cell activation following exposure to specific drugs, and consequently to the clinical manifestations of immediate DHRs, continues to attract scientific interest [3, 7, 8, 9]. Here, we present Ca2+ mobilization data from RBL-2H3 cells transfected with multiple MRGPRX2 variants and stimulated with representative drug ligands, including ciprofloxacin (a fluoroquinolone), atracurium (a NMBA), and vancomycin. To our knowledge, this is the first study to systematically compare such an extensive panel of SNP–drug interactions within a single experimental framework.
For the first time, we evaluated the responses of S325L- and E164R-transfected cells to clinically relevant drugs. Our findings largely align with previous reports using classical MRGPRX2 agonists. The functional profile of S313R observed here corresponds to that reported in the only previously published study, despite differences in experimental design [16]. Further sequencing of MRGPRX2 in patients with vancomycin-induced anaphylaxis may provide valuable insight linking functional data to clinical phenotypes. In vitro testing of W248L suggests that in silico predictions could potentially serve as a supportive tool in the pathogenicity assessment of MRGPRX2 genetic variants.
The literature reports on the impact of the N62S variant are conflicting when considering clinical data on chronic urticaria and ulcerative colitis, as discussed above. Variability in in vitro assays may reflect differences in the cell lines and readout systems used across studies. Therefore, it is essential to confirm initial findings in subsequent investigations, particularly in the context of the ongoing reproducibility crisis in biomedical research [27]. The clinical significance of gene variants should be interpreted with caution [28], since a comprehensive assessment of their pathogenicity requires integrating computational and functional data alongside population and segregation evidence [29]. In summary, the potential clinical significance of our findings, showing no increased reactivity of N62S-transfected cells, must be interpreted with caution, within the broader context of additional evidence derived from further laboratory studies, data from well-characterized patients with clearly established causal relationships, and taking into account the aforementioned limitations of the experimental setup.
The data analyzed during the current study are available from the corresponding author on reasonable request.
GP, MK: conceptualization; MK, AD, GP, HR: methodology; AD, MK, IS, HR: investigation; AD, IS: data acquisition; AD: formal analysis; AD, GP: data curation; GP, AD: writing-original draft preparation; AD, GP, HR, MK: visualization; MK, HR, IS: writing-review and editing. All authors contributed to editorial changes in the manuscript. All authors read and approved the final manuscript. All authors have participated sufficiently in the work and agreed to be accountable for all aspects of the work.
Not applicable.
We sincerely thank Witold Mora de Korytowo-Korytowski and Grzegorz Szewczyk of the Biophysics Department of the Jagiellonian University for their technical support. The graphical abstract was created with BioRender.com. Porebski, G. (2026) https://BioRender.com/769xqx8.
This study was funded by the Polish National Science Center grant No. 2019/35/B/NZ5/02398.
The authors declare no conflicts of interest.
Supplementary material associated with this article can be found, in the online version, at https://doi.org/10.31083/FBL51779.
References
Publisher’s Note: IMR Press stays neutral with regard to jurisdictional claims in published maps and institutional affiliations.