


 , Xin Wang 1, Juan Zhao 1, Mi Wu 1, Ting Zhou 1, Lichen Ouyang 3, Xiufang Weng 1, Shiguo Liu 2,*
 , Xiongwen Wu 1,*
1 Department of Immunology, School of Basic Medicine, Tongji Medical College, Huazhong University of Science and Technology, 430030 Wuhan, Hubei, China
2 Department of Clinical Laboratory, Hubei No.3 People’s Hospital of Jianghan University, 430033 Wuhan, Hubei, China
3 Department of Immunology, School of Medicine, Jianghan University, 430056 Wuhan, Hubei, China
Abstract
Hepatitis B virus (HBV)-specific CD8+ T cells play a crucial role in viral clearance. However, in patients with chronic hepatitis B infections, sustained immune activation leads to functional impairment of these HBV-specific CD8+ T cells. The goal of this study was to clarify whether these virus-specific CD8+ T cells are exhausted or reflect an incomplete response derived from the initial T cell repertoire.
In this study, HBV core 18–27 epitope-specific CD8+ T cells were identified by proliferation through in vitro antigen stimulation. Peptide-specific CD8+ T cells recognizing the cytomegalovirus (CMV) pp65 495–503 epitope were used as a positive control, as they exhibit a robust immune response. Single-cell sequencing was employed to characterize the TCR repertoire of expanded clones. Correlations between T cell subsets and clinical outcomes were analyzed and compared.
Both HBV core 18–27-specific and CMV pp65-specific CD8+ T cells were successfully classified into three functionally distinct subsets: IFNγ+, mTGFβ+, and IFNγ–/mTGFβ–. Those patients with resolved acute HBV infections and HBV core 18–27 specific CD8+ T cells exhibited the highest IFNγ+/mTGFβ+ ratio, reaching levels comparable to those of CMV pp65-specific CD8+ T cells. Inactive HBV carriers exhibited the second-highest IFNγ+/mTGFβ+ ratio, while this ratio was lowest among patients exhibiting viral immune tolerance. HBV core 18–27 tetramer staining and ERGO-Ⅱ Model prediction demonstrated that IFNγ+ subset CD8+ T cells exhibited the highest affinity for this epitope, followed by the mTGFβ+ subset, with IFNγ–/mTGFβ– cells exhibiting the lowest affinity.
These results suggest that individuals with a high IFNγ+/mTGFβ+ ratio exhibit a lower HBV viral load. The IFNγ+/mTGFβ+ CD8+ T cell ratio, in particular, appears to be associated with HBV clearance, and this may be attributable to T cell receptor affinity for HBV epitopes.
Graphical Abstract
Keywords
- chronic hepatitis B
- viral load
- cell proliferation
- immune tolerance
- CD8-Positive T-Lymphocytes
- T-cell receptor diversity
- ligand-receptor interactions
- TCR affinity
Chronic hepatitis B infection (CHB) remains a global public health problem. According to the World Health Organization, approximately 2 billion people worldwide have been infected with the hepatitis B virus (HBV), of whom 254 million people are chronically infected [1]. Annually, about 1.1 million deaths are attributable to HBV-related complications, including liver failure, cirrhosis, and hepatocellular carcinoma. In China, the “Guidelines for the Prevention and Treatment of Chronic Hepatitis B (2022 Edition)” reported that HBV affects approximately 6.1% of the general population, corresponding to roughly 86 million cases of HBV infection, including 20–30 million cases of CHB [2].
HBV-specific CD8+ T cells play a crucial role in viral clearance [3]. However,
in patients with CHB, the immune system fails to eliminate the virus effectively.
The prevailing evidence suggests that HBV-specific CD8+ T cells exist in a state
of prolonged immune activation in CHB patients, leading to their dysfunction and
exhaustion [4]. Individual patients exhibit heterogeneous HBV peptide-specific
CD8+ T cell responses, and this variability has been attributed to multiple
factors, including differences in epitopes and antigen-presenting cells (APCs)
[5]. The responsiveness of T cells for specific HBV epitopes also
differs markedly. For instance, relative to HBV pol455–463 epitope-specific CD8+
T cells, HBV core 18–27 epitope-specific CD8+ T cells exhibit higher frequencies
and more robust immune functionality, including higher levels of IFN
In an effort to more fully clarify the immunological basis for inconsistent HBV-specific immunity, we hypothesized that specific CD8+ T cells recognizing a single peptide-major histocompatibility complex (pMHC) complex may differ in their responsiveness such that they can be classified based on their activity into subsets with effective, inhibitory, and hyporeactive responsivity. T cell repertoire heterogeneity is currently considered to be the principal driver of observed differences in viral clearance, whereas T cell exhaustion is thought to be a relatively minor contributing factor. Differences in T cell reactivity are epitope-specific. For example, in the context of cytomegalovirus (CMV) infection, a diverse T cell repertoire enables robust and effective immunity, whereas in CHB infection, the repertoire is often dominated by hyporeactive or inhibitory T cell subsets, leading to an impaired immune response and poor viral clearance [7].
Research focused on the tumor microenvironment has informed the classification of hyporeactive T cells into three categories: exhausted T cells, arising from persistent antigen stimulation; anergic T cells, which lack the first or second signals; and senescent T cells, which are functionally intact but possess limited replicative potential [8]. The common defining characteristic of these three subsets is low proliferative capacity. However, further research is warranted to investigate the presence of these types of T cells in CHB and to clarify how they influence the immune response. As such, proliferation was selected as a core criterion to evaluate T cell specificity in the present study based on analyses of the responsiveness of T cells specific to a single pMHC.
Prior studies of peptide-specific CD8+ T cells have primarily relied on the use of pMHC tetramers or multimers for detection. However, due to low precursor frequencies, these antigen-specific CD8+ T cells are often undetectable or are inaccurately quantified. Although tetramer-associated magnetic enrichment (TAME) has been developed to improve detection accuracy [9], it may still fail to detect some low-affinity cells. Given this limitation, pMHC tetramer staining was used in this study not as a definitive indicator of T cell specificity, but rather as a means of assessing relative pMHC-TCR affinity.
The primary aims of this study were to investigate the differentiation of
HBV-specific CD8+ T cells in CHB, and to examine the functional heterogeneity of
clonotypes targeting a single pMHC. Through an in vitro culture
approach, proliferated T cells were identified as specific CD8+ T cells, enabling
the further assessment of their functional profiles. Additionally, tetramer
staining was used to identify highly reactive specific CD8+ T cells. The
relationship between pMHC-TCR affinity and the differentiation of specific CD8+ T
cells was investigated, based on the hypothesis that viral persistence in CHB may
be driven in part by the absence of hyporeactivity of specific CD8+ T cells in
certain patients. Based on our previous identification of an inhibitory CD8+ T
cell subpopulation characterized by high expression of membrane-bound
TGF
CHB infection provides a valuable natural model for studying specific T cell responses. Developing a deeper understanding of the functional diversity among specific CD8+ T cells will help elucidate the mechanisms of viral persistence while also informing the development of novel T cell-based immunotherapies.
Patients were recruited at Hubei No.3 People’s Hospital of Jianghan University. All patients had HBV infection and tested negative for hepatitis A, C, and D viruses, and HIV. The detailed clinical characteristics for these patients are presented in Supplementary Table 1. Most of these patients were undergoing long-term nucleos(t)ide analogue (NA) therapy, such as tenofovir disoproxil fumarate (TDF) and tenofovir alafenamide (TAF); notably, none had received interferon therapy. Furthermore, no liver fibrosis was detected in any of the included cases, thereby minimizing potential confounding effects on T cell phenotypes and functions.
Individuals were categorized into three groups: immune tolerance-stage patients
(IT group, n = 16), defined as those with HBV DNA
Epitope-specific peptides were synthesized by Sino Biological Inc. (Shanghai, China). These included the HBV core 18–27 wild-type (FLPSDFFPSV), HBV core 18–27 mutant (FLPSDFFPSI), and CMV pp65 495–503 (NLVPMVATV) epitopes. All peptides were desalted and obtained with a purity greater than 99%. The HBV core 18–27 (FLPSDFFPSV) HLAA*02:01 tetramer (Tet-HBC) was ordered from Medical & Biological Laboratories Co., Ltd. (Cat. No.: TB-0018-2, MBL, Minato-ku, Tokyo, Japan).
All antibodies were ordered from BioLegend (San Diego, CA, USA) and included the
following: FITC anti-human HLA-A2 (BB7.2 clone), APC/Cy7 anti-human CD3
(UCHT1 clone), PE/Cy5 anti-human CD8a (HIT8a clone), and PE anti-human LAP
(TGF-
All primary cells from clinical samples were validated for their identity via surface marker staining (CD3/CD8/HLA-A2) using flow cytometry. The T2 cell line was identified by specific HLA-A2 antibody (BB7.2 clone) staining (Supplementary Fig. 1B) and validated by STR profiling. All cell preparations were tested and confirmed to be negative for mycoplasma contamination.
PBMCs were stained with CellTrace (20 mM, 1:2000), then adjusted to 1–2
To provide sustained continuous stimulation of all specific CD8+ T cells, T2
cells were used as APCs. T2 cells were cultured in RPMI-1640 (Cat. No.: 21875034)
supplemented with 10% fetal bovine serum (Cat. No.: 10099-141) (both from Gibco,
Thermo Fisher Scientific, Waltham, MA, USA). Before re-stimulation, both T2 cells
and expanded cells were transitioned into X-VIVO® 15 medium.
T2 cells were adjusted to 1–2
Cells from different samples were labeled with Human Single-Cell Multiplexing
Kit (Sample Tags) (Cat. No.: 633793, BD Biosciences, San Jose, CA, USA), and
subsequently sorted by flow cytometry (FACS AriaⅡ, BD Biosciences) to isolate
those cells with aCD3+/CD8+/CellTracedim phenotype. The sorted cells from
each sample were pooled in equal quantities for subsequent single-cell analysis.
Single-cell capture and RNA library preparation were performed using the BD
Rhapsody™ system according to the manufacturer’s protocol.
Single-cell immune-targeted RNA sequencing was performed on a Novaseq 6000 System
(Illumina Inc., San Diego, CA, USA) to profile the expression of 400
immune-associated genes through Immune Response Panel Hs Kit (Cat. No.: 723770, BD
Biosciences, San Jose, CA, USA). A total of 7 CHB patient samples were processed,
yielding 4638 single-cell transcriptomes after pipeline analysis. KEGG enrichment
analyses were performed among the IFN
The ERGO-Ⅱ (pEptide tcR matchinG predictiOn) model [11] is a multifactorial
TCR-pMHC binding predictor (https://github.com/IdoSpringer/ERGO-II). This model
is based on the long short-term memory (LSTM) model. Utilized input factors
included: amino acid sequences of the CDR3 region in TRAV and TRBV; peptide amino
acid sequences; and TRAV, TRBV, TRAJ, TRBJ, and MHC subtypes. VDJdb was used as a
training database. Final scores were used to reflect TCR-pMHC affinity. The 10
most frequent representative clones were chosen from among the IFN
For flow cytometric gating, an initial peptide-specific CD8+ T cell gate was set
based on side scatter (SSC)/forward scatter (FSC) and subsequent gating on
single-cells (FSC-A/FSC-H), CD3+, and CD8+, CellTracedim gates, followed by
the introduction of IFN
As most quantitative data in this study were not normally distributed,
nonparametric tests were used. For comparisons between two matched-pair groups,
Wilcoxon tests were used, while for comparisons among three groups, the Friedman
test (matched-pairs) or the Kruskal-Wallis test (no matched-pairs) was used,
followed by Dunn’s multiple comparisons test. Quantitative data that were
normally distributed were analyzed with one-way ANOVAs and Tukey’s multiple
comparisons test when comparing results among three groups. p
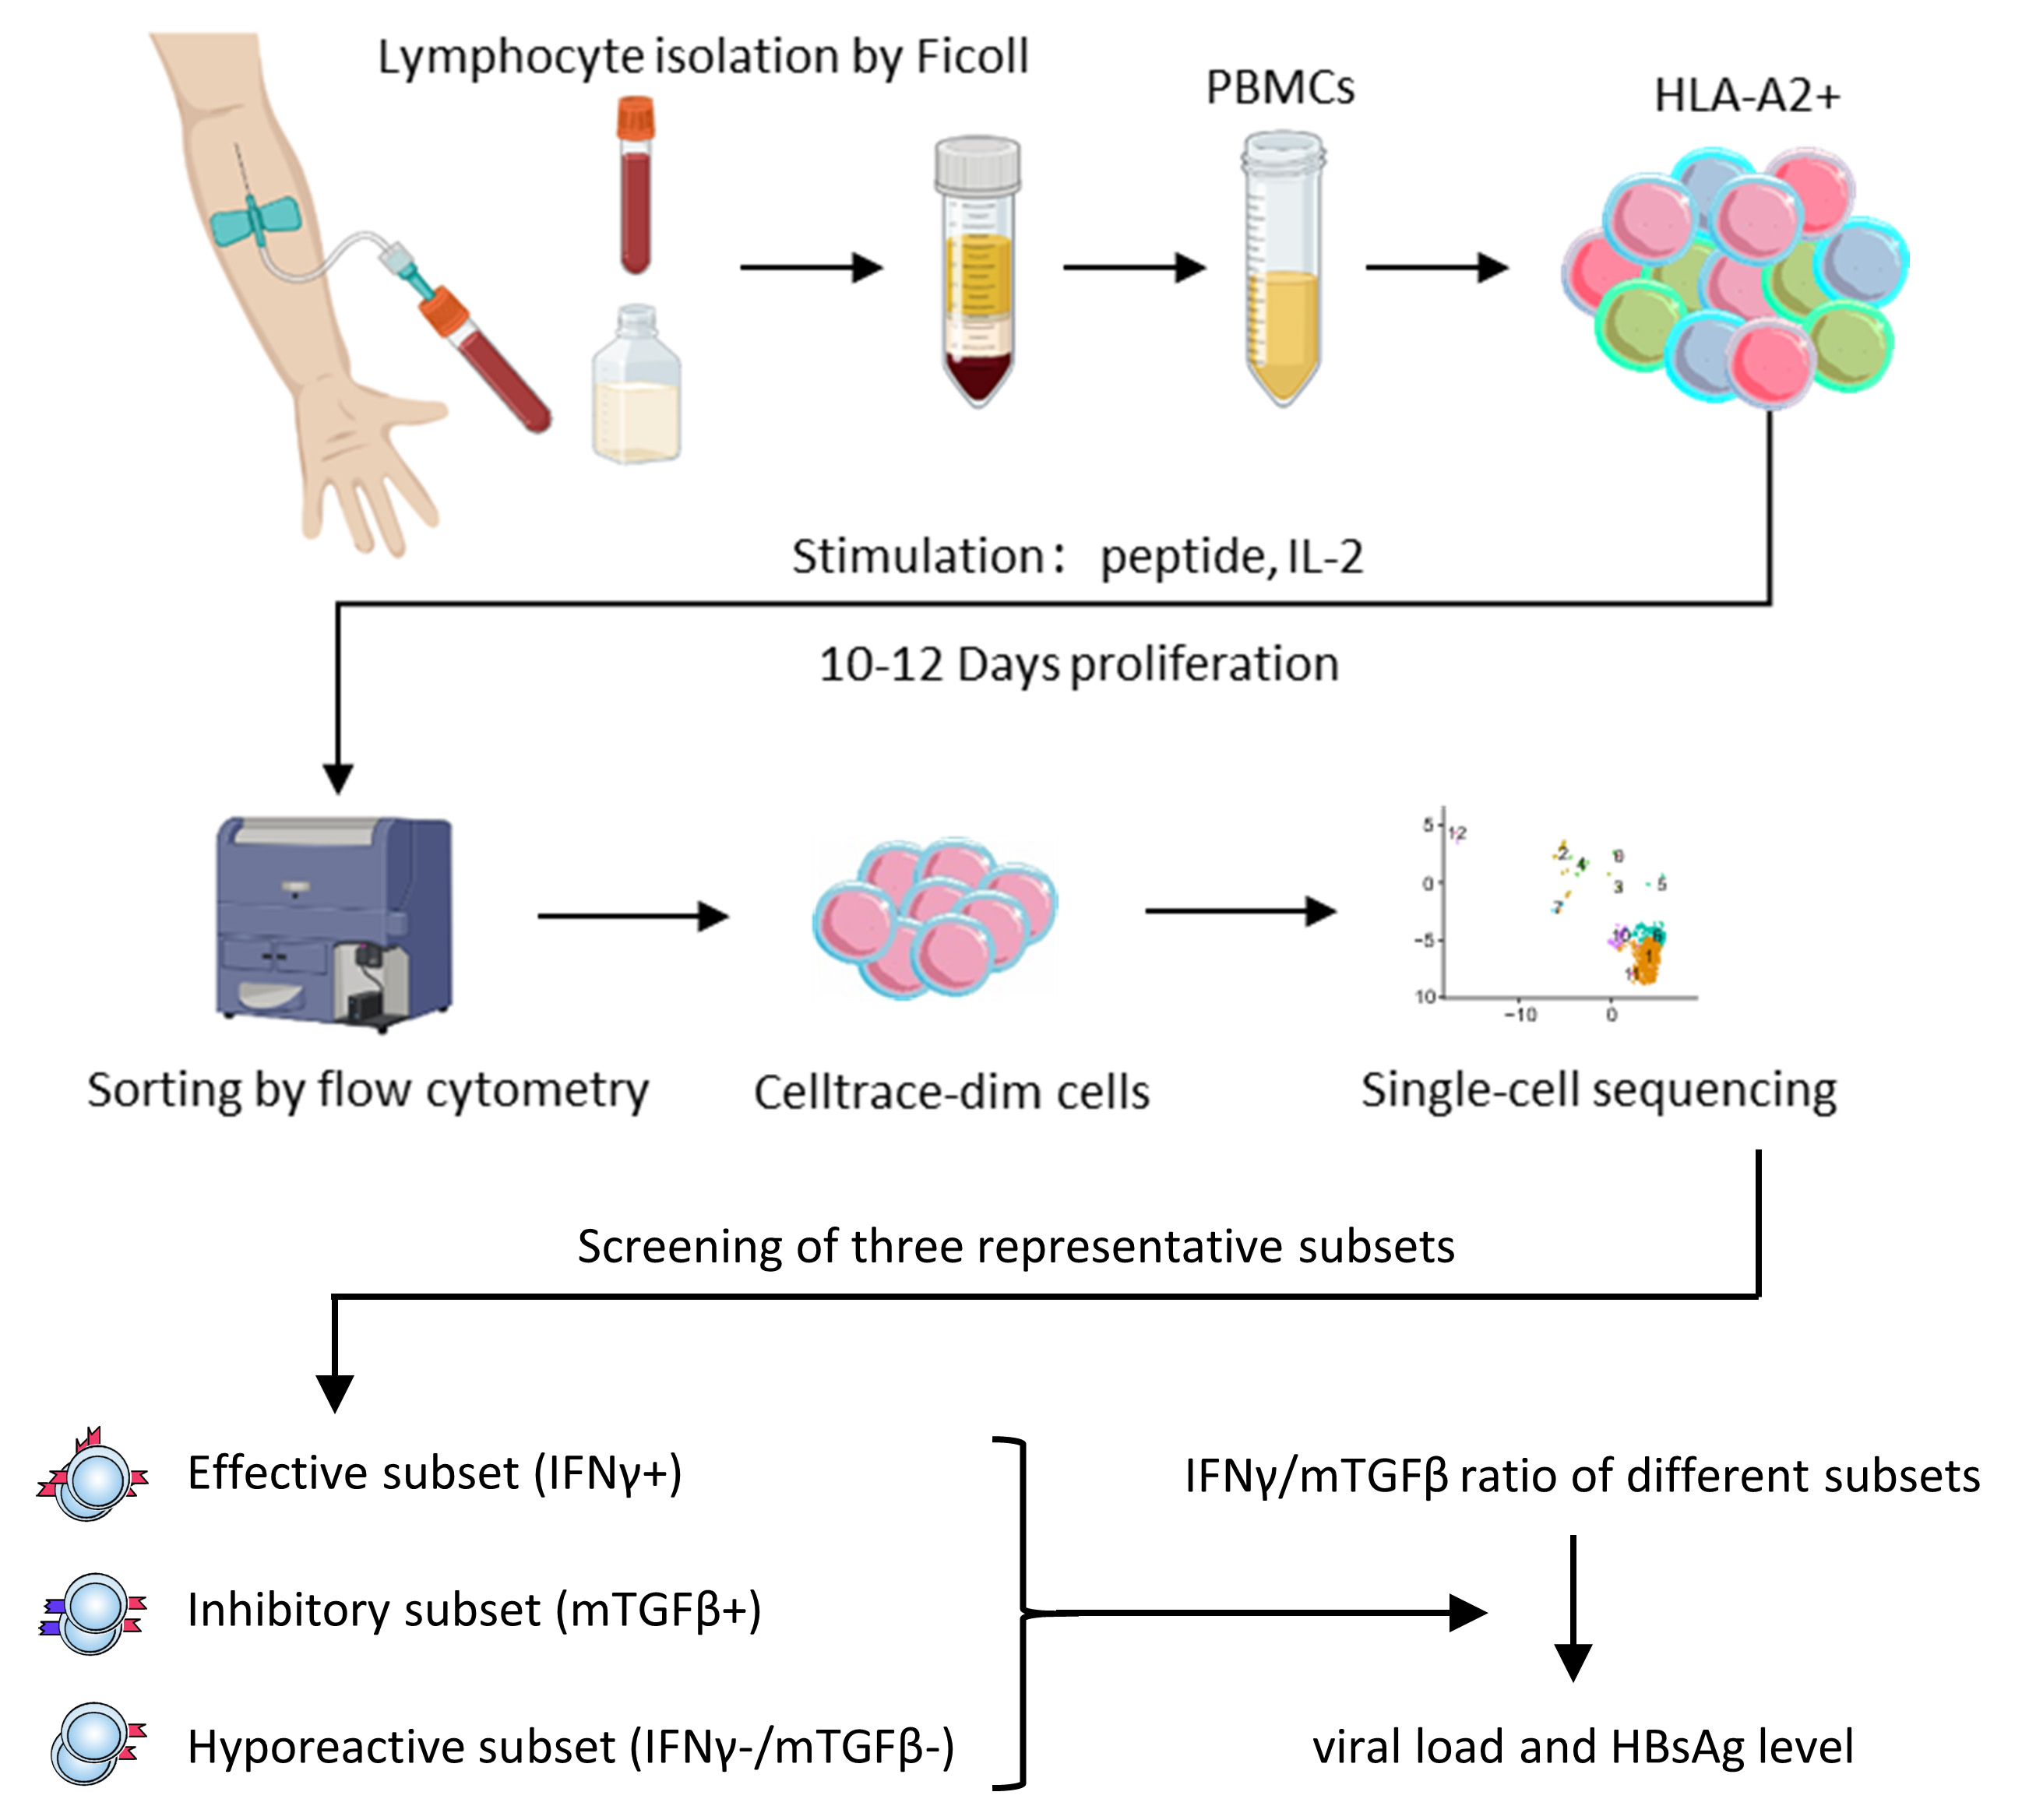
HBV-specific CD8+ T cells targeting the HLA-A2-restricted core 18–27 HBV epitope were expanded in vitro (Fig. 1A). The utilized epitopes included both wild-type FLPSDFFPSV (HBC group) and the mutant variant FLPSDFFPSI (HBC-PSI group). CMV-specific CD8+ T cells targeting the HLA-A2-restricted pp65 495–503 epitope were used as a positive control (CMV group). Samples showing nonspecific or no expansion were excluded from further analysis.
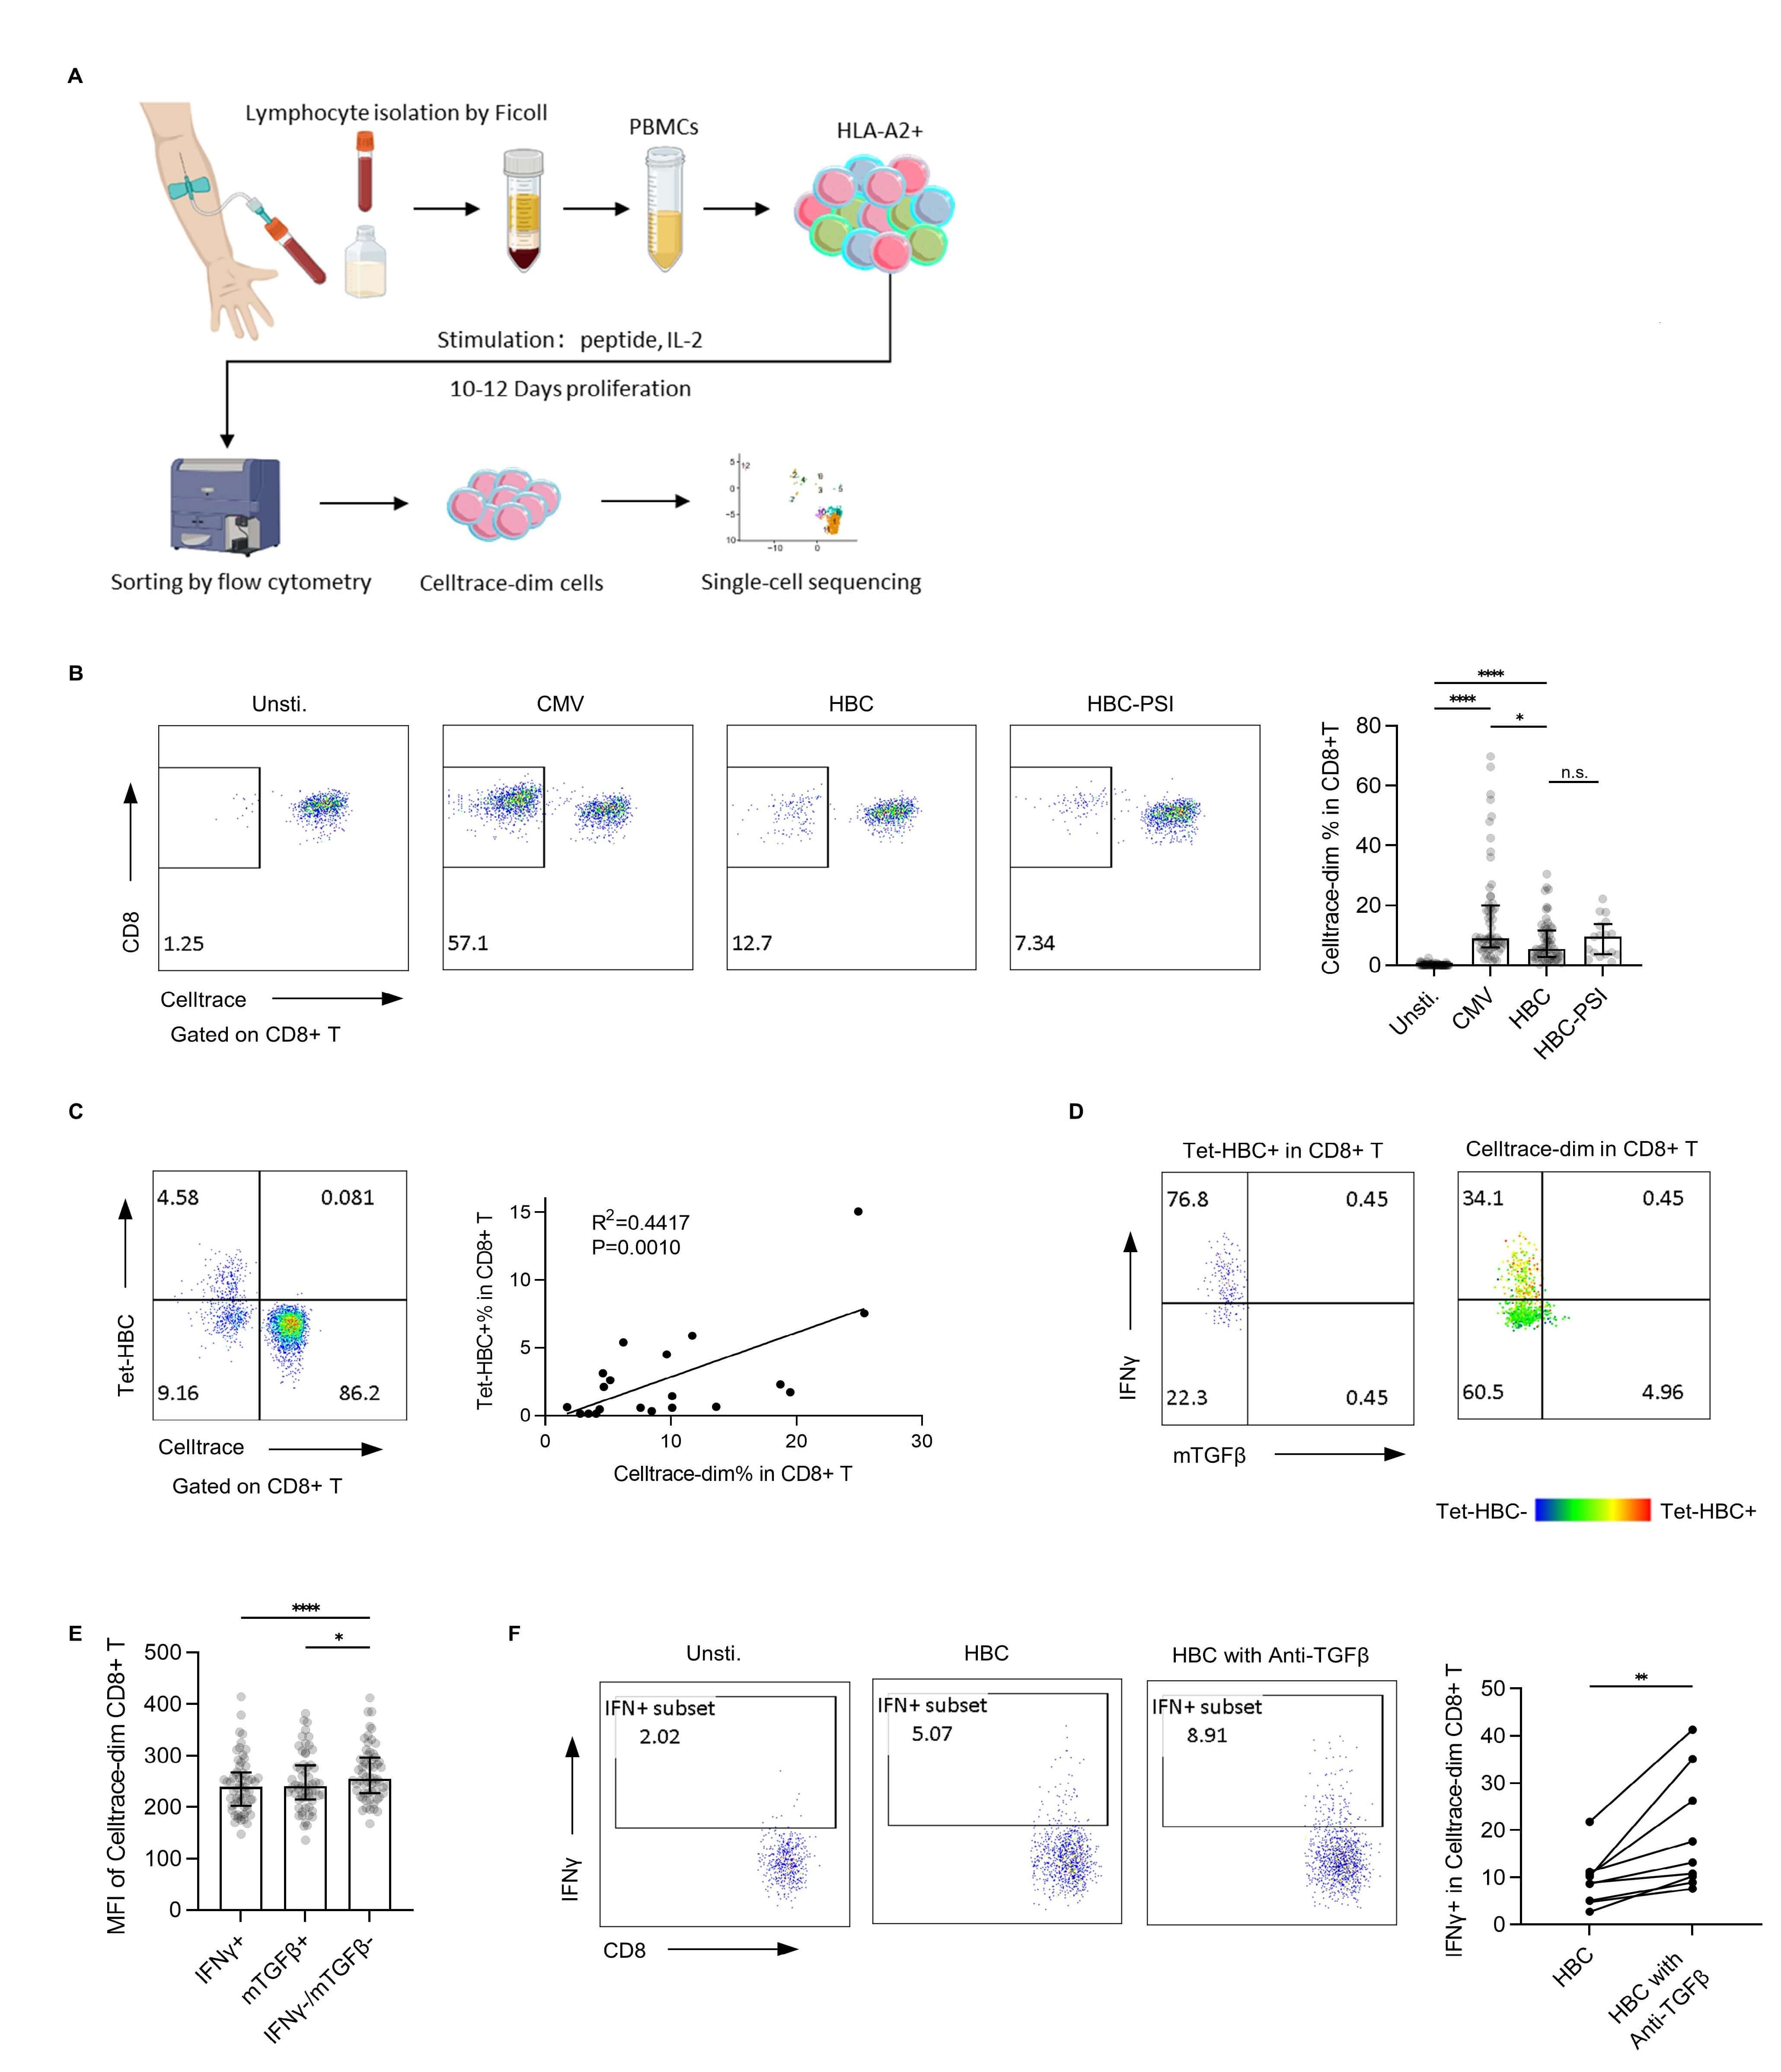 Fig. 1.
In vitro expansion of single peptide-specific CD8+ T
cells. (A) Study flowchart. (B) The percentage of proliferated cells after
in vitro expansion was assessed by flow cytometry. Left panel:
representative plot from one patient with a chronic hepatitis B infection. Right
panel: bar plot for all samples (Unstimulated, CMV, HBC: n = 60, HBC-PSI: n =
17), with the bar showing the median and interquartile range. (C) HBV core 18–27
tetramer-based detection of CD8+ T cells. Left panel: a representative tetramer
detection plot. Right panel: Linear regression analysis of the association
between Tet-HBC+ cells and CellTracedim cells. (D) IFN
The HBC group exhibited a lower expansion rate compared to the CMV group, while
no significant difference was observed between the HBC and HBC-PSI groups (Fig. 1B). The final expanded cell count varied substantially across individuals, as it
was largely determined by the precursor frequency of specific T cells in each
donor. With an initial total cell concentration of 1–2
After in vitro expansion, HBV-specific CD8+ T cells were re-stimulated
with peptide-loaded T2 cells and assessed for IFN
To functionally validate this mTGF
To further clarify the biological functions of these different functional
subsets, HBV-specific CD8+ T cells were subjected to single-cell immune-targeted
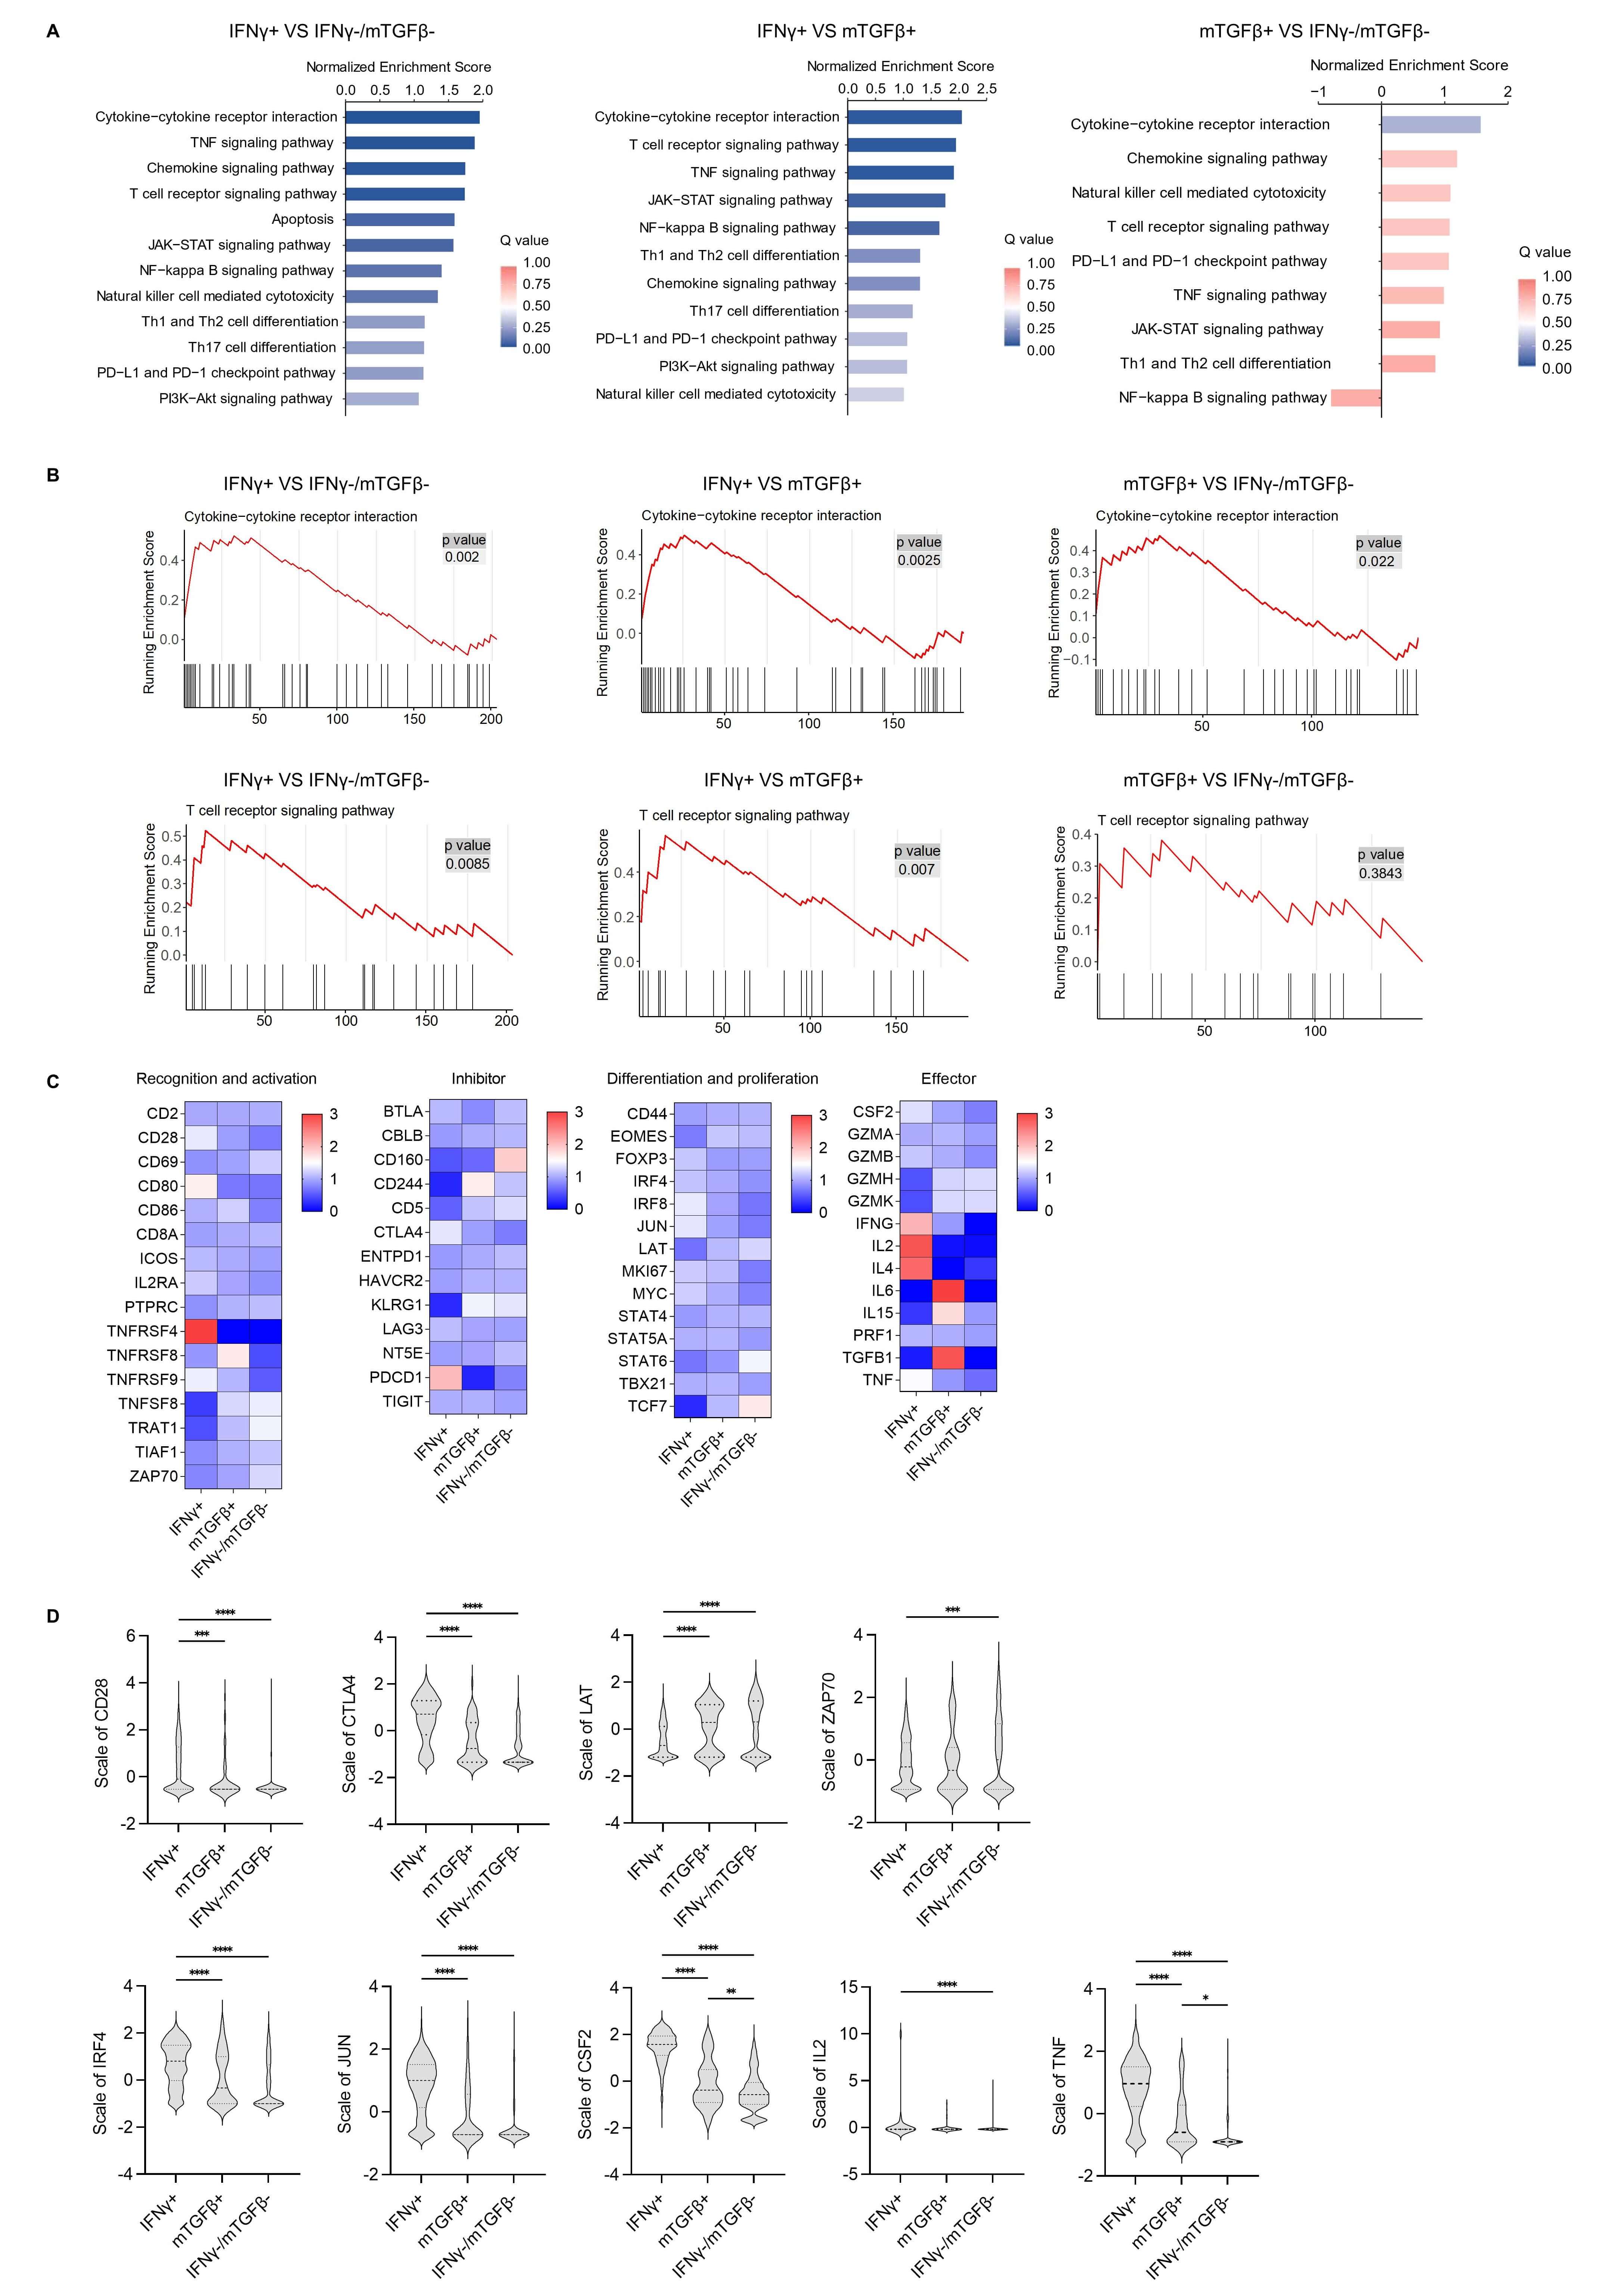
RNA sequencing. The main immune-related signaling pathways identified using this
approach are shown in Fig. 2A. Among these three T cell subsets, the
IFN
 Fig. 2.
Single-cell sequencing analysis of different functional subsets
of HBC-specific CD8+ T cells. (A) The main immune-related signaling pathways
enriched in differentially regulated genes as detected by KEGG enrichment
analysis among the IFN
Next, the main genes involved in T cell recognition, activation,
differentiation, and the effector stage were analyzed using a heatmap (Fig. 2C),
which revealed distinct expression patterns across subsets. The IFN
TCR signaling pathway activation is closely related to downstream gene
expression. In the GSEA analysis of the TCR signaling pathway, the top annotated
genes CSF2/IL2/TNF/CTLA4 were highly expressed in the IFN
T cells recognizing a single epitope exhibit a variety of different TCR
sequences. Recognition and matching of different TCRs with the corresponding pMHC
complex is critical for CD8+ T cell function. We thus speculated that pMHC-TCR
binding is associated with differential patterns of gene expression. In our
analysis, different MFI values were observed when staining HBV-specific CD8+ T
cells with the Tet-HBC tetramer (Supplementary Fig. 2B), consistent with
previous studies [9, 16], suggesting that these MFI differences may be
attributable to TCR-pMHC affinity variance. Further analysis of the frequency and
intensity of tetramer staining for each subset of peptide-specific CD8+ T cells
revealed that the IFN
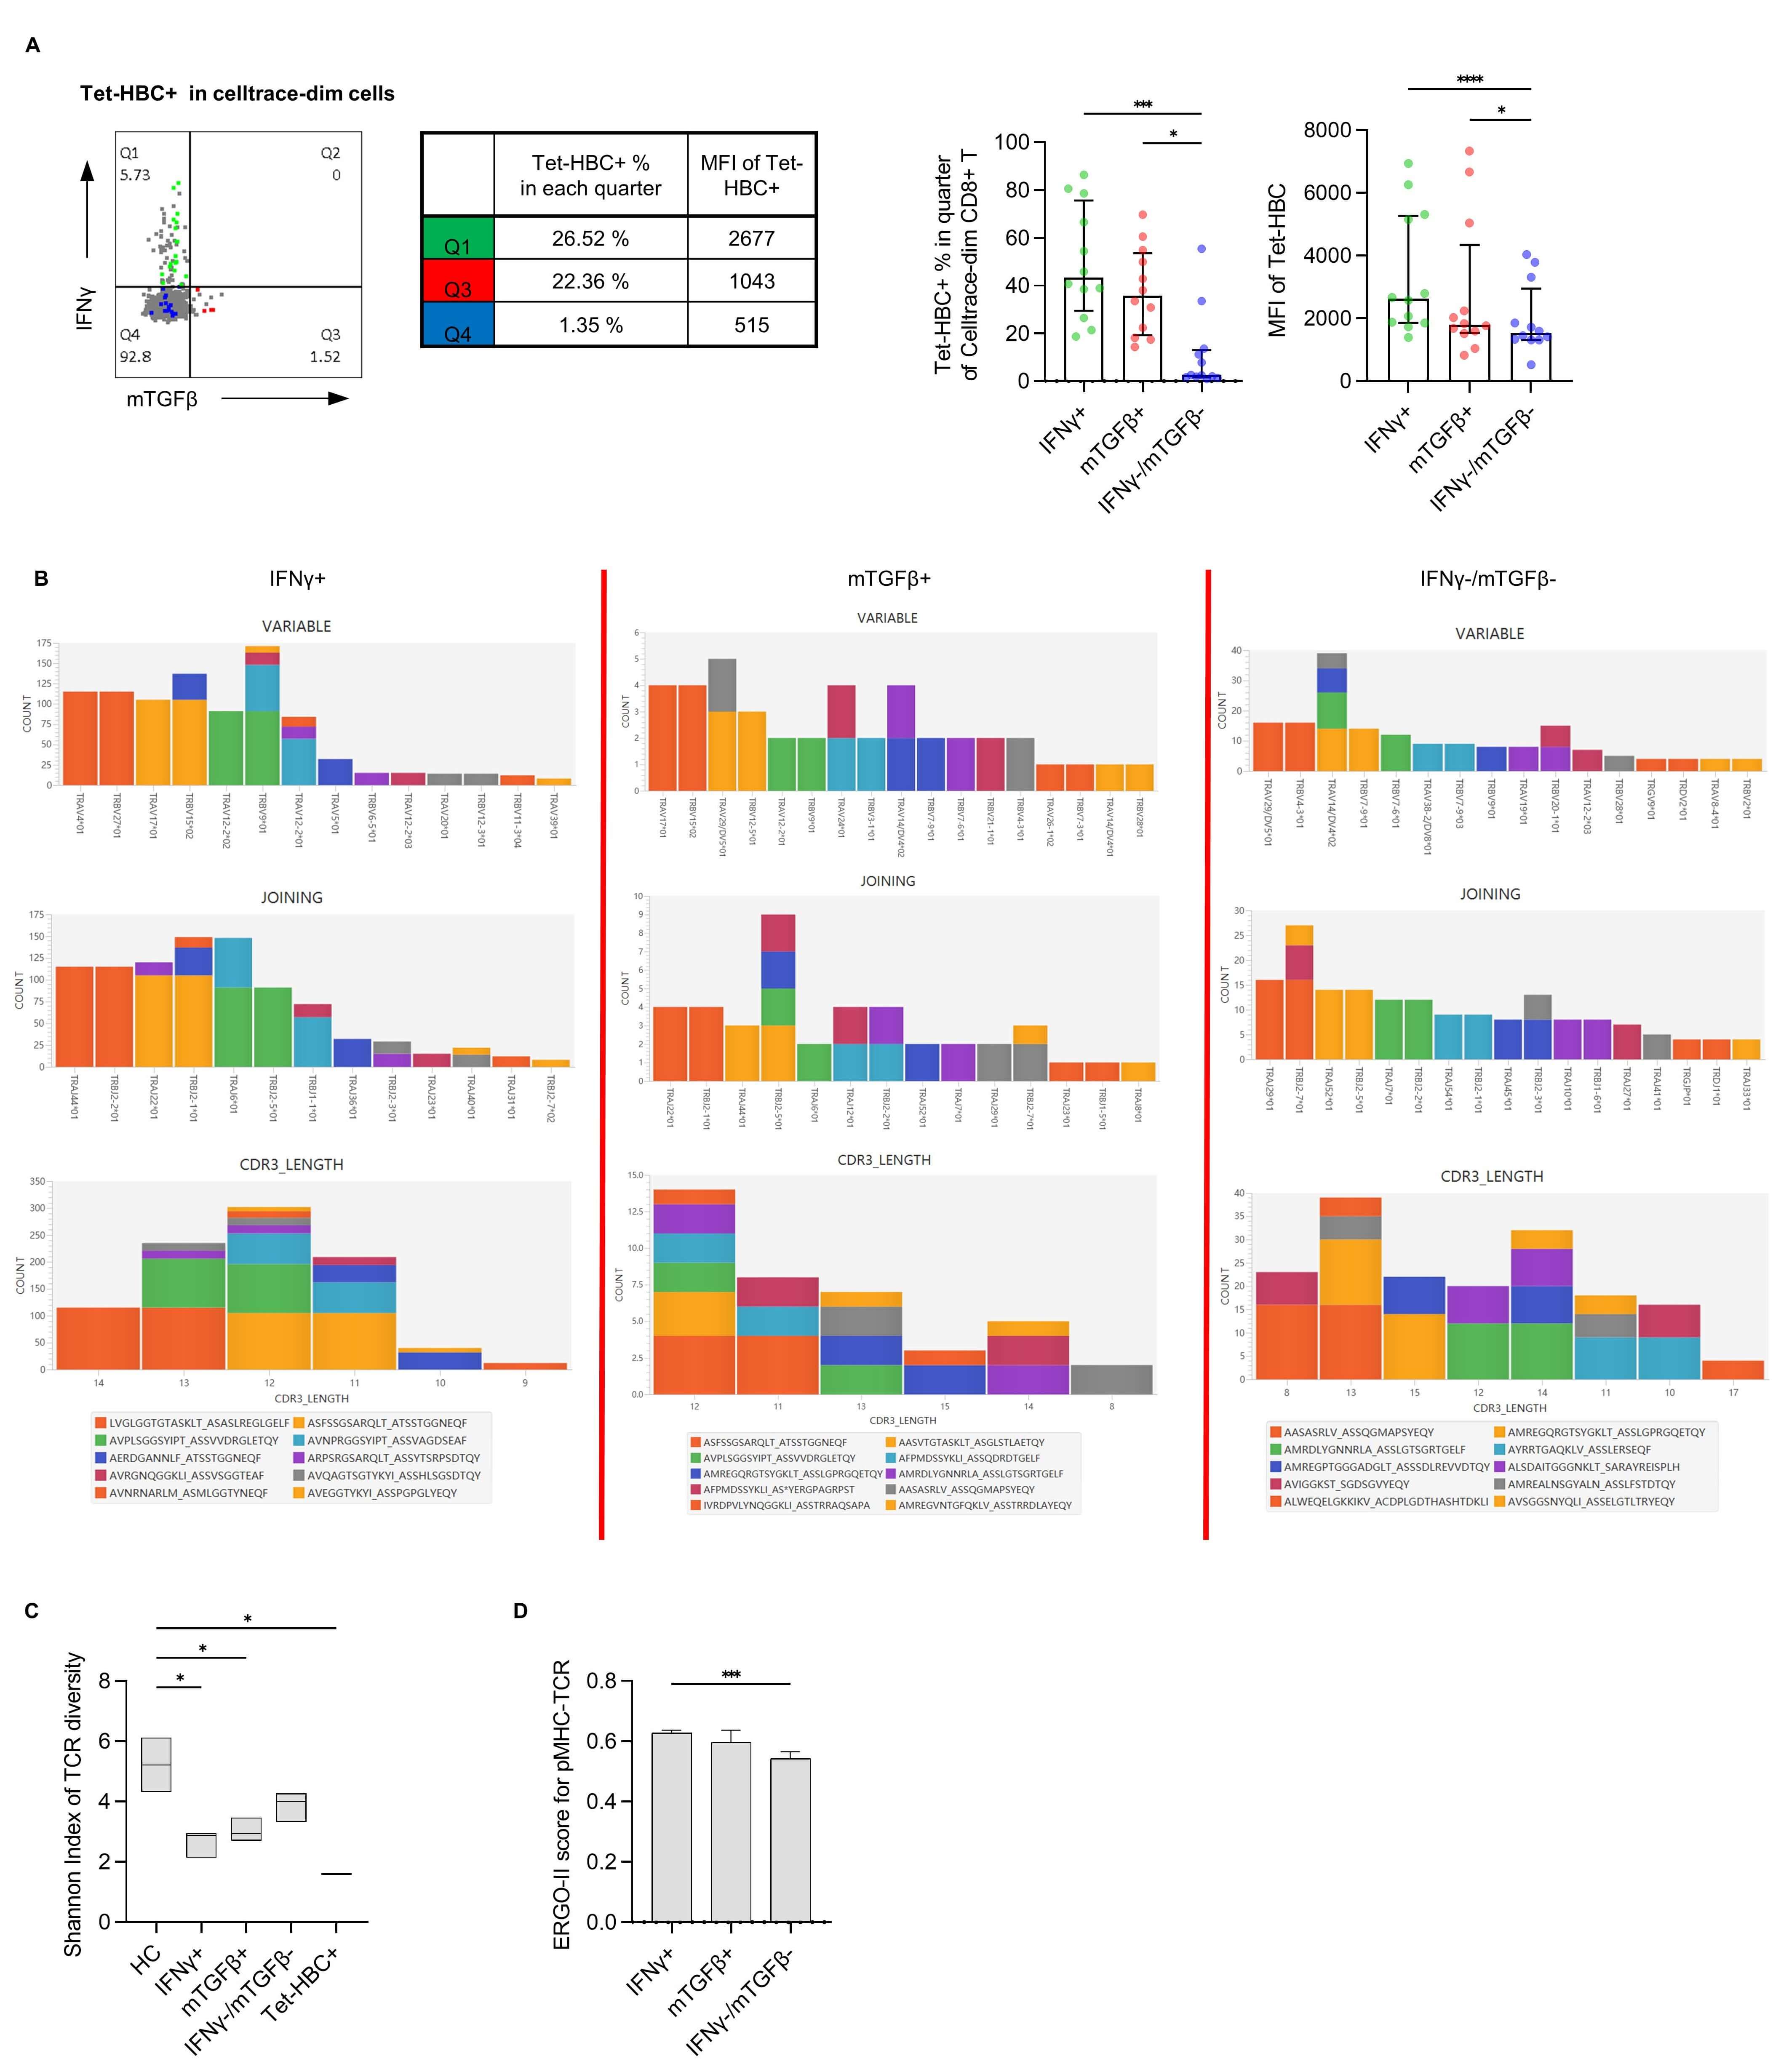 Fig. 3.
Evaluation of pMHC-TCR affinity using the Tet-HBC tetramer and
the ERGO-II model. (A) Left panel: Representative plot from one patient with
different Tet-HBC+ % and MFI values in the IFN
To test whether pMHC-TCR differs among these three subsets, single-cell TCR
sequencing was performed. As the TCR-CDR3 region plays an important role in pMHC
recognition [17], TRAV/TRBV usage, TRAJ/TRBJ usage, amino acid length, and amino
acid sequence of TRAV-CDR3/TRBV-CDR3 for dominant clones among the
IFN
The ERGO-Ⅱ model was next applied to characterize TCR-pMHC affinity between
different groups. The results of this predictive analysis revealed that the
IFN
To evaluate the relationship between effector/inhibitory subsets and clinical
disease, IFN
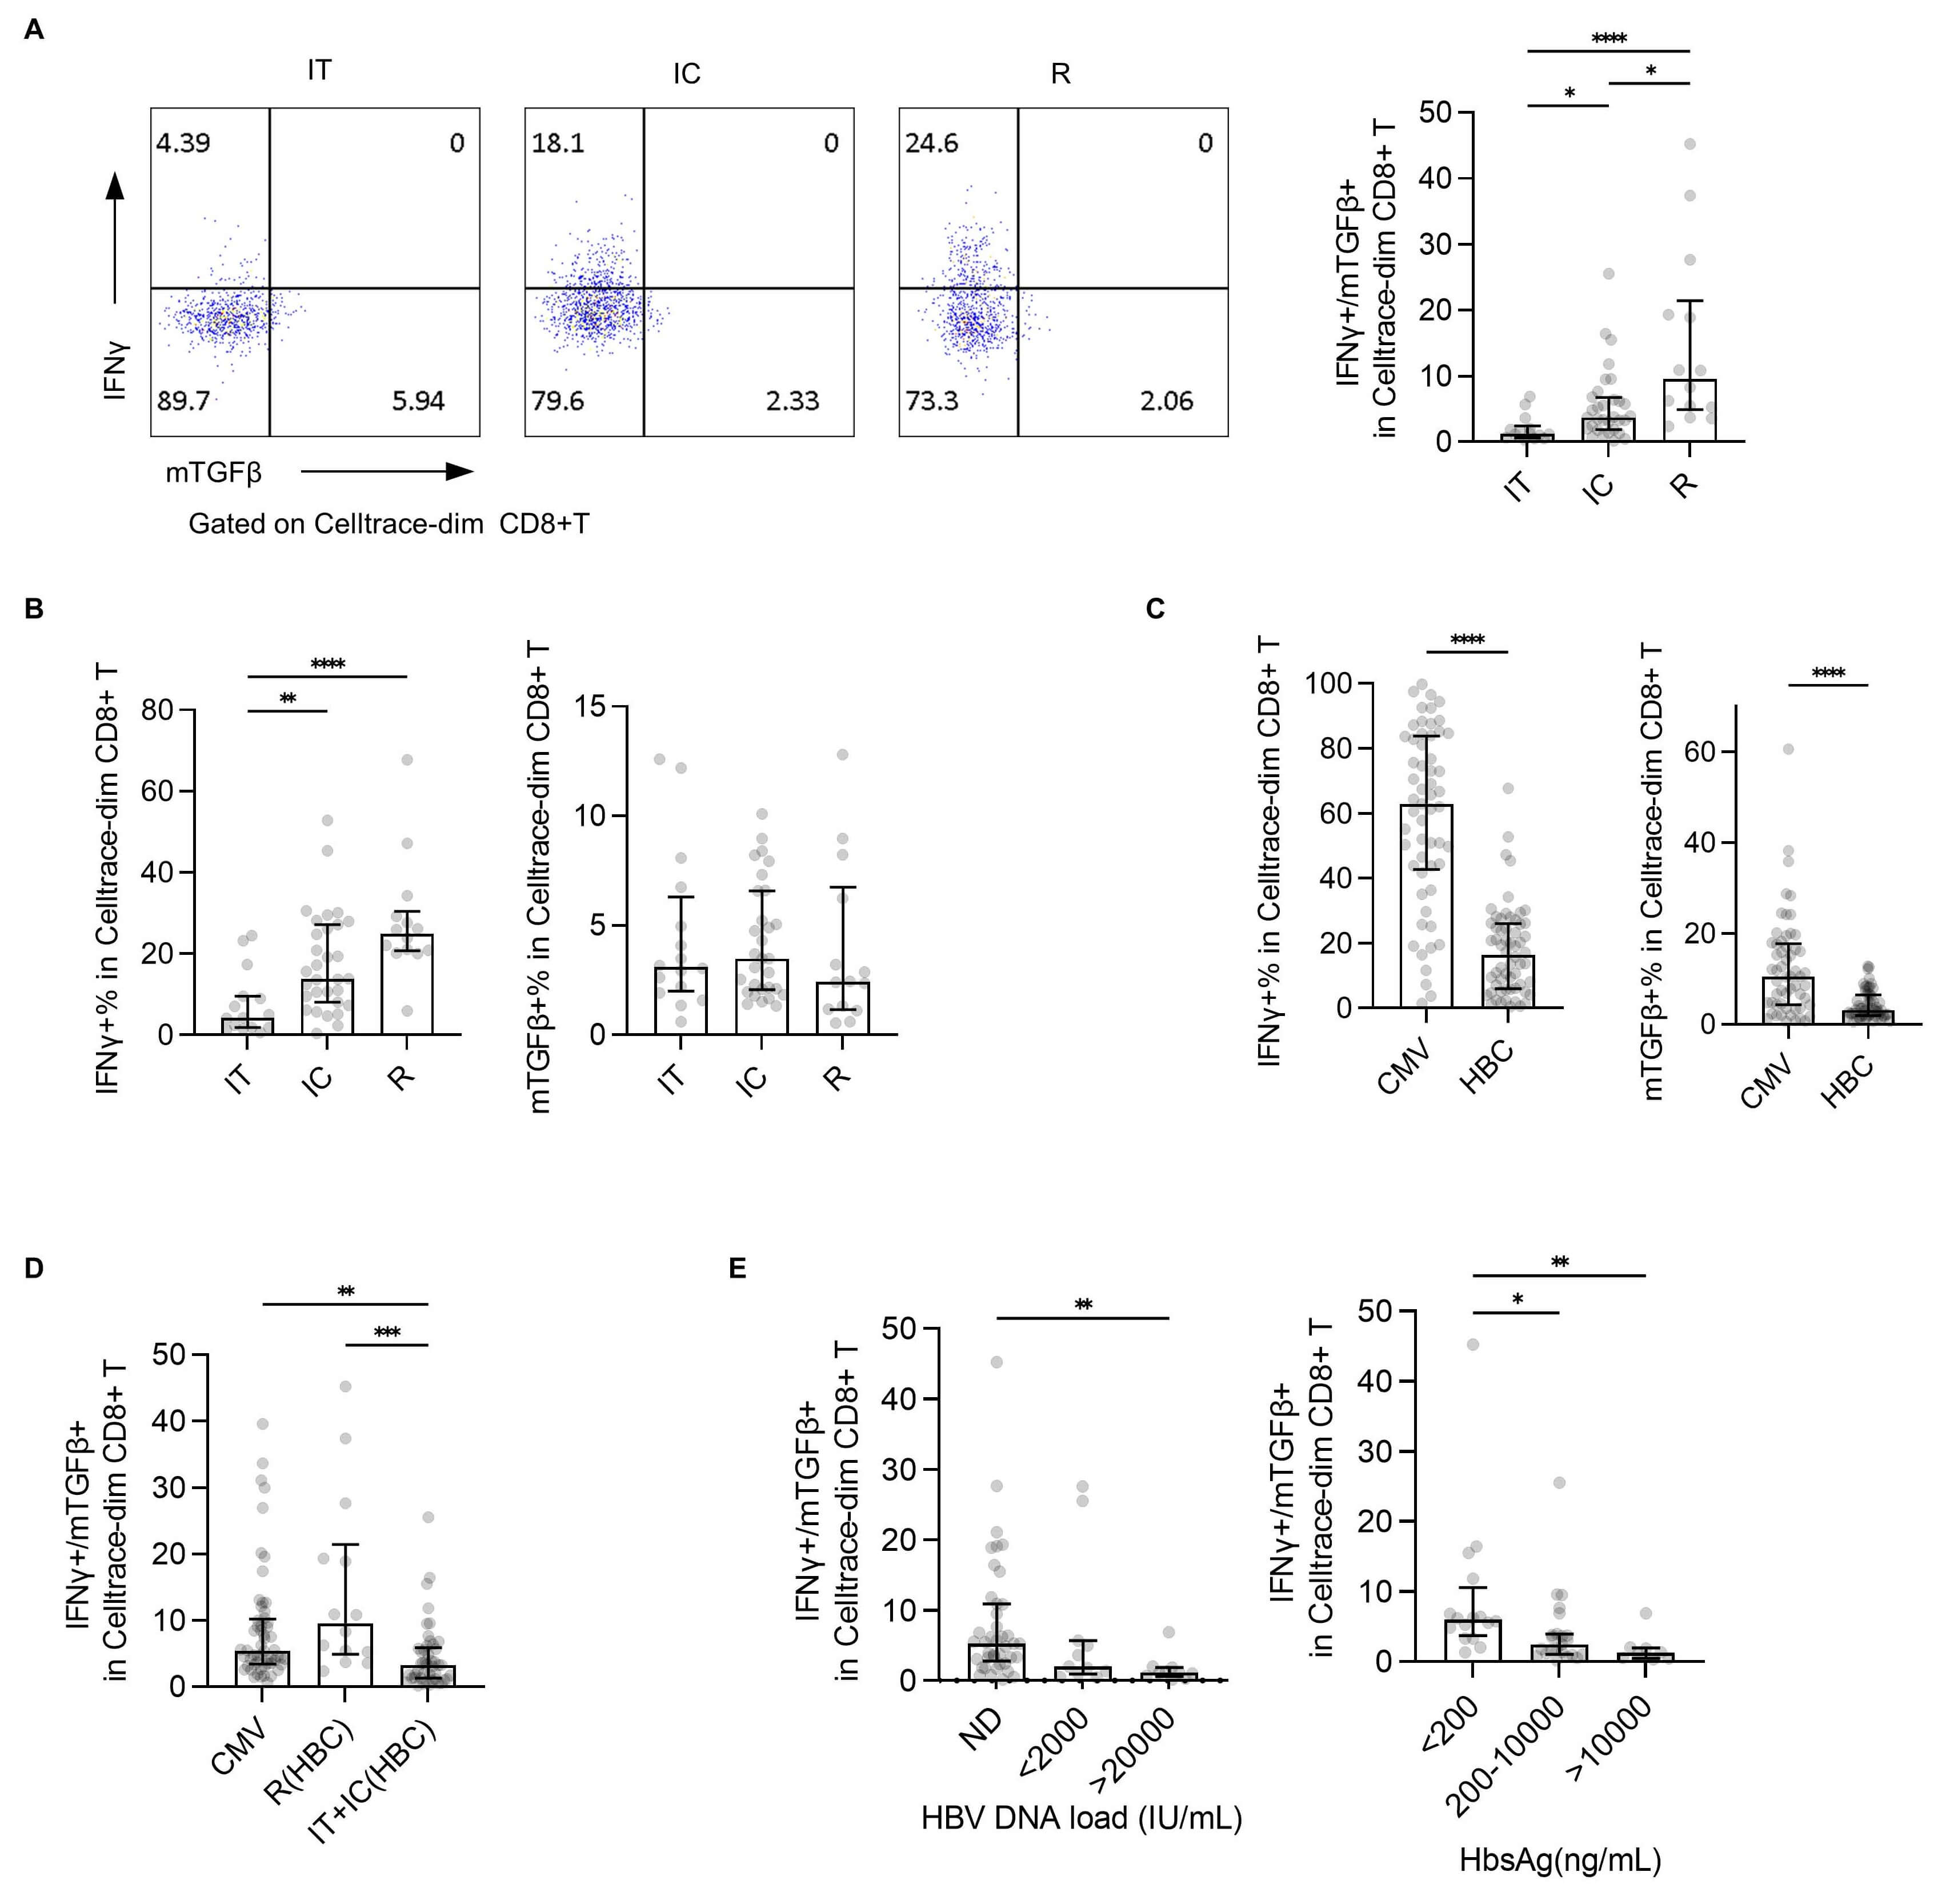 Fig. 4.
Evaluation of the IFN
Consistently, the IFN
Some controversy persists regarding the definition of specific CD8+ T cells. Previous studies have reported a correlation between total T cells and HBV-specific CD8+ T cells in terms of phenotypic and functional characteristics, with total T cells also reflecting the clinical severity of HBV infection [20]. These findings suggest that some specific CD8+ T cells may not yet have been fully characterized. In our study, Tet-HBC+ T cell subsets were detected among proliferated T cells from 21 out of 60 individuals, including 6/16 in the IT group, 11/30 in the IC group, and 4/14 in the R group. Based on previous studies [21, 22], we propose that genetic factors such as HLAA2 polymorphisms, rather than disease status, contribute to the limited detection efficiency of specific CD8+ T cells using a tetramer-based approach. Moreover, a substantial proportion of HBV-specific CD8+ T cells in the IT group exhibited low affinity and diminished immune function, which further limits their detection via conventional tetramer staining. In this study, specific CD8+ T cells were defined through in vitro expansion following peptide stimulation. Although expanded cells show some changes in their phenotype and functionality [23], this approach enabled the detection of a broader spectrum of functional phenotypes, particularly for inhibitory subsets of T cells that are often overlooked in the context of tetramer staining. This provides a valuable complementary strategy for the comprehensive profiling of specific CD8+ T cells, as well as a supplemental strategy that can improve results obtained through tetramer detection.
The HBV core 18–27 epitope is a classical target of HLA-A*0201-restricted CD8+ T-cell responses in HBV infection. However, in Asian populations, HBV genotypes B and C almost exclusively carry this V27I mutation (FLPSDFFPSI) [21], which impairs peptide binding to HLA-A*0201 [24]. Despite this reduced affinity, our data confirmed that both wild-type and variant peptides induce T-cell proliferation and could be detected by HBV core 18–27 Tetramer (Supplementary Fig. 2A), and V27-primed T cells cross-recognize the I27 variant (Supplementary Fig. 3A). These findings are consistent with previous studies demonstrating cross-reactivity between V27 and I27 epitopes [25], suggesting that TCR affinity, rather than MHC binding, dominates the functional response.
Hyporeactive T cells have been conventionally classified into three categories:
exhausted T cells exhibiting
CD45RO+/CD57+/CD95+/PD-1+/CTLA-4+/Tim-3+/LAG-3+/BTLA+ expression; anergic T cells
expressing LAG-3+/PD-1+; and senescent T cells expressing KLRG1+/CD28-/CD57+ [8].
These cells generally exhibit limited proliferative capacity [26]. Although in
vitro expansion may partially select against such hypoproliferative cells, some
reactive subsets with a distinct expression pattern could nonetheless be detected
(Supplementary Fig. 4). In this study, by leveraging the natural model
of CHB infection, HBV-specific CD8+ T cells were classified into three subsets:
an effector subset (IFN
In this study, the effector subset exhibited elevated expression of annotated
genes associated with the cytokine-cytokine receptor interaction pathway,
consistent with the functional capacity of these cells. Notably, both
PDCD1 and FOXP3 were highly expressed in the effector subset,
whereas they were expressed at lower levels in the hyporeactive and inhibitory
subsets, suggesting that in the context of HBV-specific CD8+ T cells, these
markers may not primarily serve as indicators of inhibition, consistent with the
recent results from Luo et al. [27]. The hyporeactive
IFN
As most cells within this subset were negative for tetramer detection, they have
likely been overlooked in prior tetramer-based studies focused on specific CD8+ T
cells. Collectively, these results suggest that the
IFN
TGF
The post-proliferation frequency of specific CD8+ T cells is related to their
precursor frequency, as the proliferative capacity (amplification index) remains
consistent across different epitopes [35]. In this study, the post-proliferation
frequency of HBV core-specific CD8+ T cells did not correlate with the clinical
outcome of hepatitis B infection. The variation in precursor frequency of
specific CD8+ T cells among individuals is likely attributable to inherent
differences in their T cell repertoire. Age has been identified as a contributing
factor associated with the precursor frequency of IFN
Studies have also shown that specific T cells responsive to different antigenic epitopes have different reactivity [5]. Recent evidence has further indicated that antigen types influence the aging trajectory of memory T cells [37]. Our findings extend this concept by demonstrating that even among specific T cells responsive to a single epitope, considerable functional heterogeneity exists. Notably, we observed no differences in the proliferation or function of specific CD8+ T cells between the HBC and HBC-PSI groups, suggesting that this particular viral mutation does not substantially alter the phenotype of specific CD8+ T cells, which is consistent with the findings of Hoogeveen et al. [6]. We hypothesize that it is the T cell repertoire in different individuals, rather than any viral mutation, that determines the clinical outcome of HBV infection. However, when combined with different HLA alleles, this mutation will also lead to the impairment of T cell reactivity [38]. This factor should be carefully considered in the application of T cell therapy.
The recognition of the TCRs of specific CD8+ T cells is not merely specific to a
peptide, but to an intact pMHC complex [17, 39]. This affinity between pMHC
complex and TCR serves as a critical indicator of the strength of immune
responses against a given antigen, and is influenced collectively by antigen
epitopes, MHC type, TCR sequence and expression levels, costimulatory molecules,
and the TCR signaling pathway [40, 41]. Recent studies have analyzed the
phenotypes and functions of T cells associated with different clinical outcomes
by single-cell sequencing and found that there are more exhausted CD8+ T cells in
immune-activated and acute convalescent patients [19]. Our single-cell sequencing
results focused specifically on proliferating CD8+ T cells also showed that TCR
diversity was significantly reduced in the effector subset (IFN
Of note, we detected a proportion of TRGV9+ and TRDV2+
Serum conversion of HBeAg is a clinically important prognostic marker in
hepatitis B infection. In CHB patients, HBeAg– individuals exhibit enhanced
functionality of HBV core-specific CD8+ T cells as compared to HBeAg+ individuals
[6]. Studies employing ELISPOT assays after stimulation with HBV peptide pools
have demonstrated that IFN
Although the TCR-pMHC affinity of specific CD8+ T cells cannot be altered, it
can be modified through immune-focused interventions such as therapeutic
vaccines, PD-1 blockade, metabolic interventions, TLR antagonists, TCR-T, CAR-T,
or soluble TCRS strategies [15, 49, 50, 51, 52], offering potential opportunities to
redirect T cell clones such that they differentiate into effector subsets.
Hypoxic tumor microenvironments have been reported to promote the generation of
CD39+ T cells, and microenvironmental modulation can alter the immunosuppressive
status of these exhausted T cells [53]. Similarly, a recombinant fusion protein
including IL-10 and the IgG Fc region has been shown to activate the pyruvate/MPC
pathway within terminally depleted T cells by reprogramming cellular metabolism,
thereby enhancing oxidative phosphorylation levels and the anti-tumor efficacy of
these immune cells [54]. In vitro metabolic intervention with MitoQ has
also been shown to alter the ratio of effector/inhibitory subsets of specific
CD8+ T cells [55]. Wang et al. [10] previously confirmed the efficacy of
metabolic interventions by analyzing HBV-specific T cell responses in CHB
patients with different disease outcomes, including mitochondria-targeted
antioxidants (Mito-TEMPO and MitoQ), polyphenol compounds (resveratrol +
oleuropein), and cholesterol acyltransferase inhibitors (AVASIMIBE + K-604),
which regulate HBV-specific T cell function in patients with CHB [56]. Notably,
these metabolic interventions did not show a substantial influence on HBV
core-specific CD8+ T cells despite significantly enhancing IFN
Several limitations should be acknowledged in the present study. First, this was an observational study lacking any strict control over potential confounding variables, which may have introduced considerable bias. As such, our conclusions require further validation through more rigorous clinical investigation, including prospective studies. Second, HLA-A2 subtypes were not determined for the study participants, highlighting another factor that should be taken into account in future research. Third, although healthy individuals were initially intended as controls, the precursor frequency of HBV-specific T cells was extremely low in this population, making them difficult to detect even after in vitro expansion; we therefore used convalescent patients as a surrogate for individuals with a natural immune response, representing another methodological limitation. Finally, the present study sought to demonstrate that CHB infection is mainly driven by intrinsic interindividual differences in the T cell repertoire, rather than by T cell exhaustion. However, the current evidence is not sufficiently robust to support this conclusion, and in future studies, T cells from HBV-naïve children may be used as controls to further verify this hypothesis.
This study explored the differentiation of T cell subsets and the association of these subsets with TCR-pMHC affinity in the context of CHB infection. Overall, our results support a model in which functionally distinct immune responses can be induced by single peptide-specific CD8+ T cells. These findings provide a theoretical basis to inform the further development of T cell-based immunotherapies. Future studies should focus on approaches to modulating the balance between effector and inhibitory CD8+ T cell subsets through in vitro interventions, thereby enhancing antiviral immune efficacy.
The original contributions presented in the study are included in the article/Supplementary Material. Further inquiries can be directed to the corresponding authors. The NGS datasets presented in this study can be found in the NCBI SRA BioProject, accession No.: SUB14183699.
Conceive and design the experiments: XWW, XFW, SL; perform the experiments: ZS, XW, JZ; collect the clinical samples: ZS, LO; analyze the data: MW, TZ, LO; prepare the manuscript: ZS. All authors contributed to editorial changes in the manuscript. All authors read and approved the final manuscript. All authors have participated sufficiently in the work and agreed to be accountable for all aspects of the work.
The study was carried out in accordance with the guidelines of the Declaration of Helsinki. It was approved by the Ethics Committee of Hubei No.3 People’s Hospital (Approval No.: BA2025002). All the samples used in the experiment were from discarded samples after clinical examination and applied for exemption from informed consent.
The authors would like to thank director Yuqi Qu in Basic Scientific Research Reagent Department of MBL for kind provision of the expansion protocol of peptide-specific CD8+ T cells. We also thank Dr. Chen Chen in Department of Breast and Thyroid Surgery of Union Hospital of Huazhong University of Science for her extensive revision of the manuscript.
This work was supported by the National Natural Science Foundation, China (81871226, 32170920) and the Research Foundation of the Health Commission of Hubei Province Scientific Research Project, China (WJ2021F134).
The authors declare no conflicts of interest.
Supplementary material associated with this article can be found, in the online version, at https://doi.org/10.31083/FBL51459.
References
Publisher’s Note: IMR Press stays neutral with regard to jurisdictional claims in published maps and institutional affiliations.