


 , Tusheng Wu 1, Yuan Wang 1, Jiahui Cheng 2, Yiwei Zhao 1, Hong Kou 1, Sijia Liu 1,*
 , Yunyan Zhang 1,*
1 Department of Gynecological Radiotherapy, Harbin Medical University Cancer Hospital, 150081 Harbin, Heilongjiang, China
2 School of Life Science and Technology, Faculty of Life Sciences and Medicine, Harbin Institute of Technology, 150001 Harbin, Heilongjiang, China
Abstract
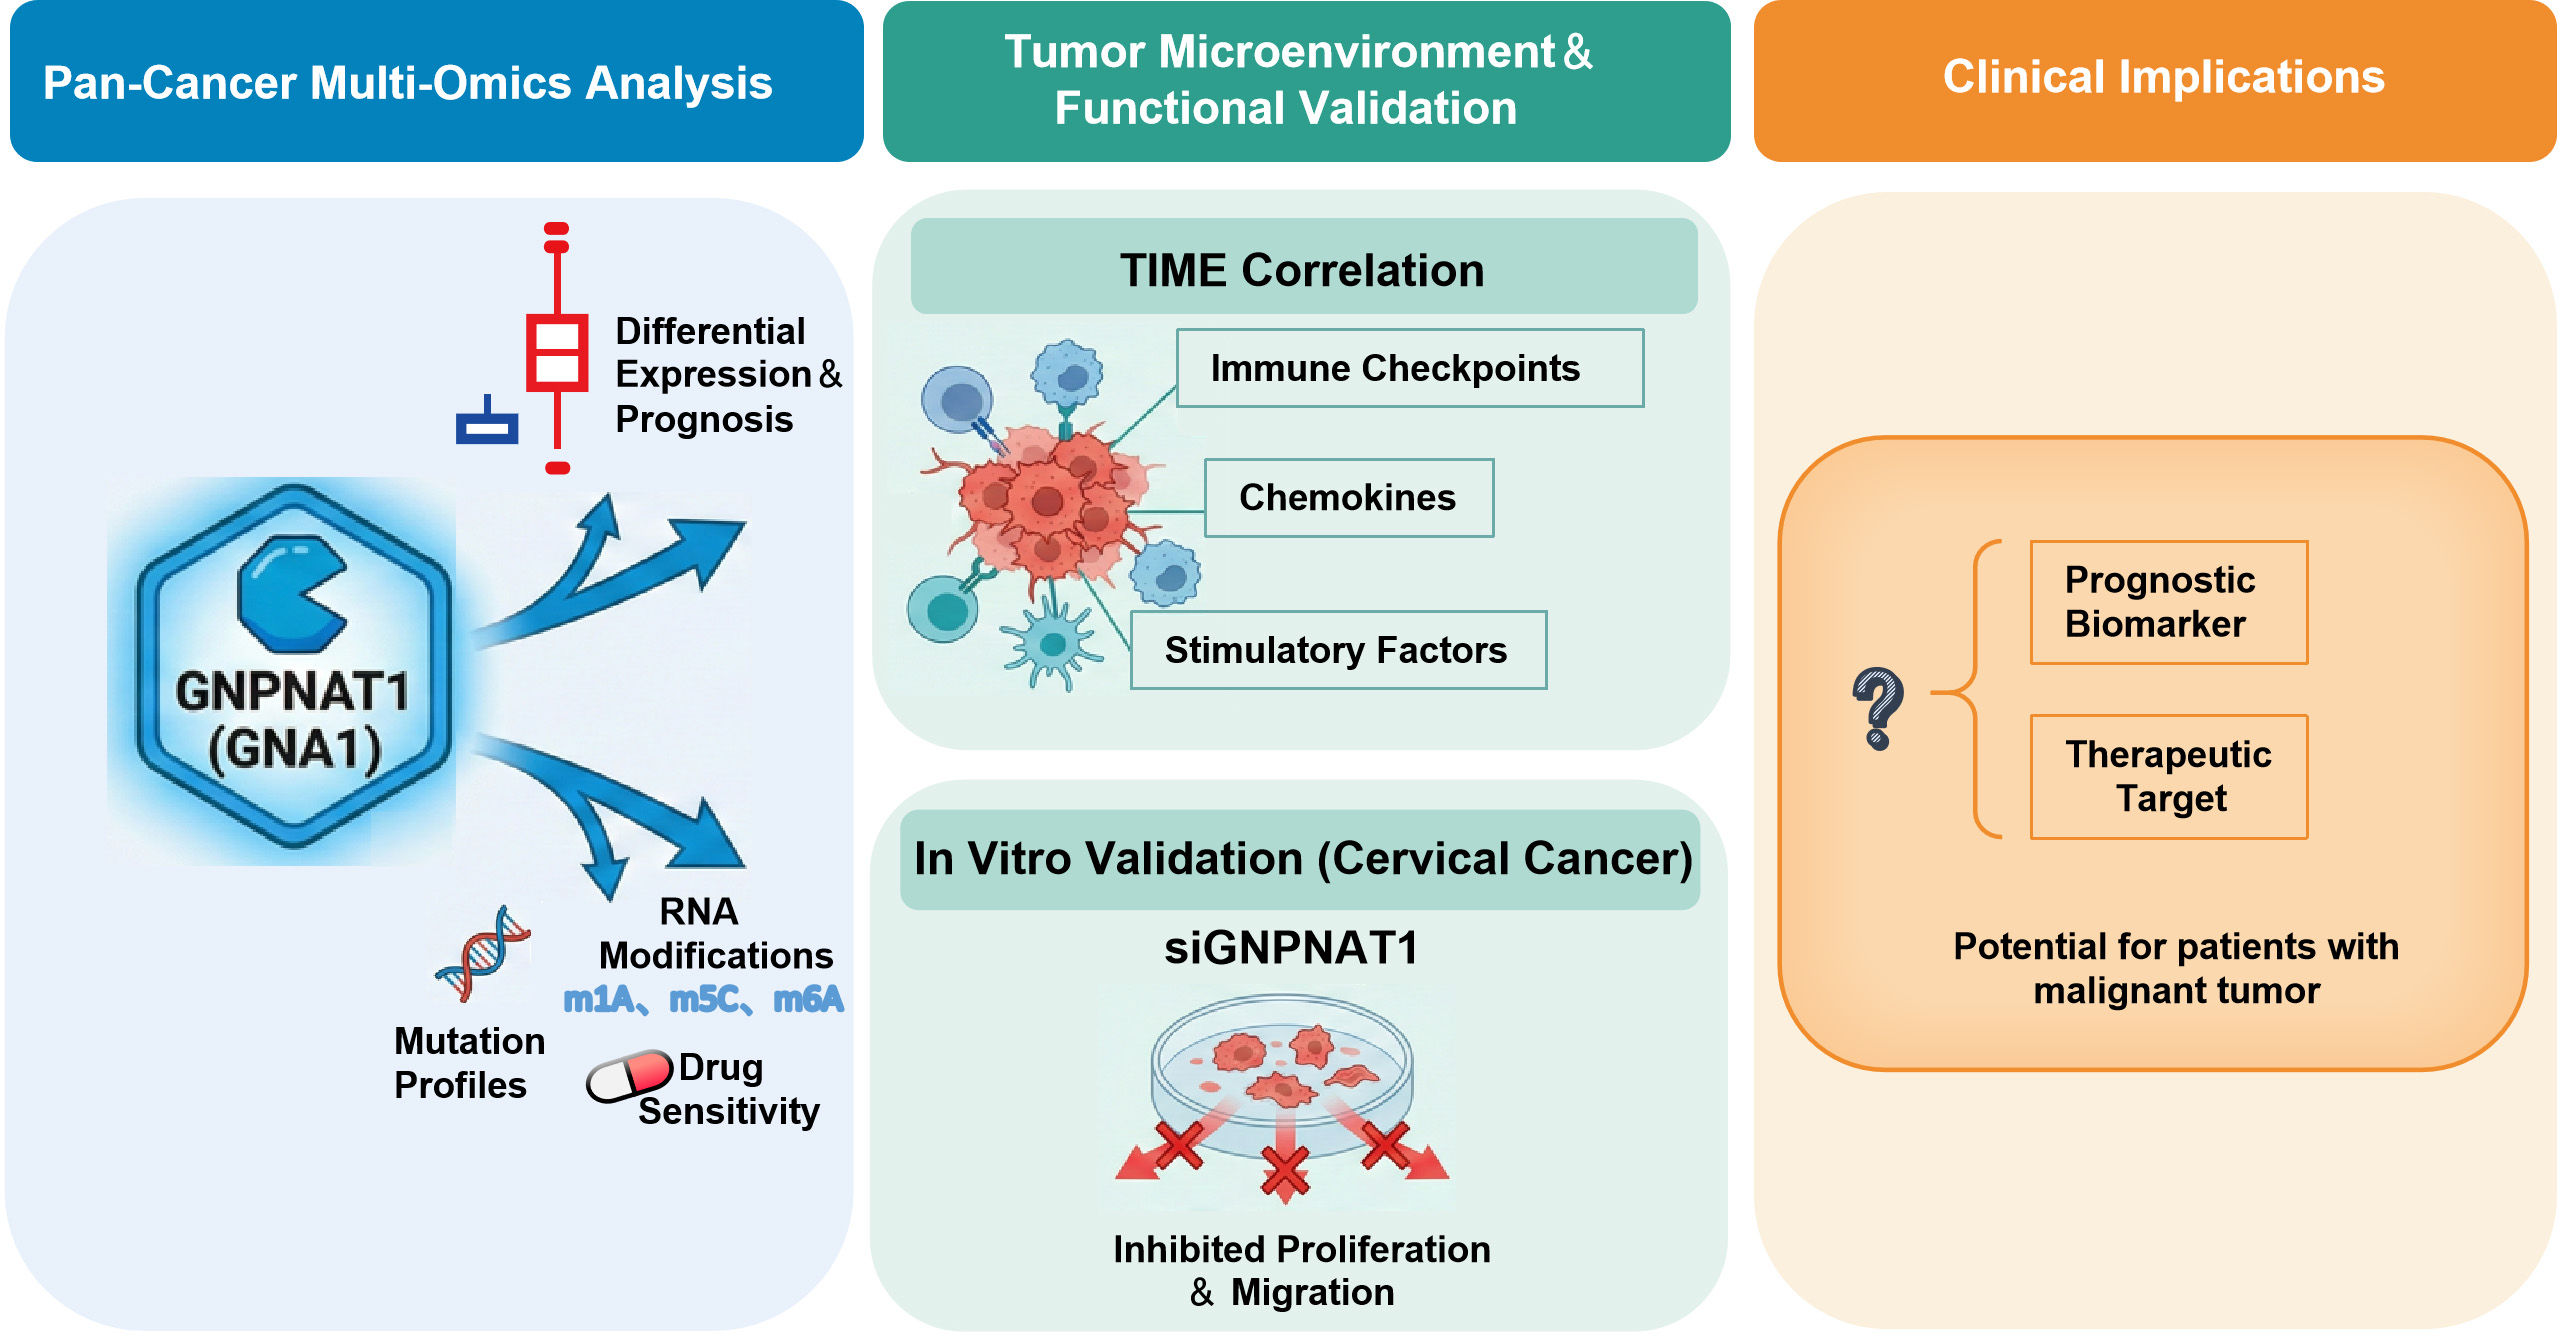
Glucosamine 6-phosphate N-acetyltransferase 1 (GNPNAT1) serves as a critical rate-limiting enzyme within the hexosamine biosynthetic pathway (HBP). However, its expression patterns, clinical significance in various cancers, and role in modulating the tumor immune microenvironment are not well understood.
This study analyzed the differential expression patterns of GNPNAT1 and its potential association with patient prognosis using pan-cancer datasets. Using a multi-omics approach and multiple databases, we examined the correlations between GNPNAT1 expression and tumor stemness, mutational profiles, RNA modifications, the tumor immune microenvironment, and drug sensitivity. Additionally, we conducted enrichment analyses and in vitro functional experiments for cervical cancer (CC) to preliminarily elucidate the signaling pathways and biological processes that GNPNAT1 may regulate.
GNPNAT1 exhibits aberrant expression in various tumor types, and its expression levels hold substantial prognostic implications for some cancer patients. In certain tumors, GNPNAT1 expression is associated with tumor mutational profiles, RNA modifications, and drug sensitivity. Furthermore, the study found that GNPNAT1 expression levels correlate with key molecules, including immune checkpoint genes, chemokines, and immunostimulatory factors. Enrichment analyses in CC suggests that GNPNAT1 may be involved in cell adhesion and immune-related pathways. Knockdown of GNPNAT1 was shown by in vitro functional assays, significantly attenuated CC cell proliferation and migration.
GNPNAT1 may serve as a promising prognostic biomarker for certain tumors, such as CC. Its association with immune regulation and treatment resistance highlights its potential as a new target for immunotherapy interventions.
Graphical Abstract
Keywords
- GNPNAT1
- biological markers
- immunity
- neoplasms
- prognosis
Malignant tumors are characterized by chronic progression and high mortality rates, posing significant challenges to global public health [1, 2]. Recent data projects that the United States will experience 2,041,910 new cancer diagnoses and 618,120 cancer-related fatalities by the year 2025 [3, 4, 5]. Cancer’s five-year relative survival rate rose from 58% (mid-1970s) to 85% (2014–2020), despite ongoing advances in diagnosis and treatment. Nevertheless, cancer remains one of the most serious health threats in China and worldwide [6]. Targeted therapy has become a highly promising area of cancer treatment research due to its ability to act precisely on tumor-specific molecular markers [7]. Compared with traditional chemotherapy and radiotherapy, targeted therapy significantly enhances treatment selectivity and efficacy by acting specifically on key regulatory molecules in tumor cells while reducing systemic toxicity [8, 9]. However, current clinical practice is still limited by a lack of reliable biomarkers, severely restricting the early diagnosis and precise treatment of tumors. Therefore, systematically exploring potential tumor biomarkers and therapeutic targets using bioinformatics is of great clinical significance.
In recent years, metabolic reprogramming has emerged as a defining
characteristic of tumors and a prominent research topic in oncology [10]. The
hexosamine biosynthetic pathway (HBP), in particular, serves as a pivotal link
between cellular metabolism and various biological processes. Its abnormal
activation is closely associated with tumorigenesis and progression [11].
Glucosamine 6-phosphate N-acetyltransferase 1 (GNPNAT1) functions as a critical
rate-limiting enzyme within the HBP pathway. The uridine diphosphate
N-acetylglucosamine (UDP-GlcNAc) that it catalyzes is a crucial donor for protein
O-linked
Cervical cancer (CC) is one of the most prevalent gynecological malignancies affecting women worldwide [20]. For patients with early-stage CC, therapeutic approaches primarily consist of surgery, radiotherapy, or a combination of both. In contrast, radiotherapy alone or concurrent chemoradiotherapy is the primary treatment for locally advanced disease [21]. Nevertheless, despite the array of available diagnostic and therapeutic modalities, the incidence and mortality of this malignancy continue to climb persistently [22]. It is worth noting that research on GNPNAT1 in the context of CC is currently lacking.
For the first time, we have utilized multi-omics integration techniques to systematically analyze the expression of GNPNAT1 in various cancers and its prognostic value, and explored its relationships with tumor stemness, mutational burden, RNA modifications, immune microenvironment characteristics, and drug sensitivity. In CC, we found that GNPNAT1 is associated with adhesion and immune signaling pathways, and that knocking down GNPNAT1 inhibits cell proliferation and migration. Through the integration of multi-omics data, we aim to confirm GNPNAT1 as a potential cancer biomarker.
Using TIMER (http://cistrome.dfci.harvard.edu/TIMER/) and UCSC Xena (https://xena.ucsc.edu/), we analyzed pan-cancer GNPNAT1 expression with the Wilcoxon test [23, 24], complemented by CPTAC-derived proteomics data (https://pdc.cancer.gov/pdc/browse) [25]. For CC, Gene Expression Omnibus (GEO) datasets GSE63514 (24 normal, 28 tumor) and GSE6791 (eight normal, 20 tumor) were utilized, with the Wilcoxon test applied for statistical comparison.
GNPNAT1’s prognostic relevance in CC was assessed via Gene Expression Profiling
Interactive Analysis (GEPIA, http://gepia2.cancer-pku.cn/) and the Wilcoxon test
[26]. Pan-cancer survival data from UCSC Xena, analyzed with “survminer”
(version 0.4.9) and “survival” (version 3.7-0) packages, determined its
prognostic and diagnostic value. Receiver operating characteristic (ROC) curves
defined diagnostic thresholds: area under the curve (AUC)
The University of Alabama at Birmingham CANcer Data Analysis Portal (UALCAN; https://ualcan.path.uab.edu) was used to analyze the relationship between GNPNAT1 expression and clinicopathological staging. Statistical significance was assessed via the Wilcoxon test. The Wilcoxon test was also applied to investigate the correlation between GNPNAT1 expression and the Ki-67 index [27].
We analyzed the biological functions of tumor cells using CancerSEA (http://biocc.hrbmu.edu.cn/CancerSEA/) [28]. The Sangerbox platform (http://vip.sangerbox.com) was used to analyze the pan-cancer correlations of GNPNAT1 with tumor stemness, RNA modifications, and its mutation landscape [29]. The stemness metrics encompassed: DNA methylation-based stemness score (DNAss), the differentially methylated probe-based stemness score (DMPss), epigenetically regulated gene expression-based stemness score (EREG-EXPss), enhancer element/DNA methylation-based stemness score (ENHss), RNA expression-based stemness score (RNAss), and epigenetically regulated DNA methylation-based stemness score (EREG-METHss) [30]. We presented pan-cancer mutation profiles in this study, with a specific focus on mutation distribution in CC and breast cancer. The chi-square test was used to evaluate differences in gene mutation frequency between each group of samples. Additionally, we analyzed the relationship between RNA methylation modifications (m1A, m5C, and m6A) and GNPNAT1 expression.
We used R software (v4.3.2, Posit PBC, Boston, MA, USA) to investigate the relationships between GNPNAT1 and various immune-related genes, including immune checkpoint, immune stimulatory, major histocompatibility complex (MHC), chemokine, immune inhibitory, and chemokine receptor genes. Tumor, stromal, and immune scores were compared via the “ESTIMATE” package (version 1.0.13). Immune cell infiltration differences were assessed using seven TIMER-based algorithms (XCell, TIMER, EPIC, CIBERSORT-abs, CIBERSORT, QUANTISEQ, and MCPcounter). We used the Tumor Immune Single-cell Hub 2 (TISCH2; http://tisch.comp-genomics.org) to analyze GNPNAT1 expression patterns across different tumor cell subpopulations [31]. We used the TISMO website (http://tismo.cistrome.org/) to compare the predictive capabilities of immunotherapy responses across different tumor models [32]. We used GSCALite to evaluate GNPNAT1 sensitivity across various cancers (Supplementary Figs. 1,2) [33].
CC transcriptomes from The Cancer Genome Atlas (TCGA) were grouped by the
optimal GNPNAT1 cutoff. Differential expression analysis applied the criteria
HeLa and C33A cells were sourced from Shanghai Gaining Biological Technology Co., Ltd., and SiHa cells from Harbin Medical University’s Laboratory of Medical Genetics. All lines were short tandem repeat-validated and mycoplasma-free. Cultures were grown in DMEM (Gibco, 11885084, Waltham, MA, USA) with 10% fetal bovine serum (FBS; Gibco, Waltham, MA, USA) and 1% penicillin–streptomycin (Sevenbio, Beijing, China) at 37 °C, 5% CO2.
The SiHa and C33A cells were transfected with GNPNAT1 small interfering RNA
(siRNA). The siRNA target sequences are listed in Supplementary Table 1.
The primer sequences are provided in Supplementary Table 2. Western
blotting was performed as previously described [34]. The following antibodies
were used: anti-GNPNAT1 (Rabbit, 16282-1-AP, Proteintech, diluted 1:1000) and
anti-
Cell Counting Kit-8 (CCK-8, Sevenbio, SC119, Beijing, China) assessed cell viability by measuring 450 nm absorbance every 24 hours for 4 days post-seeding in 96-well plates. Colony formation was evaluated by seeding cells in 6-well plates, culturing for 10–14 days, staining with 1% crystal violet, and counting visible colonies.
Migration was measured by Transwell assay (8.0-µm pores) with serum-free medium in the upper chamber and 10% FBS in the lower chamber. After 24 hours, non-migrated cells were swabbed off, and migrated cells were stained (1% crystal violet) and imaged. In the scratch assay, confluent monolayers (95%) in 6-well plates were wounded with a 10 µL pipette tip.
Statistical work was performed in GraphPad Prism (v9.5, Inc., San Diego, CA,
USA) and R software, with results expressed as mean
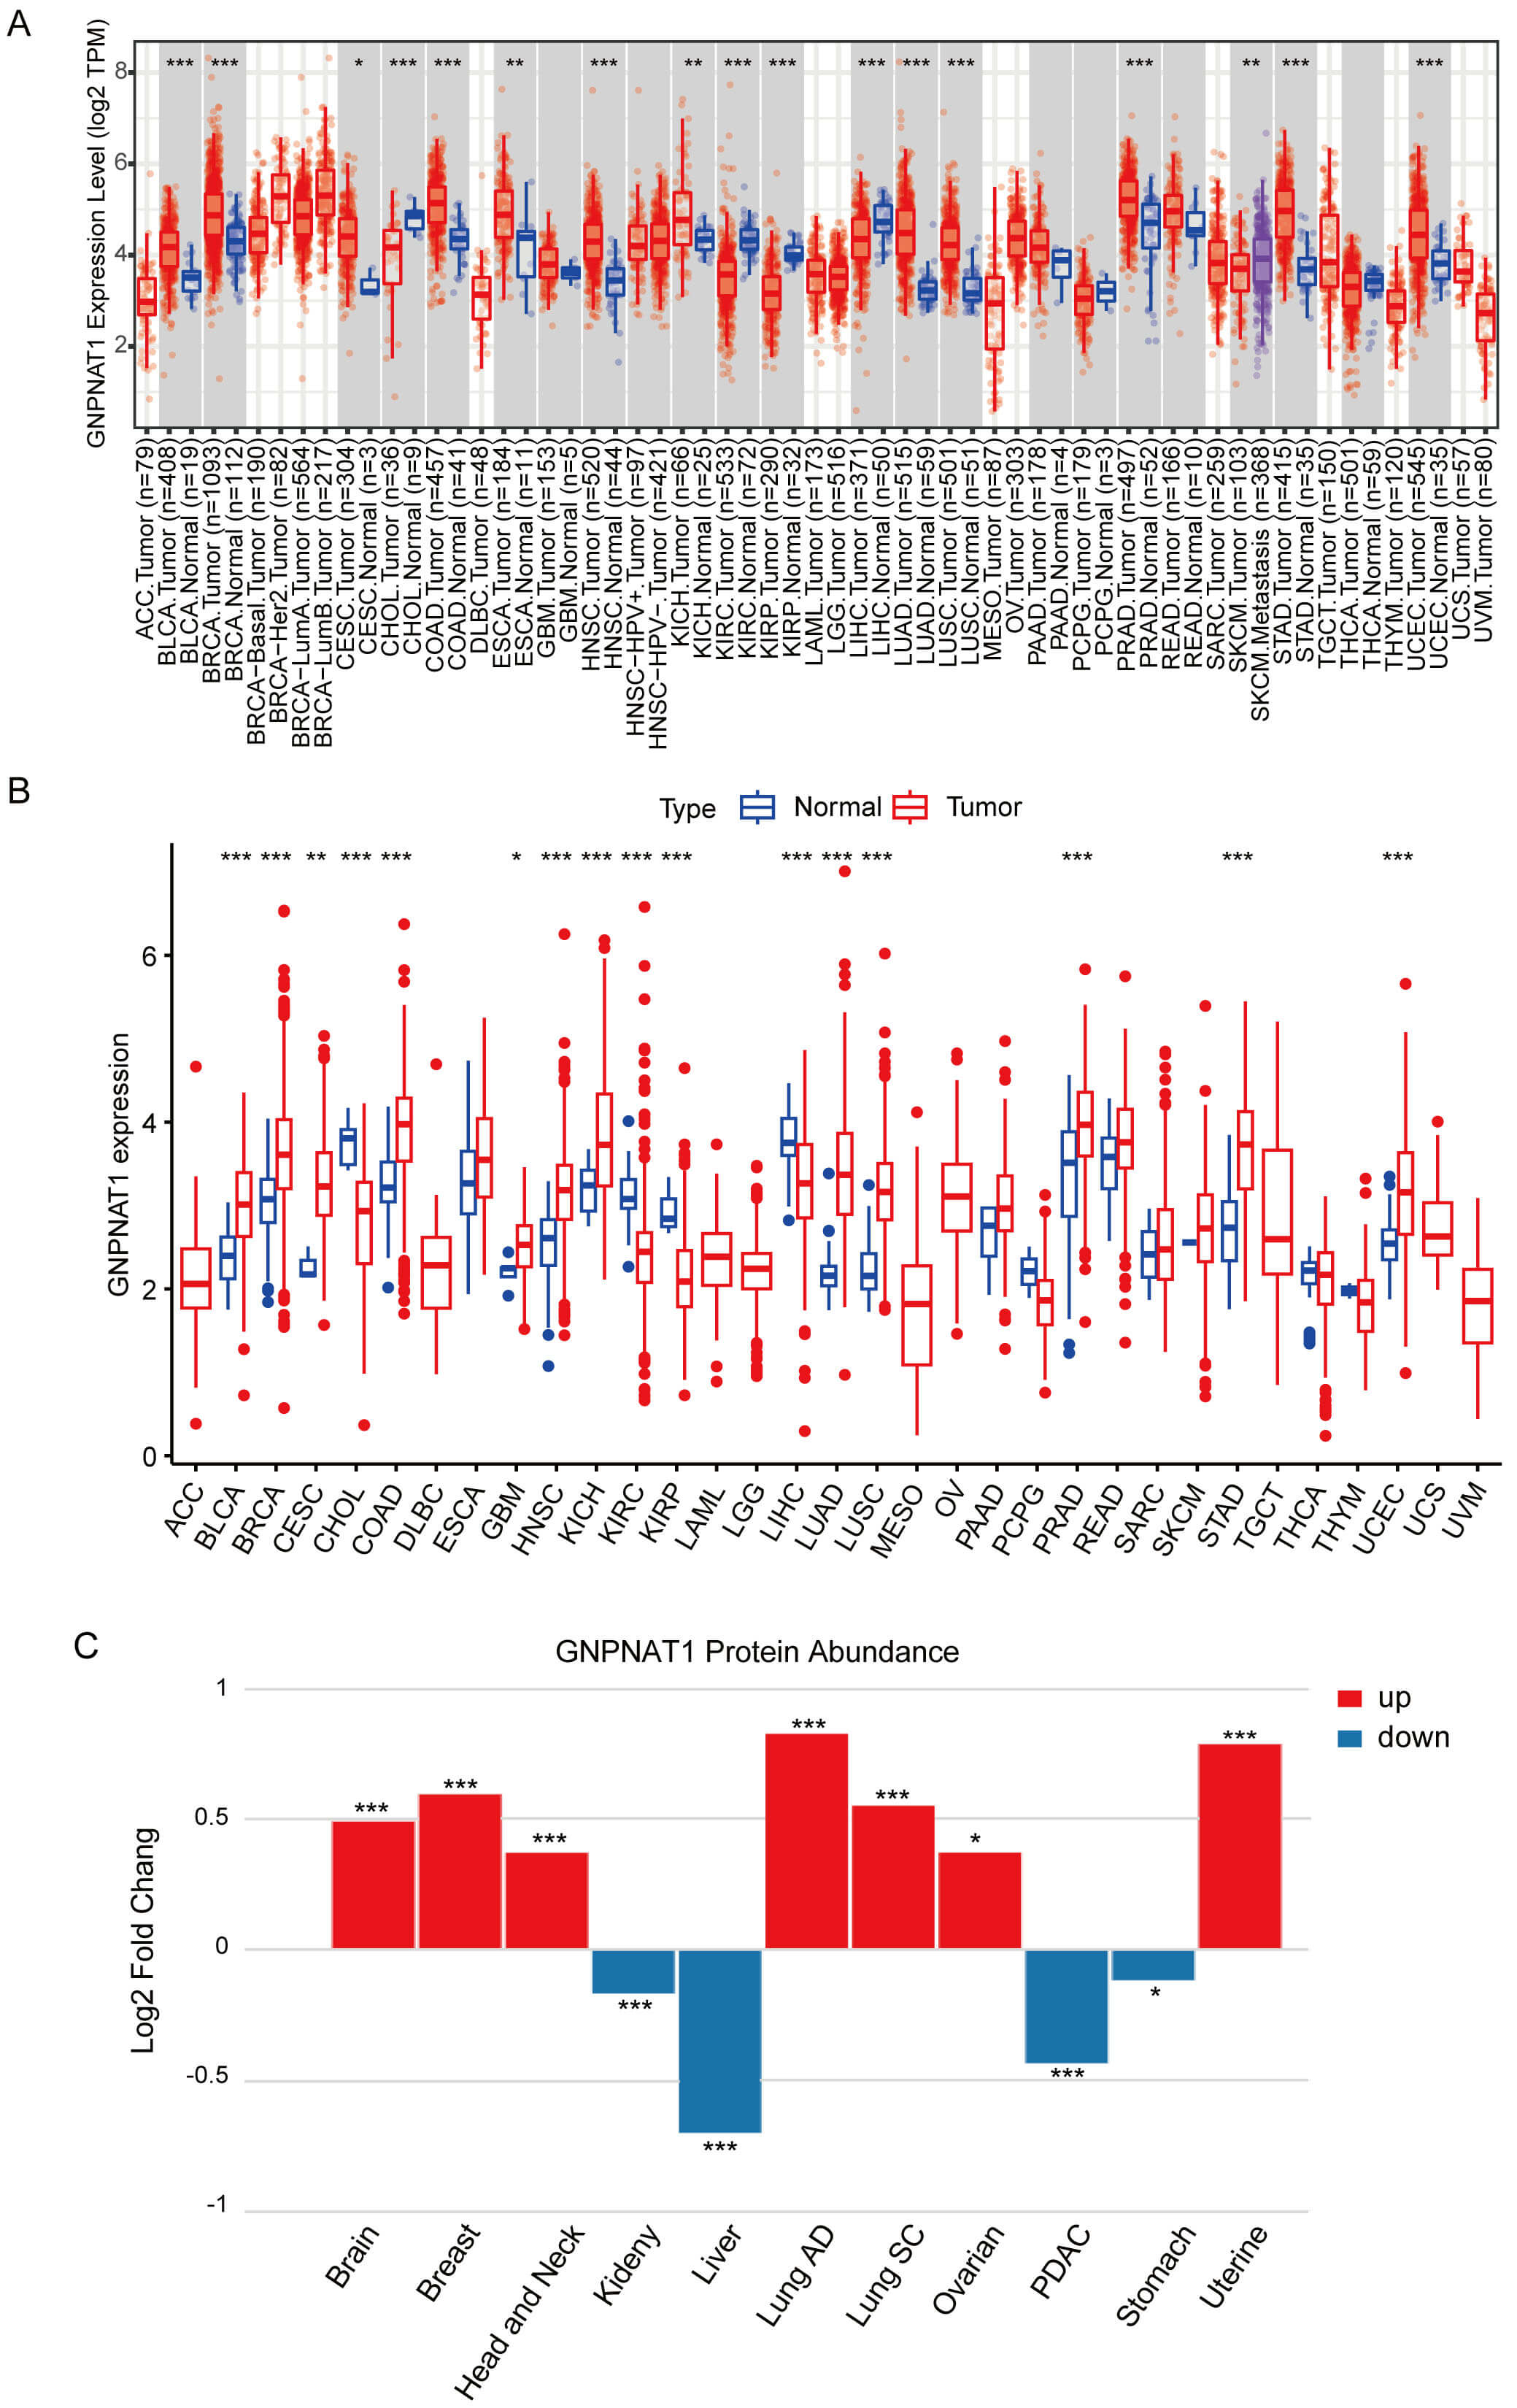
Pan-cancer analysis of TIMER and TCGA data demonstrated markedly higher GNPNAT1 levels in over ten tumor types, including cervical squamous cell carcinoma and endocervical adenocarcinoma (CESC), stomach adenocarcinoma (STAD), and breast invasive carcinoma (BRCA), compared to normal counterparts (Fig. 1A,B). Similarly, paired samples from the TCGA database showed significantly higher GNPNAT1 expression in multiple cancer types (Supplementary Fig. 3). We analyzed pan-cancer data from the CPTAC database to study variations in GNPNAT1 protein expression across different cancer types. Our results revealed that GNPNAT1 was significantly overexpressed in several types of malignant tumors, including uterine, breast, and lung cancers (Fig. 1C).
 Fig. 1.
Glucosamine 6-phosphate N-acetyltransferase 1 (GNPNAT1)
expression in pan-cancer across different databases. (A) GNPNAT1 expression in
pan-cancer from the TIMER database. (B) GNPNAT1 expression in pan-cancer from The
Cancer Genome Atlas (TCGA) database. (C) Changes in GNPNAT1 protein expression
levels in various cancers. (* p
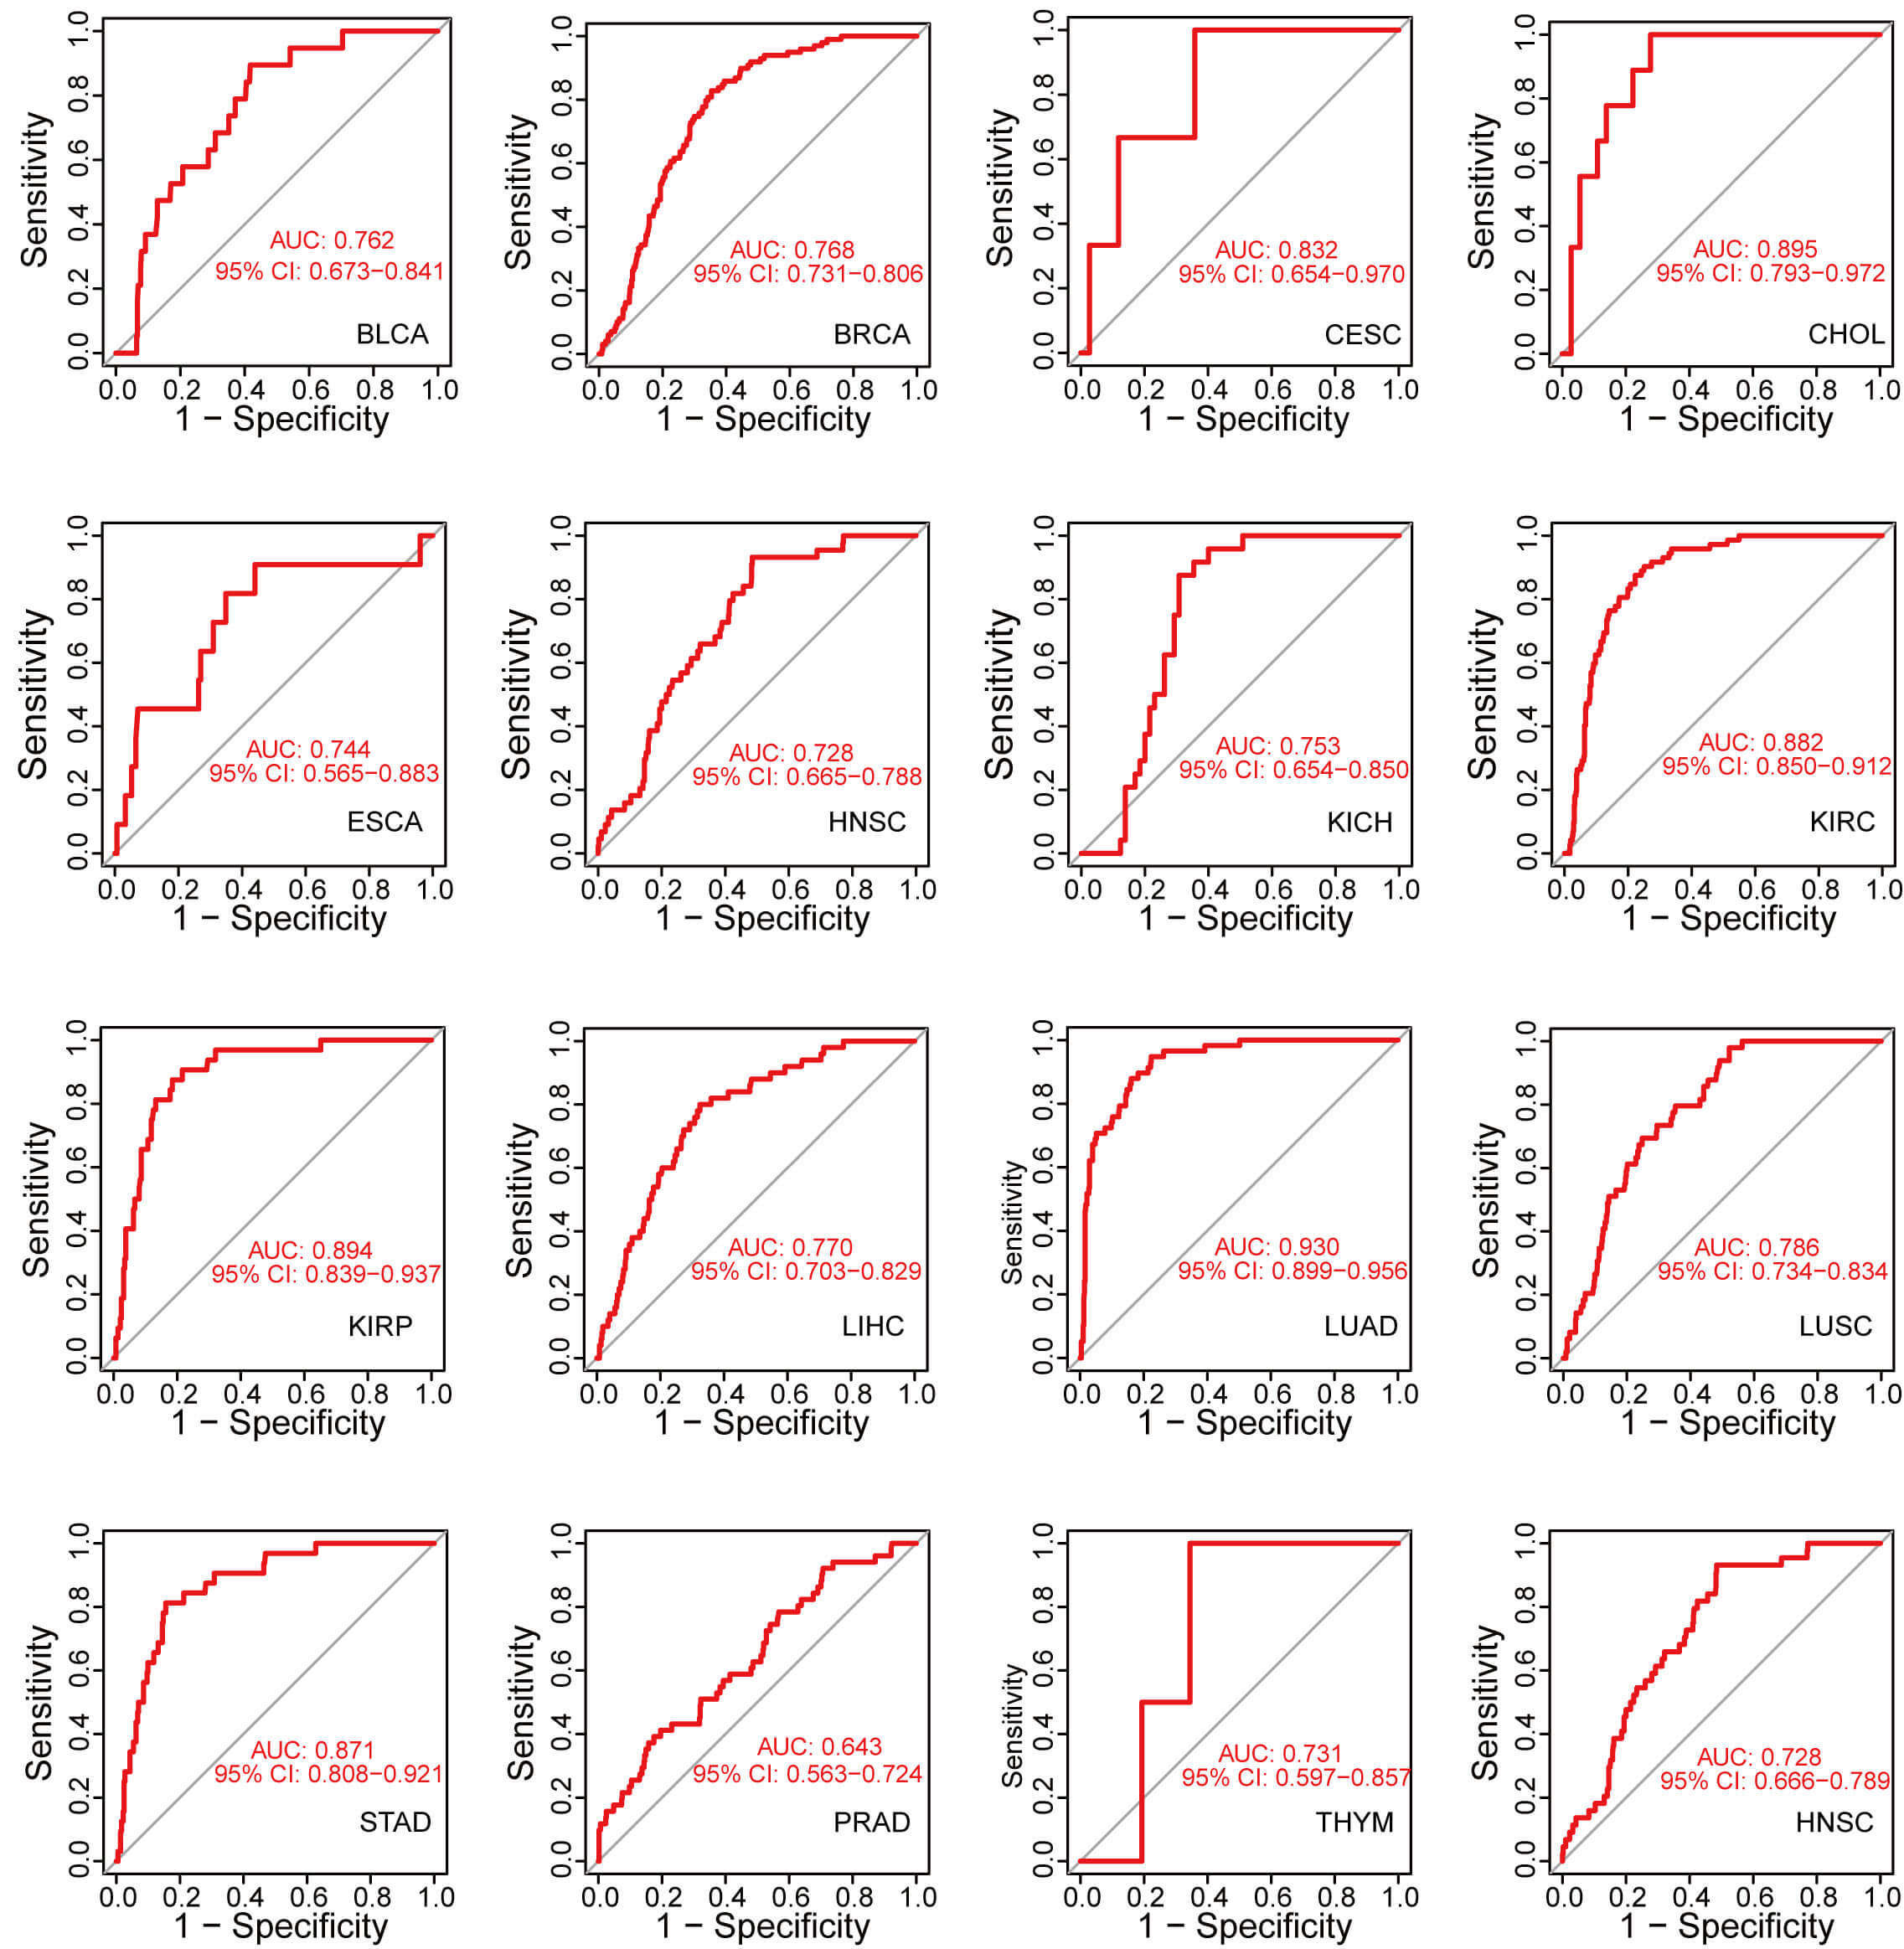
We conducted ROC curve analysis by calculating the AUC to assess the diagnostic value of GNPNAT1 expression in pan-cancer. GNPNAT1 expression exhibited exceptional diagnostic efficacy in CESC (AUC = 0.832), kidney renal papillary cell carcinoma (KIRC; AUC = 0.882), and LUAD (AUC = 0.930) (Fig. 2).
 Fig. 2.
Accuracy of GNPNAT1 in differentiating tumor from normal tissues in pan-cancer.
We further evaluated the prognostic value of GNPNAT1 expression in human cancers. First, we analyzed the relationship between GNPNAT1 expression levels and the clinical and pathological characteristics of patients. Our results revealed that high GNPNAT1 expression was significantly positively correlated with advanced clinical stages in multiple tumors, including bladder urothelial carcinoma (BLCA), BRCA, and CESC (Fig. 3A). In addition, high GNPNAT1 expression was closely associated with elevated levels of the tumor proliferation marker Ki-67 (Fig. 3B). This suggests that GNPNAT1 may promote tumor progression. Univariate Cox analysis determined GNPNAT1’s prognostic value across cancers (Fig. 4A–D). Kaplan-Meier analyses linked GNPNAT1 expression to overall survival (OS), disease-free interval (DFI), disease-specific survival (DSS), and progression-free interval (PFI) (Supplementary Figs. 4–7). High GNPNAT1 was identified as an OS risk factor in adrenocortical carcinoma (ACC), CESC, and LUAD, and notably served as a dual risk factor for OS and PFI in CESC.
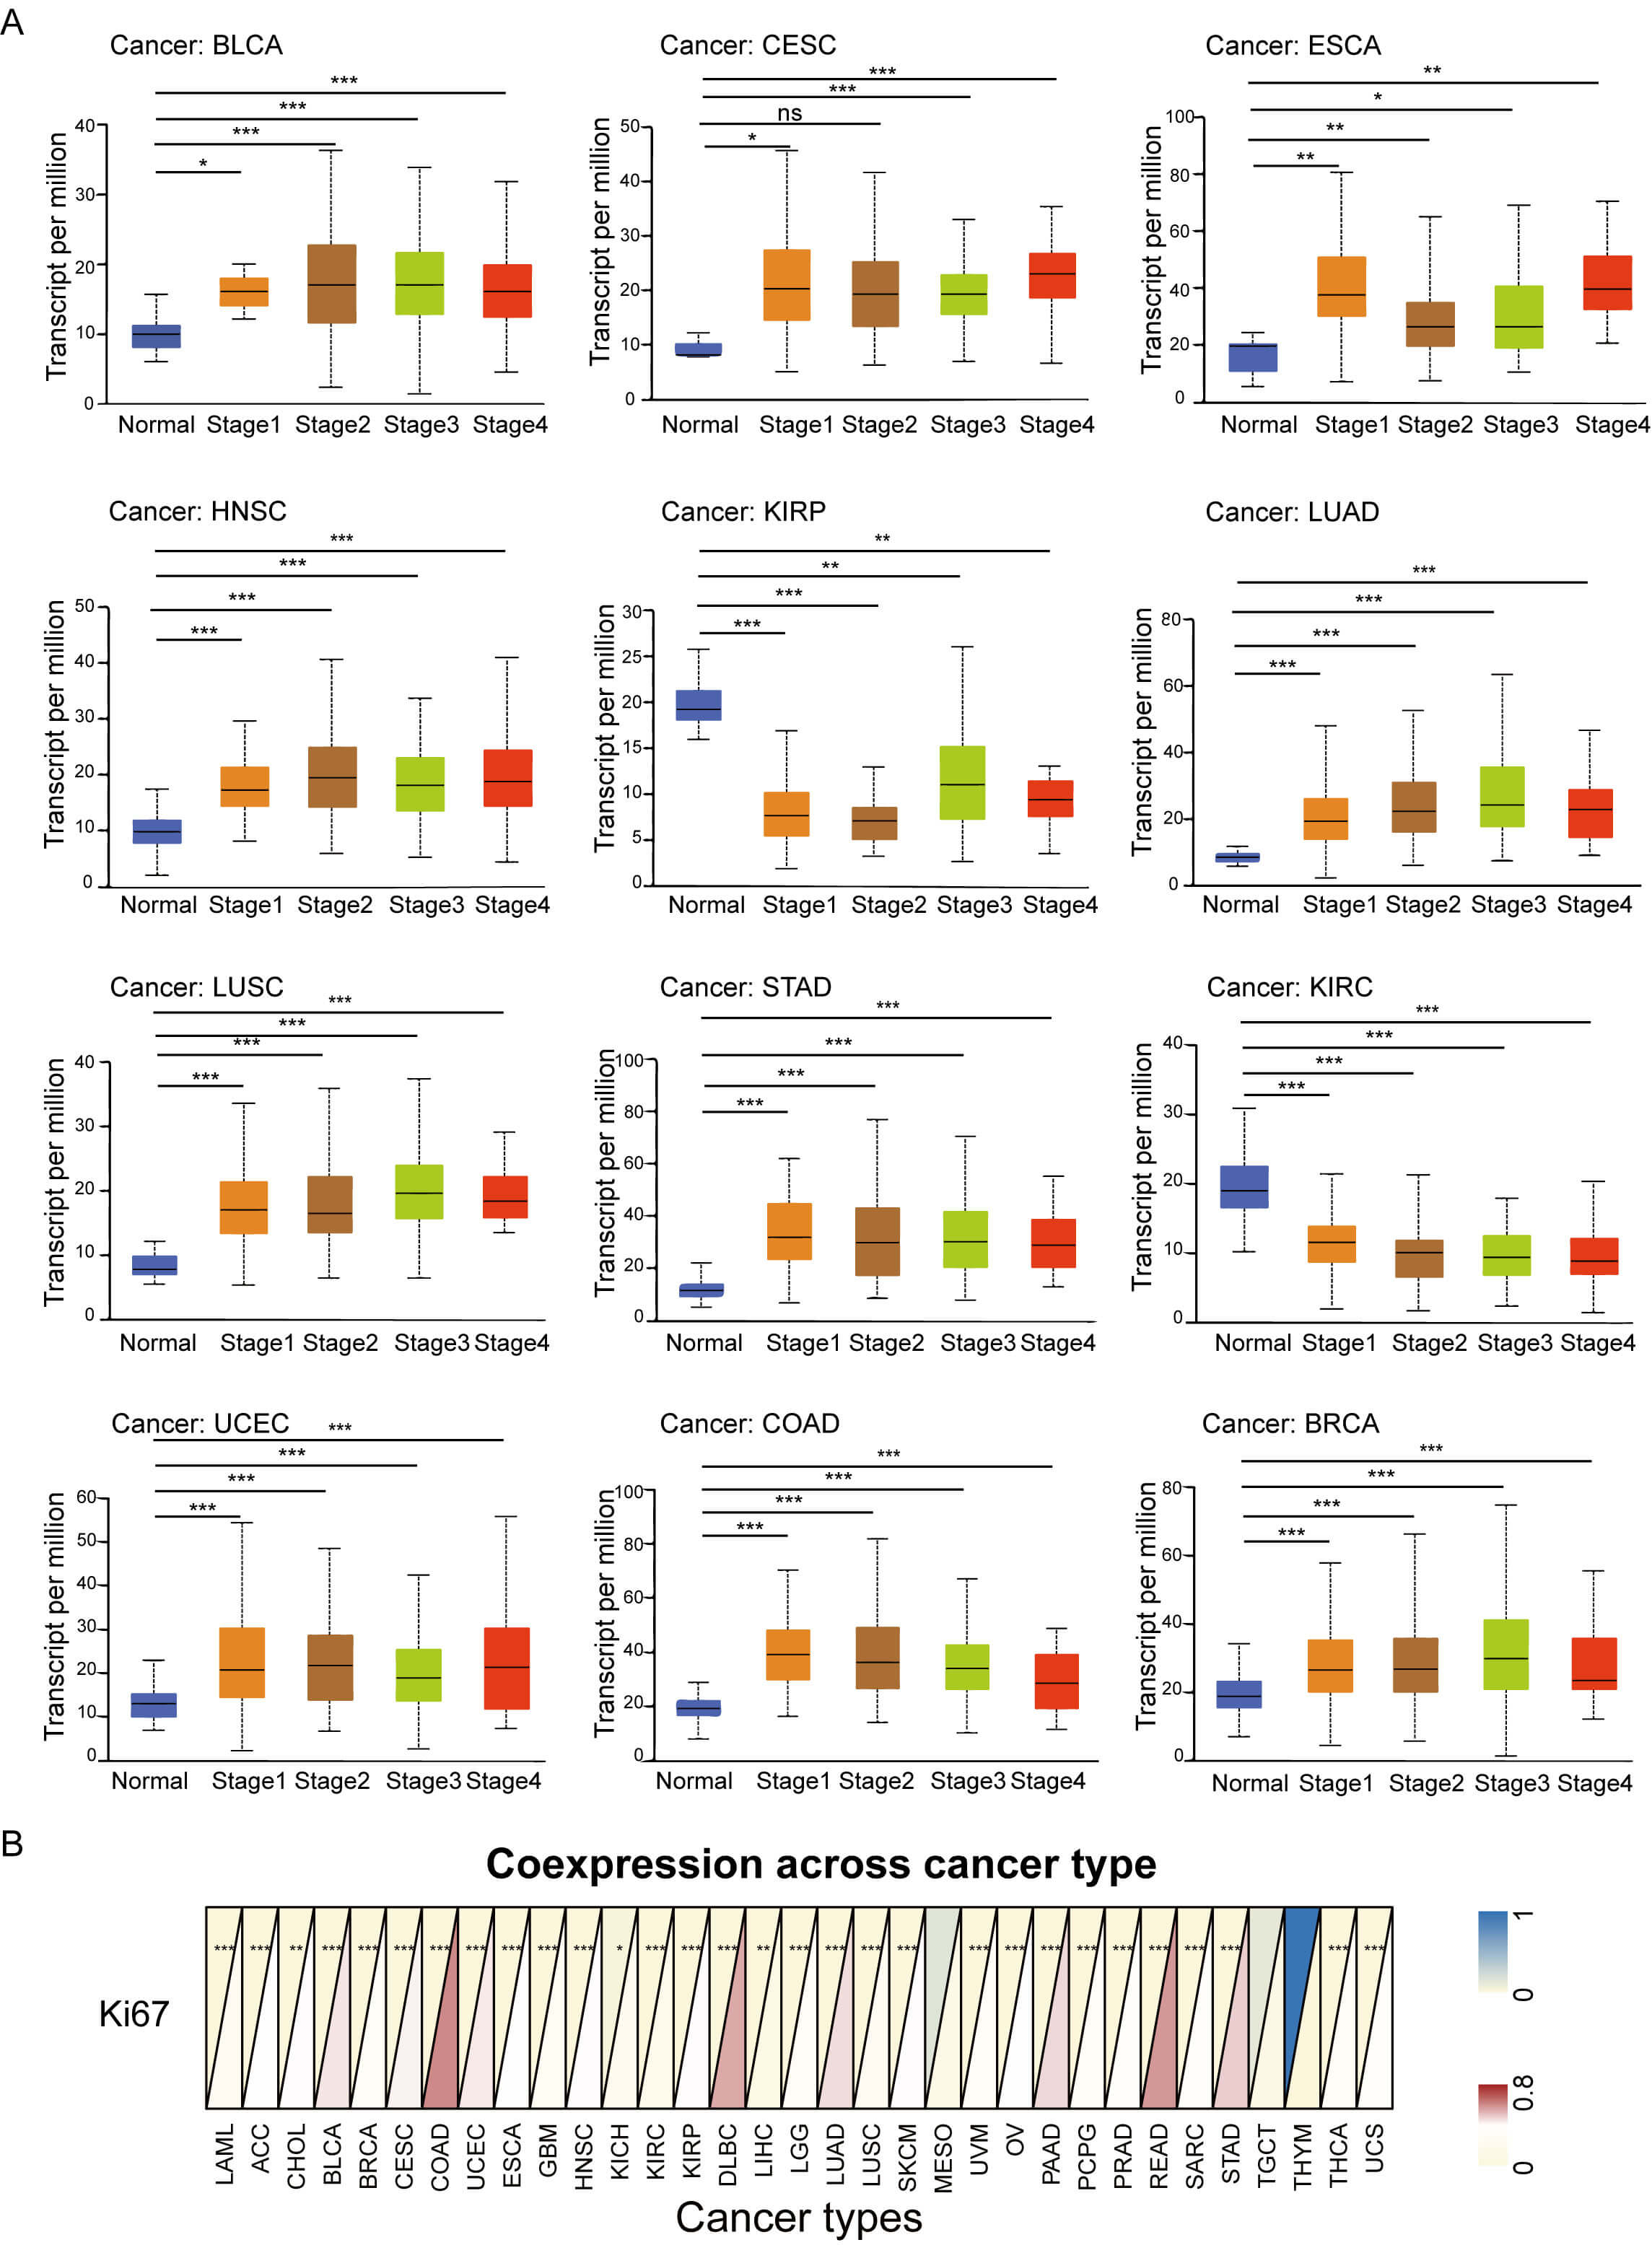 Fig. 3.
Association of tumoral GNPNAT1 expression with clinical
features. (A) Correlation with pathological stage across cancer types. (B)
Pan-cancer relationship with the Ki-67 proliferation index. (* p
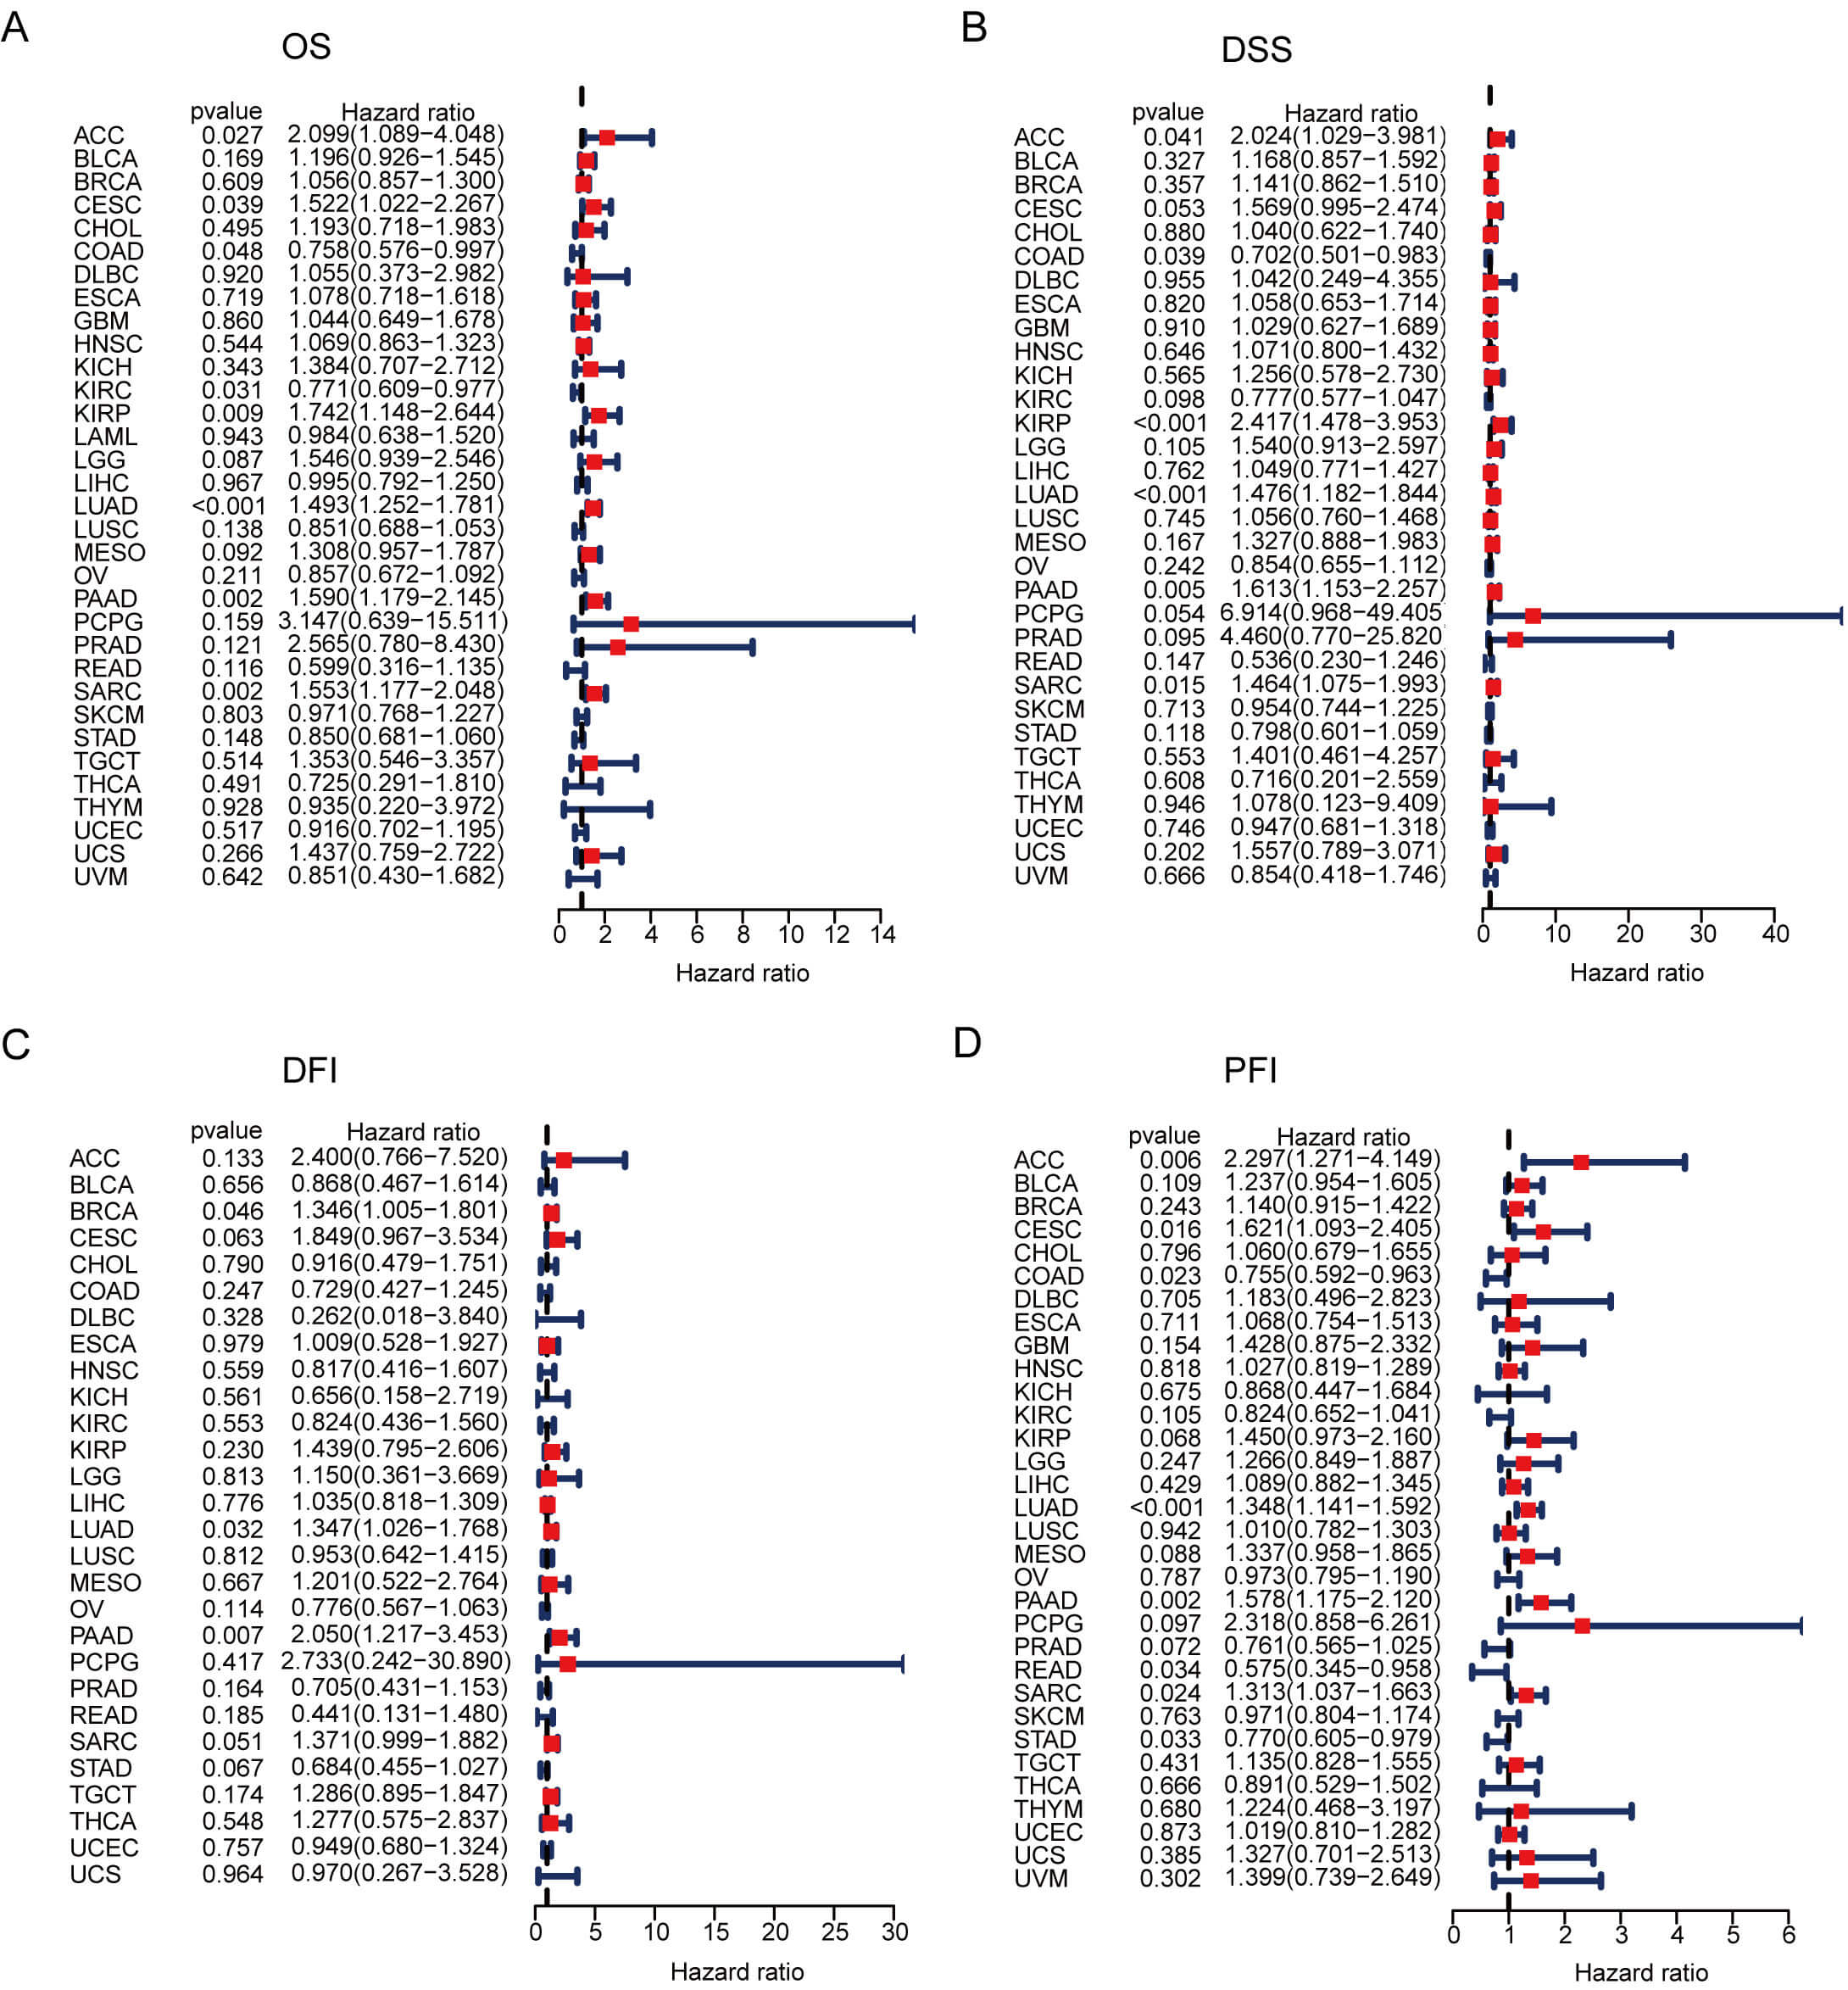 Fig. 4.
GNPNAT1 prognostic potential in pan-cancer. (A–D) Forest plots of univariate Cox regression analyses for overall survival (OS) (A), disease-specific survival (DSS) (B), disease-free interval (DFI) (C), and progression-free interval (PFI) (D).
Further investigation revealed that GNPNAT1 expression exhibits a significant positive correlation with tumor stemness in the majority of malignancies (Fig. 5A–F). This suggests that high GNPNAT1 expression may contribute to maintaining tumor stemness. Additionally, single-cell functional state analysis revealed heterogeneous functional associations of GNPNAT1 across various cancer types. In acute myeloid leukemia, GNPNAT1 expression was positively correlated with cellular hypoxia, apoptosis, proliferation, and invasion, but negatively correlated with DNA repair. In BRCA, GNPNAT1 expression correlated positively with cell cycle, DNA damage, apoptosis, and invasion. Similarly, positive associations were observed in LUAD for invasion and hypoxia, and in gliomas for DNA repair, cell cycle, inflammation, and proliferation. Conversely, melanoma displayed an inverse pattern, with GNPNAT1 exhibiting negative correlations with DNA repair, apoptosis, and invasion (Fig. 5G).
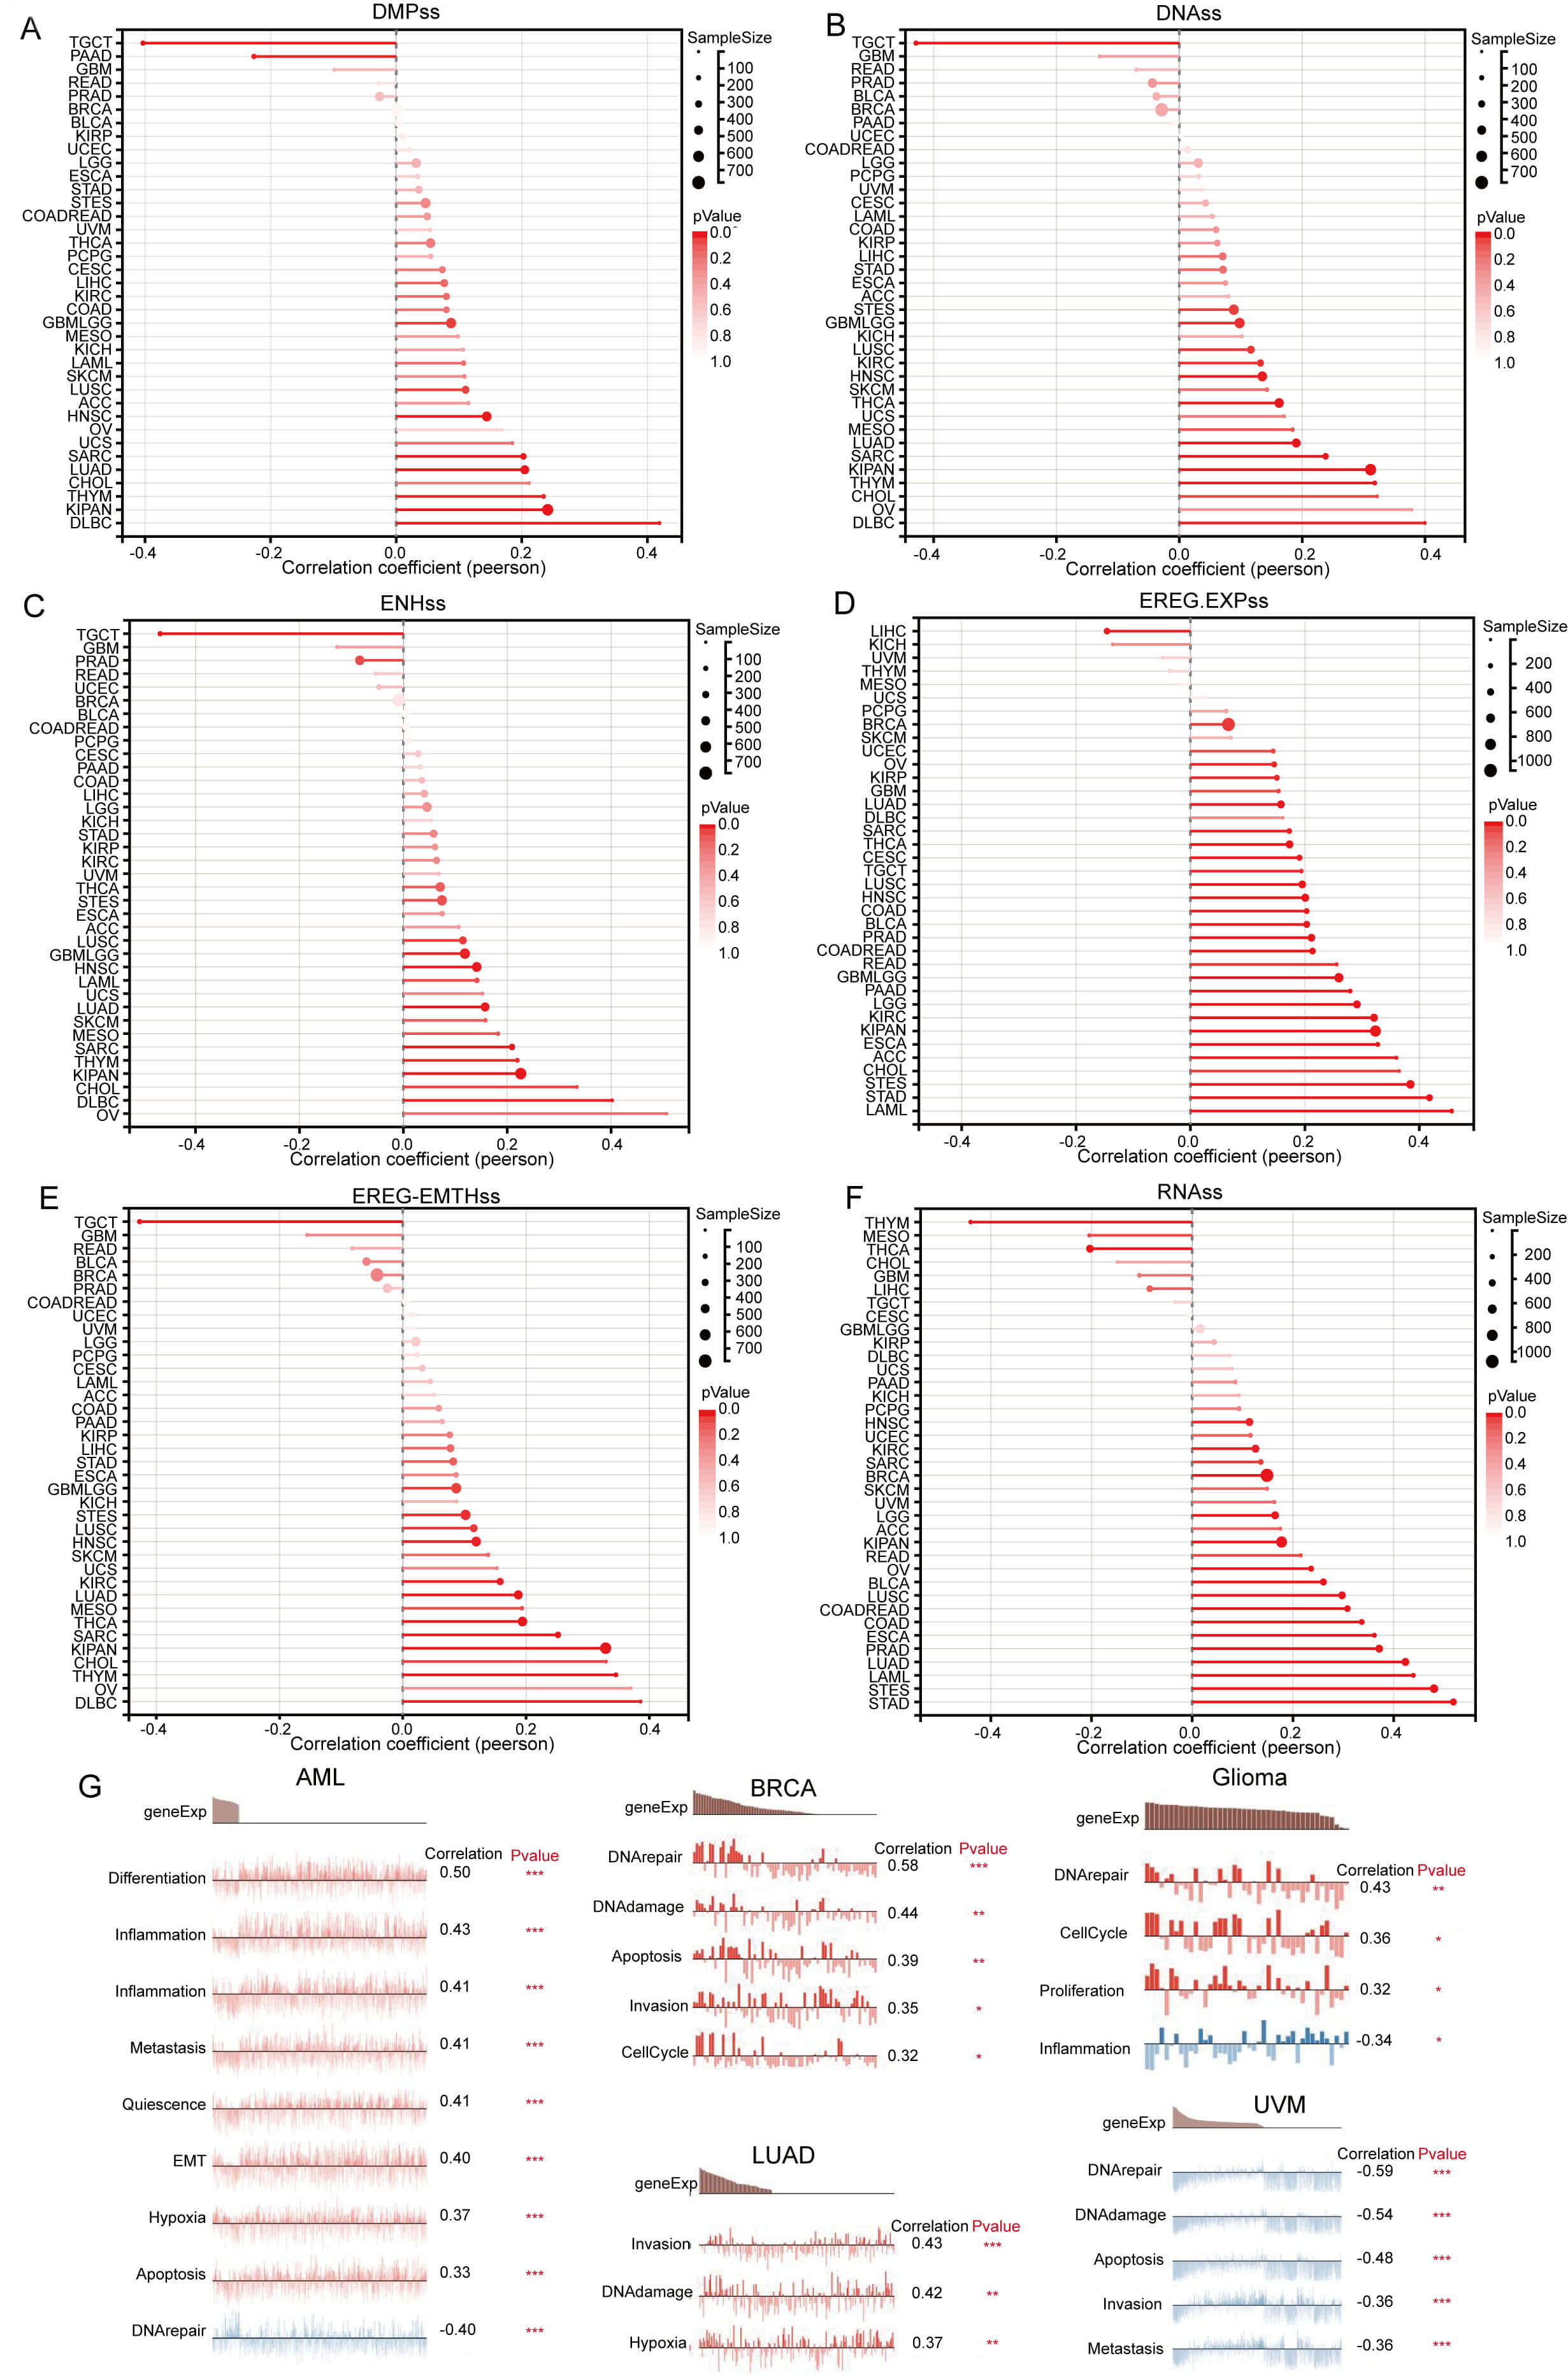 Fig. 5.
Pan-cancer Spearman correlation analysis of GNPNAT1 expression
with stemness indices and cellular functional states. (A–F) Correlations with
stemness scores: differentially methylated probe-based stemness score (DMPss)
(A), DNA methylation-based stemness score (DNAss) (B), enhancer element/DNA
methylation-based stemness score (ENHss) (C), epigenetically regulated gene
expression-based stemness score (EREG-EXPss) (D), epigenetically regulated DNA
methylation-based stemness score (EREG-METHss) (E), and RNA expression-based
stemness score (RNAss) (F). (G) Correlation analysis between functional states
and GNPNAT1 expression in AML, breast invasive carcinoma (BRCA), LUAD, Glioma,
and UVM. (* p
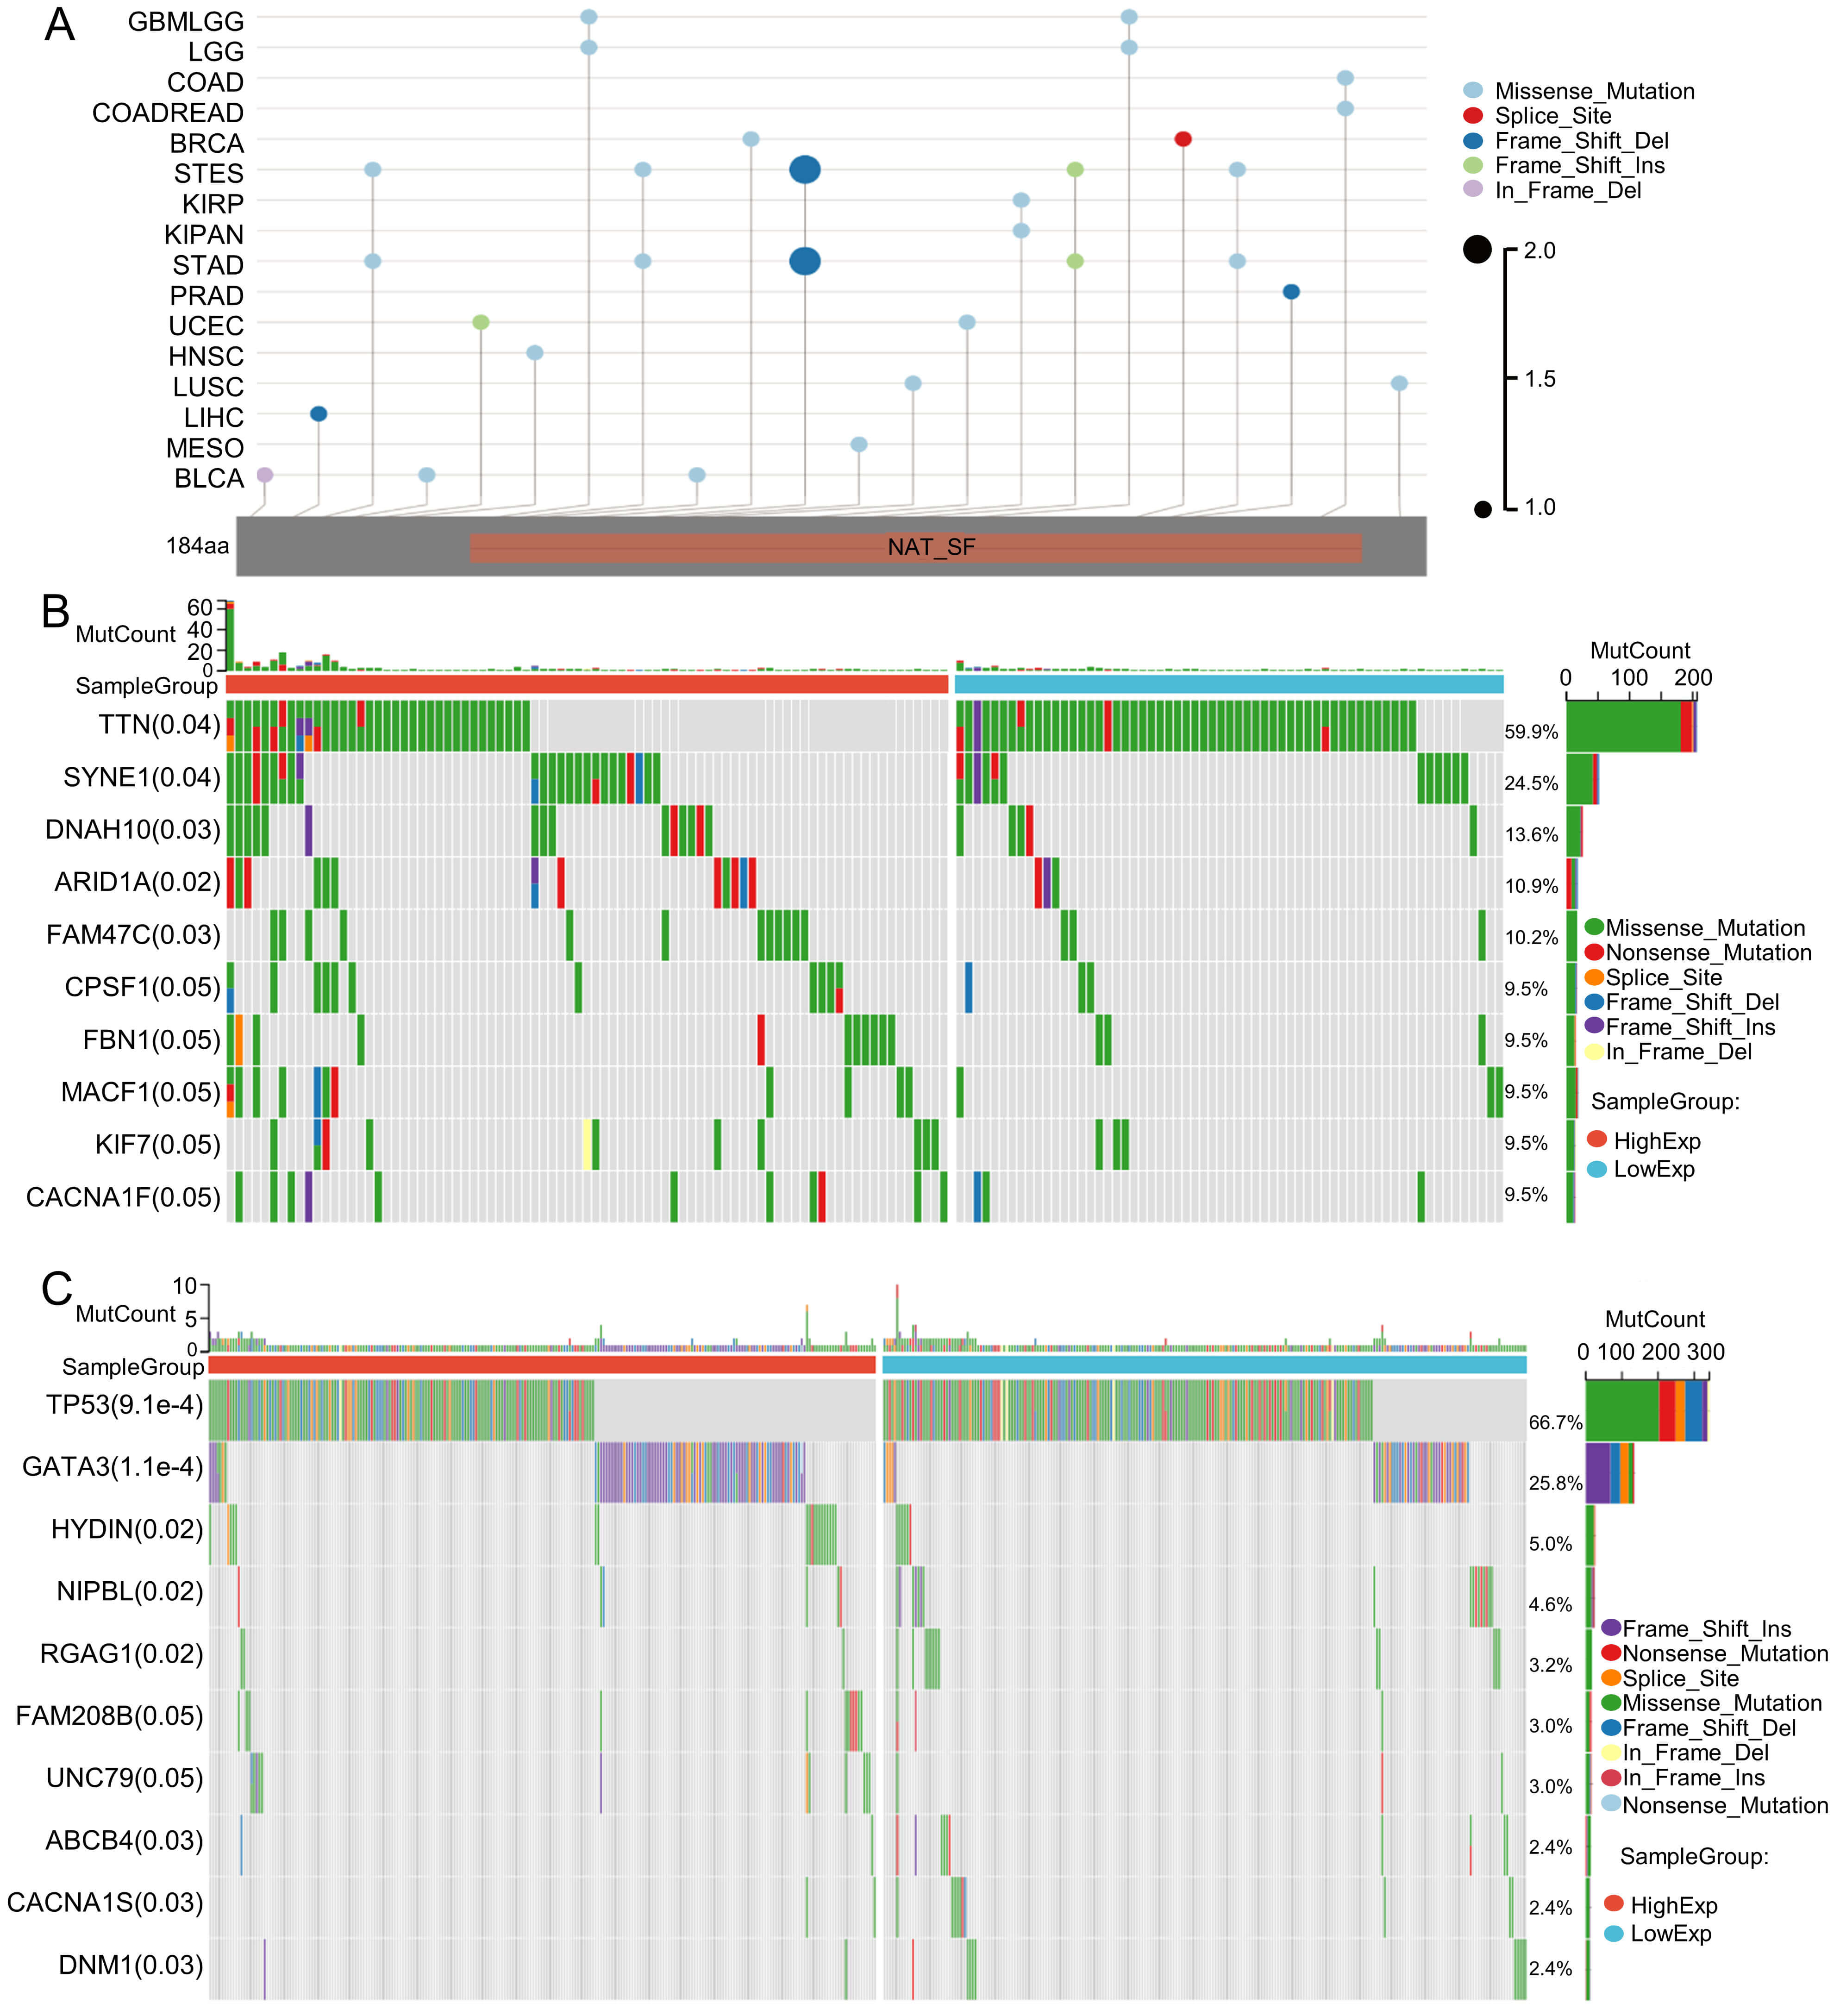
Tumor mutation is a key driver of malignant transformation, promoting cell proliferation and immune evasion and thereby propelling cancer progression. In this study, we examined GNPNAT1 mutation patterns in different tumors. Mutational landscape comparison between high- and low-GNPNAT1 groups uncovered significantly mutated genes in each subgroup. For example, we discovered mutations in genes such as TTN, SYNE1, and DNAH10 in CESC, and we observed high-frequency mutations in TP53 and GATA3 in breast cancer (Fig. 6A–C). Further correlation analysis demonstrated that GNPNAT1 expression was positively associated with m1A, m5C, and m6A methylation levels (Fig. 7). This suggests that GNPNAT1 may influence tumorigenesis and development by regulating epigenetic transcription processes.
 Fig. 6.
Mutation characterization of GNPNAT1. (A) Mutation map across cancer types. (B,C) The top ten most frequently mutated genes in CESC and BRCA patients.
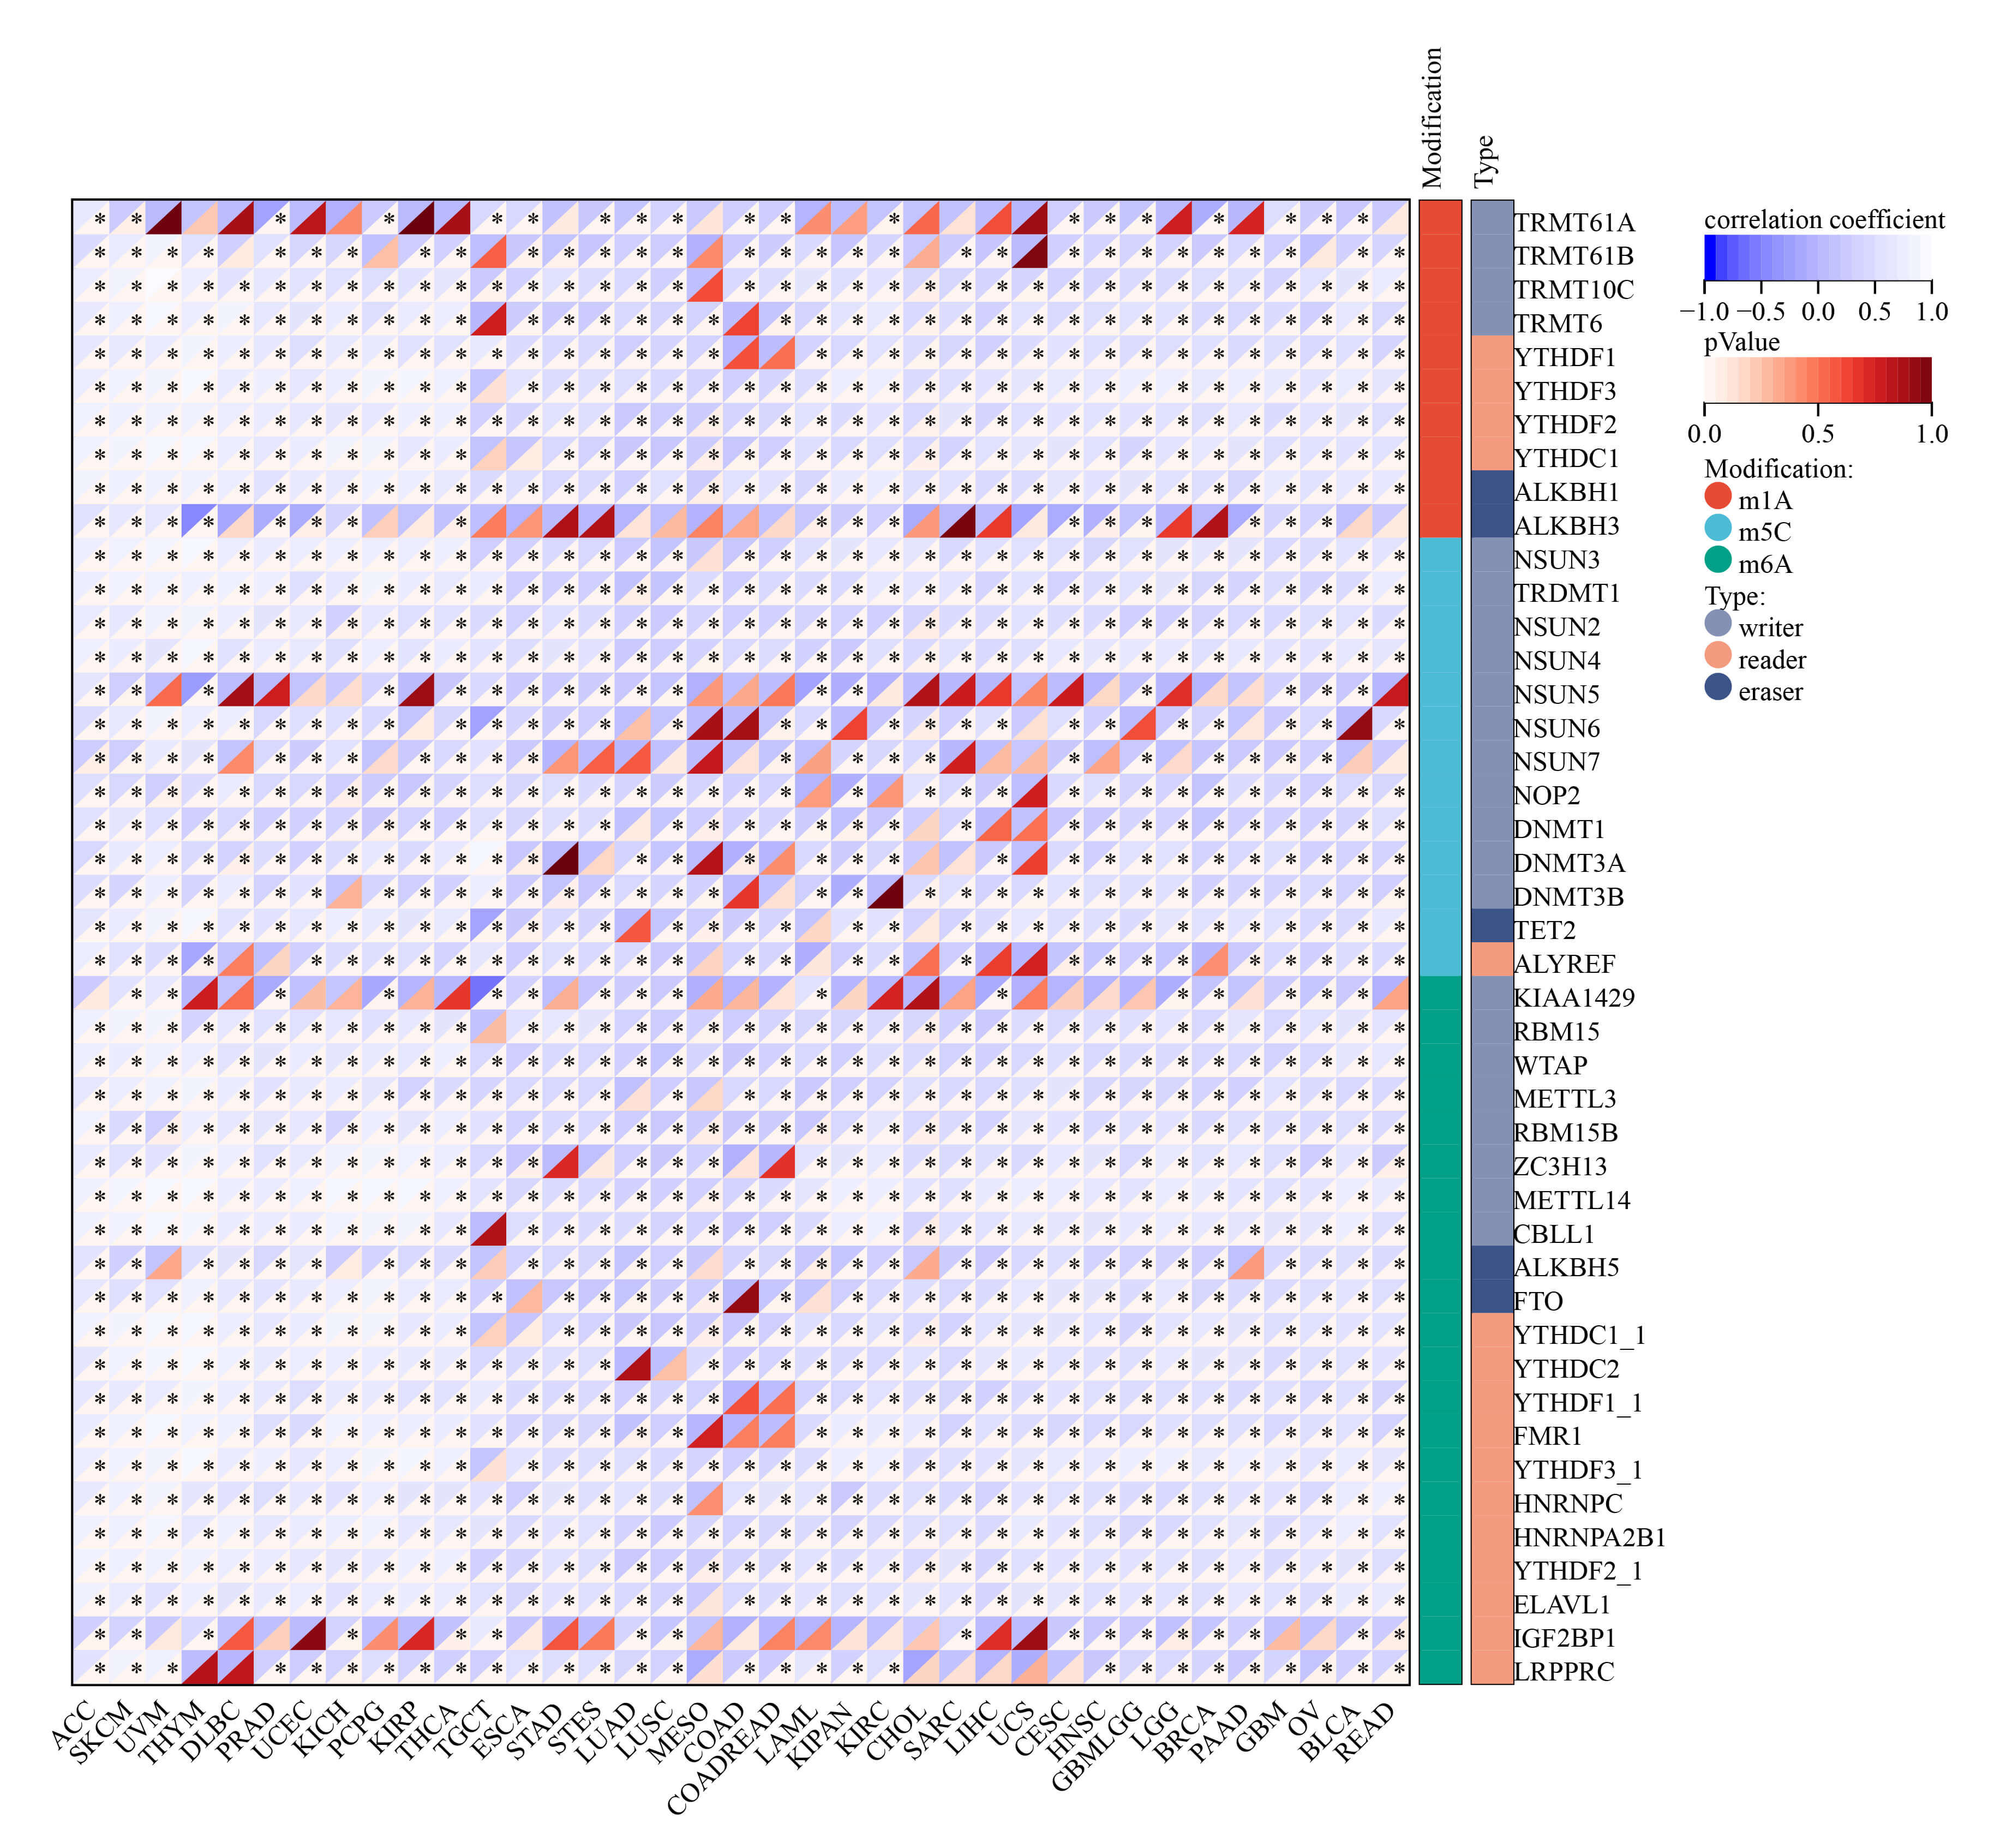 Fig. 7.
Relationship of GNPNAT1 expression with RNA modifications.
(* p
Further investigation demonstrated that GNPNAT1 expression was positively linked to immune checkpoints (PD-L1, CTLA-4, LAG-3) in cancers such as colorectal adenocarcinoma (COAD) and uterine corpus endometrial carcinoma (UCEC) (Fig. 8A). Conversely, in tumors such as serous ovarian cancer (OV) and rectal adenocarcinoma (READ), GNPNAT1 expression was positively correlated with MHC genes, including HLA-A, HLA-DR, and HLA-DM (Fig. 8B). In STAD and thymoma (THYM), GNPNAT1 expression was positively correlated with T-cell chemokines, including CXCL10 and CCL5. These findings imply that GNPNAT1 may promote immune cell recruitment into the tumor microenvironment. Conversely, GNPNAT1 showed a negative correlation with immunosuppressive chemokines, such as CCL17 (Fig. 8C,D). Additionally, in LUAD and OV tumors, GNPNAT1 was positively correlated with immunostimulatory (CD276 and HHLA2) and immunosuppressive (TGFBR1 and KDR) (Fig. 8E,F).
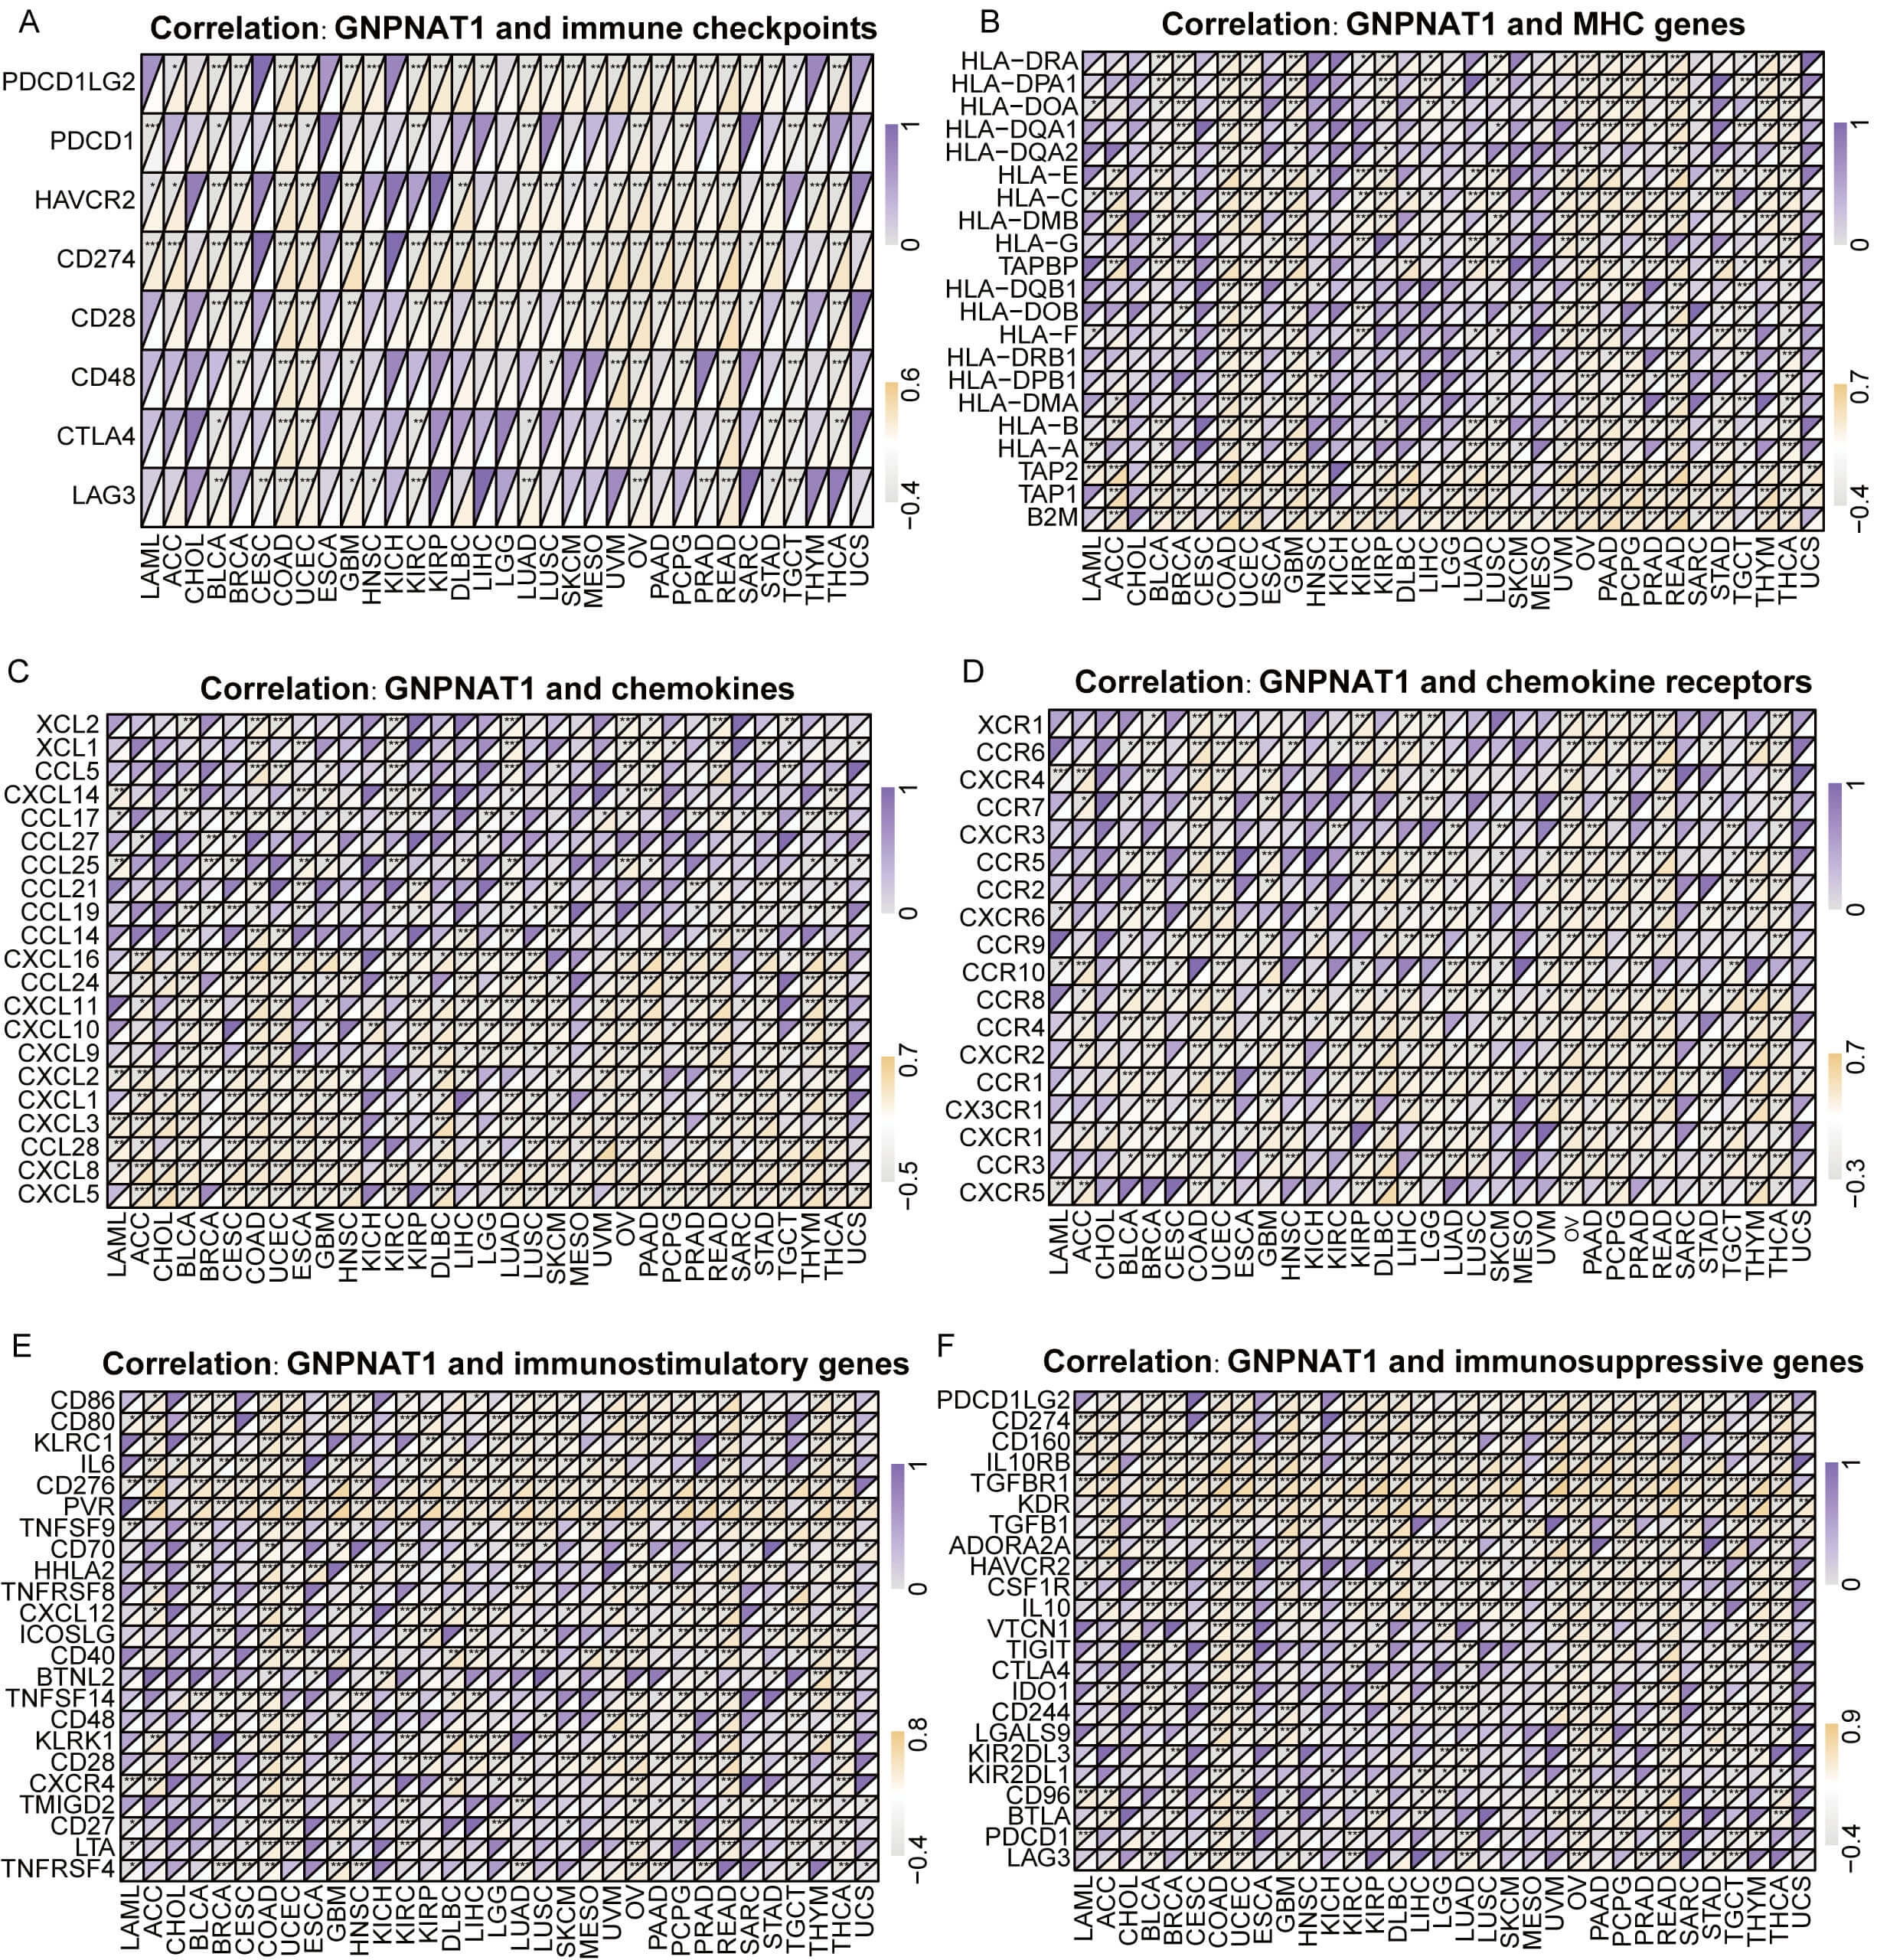 Fig. 8.
Correlation of GNPNAT1 expression with immune-related genes.
(A) Immune checkpoint genes. (B) Major histocompatibility complex (MHC) genes.
(C,D) Chemokines and chemokine receptors. (E,F) Immunostimulatory genes and
immunosuppressive genes. (* p
We analyzed the cell-type-specific expression of GNPNAT1 in the tumor microenvironment (TME) using single-cell transcriptomic data. We investigated its distribution across different cell types and found that in non-Hodgkin lymphoma (NHL), GNPNAT1 is primarily expressed in keratinocytes and fibroblasts (Fig. 9A). In non-small cell lung cancer (NSCLC), GNPNAT1 is primarily distributed in macrophages and natural killer (NK) cells (Fig. 9B). In pancreatic adenocarcinoma (PAAD), GNPNAT1 is predominantly expressed in endothelial cells, fibroblasts, and malignant cells (Fig. 9C). Immune infiltration analysis demonstrated that GNPNAT1 expression is positively associated with B cell, T cell, and dendritic cell abundance in tumors such as thyroid carcinoma (THCA) and prostate adenocarcinoma (PRAD) (Fig. 9D). We further comprehensively assessed this association using seven independent algorithms (Supplementary Figs. 8,9). The results revealed that, in most tumors, GNPNAT1 expression correlated positively with neutrophil and CD4+ T cell infiltration, while exhibiting negative associations with macrophages, CD8+ T cells, and NK cells. Such findings imply that GNPNAT1 may function through immune regulatory mechanisms.
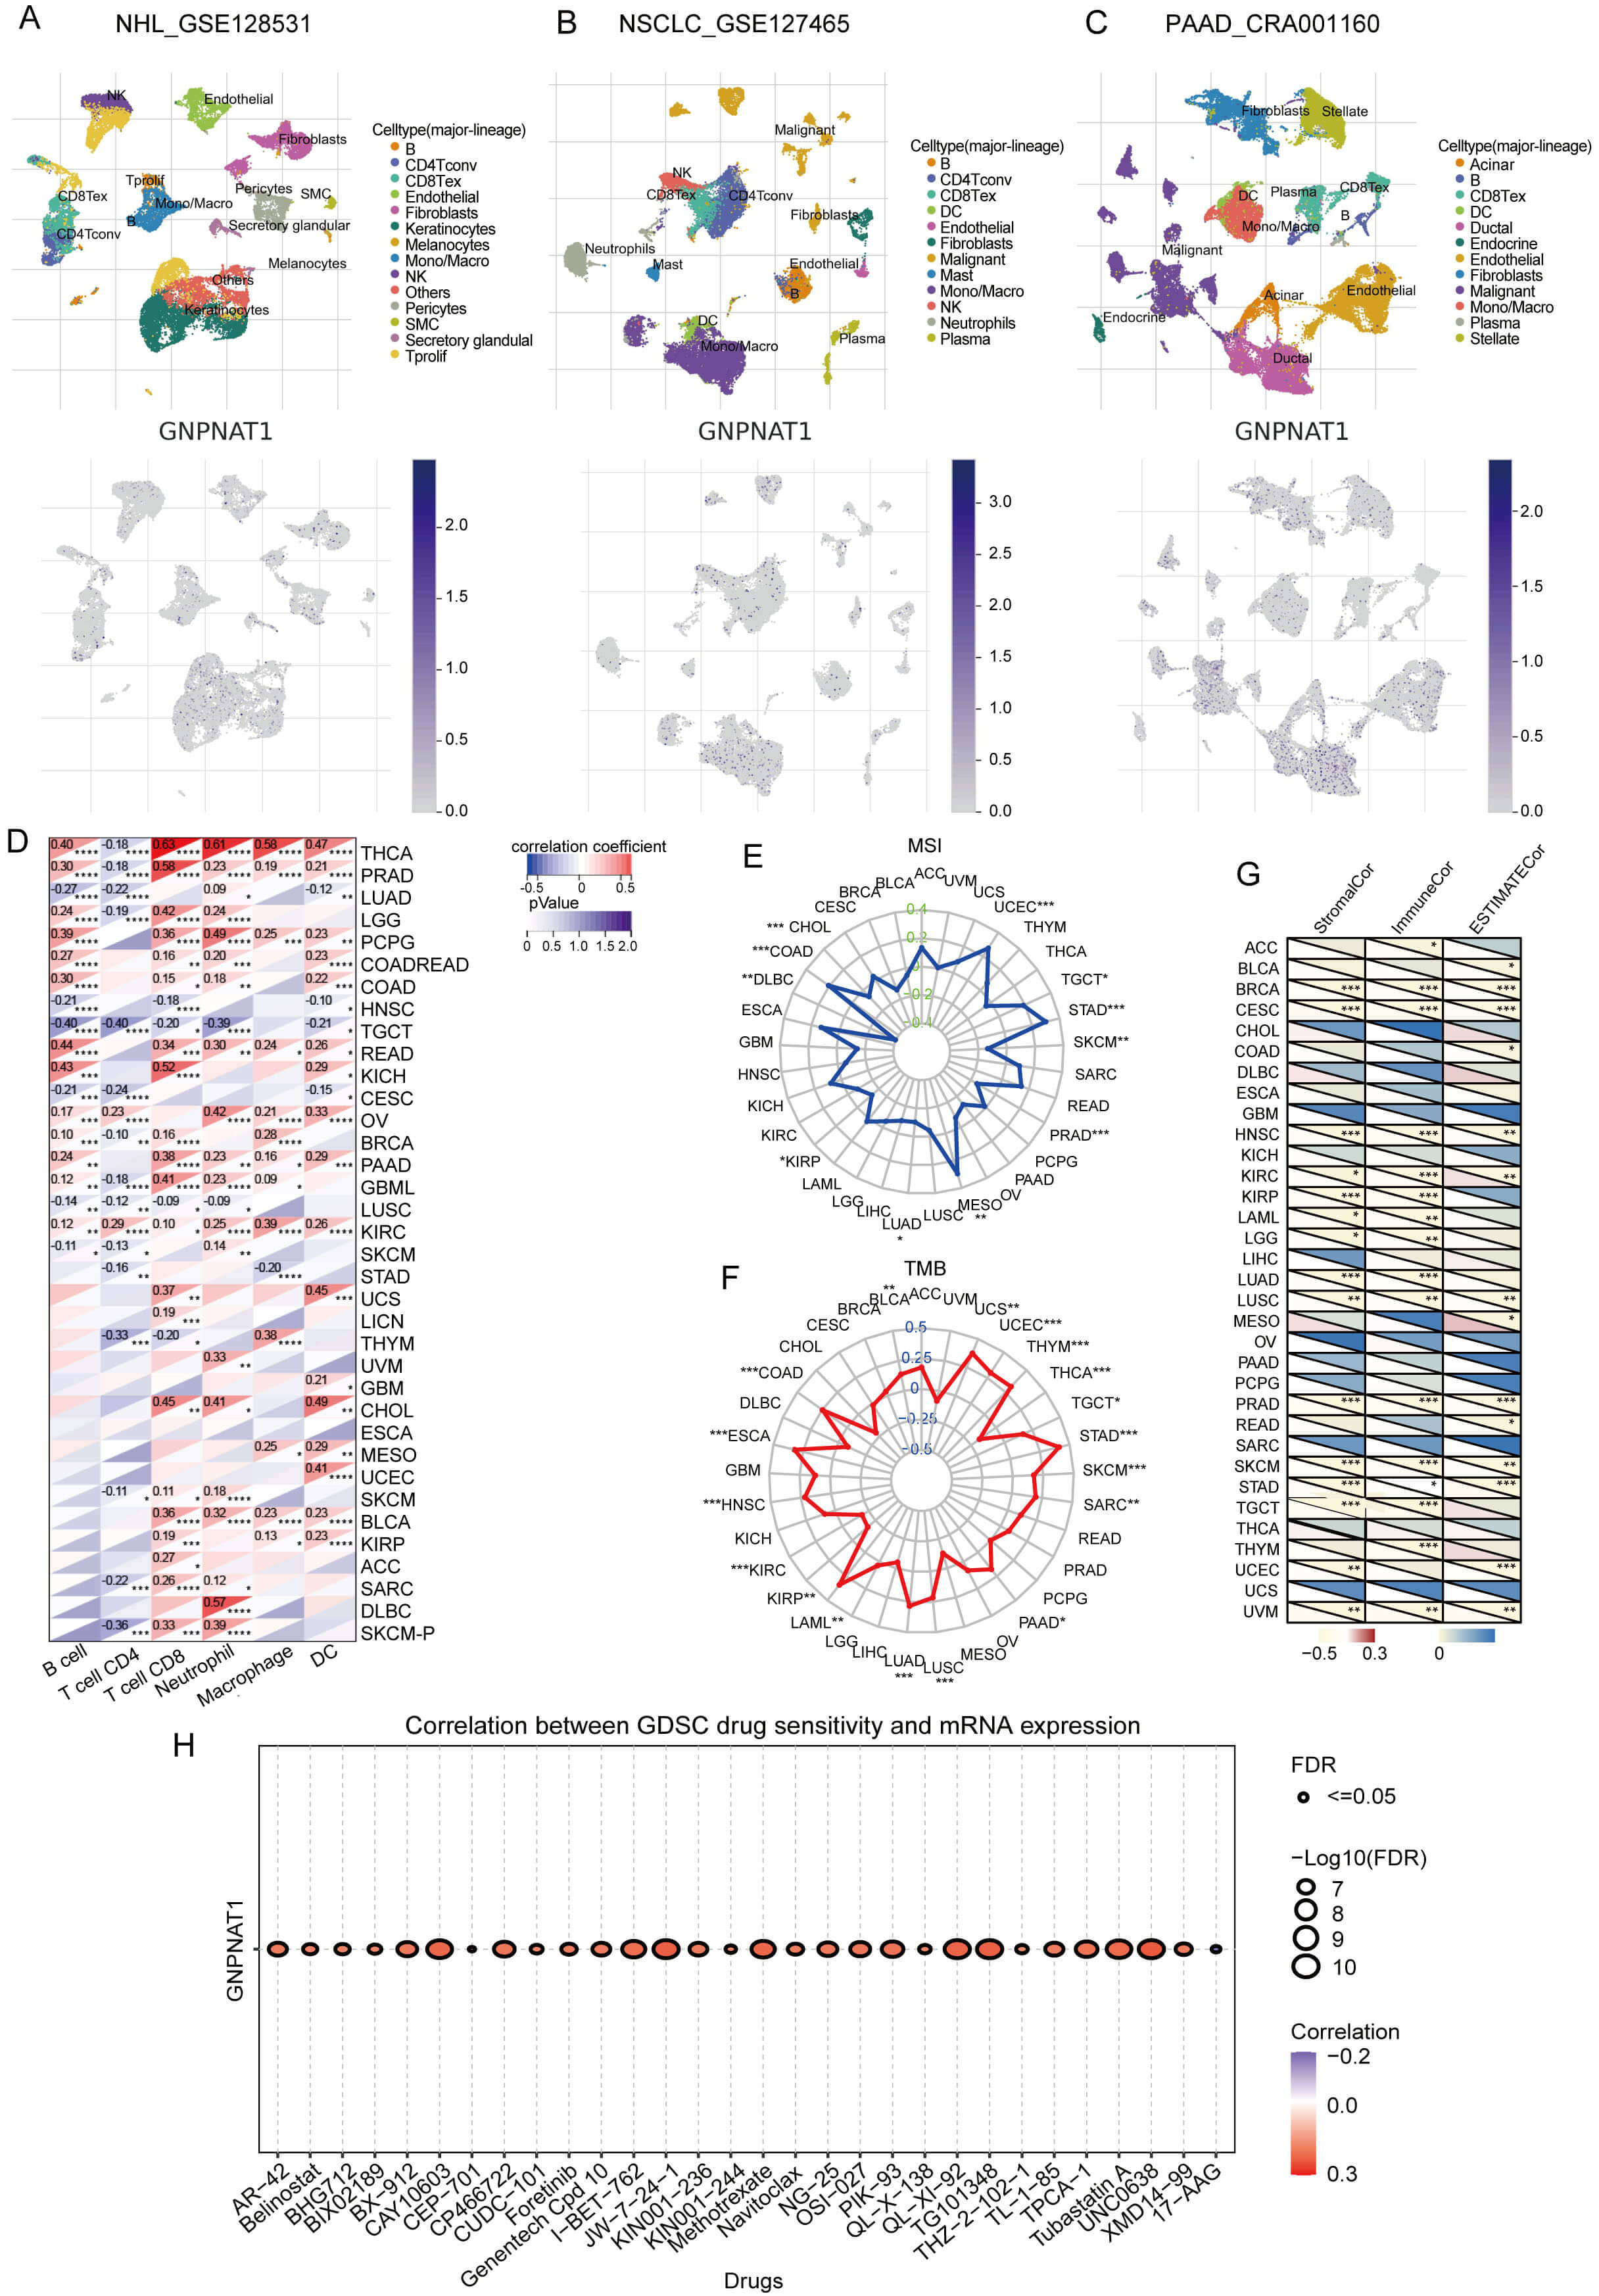 Fig. 9.
Correlation of GNPNAT1 with immune infiltration, microsatellite
instability (MSI), tumor mutational burden (TMB), and drug sensitivity. (A–C)
GNPNAT1 distribution in non-Hodgkin lymphoma (NHL), non-small cell lung cancer
(NSCLC), and PAAD. (D) Correlation with infiltrating immune cells. (E,F) Radar
plots for MSI (E) and TMB (F). (G) Correlation with immune infiltration scores.
(H) Top 30 drug sensitivity correlations (GDSC). (* p
Immunotherapy is a key approach to cancer treatment, and its efficacy is significantly influenced by microsatellite instability (MSI) and tumor mutational burden (TMB). In tumors such as UCEC, STAD, and COAD, GNPNAT1 expression correlates positively with both MSI and TMB. However, in skin cutaneous melanoma (SKCM), PRAD, LUAD, and lymphoid neoplasm diffuse large B-cell lymphoma (DLBC), GNPNAT1 expression is negatively correlated with MSI. In contrast, in THCA, kidney renal papillary cell carcinoma (KIRP), and kidney renal clear cell carcinoma (KIRC), GNPNAT1 expression is negatively correlated with TMB (Fig. 9E,F). GNPNAT1 was negatively correlated with stromal, immune, and ESTIMATE scores in most cancers (Fig. 9G), pointing to its possible involvement in fostering an immunosuppressive microenvironment.
Furthermore, analysis of mouse models based on the TISMO database indicates that GNPNAT1 expression may predict responses to treatment with PD-L1 and CTLA-4 inhibitors in 4T1, T22, and CT26 models. Changes in GNPNAT1 expression before and after cytokine intervention further support the notion that it may exhibit plasticity in immune regulation (Supplementary Figs. 10,11). To explore the potential of GNPNAT1 as a therapeutic target, we used the GSCALite database to analyse its relationship with drug sensitivity. Analysis of CTRP database revealed a positive correlation between GNPNAT1 and sensitivity to BIX-01294, CCT036477, GSK525762A, I-BET151, NVP-BSK805, and a negative correlation with IC50 values for ABT-737 and oseltamivir (Supplementary Fig. 12). Analysis of GDSC database indicated that GNPNAT1 was positively correlated with the IC50 values of AR-42, BX-912, CAY10603, CP466722, methotrexate, and TG101348, and negatively correlated with the IC50 values of 17-AAG (Fig. 9H).
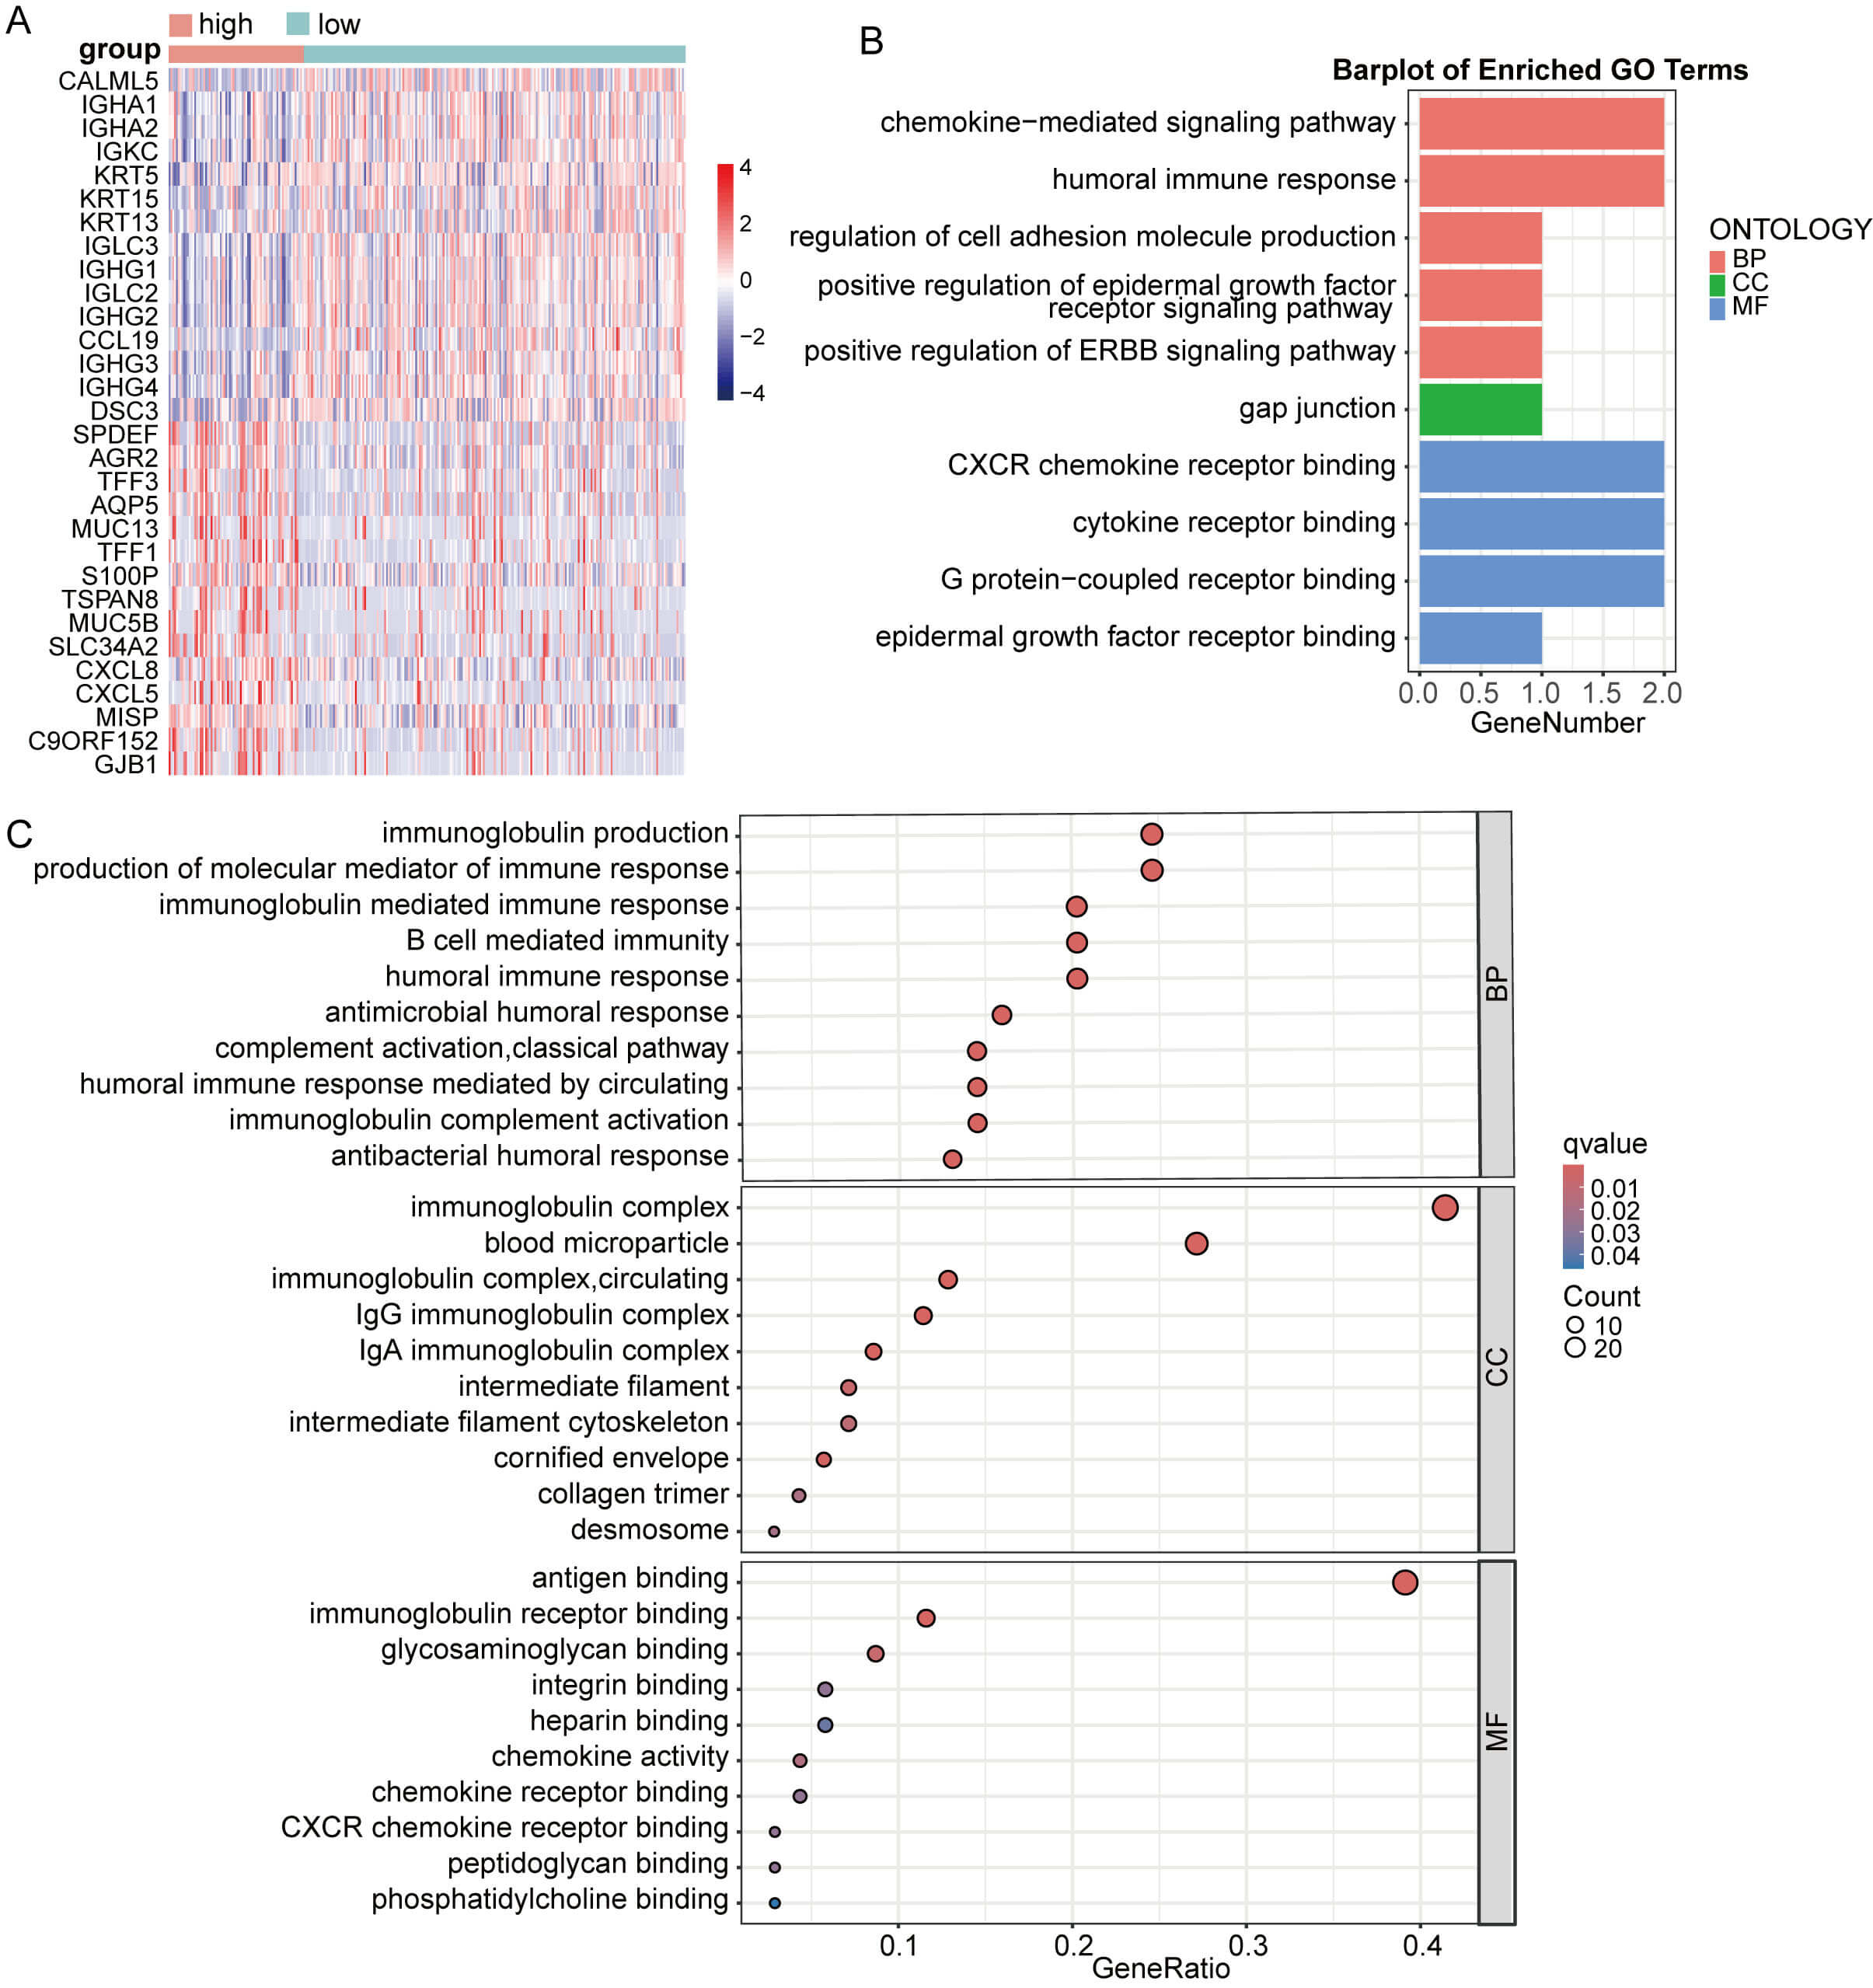
Subsequently, DEG analysis between CESC groups with high versus low GNPNAT1 expression identified the top 15 up- and downregulated genes (Fig. 10A). The upregulated genes in the high-expression group primarily included immunoglobulin-related genes (IGHA1, IGHA2, IGKC, IGLC3, and IGHG3) and genes related to cell structure (KRT5, KRT15, and DSC3). These results suggest that CC with GNPNAT1 overexpression may exhibit enhanced humoral immune responses and epithelial structural characteristics. Enrichment analysis revealed that GNPNAT1 overexpression significantly enriched multiple pathways, including chemokine-mediated signaling pathways, the humoral immune response, the Ig-mediated immune response, cell adhesion, and the epidermal growth factor receptor binding pathway (Fig. 10B,C).
 Fig. 10.
Enrichment analysis based on CESC patients. (A) Differential analysis heatmap. (B,C) Enrichment analysis.
Finally, we validated the expression of GNPNAT1 in CC cohorts. Our findings demonstrated that GNPNAT1 expression was markedly elevated in CC tissues compared to normal counterparts (Fig. 11A,B,E,F). Furthermore, elevated GNPNAT1 expression was associated with worse clinical outcomes (Fig. 11C). Time-dependent ROC curve analysis revealed that GNPNAT1 exhibited excellent predictive ability for one-, three-, and five-year survival rates, with an AUC value of 0.944 for 1-year survival (Fig. 11D). Functional experiments confirmed that GNPNAT1 knockdown markedly suppressed the proliferation, colony formation, and migration abilities of CC cells (Fig. 11G–L).
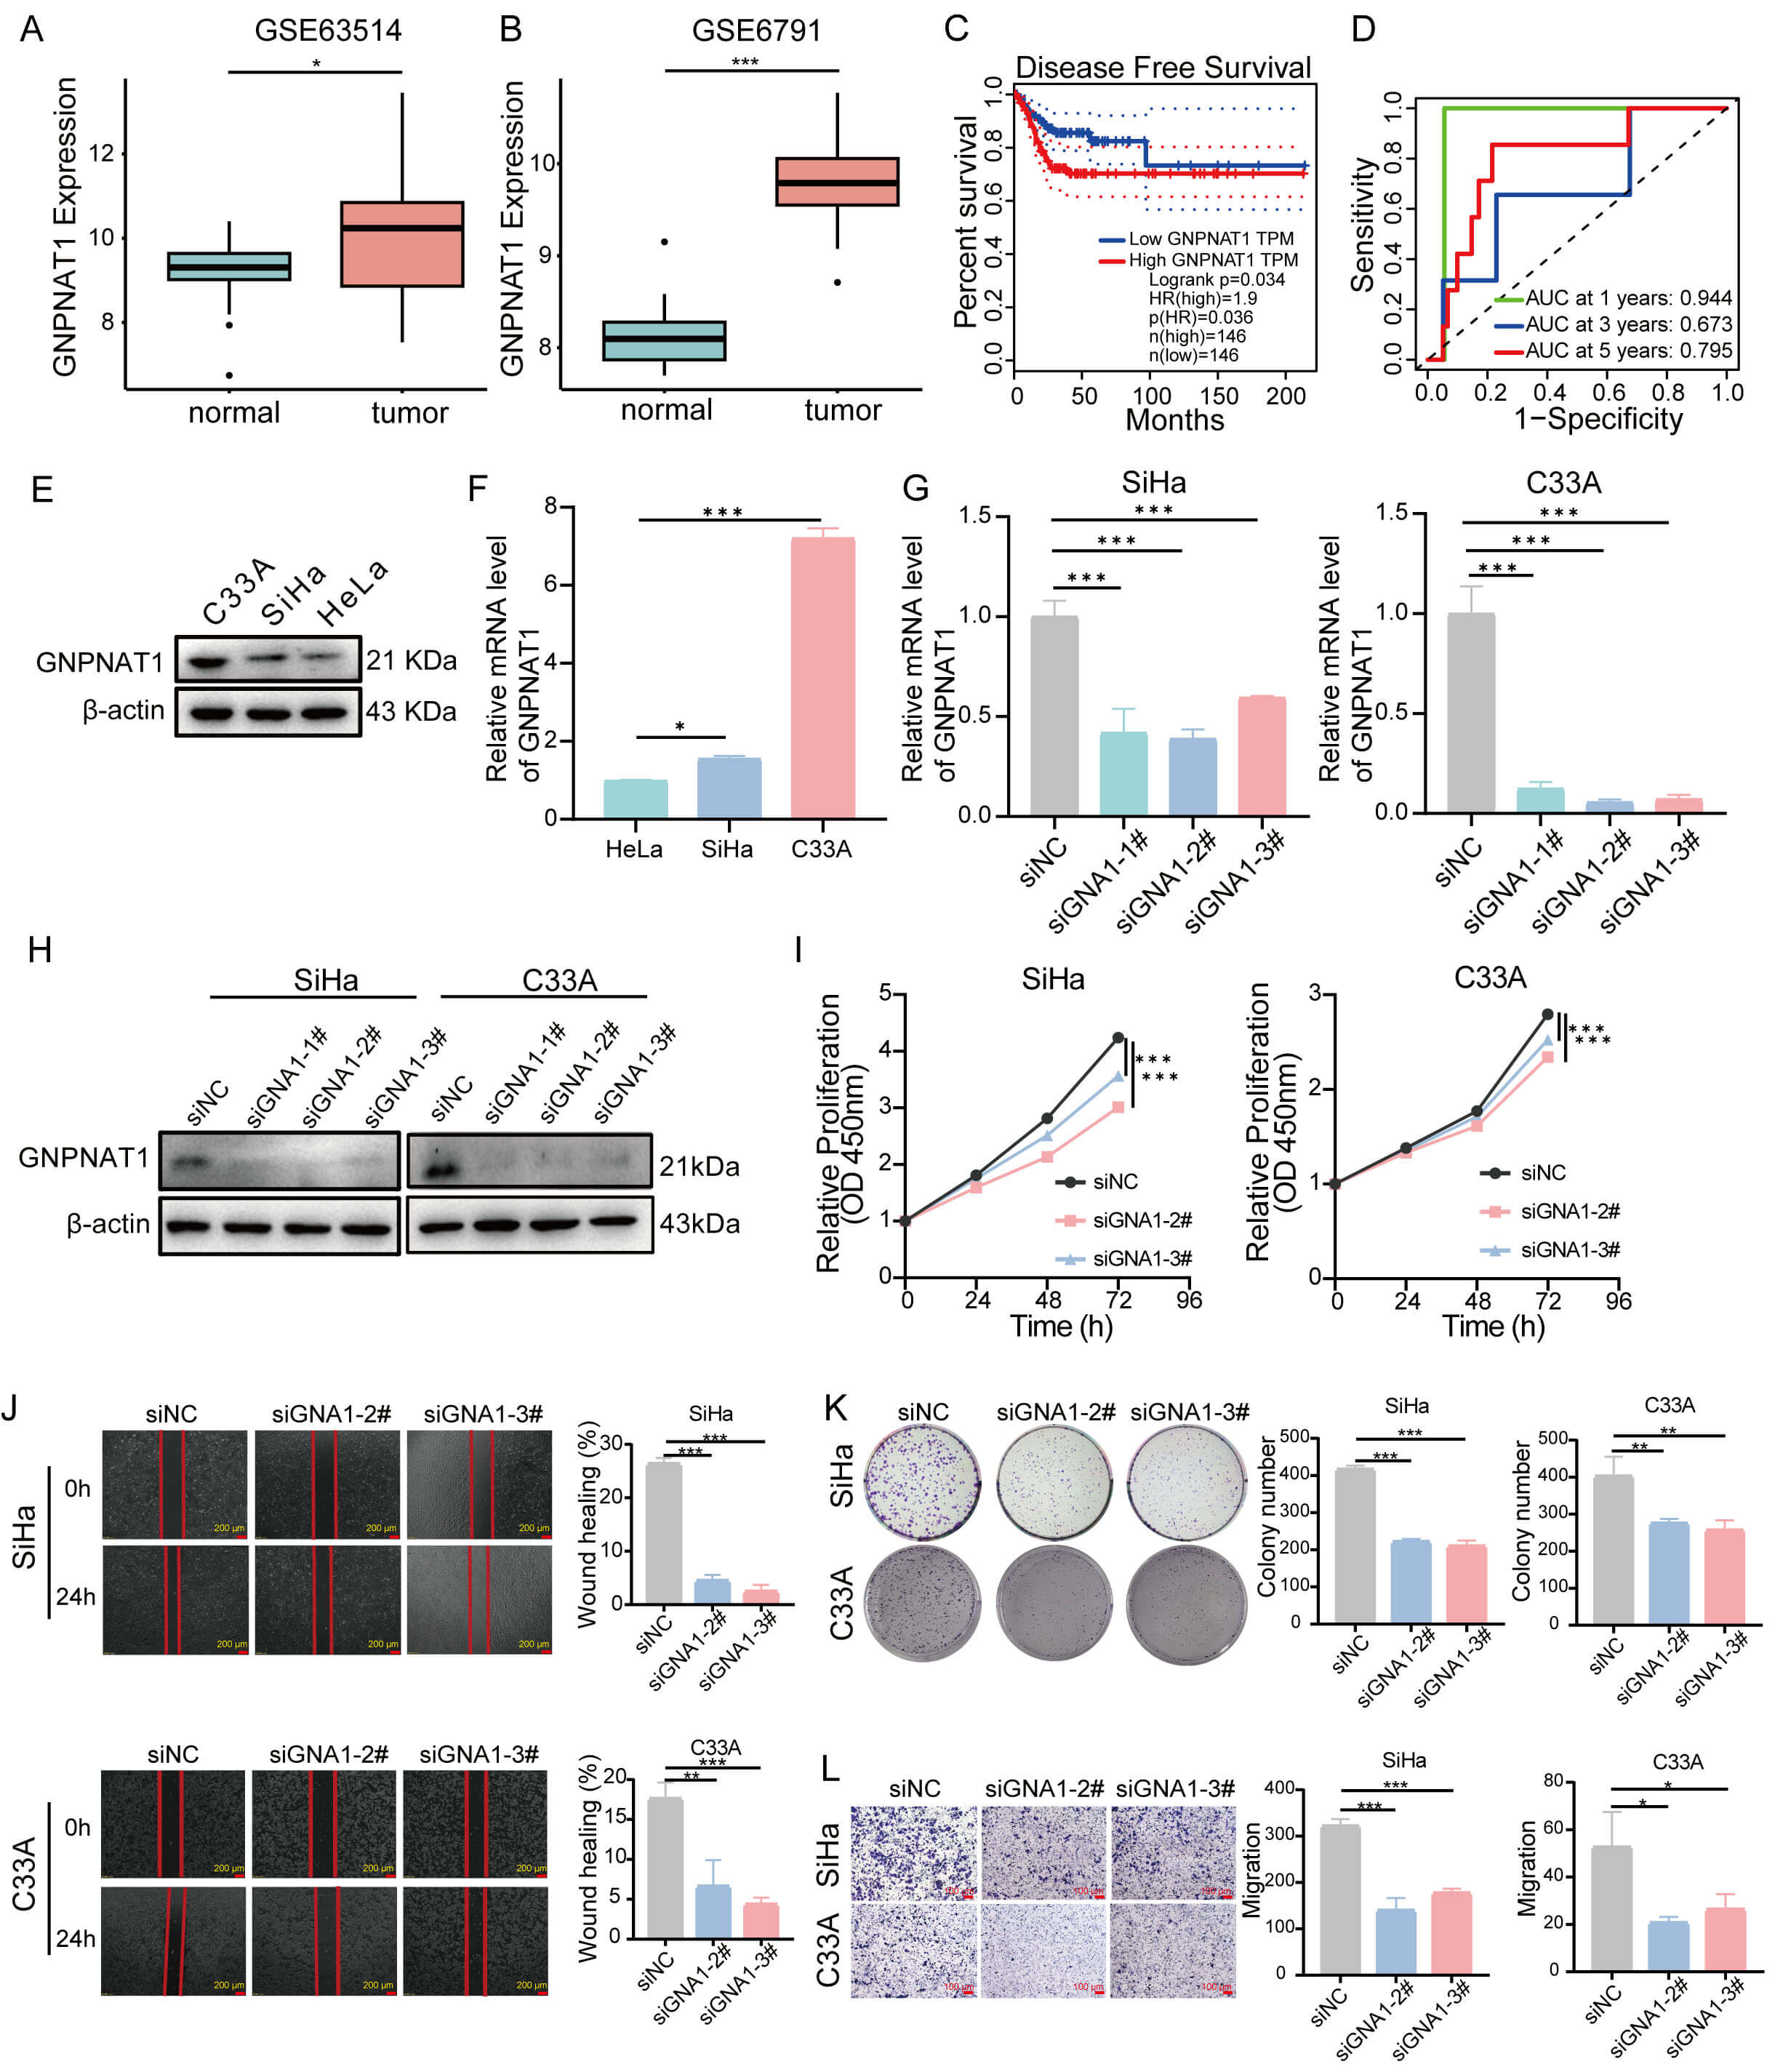 Fig. 11.
The role of GNPNAT1 in CC. (A,B) Differential expression of
GNPNAT1 in normal versus CC tissues. (C) DFS for CC in the GEPIA database. (D)
The area under the receiver operating characteristic (ROC) showing the prognostic
value of GNPNAT1 for CC at 1, 3, and 5 years. (E,F) GNPNAT1 protein and mRNA
expression in CC cells. (G,H) GNPNAT1 mRNA (G) and protein (H) levels in SiHa and
C33A cells following si-NC or si-GNPNAT1 transfection. (I–L) GNPNAT1-knockdown
SiHa and C33A cells were subjected to (I) CCK8 assay, (J) wound healing assay
(scale bar: 200 µm, 4
This study characterized the oncogenic attributes of GNPNAT1 across diverse malignancies through a systematic multi-database analysis integrating TCGA, TIMER, and CPTAC. Our results demonstrated that GNPNAT1 is aberrantly expressed in multiple cancers and significantly correlates with the Ki-67 proliferation index, implying a pivotal role in cell cycle progression and tumor proliferation. These observations align closely with prior studies documenting the oncogenic roles of GNPNAT1 in lung adenocarcinoma, breast cancer, and prostate cancer [13, 35, 36, 37], while extending its potential carcinogenic effects to a broader spectrum of malignant tumors than previously reported. Furthermore, ROC curve analysis demonstrated the diagnostic potential of GNPNAT1 in CESC, LUAD, and KIRC, showing high predictive accuracy. Overall, these results support GNPNAT1 as a candidate gene for diagnostic and prognostic biomarkers in various malignancies. However, further in vivo experiments and clinical studies are necessary to confirm its practical clinical utility.
Our study demonstrates that GNPNAT1 expression is associated with the stemness score in various tumor types. This finding was further validated through single-cell analysis. At the single-cell level, cell subpopulations that express high levels of GNPNAT1 exhibit enhanced stem cell properties, proliferative activity, and EMT characteristics. This suggests that GNPNAT1 may be one of the potential key mechanisms underlying its involvement in tumorigenesis. Recent studies have indicated that UDP-GlcNAc-mediated O-GlcNAc modification of proteins maintains tumor stem cell properties by regulating the activity of stemness-related transcription factors, such as Sox2, NANOG, and c-Myc [38, 39, 40, 41]. These findings are consistent with ours and indirectly support the notion that GNPNAT1 may regulate tumor stemness. Single-cell data revealed a positive link between GNPNAT1 and metastasis in LUAD and BRCA, but a negative association with metastasis and invasion in melanoma. These results reflect the functional heterogeneity of GNPNAT1 across different cancers. This heterogeneity may be related to the genetic background and metabolic characteristics of different tumors.
RNA methylation influences RNA splicing, translation, transport, and stability, thereby regulating tumor biological functions through multiple pathways [30, 42, 43]. GNPNAT1 expression correlated significantly with RNA modification enzymes, particularly those governing m6A and m5C. This is consistent with reports that HBP metabolites influence genomic stability by modulating RNA modifications [44, 45, 46]. Since UDP-GlcNAc is a substrate donor for multiple RNA modification reactions, we hypothesize that GNPNAT1 may influence tumor cell fate by regulating RNA epigenetics. This finding offers a new perspective on the role of metabolic enzymes in epigenetic regulation. Nevertheless, additional functional studies are needed to validate this hypothesis.
Correlation analysis between GNPNAT1 expression and gene mutations revealed that TP53 is the primary mutation site in breast cancer, with mutations in this gene occurring in approximately 50% of human cancers [47]. In CC, the predominant mutation was located in the TTN gene. Existing studies have confirmed that TTN mutations are associated with the prognosis of patients with ocular squamous cell carcinoma, gastric cancer, and thyroid cancer, and TTN is among the most frequently mutated genes in pan-cancer cohorts [48, 49, 50, 51]. These observations provide new clues for understanding the role of GNPNAT1 in mutation accumulation, but the specific regulatory relationship between GNPNAT1 and these mutated genes remains to be further explored.
Recognizing the TME’s critical influence on cancer progression and therapeutic outcomes, we examined GNPNAT1’s immune associations pan-cancer. We observed a marked association between GNPNAT1 expression and key immune regulators in multiple malignancies. This is further substantiated by the strong negative correlation between GNPNAT1 and stromal/immune scores across the majority of tumor types, suggesting a possible contribution to immune evasion.
In terms of clinical translation, this study provided preliminary clues for personalized therapy based on GNPNAT1 through correlation analysis of immune checkpoint biomarkers, drug sensitivity analysis, and mouse model validation. By analyzing TMB and MSI, we revealed an association between GNPNAT1 expression and tumor genomic instability. GNPNAT1 correlated positively with TMB in 15 cancers, most notably in BLCA, STAD, and UCEC. The functional status of the tumor microenvironment influences tumor development, metastatic dissemination, and therapeutic responses [52]. We further examined the association between GNPNAT1 expression and drug sensitivity, including numerous small molecules with potential clinical application value. Methotrexate is a commonly used chemotherapeutic drug for the treatment of various pediatric cancers [53, 54]. Oseltamivir, when used in combination with metformin and acetylsalicylic acid, can induce apoptosis of breast cancer endothelial cells [55]. Despite unclear mechanisms, GNPNAT1 shows promise as a predictive biomarker for drug sensitivity.
In CC, enrichment analysis revealed that the gene sets enriched with GNPNAT1 were significantly enriched in epidermis-related processes, suggesting that GNPNAT1 may be involved in epithelial differentiation and plasticity. Our findings further revealed that GNPNAT1 expression was significantly associated with the chemokine pathways in CESC, and chemokine-mediated signaling is crucial for recruiting immune cells to the TME [56]. In vitro experiments further validated the role of GNPNAT1 in CC, showing that GNPNAT1 knockdown effectively suppressed the proliferation and migration capabilities of CC cells. Future studies should further clarify the molecular mechanisms of GNPNAT1 in tumor metabolism and immune interactions.
Despite elucidating the potential significance of GNPNAT1 as a prognostic biomarker in multiple cancers, this investigation has certain limitations. First, this study primarily relied on bioinformatics analysis of public databases, with relevant functional experiments conducted only in CC cell lines; although previous studies have explored some functions of GNPNAT1 in lung and breast cancers, systematic validation in additional tumor models is still required to fully elucidate its mechanism of action. Second, this study has not yet conducted in vivo animal experiments or established GNPNAT1 knockout or overexpression animal models using gene editing techniques, such as CRISPR/Cas9. This makes it difficult to systematically evaluate the specific roles of GNPNAT1 in tumor proliferation, invasion, metastasis, and the tumor immune microenvironment. Furthermore, the direct relationship between GNPNAT1 and the efficacy of tumor immunotherapy remains to be further validated using clinical samples and humanized mouse models. Future studies will combine in vivo functional experiments with long-term clinical follow-up data to elucidate the molecular mechanisms underlying GNPNAT1’s role in tumorigenesis, tumor progression, and treatment resistance, thereby providing a more reliable theoretical basis for its clinical application.
This first systematic pan-cancer analysis reveals that GNPNAT1 is aberrantly expressed in multiple malignancies and is associated with immune regulation, tumor stemness, mutational patterns, RNA modifications, and drug sensitivity. Inhibition of GNPNAT1 expression suppresses the proliferation and migration of CC cells. In conclusion, GNPNAT1 has the potential to serve as a prognostic biomarker and immune-related factor, offering new avenues for personalized precision diagnosis and treatment of cancer.
GNPNAT1, glucosamine 6-phosphate N-acetyltransferase; HBP, hexosamine biosynthetic pathway; UDP-GlcNAc, uridine diphosphate N-acetylglucosamine; O-GlcNAc, o-linked
The data generated in this study are described in the Supplementary Material and are available from the corresponding author upon reasonable request. Online repositories contain the datasets used in this study.
YL, TW, SL, and YZhang designed the study. YL, HK, and YZhao performed the research. YL and YW designed and validated the cell experiments. YL, TW, and JC helped with the tables and figures. YL wrote the paper. SL and YZhang supervised the study. All authors contributed to editorial changes in the manuscript. All authors read and approved the final manuscript. All authors have read and agreed to the published version of the manuscript.
Not applicable.
Not applicable.
This study was supported by the National Natural Science Foundation of China (Nos. 82271880, 82303691) and the “Nn10 Program” of Harbin Medical University Cancer Hospital (No. Nn102024-03).
The authors declare no conflicts of interest.
Supplementary material associated with this article can be found, in the online version, at https://doi.org/10.31083/FBL51401.
References
Publisher’s Note: IMR Press stays neutral with regard to jurisdictional claims in published maps and institutional affiliations.