


 , Yanji Jiang 2, Jie Ji 2, Anyang Chou 2, Weipu Mao 1, Ming Chen 1,*
 , Yang Zheng 3,*
1 Department of Urology, Affiliated Zhongda Hospital of Southeast University, 210009 Nanjing, Jiangsu, China
2 School of Medicine, Southeast University, 210009 Nanjing, Jiangsu, China
3 Department of Urology, Nanjing Hospital of Chinese Medicine, 210000 Nanjing, Jiangsu, China
Abstract
Kidney stones are a globally prevalent condition, but their pathogenesis remains incompletely understood. This study aimed to identify and validate key genes implicated in kidney stone formation through sequencing data analysis, offering novel molecular targets for elucidating the underlying pathogenic mechanisms.
A mouse model of kidney stones was established, and perinephrolithic renal tissue samples were obtained from patients who underwent nephrectomy due to renal dysfunction caused by kidney stones. Transcriptome sequencing was employed to identify differentially expressed genes (DEGs) common to both human and mouse samples. Expression of DEGs in kidney stone specimens was validated using real-time quantitative polymerase chain reaction (qRT-PCR), western blotting, and immunofluorescence (IF). Concurrently, Gene Ontology (GO) and Kyoto Kncyclopedia of Genes and Genomes (KEGG) enrichment analyses were conducted to investigate functional and pathway associations of the DEGs.
Transcriptome sequencing identified eight genes consistently upregulated in both humans and mice: COL3A1, TYROBP, MMP2, BASP1, COL5A1, ITGAX, C1QC, and S100A8. qRT-PCR results demonstrated elevated mRNA levels of C1QC and COL3A1 in the perinephrolithic renal tissues of the mouse model. Western blotting confirmed upregulation of COL3A1 at the protein level, and IF staining further verified the specific enrichment of COL3A1 in the renal tissues of the mouse kidney stone model. GO and KEGG enrichment analyses revealed significant associations between the DEGs and immune-related signaling pathways, as well as biological processes involved in extracellular matrix (ECM) remodeling.
These findings suggest that the ongoing upregulation of COL3A1 could be a key factor in the pathogenesis of kidney stone. Functional enrichment analyses indicate that COL3A1 may promote stone deposition and progression by regulating ECM remodeling and the immune response . These results provide new insights into the molecular mechanisms underlying kidney stone formation.
Keywords
- kidney stone
- COL3A1
- C1QC
- extracellular matrix
- immune response
Kidney stone is a prevalent urological disorder with a globally increasing incidence, and the recurrence rate can reach up to 50% within five years after the first episode [1]. Kidney stones cause acute symptoms such as renal colic and urinary obstruction, significantly impair renal function, and may progress to chronic or end-stage kidney disease [2, 3, 4]. Current clinical management predominantly relies on surgical intervention. Although advances in minimally invasive techniques have improved clinical outcomes, the lack of targeted preventive strategies—due to the incomplete understanding of the pathogenic mechanisms—continues to impose a significant burden on patients with high rates of recurrence. Therefore, identifying key molecular drivers of stone formation is essential for developing novel therapeutic targets.
The formation of kidney stones involves multiple processes, including crystal nucleation, aggregation, and retention within the kidney. This complex pathological process is regulated by intertwined pathways, including metabolic disorders, oxidative stress, and inflammatory responses [2]. Calcium oxalate constitutes roughly 80% of kidney stones, most of which are classified as idiopathic. Histological studies suggest that Randall’s plaques—calcium phosphate deposits at the renal papillary surface—serve as nucleation sites for stone formation [5]. These plaques are primarily composed of calcium phosphate crystals, collagen fibers, and membrane-bound vesicles [6, 7], and are closely associated with the basement membrane of the loops of Henle, collecting ducts, and vasa recta [8, 9, 10].
Increasing evidence indicates that extracellular matrix (ECM) remodeling and immune-inflammatory responses are critically involved in Randall’s plaque formation and stone development [11, 12]. Collagen fibers provide a scaffold for crystal nucleation, while inflammatory cell infiltration—particularly macrophage activation—promotes crystal retention and tissue injury [13, 14]. Moreover, crystal deposition can activate the NLR family pyrin domain containing 3 (NLRP3) inflammasome, triggering downstream inflammatory cascades [15, 16]. This suggests that immune modulation may be a potential strategy for preventing stone recurrence [17].
However, previous studies have been limited by single-species analysis or small sample sizes, and lack systematic cross-species validation. To address this gap, the present study employed a cross-species integrated analysis of human clinical samples and a murine kidney stone model to identify and validate key genes implicated in stone formation. Our findings reveal that COL3A1 is consistently upregulated and may promote stone deposition through ECM remodeling and immune response regulation, providing novel insights into the molecular mechanisms of kidney stone disease and potential targets for prevention.
20 eight-week-old male C57BL/6 mice, weighing between 20 and 25 grams, were obtained from Jiangsu GemPharmatech Co., Ltd. The mice were kept in a standard SPF animal facility. The mice were randomly assigned to either a control group or a stone model group, with each group containing ten mice. The stone model group was given a daily intraperitoneal injection of glyoxylic acid solution at a dose of 80 mg/kg for a period of seven days. Daily intraperitoneal injections of sterile physiological saline, matching the volume and frequency, were administered to the control group. An overdose of 1% pentobarbital sodium (150 mg/kg) was used to anesthetize the mice, which were then euthanized by cervical dislocation 24 hours after the last injection. Bilateral kidneys were promptly excised. The left kidneys were quickly frozen in liquid nitrogen and kept at –80 °C for later transcriptome sequencing analysis. Meanwhile, the right kidneys were cut sagittally and preserved in 4% paraformaldehyde at 4 °C for a day, and then underwent routine dehydration and paraffin embedding for Von Kossa staining and immunofluorescence staining. A second cohort of mice was established using the same protocol, with these samples used for subsequent real-time quantitative polymerase chain reaction (qRT-PCR) and Western blot validation experiments. The animal experiment was approved by the Animal Experimental Ethical Inspection Form of Southeast University (20250909003).
At the Affiliated Zhongda Hospital of Southeast University, clinical samples were collected over the period from January 2020 to October 2024. All participants provided informed consent for the collection of samples and involvement in the study.
Inclusion criteria for stone group: (i) Patients who underwent nephrectomy due to renal dysfunction caused by kidney stones; (ii) Postoperative stone composition analysis confirmed calcium oxalate as the primary component; (iii) Age 18–75 years.
Inclusion criteria for control group: (i) Patients who underwent nephrectomy for renal cell carcinoma; (ii) Paracancerous renal tissues located at least 2 cm from the tumor edge; (iii) Intraoperative frozen pathology confirmed normal renal tissue without tumor infiltration.
Exclusion criteria (both groups): (i) Systemic autoimmune diseases; (ii) Active infection; (iii) Other renal diseases (e.g., polycystic kidney disease, diabetic nephropathy); (iv) Preoperative immunosuppressive therapy or chemotherapy.
Three patients were enrolled in each group. Postoperative pathological examination confirmed the diagnosis in all cases. Approval for the study was granted by the ethics committee at Affiliated Zhongda Hospital of Southeast University (ZDYJLY(2017)-49), in accordance with the Helsinki Declaration.
Sections of kidney tissue embedded in paraffin were deparaffinized, hydrated, and then immersed in silver nitrate solution. Sections were exposed to ultraviolet light for 20 minutes, followed by washing with distilled water. Residual silver salts were removed by treatment with 5% sodium thiosulfate solution for 2 minutes to fix the staining. Sections were counterstained with nuclear fast red for 2 minutes to clearly visualize the nuclei, then proceed with the standard processing procedure. Images were captured after observing the staining results with a BX60 Olympus optical microscope (Tokyo, Japan). ImageJ software (version 1.8.0, NIH, USA) was used to perform quantitative analysis of the area proportion of black calcium salt deposits.
The TRIzol reagent (Beyotime, Shanghai, China) was employed to extract total RNA
from renal tissues, which was then converted into cDNA using the cDNA Synthesis
Kit (Servicebio, Wuhan, China). qRT-PCR was performed using the SYBR Green qPCR
Master Mix in a 20 µL reaction volume [18]. The
2-ΔΔCt method was employed to determine the relative
expression levels of target genes, using
Stored at –80 °C, kidney tissues were homogenized in cold RIPA lysis
buffer with added protease and phosphatase inhibitors. Protein concentration was
assessed and standardized via the bicinchoninic acid (BCA) method. Equal amounts
of protein (10 µg) were mixed with loading buffer and denatured by
heating at 100 °C for 8 minutes. Samples were separated by 10% sodium
dodecyl sulfate polyacrylamide gel electrophoresis (SDS-PAGE) gel electrophoresis
and transferred to a polyvinylidenefluoride (PVDF) membrane. The membrane was
blocked with 5% skimmed milk in tris buffered saline and tween (TBST) at room
temperature for 2 hours. After washing with TBST, the membrane was incubated with
diluted primary antibodies (Supplementary Table 2) at 4 °C
overnight. Following further TBST washes, the membrane was incubated with the
corresponding HRP-conjugated secondary antibody at room temperature for 1 hour.
Protein signals were detected using enhanced chemiluminescence (ECL)
chemiluminescent substrate in a chemiluminescence imaging system [19]. The
relative expression of target proteins was calculated by analyzing the grayscale
intensity of target bands with ImageJ software (version 1.8.0, NIH, Maryland, USA), using
Kidney tissue sections embedded in paraffin were sliced into 5 µm thick pieces, deparaffinized, and rehydrated. Antigen retrieval was conducted using a sodium citrate buffer at high temperature. For permeabilization, sections were treated with 0.3% Triton X-100 in PBS for 15 minutes at room temperature. This condition is essential for both cytoplasmic (C1QC) and extracellular matrix (COL3A1) protein detection. The sections were then blocked with 3% BSA for 1 hour at room temperature. After blocking, sections were incubated overnight at 4 °C with primary antibody. After PBS washes, they were treated with secondary antibody at room temperature for 1 hour, shielded from light. Nuclei were counterstained using 4′,6-Diamidino-2-phenylindole (DAPI). A BX60 Olympus fluorescence microscope (Tokyo, Japan) with cellSens software (v4.3, Tokyo, Japan) was used to observed the stained sections, and captured the images.
Human samples (n = 3 per group) and mouse samples (n = 5 per group) were used for transcriptome sequencing. In brief, total RNA was extracted using TRIzol reagent in accordance with the manufacturer’s instructions, and library construction was performed on the extracted total RNA. The libraries were subsequently sequenced on the Illumina NovaSeq 6000 platform (Astrocyte, Hangzhou). Quality control of the raw read data was performed using fastp (v0.20.0, China). The processed read data were aligned to the reference genomes (mm10/GRCm38 for mice and hg38 for humans) using HISAT2 (v2.2.1, Maryland, USA). Gene expression levels were quantified using FeatureCounts (v2.0.1, Victoria, Australia) as ‘fraction of reads per million mapped reads’ (FPKM).
To understand the roles of differentially expressed genes (DEGs), gene ontology (GO) and kyoto encyclopedia of genes and genomes (KEGG) enrichment analyses were conducted. GO classification encompasses Cellular Component (CC), Biological Process (BP), and Molecular Function (MF).
The R software (version 3.5.3, Auckland, New Zealand) was used in this study. The DESeq2 R
package was conducted used to analysis the differential expression of sequencing
data. DEGs were identified with the criteria of p
Von Kossa staining was performed on mouse kidney sections to specifically label
calcium salt deposits. As shown in Fig. 1A, staining results revealed
prominent brownish-black positive deposition signals in the stone group,
primarily concentrated in the renal tubular lumen and renal papillary
interstitial regions. The deposition morphologies exhibited a granular or
sheet-like distribution. In contrast, no such specific calcium deposits were
observed in the normal group. Quantitative analysis using ImageJ software showed
that the percentage of positive staining area was significantly higher in the
stone group compared to controls (stone group: 12.5%
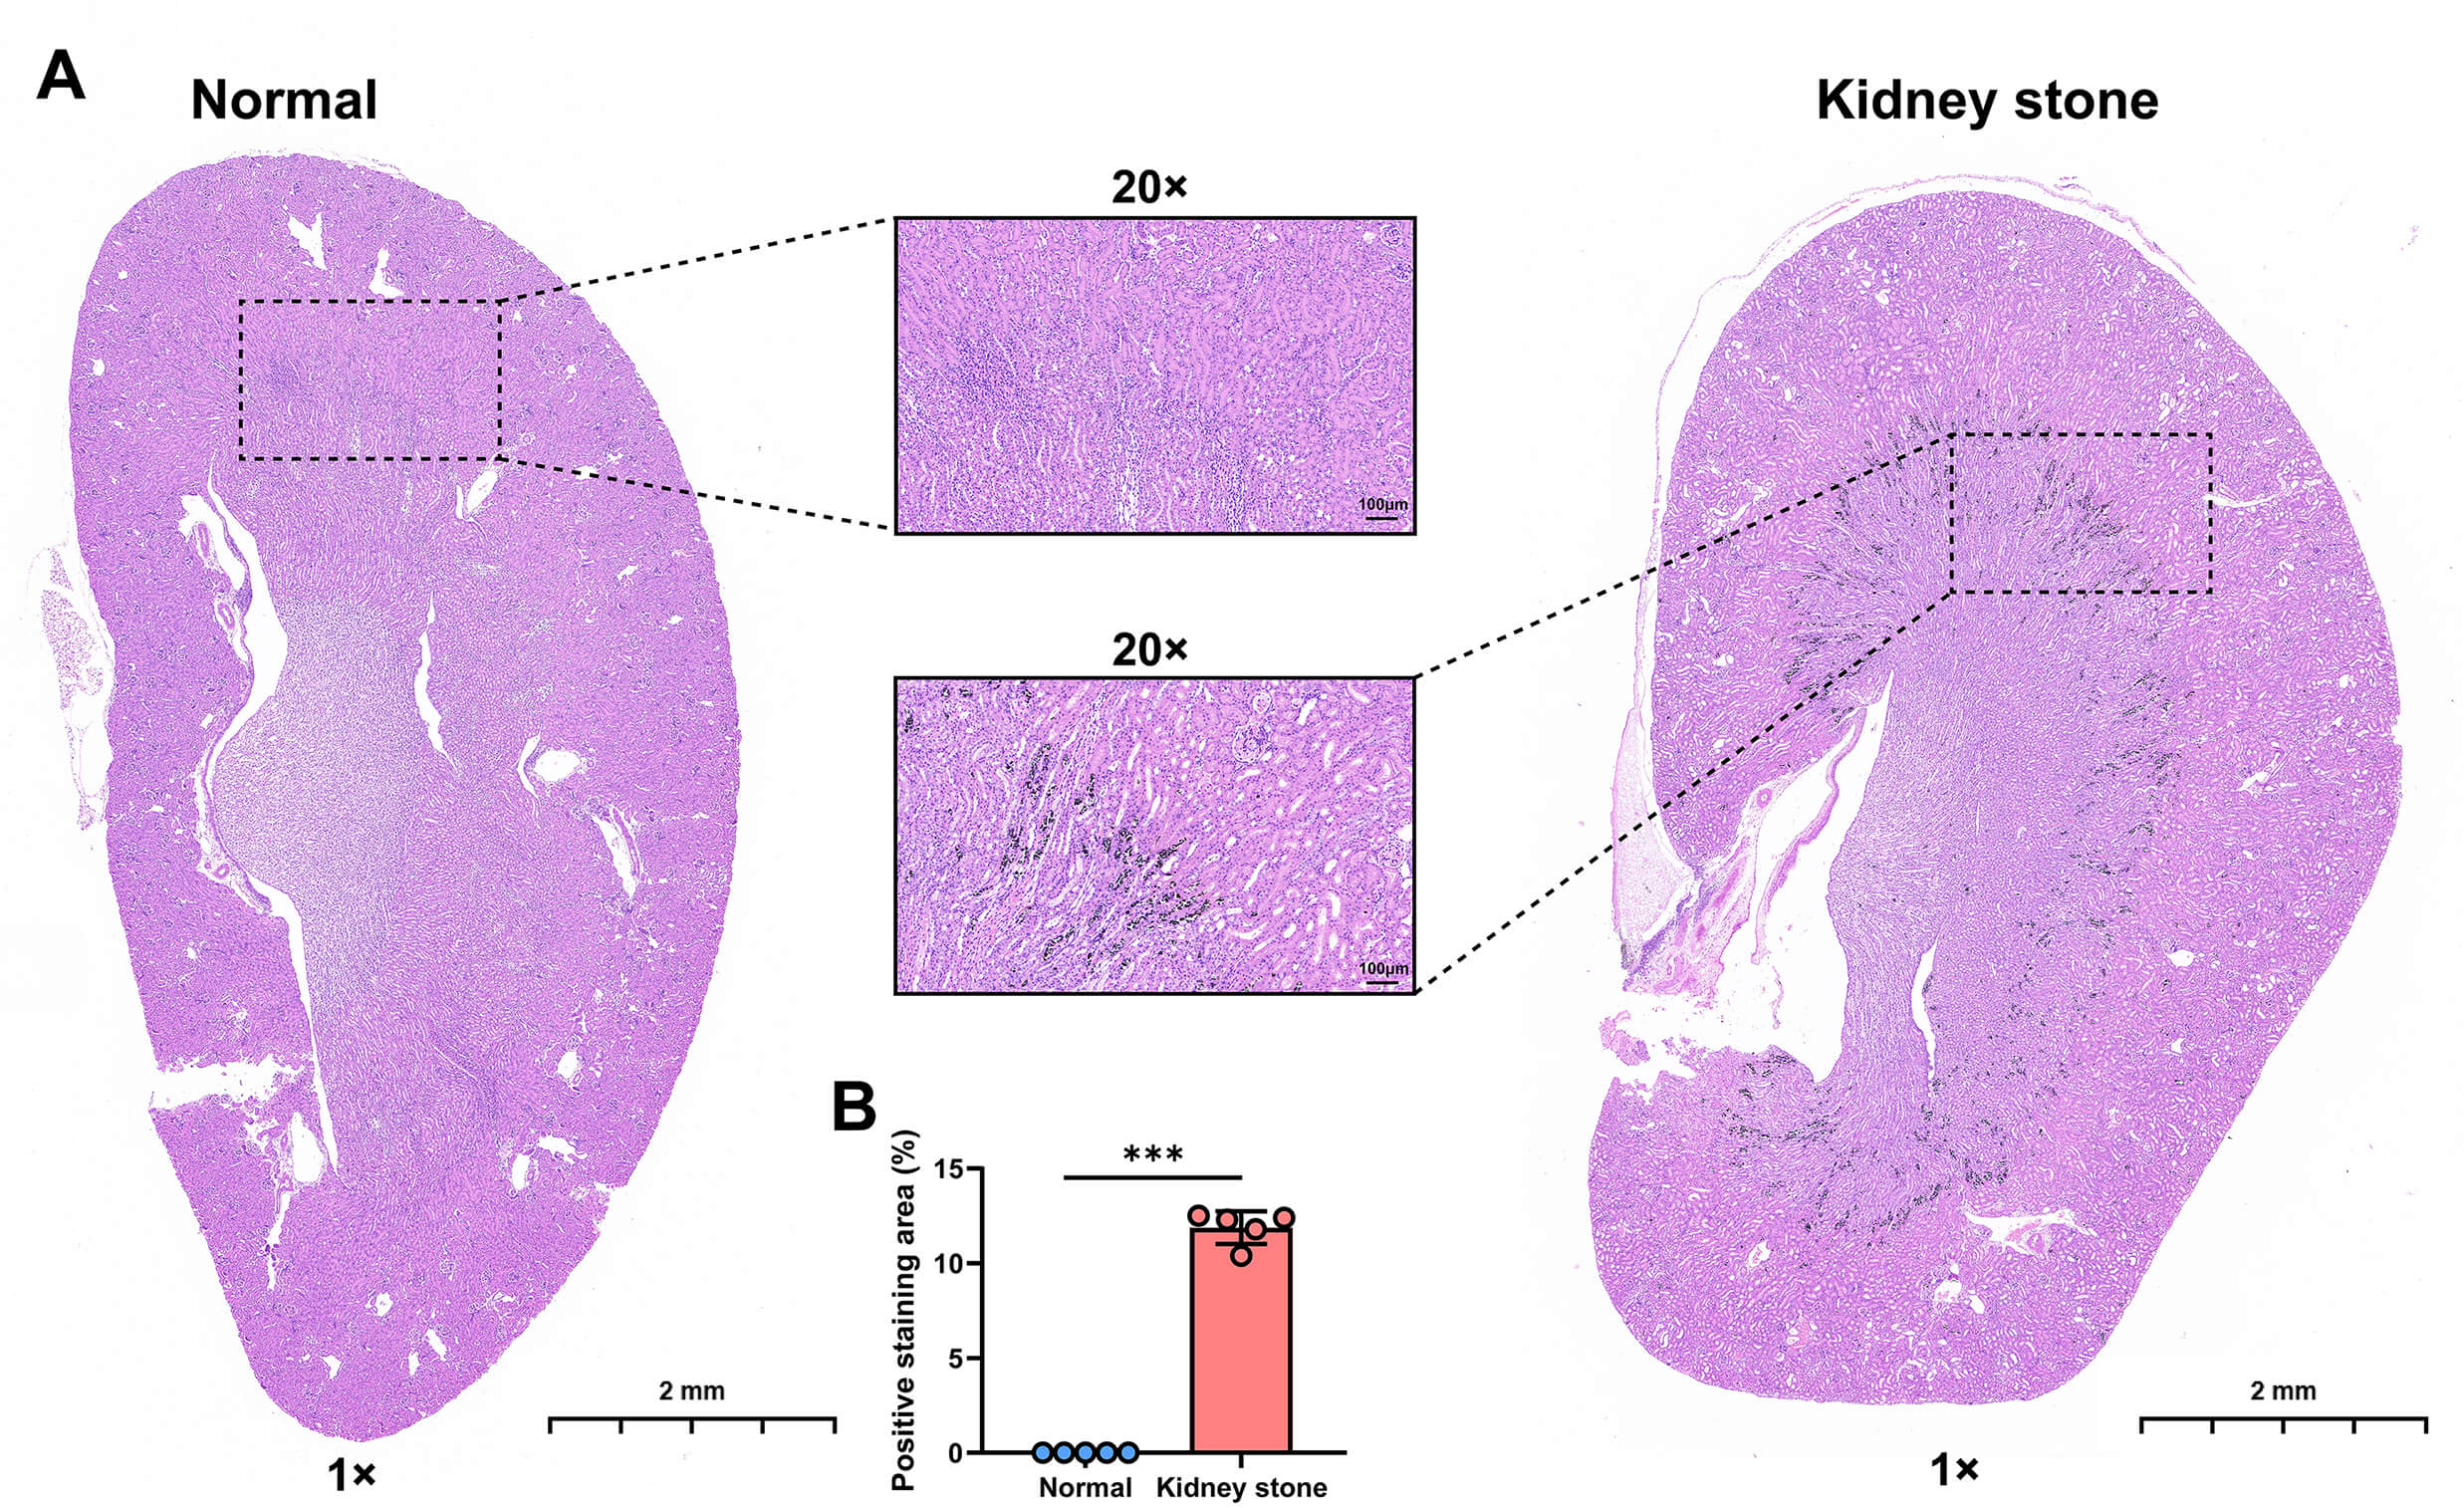 Fig. 1.
Von Kossa staining of mouse kidneys. (A) Representative images
of kidneys from the normal group and the kidney stone group. (B) Quantitative bar
charts showing the percentage of positive staining area in kidneys from the
normal group and the kidney stone group. Individual data points are shown as
dots. Scale bar: 2 mm, Scale bar: 100 µm. Statistical significance was determined by
independent samples t-test: ***p
Transcriptome sequencing analysis was conducted on both human (Fig. 2A) and mouse (Fig. 2B) samples. According to the screening criteria, we identified a total of 132 DEGs (91 up-regulated and 41 down-regulated) in human samples and 1123 DEGs (901 up-regulated and 222 down-regulated) in mouse samples (Supplementary Table 3). Finally, 8 DEGs were found to be shared between human and mouse samples, namely COL3A1 , TYROBP, MMP2, BASP1, COL5A1, ITGAX, C1QC, and S100A8, all of which were upregulated in both the mouse stone group and human patient stone group (Fig. 2C).
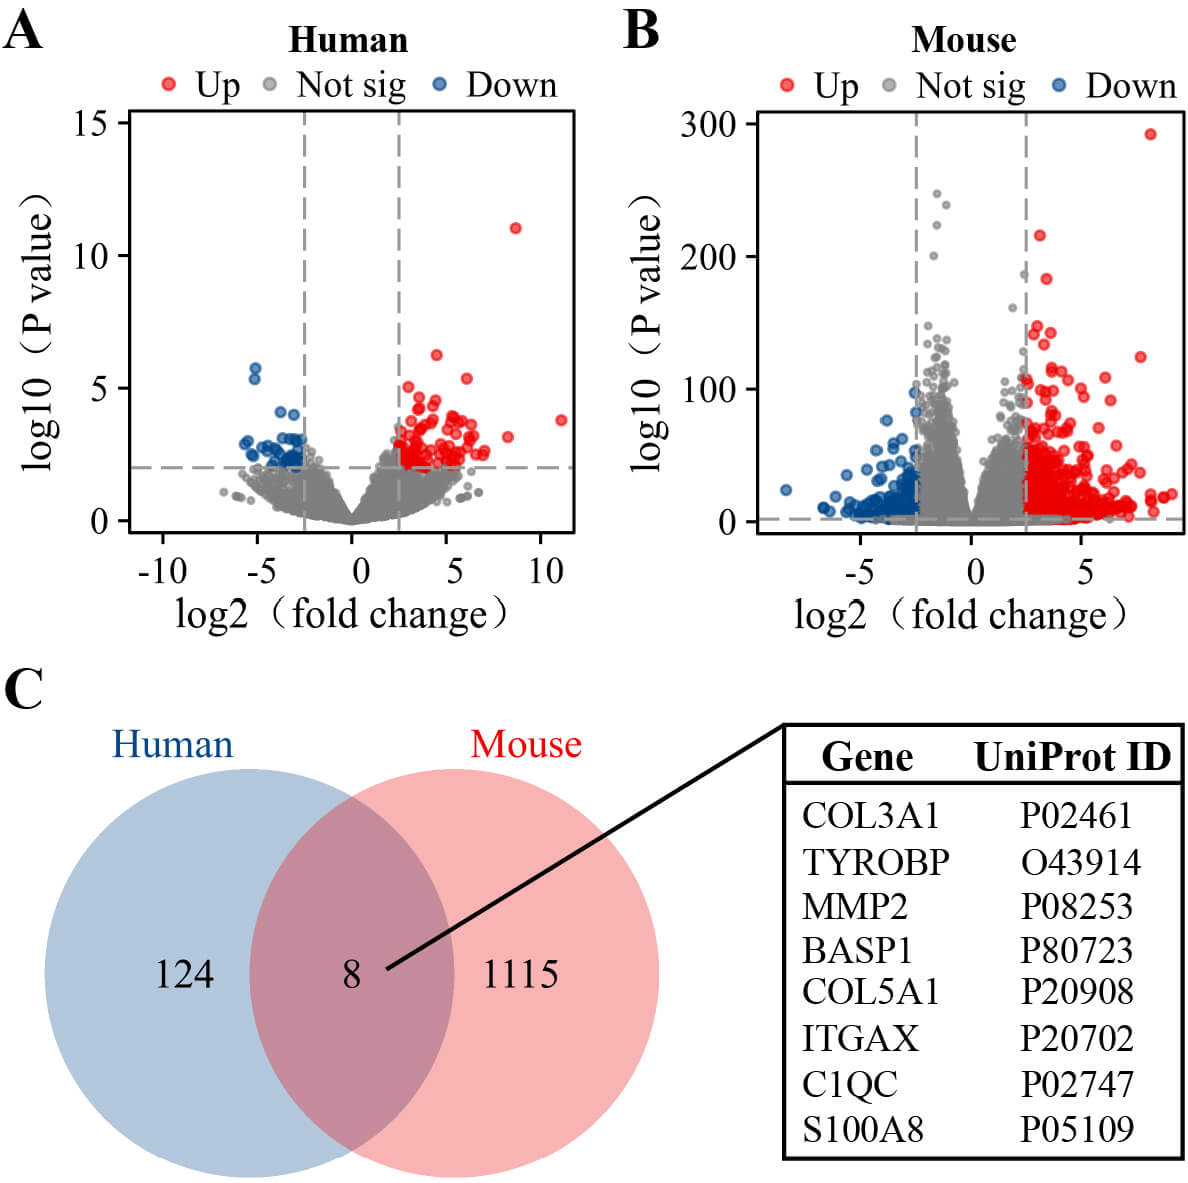 Fig. 2.
Screening of DEGs. (A) Volcano plot of DEGs between human kidney stone samples and normal kidney samples (n = 3 per group). (B) Volcano plot of DEGs between mouse kidney stone samples and the control kidney samples (n = 5 per group). (C) Venn diagram of DEGs between human and mouse. Red dots indicate upregulated genes, while blue dots represent downregulated genes. DEGs, differentially expressed genes.
To validate the expression differences of the eight candidate genes at the transcriptional level, qRT-PCR was performed on an independent set of mouse tissue samples (n = 5 per group). The results showed that the relative mRNA expression levels of COL3A1 and C1QC were significantly increased in the stone group. The expression trends of these genes were consistent with the transcriptome sequencing data, confirming their stable upregulation at the transcriptional level in the kidney stone model (Fig. 3). No statistically significant differences were observed in the expression of the other six genes between the normal and kidney stone groups.
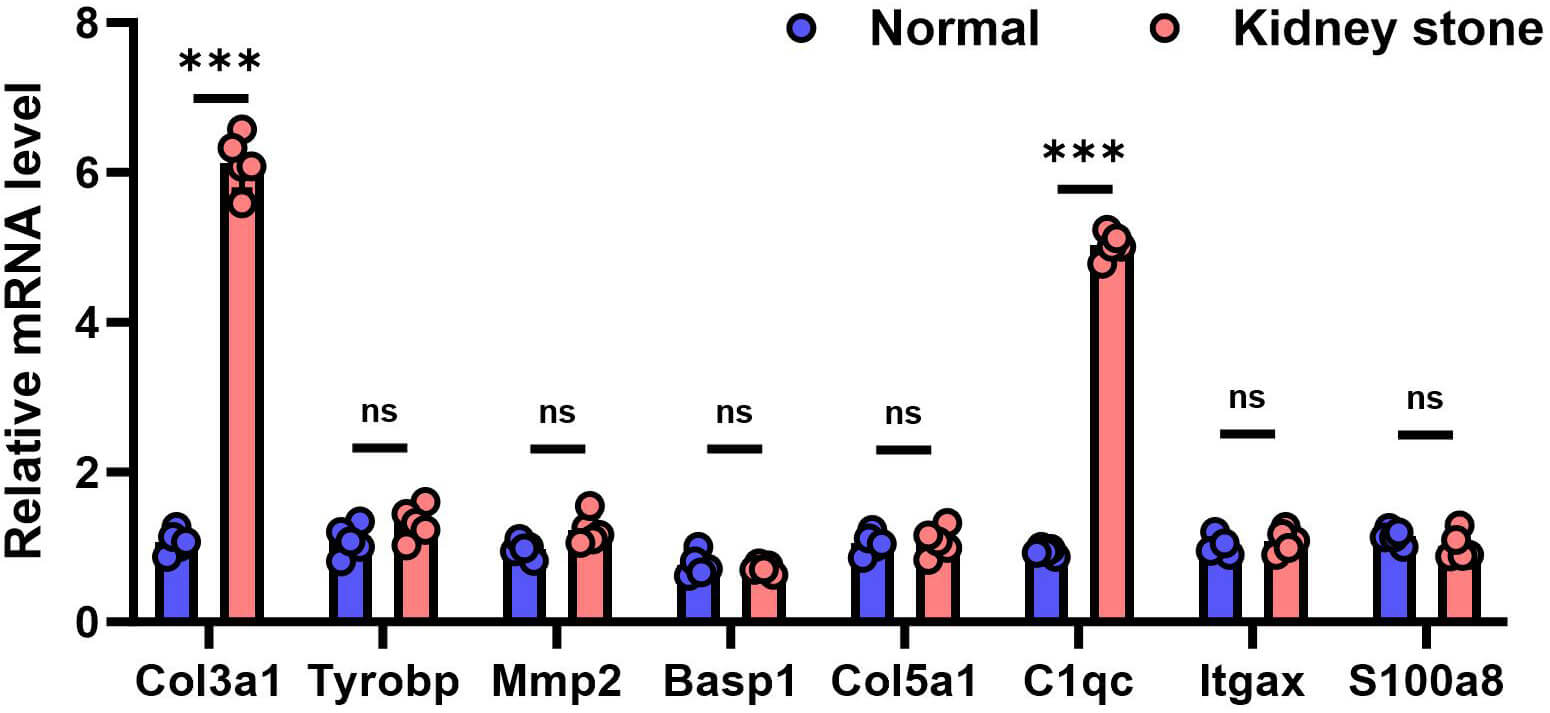 Fig. 3.
qRT-PCR validation of the relative mRNA expression of candidate
genes in the mouse kidney samples. ***Data are presented as mean
To further validate the gene expression at the translational level, Western blot analysis revealed a significant upregulation of COL3A1 protein expression in the stone group compared to the control group, as illustrated in Fig. 4A, aligning with the mRNA expression trends and indicating consistent differential expression of COL3A1 from transcription to translation. In contrast, the protein expression level of C1QC showed no statistically significant difference between the normal and kidney stone groups (Fig. 4B).
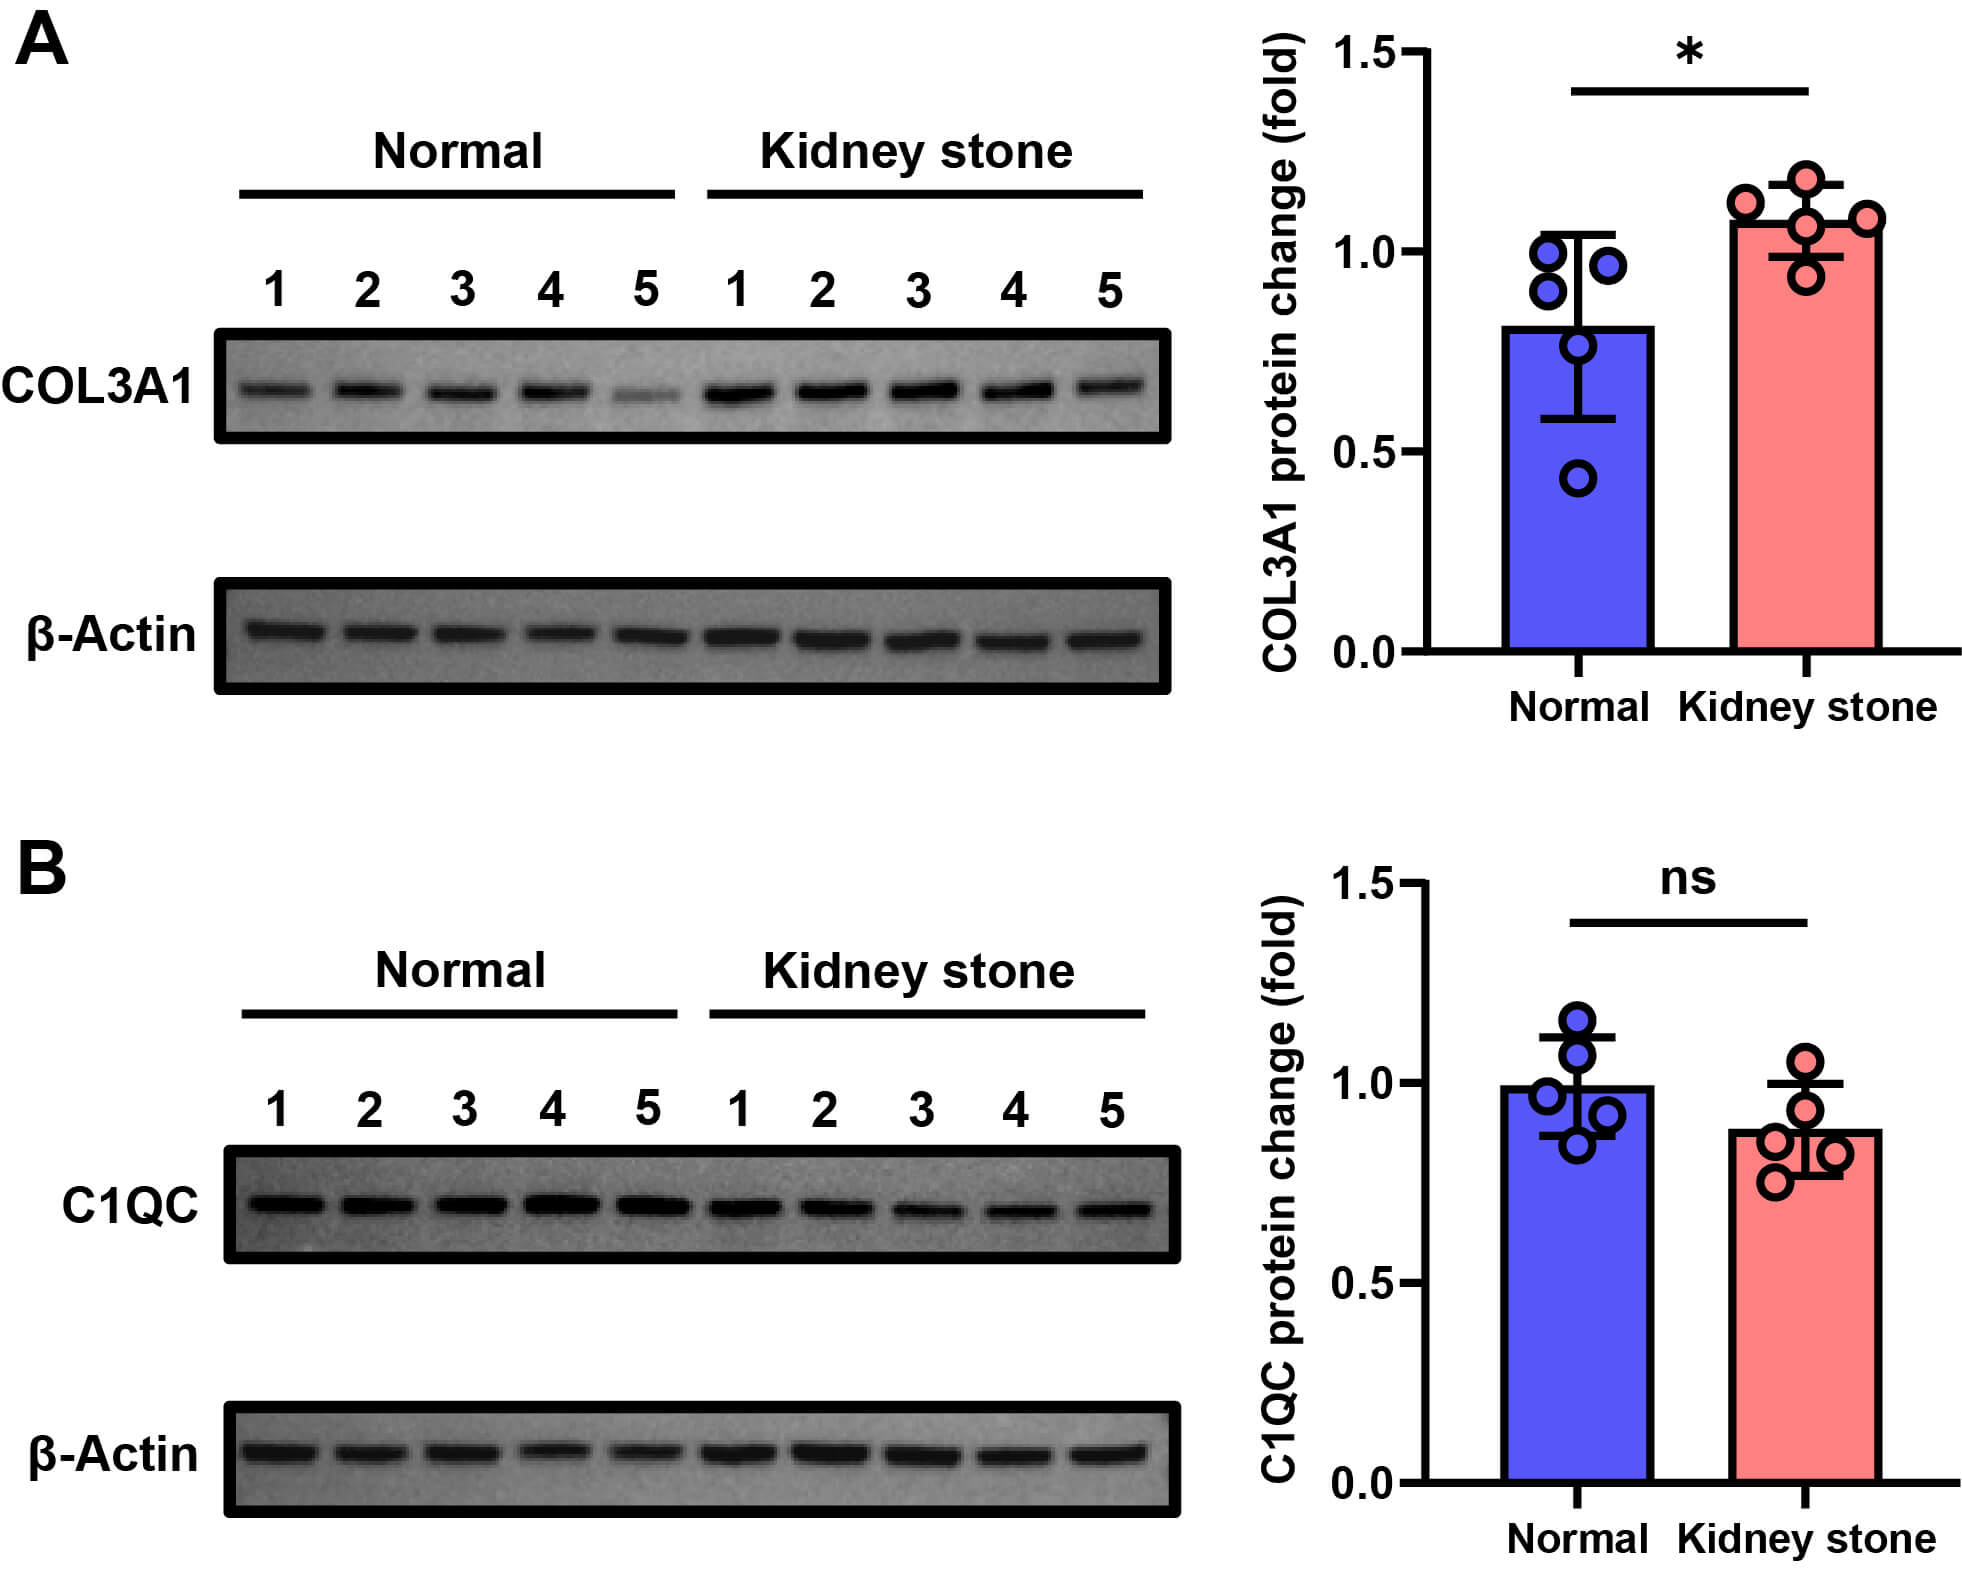 Fig. 4.
Protein Expression of COL3A1 and C1QC in normal and kidney stone
groups (n = 5 per group). (A) Western blot analysis of COL3A1 protein expression
in mouse kidneys. (B) Western blot analysis of C1QC protein expression in mouse
kidneys. Individual data points are shown as dots. Statistical significance was
determined by independent samples t-test: *p
Immunofluorescence results shown in Fig. 5 revealed that compared to the normal group, the fluorescence intensity of COL3A1 was significantly enhanced in the renal tissue of the stone group, with clear regional enrichment. This enrichment was primarily concentrated in the interstitial regions of the renal medulla where stone deposition occurred. This finding further supports the upregulation of COL3A1 expression in kidney tissue associated with stone formation.
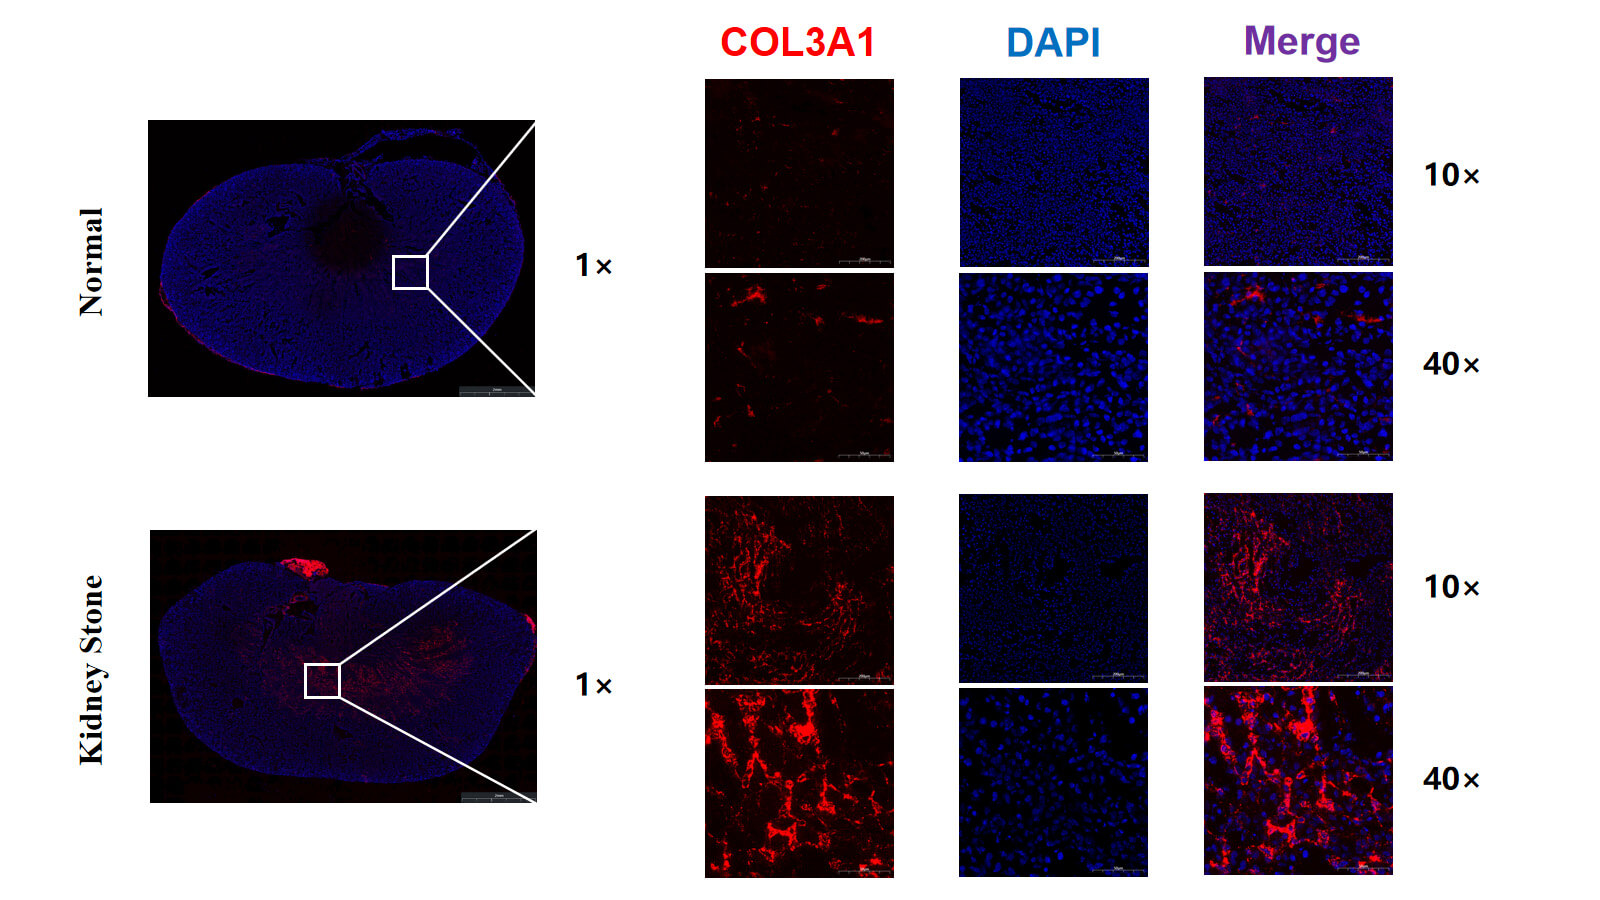 Fig. 5.
Immunofluorescence staining of COL3A1 in mouse kidneys.
High-resolution representative images showing COL3A1 (red) and DAPI (blue)
staining in control and stone group. DAPI, 4′,6-Diamidino-2-phenylindole.
Scale bar: 2 mm (1
Functional enrichment analysis was conducted on the DEGs identified in mouse and clinical patient renal tissues. As shown in Fig. 6, a high degree of consistency in functional enrichment pattern was observed between the two datasets. GO analysis revealed significant enrichment at the BP level, with terms related to immune response-activating signaling pathways, leukocyte-mediated immunity, and activation of immune responses. At the CC level, DEGs were predominantly localized to structures such as the external side of the plasma membrane, collagen-containing extracellular matrix, and blood microparticles. In terms of MF, the DEGs were enriched in platelet-derived growth factor binding. KEGG pathway analysis indicated that in the animal model, DEGs were significantly enriched in pathways such as complement and coagulation cascades, IL-17 signaling, and TNF signaling. In human samples, significant enrichment was found in pathways related to graft-versus-host disease, antigen processing and presentation, and phagosome. The core functions of the cross-species shared DEGs in kidney stone formation primarily involve two key processes: structural remodeling of the renal extracellular matrix and activation of local immune responses.
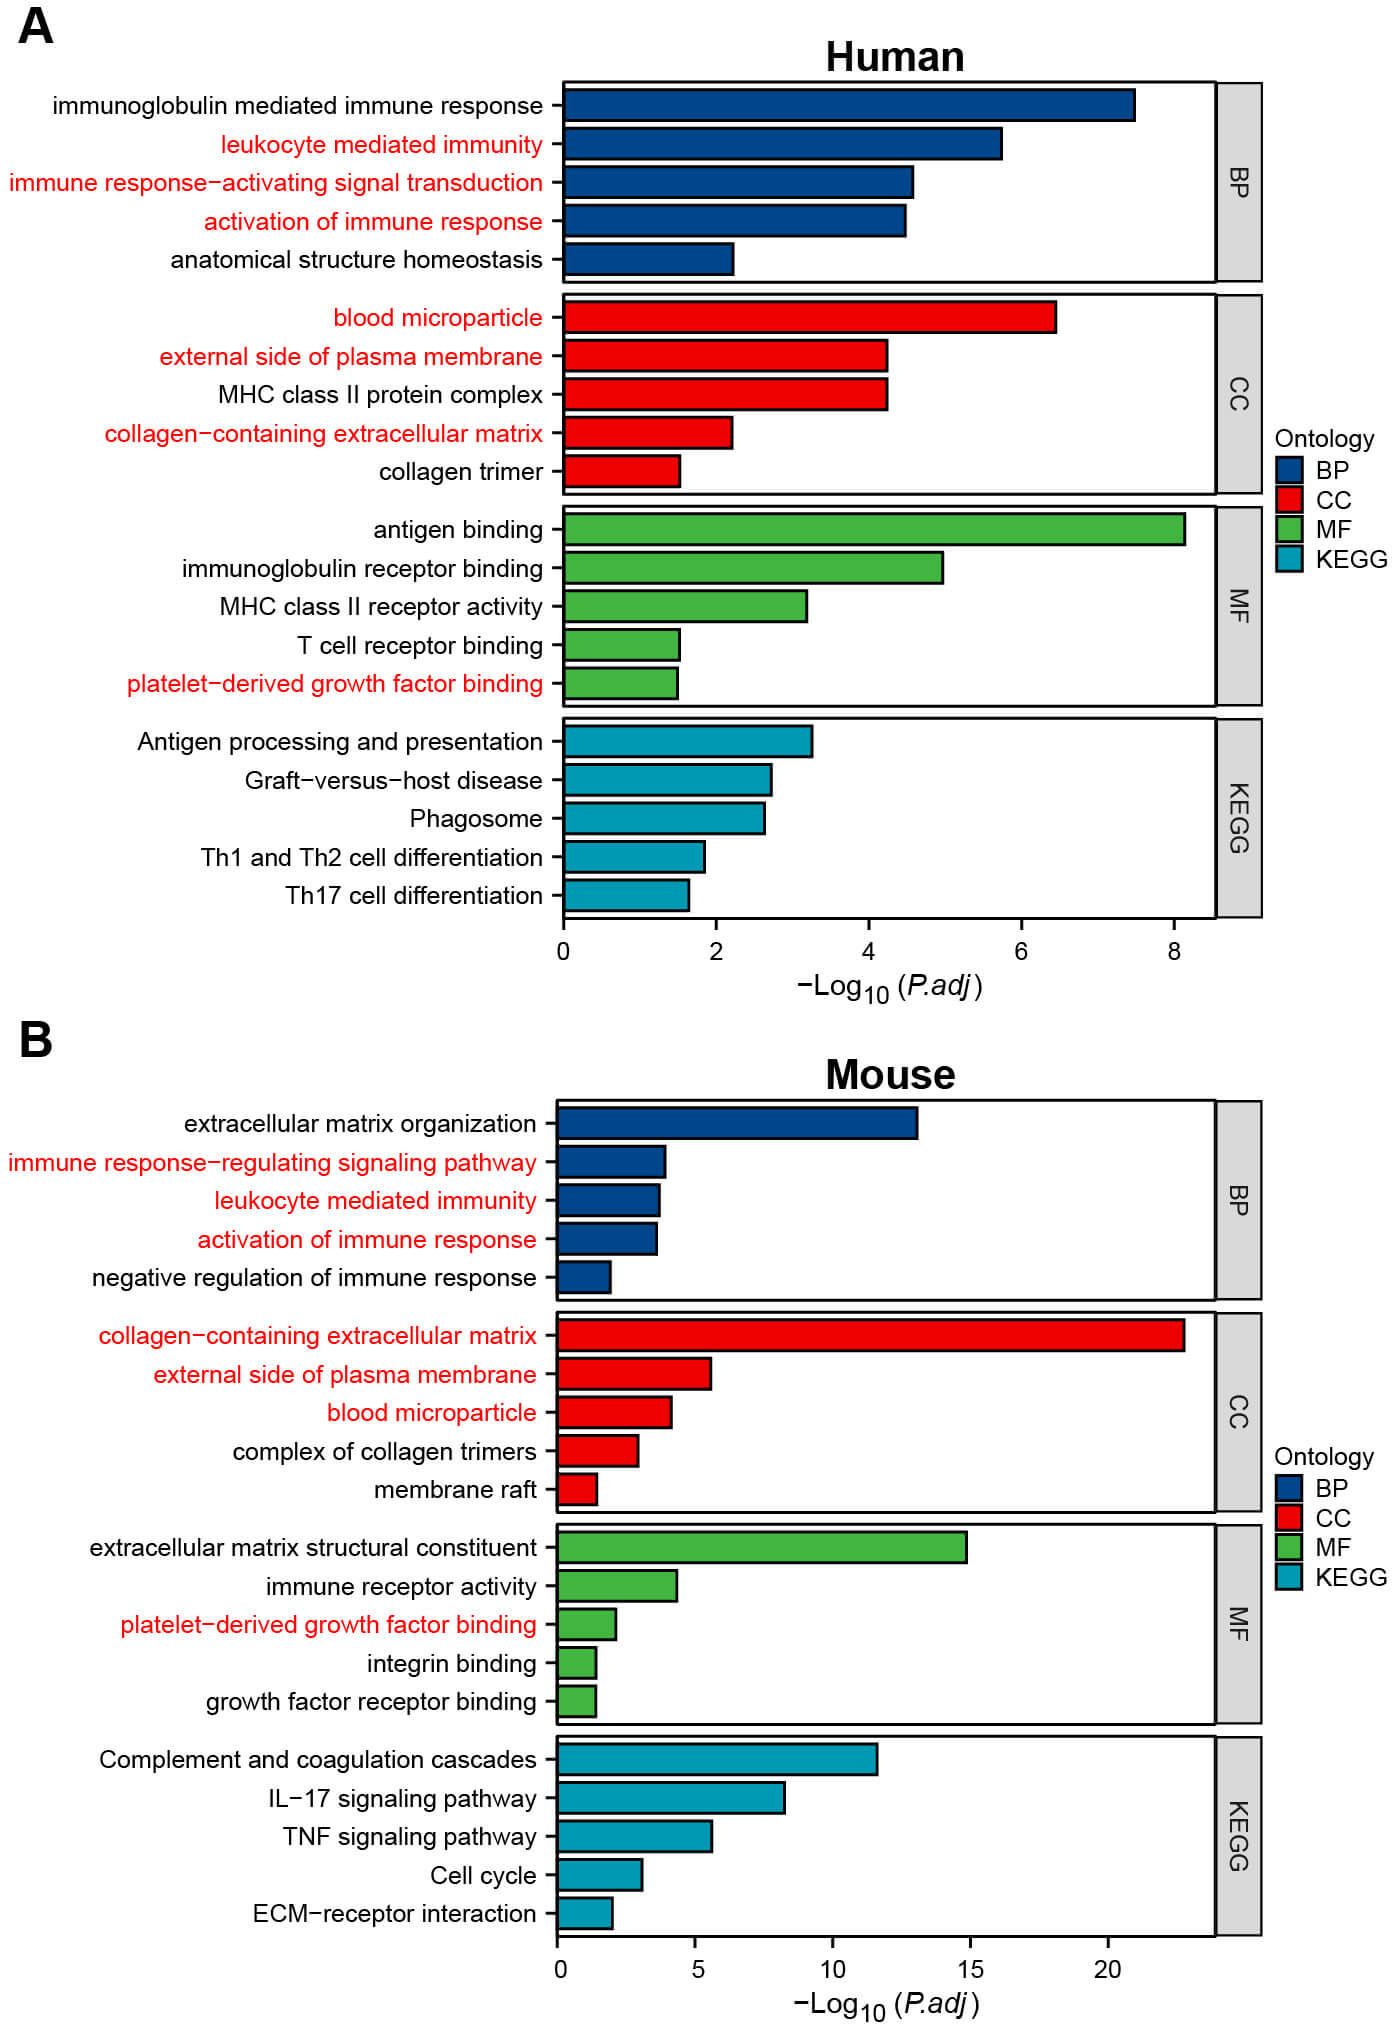 Fig. 6.
GO and KEGG enrichment analyses of DEGs. (A) GO and KEGG enrichment analyses of DEGs in human. (B) GO and KEGG enrichment analyses of DEGs in mouse. GO, gene ontology; KEGG, kyoto encyclopedia of genes and genomes. The pathway marked in red is common to both humans and mouse.
To systematically investigate the key regulatory genes involved in kidney stone formation, this study integrated transcriptomic data from clinical samples and animal models. Multi-level experimental validation confirmed that COL3A1 is consistently upregulated at both the transcriptional and translational levels and exhibits specific enrichment in the renal interstitial region. This suggests that COL3A1 plays a central and active role in the pathological process of kidney stone formation. Functional enrichment analysis further supported the hypothesis that COL3A1 may contribute to the initiation and progression of kidney stones by mediating pathological extracellular matrix remodeling and modulating the local immune-inflammatory microenvironment.
Of the eight cross-species upregulated DEGs, only COL3A1 and C1QC showed significant upregulation at the mRNA level in our qRT-PCR validation, while TYROBP, MMP2, BASP1, COL5A1, ITGAX, and S100A8 did not reach statistical significance. Several factors may explain this discrepancy: (i) Species differences: The glyoxylate-induced mouse model primarily recapitulates crystal deposition and acute inflammation, but may not fully mimic the chronic ECM remodeling and fibrosis present in human disease; (ii) Temporal dynamics: Some genes (e.g., MMP2) may exhibit time-dependent expression patterns, with peak expression at later stages than our 7-day timepoint; (iii) Regional heterogeneity: Transcriptome sequencing used whole kidney tissue, while validation sampling may have introduced spatial variation; (iv) Technical sensitivity: qRT-PCR primer design and detection limits may differ from RNA-seq. Importantly, COL3A1 showed consistent upregulation across sequencing, qRT-PCR, and Western blot, with significant protein-level elevation, strongly supporting its role as a robust, reproducible driver gene. The lack of validation for other genes does not necessarily indicate RNA-seq artifacts, but rather highlights the importance of multi-level validation and the need for time-course studies to capture dynamic expression changes.
Collagen is widely distributed across various organs and tissues in the human body, constituting approximately 30% of total body protein, and is essential for maintaining tissue scaffold structure and homeostasis [20]. Type III collagen, encoded by COL3A1, is a key fibrillar collagen involved in fibrosis and wound repair [21, 22]. However, its role in kidney stone formation has received limited attention. Recent studies suggest that kidney stone formation is associated with extracellular matrix remodeling [5]. As a major structural component of the extracellular matrix, collagen not only regulates matrix remodeling but also plays a key role in the mineralization and expansion of Randall’s plaques. Our findings suggest that COL3A1 is significantly upregulated in stone-bearing kidneys, and GO analysis reveals significant enrichment in terms related to collagen-containing extracellular matrices. These results strongly suggest that the upregulation of COL3A1 directly drives structural remodeling of the renal interstitial extracellular matrix, facilitating the ectopic deposition of calcium phosphate crystals, which leads to the formation of Randall’s plaques. This mechanism parallels collagen-mediated plaque mineralization in vascular calcification, further supporting the notion that kidney stone formation and vascular calcification share common pathways of matrix remodeling and mineralization.
As a recognition component of the complement C1q complex, C1QC plays a key role in innate immunity and immune complex clearance [23]. Notably, C1QC deficiency has been shown to be associated with mesangial proliferative glomerulonephritis, highlighting its importance in maintaining glomerular homeostasis [24]. In contrast, studies have reported upregulated C1QC expression in diabetic kidney injury, indicating its involvement in chronic inflammatory kidney diseases [25]. In this study, C1QC mRNA expression was upregulated in the kidney stone model, but no significant difference in protein levels was observed between groups. This inconsistency may reflect post-transcriptional regulation, protein secretion into urine, or the early stage of this model. Our findings suggest that complement activation may play a role in kidney stone-related inflammation, and C1QC upregulation may represent an early immune response to crystal deposition. However, the exact role of C1QC in the pathogenesis of kidney stones (protective or pathogenic) requires further investigation using C1QC knockout models or functional inhibition studies.
Functional enrichment analysis also highlighted another critical pathological aspect: the persistent activation of immune-inflammatory responses. DEGs were significantly enriched in BP such as leukocyte-mediated immunity and activation of immune responses, as well as inflammation-related pathways, including the IL-17 signaling pathway and complement and coagulation cascades. These findings not only confirm at the molecular level that chronic inflammation is a hallmark of kidney stone formation but also support the view that kidney stone formation is not solely a physicochemical process but an active, complex pathology involving immune inflammation. The identified gene set likely forms a synergistic inflammatory regulatory network. For instance, C1QC, a component of complement C1q, plays a pivotal role in immune regulation, and its upregulation may reflect renal tissue’s immune response to crystal deposition and chronic inflammatory injury. Although COL3A1 is not traditionally considered an inflammatory factor, it may indirectly influence immune cell infiltration, polarization, and function by altering matrix stiffness and integrin signaling. This leads to the hypothesis that COL3A1 serves as a key hub linking extracellular matrix remodeling and immune-inflammatory responses. By modifying the physical and biochemical environment of the renal interstitium, COL3A1 could create conditions that promote the recruitment and sustained activation of inflammatory cells. In turn, chronic inflammation exacerbates tissue damage and extracellular matrix disruption, creating a vicious cycle that drives stone progression.
This study identified COL3A1 as a consistently upregulated key gene in kidney stone formation, offering new insights into the pathogenesis of idiopathic calcium stones. However, there are limitations. The clinical sample size was relatively small, and while the control group used normal tissue samples confirmed by pathology to be tumor-free, potential influences from the tumor microenvironment cannot be entirely excluded. Additionally, the study focused primarily on descriptive and correlative analyses of gene expression, and the causal relationship between COL3A1 and kidney stone formation remains unclarified in both in vitro and in vivo models. Future research should expand the sample size and utilize gene knockout mice to directly validate COL3A1’s role in crystal deposition, inflammatory infiltration, and fibrosis. Furthermore, investigating its downstream signaling mechanisms will be essential to provide a robust experimental foundation for developing novel kidney stone prevention strategies, particularly those targeting extracellular matrix regulation or immune microenvironment modulation.
Our study identified COL3A1 as a key gene in kidney stone formation, which may promote stone development through extracellular matrix remodeling and immune-inflammatory regulation, providing a novel molecular target for investigating the pathogenesis of kidney stones.
The datasets analyzed in this study can be obtained from the corresponding author upon reasonable request.
HJ: data collection, analysis and writing; HJ, JJ and YJJ: resources, data curation, writing — review & editing; HJ and AYC: interpretation of the results and revision; WPM, MC and YZ: interpretation, revision, review, and final approval. All authors contributed to editorial changes in the manuscript. All authors read and approved the final manuscript. All authors have participated sufficiently in the work and agreed to be accountable for all aspects of the work.
The experiment was approved by the ethics committee of Affiliated Zhongda Hospital of Southeast University (ZDYJLY(2017)-49). The study was carried out in accordance with the guidelines of the Declaration of Helsinki.All patients provided written informed consent. The animal experiment was approved by the Animal Experimental Ethical Inspection Form of Southeast University (20250909003) and were conducted in accordance with the 3Rs and ARRIVE principles.
Not applicable.
This work was supported by Jiangsu Provincial Key Discipline and Laboratory Construction Funds of Urology (2023YXZDXK02) and National clinical key discipline construction funds (CZXM-ZK-47).
The authors declare no conflicts of interest.
Supplementary material associated with this article can be found, in the online version, at https://doi.org/10.31083/FBL51232.
References
Publisher’s Note: IMR Press stays neutral with regard to jurisdictional claims in published maps and institutional affiliations.