


 , Francisco Israel Torres-Rojas 1, Gabriela Elizabeth Campos-Viguri 2, Adán Arizmendi-Izazaga 3, Julio Ortiz-Ortiz 3,4, Roberto Dircio-Maldonado 5, Judit Alarcón-Millán 4,5,6, Fredy David Bartolo-Ángel 3,4,5, Alejandro Fiallo-Rodríguez 3,4,5, Hilda Jiménez-Wences 3,4,5,*
 , Eric Genaro Salmerón-Bárcenas 7,*
1 Laboratory of Molecular Biomedicine, Faculty of chemical and Biological Sciences, Autonomous University of Guerrero, 39090 Chilpancingo, Guerrero, Mexico
2 Center for Research in Applied Science and Advanced Technology, Morelos Unit, National Polytechnic Institute, 62790 Atlacholoaya, Morelos, Mexico
3 Laboratory of Research in Metabolism and Cancer, Faculty of Chemical-Biological Sciences, Autonomous University of Guerrero, 39090 Chilpancingo, Guerrero, Mexico
4 Laboratory of Research in Biomolecules, Faculty of Chemical-Biological Sciences, Autonomous University of Guerrero, 39090 Chilpancingo, Guerrero, Mexico
5 Laboratory of Research in Infectious Diseases and Cancer, Faculty of Chemical-Biological Sciences, Autonomous University of Guerrero, 39090 Chilpancingo, Guerrero, Mexico
6 Bacteriology Research Laboratory, Faculty of Chemical-Biological Sciences, Autonomous University of Guerrero, 39090 Chilpancingo, Guerrero, Mexico
7 Department of Molecular Biomedicine, Center for Research and Advanced Studies, 07360 Mexico City, Mexico
Abstract
Cervical cancer (CC) remains a significant threat to global public health, with high incidence and mortality rates. Understanding the molecular mechanisms governing CC progression is critical for developing novel diagnostic and therapeutic strategies. microRNAs (miRNAs) have emerged as important regulators in cancer biology. This study aimed to identify and characterize a miRNA involved in CC development to assess and its potential as a diagnostic and prognostic biomarker through integrative bioinformatic and experimental analyses.
Differentially expressed miRNAs (DEmiRNAs) were identified in CC using microarrays, after which miR-19a-3p expression trends were validated in multiple publicly available datasets. miR-19a-3p target genes were identified using the miRNAs Data Base (miRDB) and TargetScan databases. Pathway and biological process analyses were conducted with the Enrichr database. Target prediction and correlation analyses were used to explore potential interactions between miR-19a-3p and brain derived neurotrophic factor-antisense (BDNF-AS). Survival and diagnostic value were evaluated using Kaplan-Meier and receiver operating characteristic (ROC) curves.
In total, 24 DEmiRNAs were identified in CC, and miR-19a-3p expression patterns were validated in two independent datasets. This miRNA was predicted to regulate genes involved in transcription. The long non-coding RNA (lncRNA) BDNF-AS was identified as a potential target of miR-19a-3p. In ROC curve analyses, both miR-19a-3p and BDNF-AS showed potential diagnostic value. Functional enrichment implicated pathways involved in tumor progression. Low BDNF-AS expression was associated with poorer overall survival, consistent with prognostic potential.
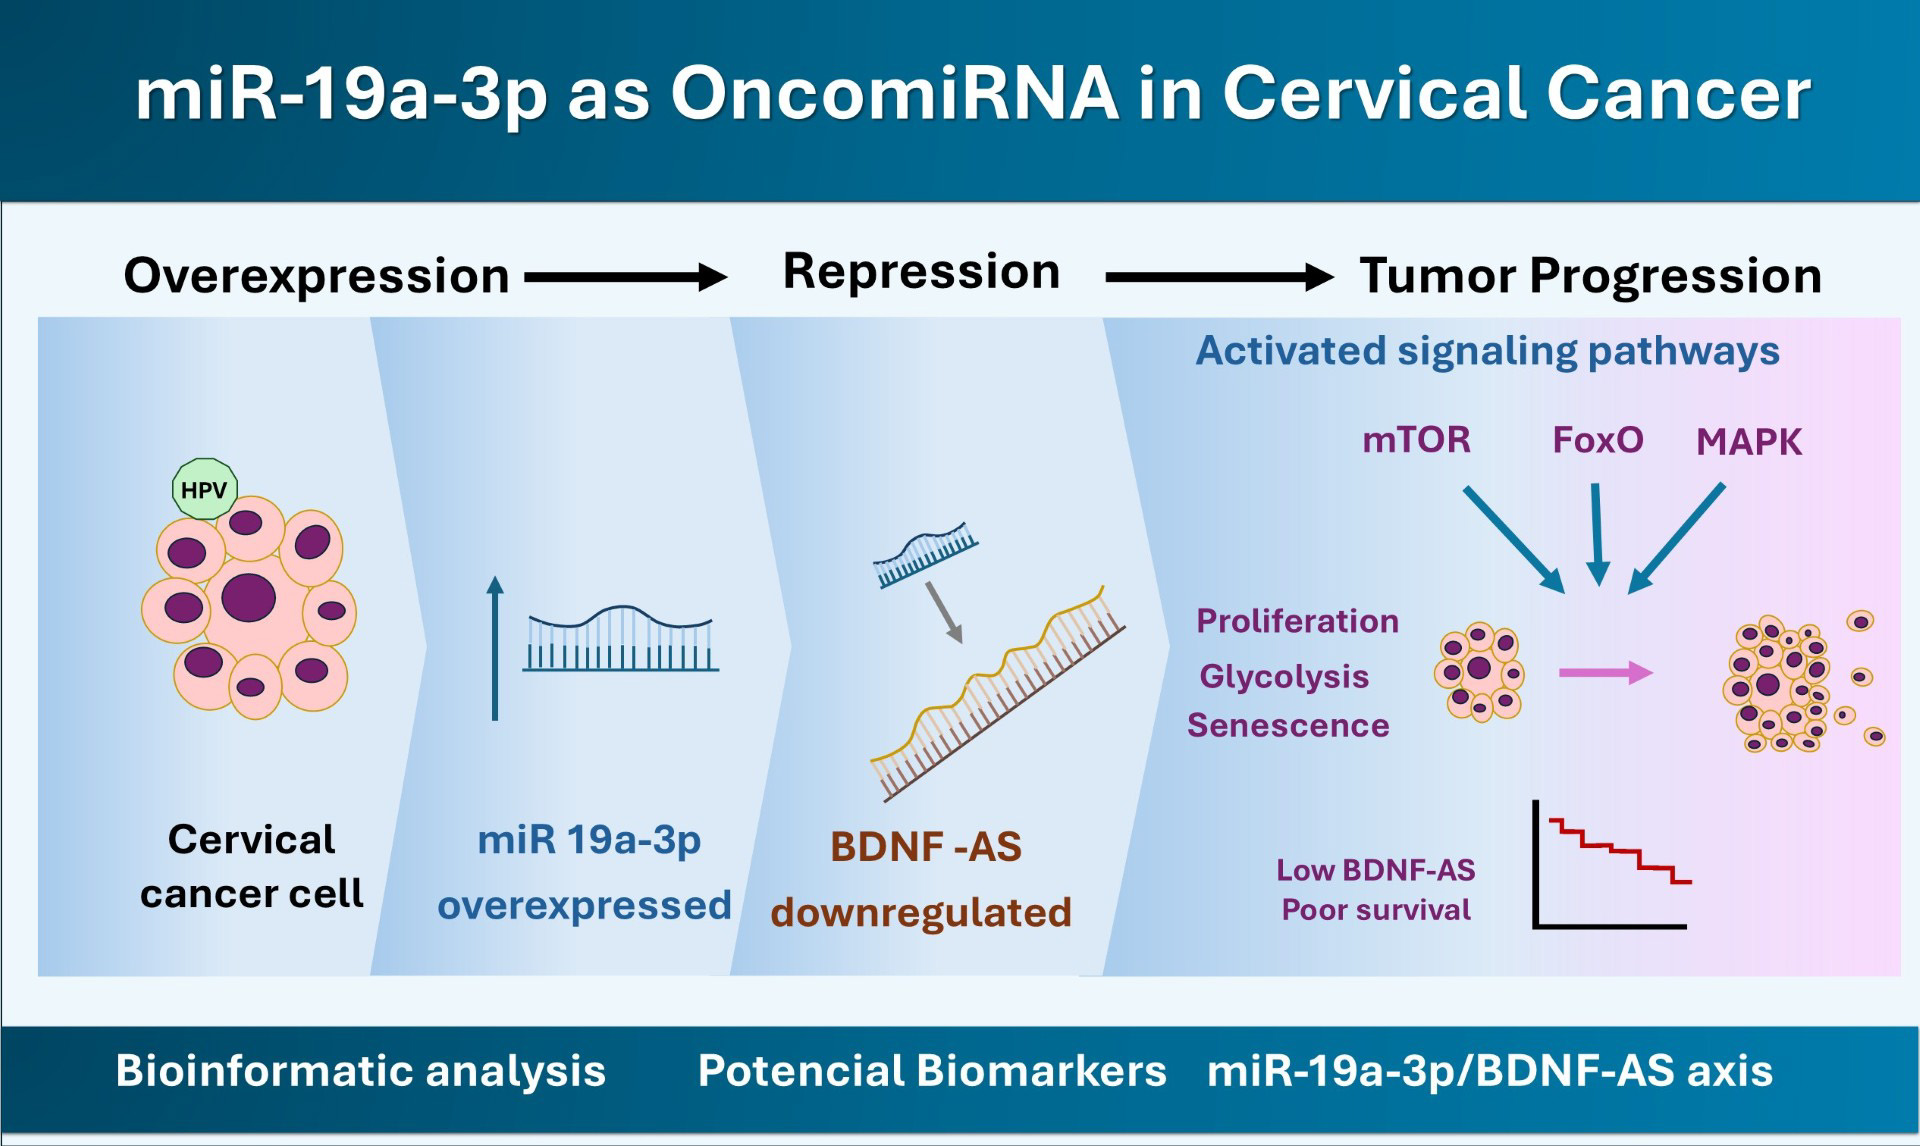
Together, the results of these bioinformatic analyses suggest that miR-19a-3p may act as an oncomiR in CC, potentially contributing to its pathogenesis through interactions with the BDNF-AS lncRNA.
Graphical Abstract
Keywords
- uterine cervical neoplasms
- RNA, untranslated
- miR-19a-3p
- gene expression
- BDNF-AS
- biomarkers
- bioinformatic analysis
Cancer is a persistent public health problem, with an estimated 20.0 million new cases and 9.7 million cancer deaths worldwide in 2022. Cervical Cancer (CC) is the cancer with the 4th highest incidence (6.8%) and mortality (8.1%) among women globally. According to Global Cancer Observatory: CANCER TODAY (GLOBOCAN), an estimated 661,021 new CC cases and 348,189 CC-associated deaths occurred in 2022. CC also ranks as the 2nd most common and deadliest cancer in countries with a low/medium Human Development Index [1]. Similarly, CC ranked 3rd in incidence and mortality among cancers of the female genital system in 2024 in the USA [2]. There is thus a pressing need to clarify the molecular biology of CC to develop new diagnostic, prognostic, and therapeutic biomarkers suitable for combatting this deadly malignancy.
Infection by high-risk human papillomavirus (HR-HPV) strains, including genotypes 16 and 18, is necessary but not sufficient for CC development. HR-HPV 16 and 18 promote CC development through their E6 and E7 oncoproteins [3]. In addition, several genetic and epigenetic factors associated with CC have been identified, including variants at the human leukocyte antigen (HLA) locus on chromosome 6p21.3 and the aberrant methylation of promoters upstream of tumor suppressor genes and non-coding RNAs (ncRNAs) [4, 5].
In general, ncRNAs are a class of RNAs that are not translated into proteins, including lncRNAs, circular RNAs (circRNAs), heterogeneous nuclear RNAs, PIWI-interacting RNAs (piRNAs), ribosomal RNAs, small nuclear RNAs, small nucleolar RNAs, transfer RNAs, and microRNAs (miRNAs) [6]. miRNAs are small ncRNA molecules of ~22 nucleotides that bind to seed sequences in the 3′ untranslated region (UTR), 5′ UTR, or coding regions of target mRNAs, inhibiting gene expression at the post-transcriptional level [7]. Moreover, miRNAs can act as molecular sponges, also known as competing endogenous RNAs or ceRNAs, and deregulate the expression of other ncRNAs, such as lncRNAs and circRNAs, thereby affecting key cellular processes [8, 9, 10]. Through these mechanisms, miRNAs regulate biological processes, including cell differentiation, angiogenesis, migration, and apoptosis [11]. Alterations in the expression of miRNAs are a common molecular event in the biology of multiple diseases, including neurodevelopmental conditions, autoimmunity, and cancer [11, 12]. Therefore, the aim of the present study was to identify potential oncomiRNAs and explore their roles in CC through a bioinformatics approach.
miR-19a-3p acts as a tumor suppressor miRNA in several human cancers, including myeloma [13]. In contrast, miR-19a-3p acts as an oncogenic miRNA in hepatocellular carcinoma [14, 15] and lung adenocarcinoma [16]. Recently, this miRNA was reported to promote CC development by acting as a ceRNA, thereby downregulating the expression of the lncRNA RNA Binding Protein, MRNA Processing Factor-Antisense 1 (RBPMS-AS1). The direct interaction between miR-19a-3p and this lncRNA was validated through functional assays to explore its role in CC [17]. However, it remains possible that miR-19a-3p may promote CC development by downregulation other ncRNAs with tumor suppressor activity, underscoring the need to fully explore the target lncRNAs associated with this miRNA in the context of CC.
In this study, miR-19a-3p overexpression was detected in CC using the miR-TV and Gene Expression Omnibus (GEO) databases. The potential role of this miRNA in CC was then explored by identifying its potential target genes, as well as associated pathways and biological processes, with the miRDB, TargetScan, and Enrichr databases. Ensembl database analysis revealed three potential miR-19a-3p binding sites in the lncRNA BDNF-AS, and a negative correlation between miR-19a-3p and BDNF-AS in CC was noted in the ENCORI database, supporting the potential relevance of this lncRNA as a target of miR-19a-3p. We additionally analyzed BDNF-AS expression in CC with the OncoDB and GEO databases, confirming its downregulation in CC. Subsequent, Enrichr database pathway and biological process analysis of genes significantly correlated with BDNF-AS expression revealed pathways and biological processes regulated by this lncRNA in CC. Finally, Gene Set Enrichment Analysis (GSEA) was performed in patients with CC and high or low BDNF-AS expression.
The SiHa (HTB-35), HeLa (CCL-2) and C-33A (HTB-31TM) cell lines were purchased from American Type Culture Collection (ATCC, Manassas, VA, USA). SiHa and C-33A cells were cultured in high-glucose Dulbecco’s Modified Eagle’s Medium (DMEM) (11-965-092, GibcoTM; Carlsbad, CA, USA). HeLa cells were cultured in a 1:1 mixture of DMEM/F12 medium (DMEM/F12) (Cat: DFP44, Caisson Labs, Inc, Smithfield, UT, USA). All culture media were supplemented with 10% fetal bovine serum (FBS) (Cat: A5256701, GibcoTM, Grand Island, NE, USA), 100 U/mL penicillin, 100 µg/mL streptomycin and 0.25 µg/mL Amphotericin B. Cells were grown at 37 °C in a 5% CO2 incubator. All cell lines were authenticated by STR profiling and tested negative for mycoplasma.
Total RNA was isolated using TRIzol (Cat: 15596026, Invitrogen, Waltham, MA, USA) according to the manufacturer’s instructions. The concentration and purity of total RNA were determined with a NanoDropTM 2000/2000c UV-Vis spectrophotometer (Thermo Fisher Scientific, Waltham, MA, USA) based on the A260/A280 ratio. The integrity of total RNA was evaluated through 1% agarose gel electrophoresis. Total RNA was treated with RNase-free DNase I (Cat: EN0521, Thermo Scientific, Waltham, MA, USA). Finally, DNase-treated RNA was re-quantified using the NanoDropTM 2000/2000c UV-Vis spectrophotometer (Thermo Fisher Scientific, Waltham, MA, USA) based on the A260/A280 ratio, followed by storage at –80 °C prior to cDNA synthesis.
cDNA synthesis for miR-19a-3p was performed with the TaqMan® MicroRNA Reverse Transcription kit (Cat: 4366596, Applied Biosystems, Vilnius, Lithuania) according to the manufacturer’s instructions. The reaction mixture contained 5 ng of total RNA, RT Primer Pool (10 µM), dNTPs with dTTP (10 µM), MultiScribe Reverse Transcriptase (50 U/µL), RT Buffer (10X), RNase Inhibitor (20 U/µL) and Nuclease-free water. Thermocycler settings were as follows: 30 min at 16 °C, 30 min at 42 °C, and 5 min at 85 °C.
cDNA synthesis for BDNF-AS was conducted using SuperScript III reverse transcriptase (Cat: 18080-044, Thermo Fisher Scientific, Waltham, MA, USA) following the manufacturer’s instructions.
cDNAs concentrations were quantified using the NanoDropTM 2000/2000c UV-Vis spectrophotometer (Thermo Fisher Scientific, Waltham, MA, USA), followed by storage at –20 °C prior to downstream use.
miR-19a-3p levels were quantified with the hsa-miR-19a-3p
assay ID: 000395 (Cat: Assay ID: 000395, Applied Biosystems, Waltham, MA, USA)
and the TaqMan microRNA assay kit (Cat: 4427975, Applied Biosystems, Waltham, MA,
USA) using the ABI 7500 Real-Time PCR System (Applied Biosystems, Waltham, MA,
USA). The reaction mixture contained 1 µL of cDNA, TaqMan™
Small RNA Assay (20
BDNF-AS expression levels were analyzed by RT-qPCR in reactions
containing 200 ng of cDNA, primers at a final concentration of 1 µM,
Power SYBR® Green PCR Master Mix 2
The relative expression of miR-19a-3p and BDNF-AS was
determined using the 2-ΔΔCt method [18] with the
respective normalization to U6 and GAPDH as housekeeping controls. Two biological
replicates were included in these analyses, each with two technical replicates.
miR-19a-3p and BDNF-AS expression data were
Log2-transformed. Significance was assessed using Student’s t-tests
in GraphPad Prism v8.0.2 (GraphPad Software, La Jolla, CA, USA). A
p-value
DEmiRNAs were identified when comparing CC and normal tissue samples from the
GSE86100 dataset [19] using the GEO2R software
(https://www.ncbi.nlm.nih.gov/geo/geo2r/) [20]. This dataset was
selected based on the following criteria: (1) all cervical specimens were
confirmed as squamous cell carcinoma through pathological examination, (2)
patients had not received any chemotherapy treatment, and (3) control samples
were confirmed to be normal using cytologic tests. The GSE86100 dataset
(Platform: GPL19730, Agilent - 046064
Unrestricted_Human_miRNA_V19.0_Microarray, Probe Name version) consists of 6
HR-HPV-positive CC tissue samples (named as CC samples) and 6 uninfected normal
mucosa tissue samples (named as controls samples). The microarray platform
version used for this dataset was in format 8
miR-19a-3p and BDNF-AS expression analyses were performed in
CC and normal tissue samples from the Cancer Genome Atlas (TCGA) dataset using
the miR-TV [21] and OncoDB [22] databases. Expression data were downloaded and
transformed into the RPM Log2 format. Significant differences were
determined using Mann-Whitney U-tests, with p-value
miR-19a-3p expression was additionally analyzed in the GSE30656
(https://www.ncbi.nlm.nih.gov/geo/query/acc.cgi?acc=GSE30656) [23] dataset, while
BDNF-AS expression was analyzed in the GSE67522
(https://www.ncbi.nlm.nih.gov/geo/query/acc.cgi?acc=GSE67522) [24, 25] and
GSE63514 (https://www.ncbi.nlm.nih.gov/geo/query/acc.cgi?acc=GSE63514) [26]
datasets from the GEO [20, 27] database. The GSE30656 dataset (Platform: GPL6955,
Agilent-016436 Human miRNA Microarray 1.0, Feature Number version) contains 19
cervical adenocarcinoma/squamous cell carcinoma tissue samples and 10 cervical
squamous epithelial samples with normal histology. The GSE67522 dataset
(Platform: GPL10558, Illumina HumanHT-12 V4.0 expression beadchip) includes 20
HPV16 positive CC tissue samples and 22 HPV negative histologically normal
controls/HPV16-positive non-malignant tissue samples. The GSE63514 dataset
(Platform: GPL570, [HG-U133_Plus_2] Affymetrix Human Genome U133 Plus 2.0
Array) contains 28 CC tissue samples and 24 normal tissue samples. Expression
analysis was done with the GEO2R [20] software. Expression data were
Log2-transformed, and differences between groups were analyzed with
Student’s t-tests. A p-value
Differentially expressed genes (DEGs) between CC patient samples with high and
low levels of BDNF-AS expression from the TCGA-CESC dataset [28] were
identified using the TCGA biolinks and DESeq2 packages [29, 30] using the R
program, selecting those. mRNAs with an FC
ROC curves analyses were performed based on CC and normal tissue samples from the GSE30656 dataset for miR-19a-3p, and the GSE67522 and GSE63514 datasets for BDNF-AS. These analyses were performed in GraphPad Prism v8.0 software (GraphPad Software, La Jolla, CA, USA). Area Under the Curve (AUC) values and 95% confidence intervals (CI) were calculated, and the Youden index method was used to calculate cut-off, sensitivity, specificity, and p-values [32].
Overall survival (OS) was evaluated using Kaplan-Meier curves based on CC tissue samples from the TCGA dataset included in the Kaplan-Meier Plotter database [33], comparing patient outcomes when stratified based on whether miR-19a-3p or BDNF-AS expression levels fell above or below the median value. Hazard ratios (HRs) and log-rank p-values were calculated, and p-value ˂ 0.05 was considered significant.
The target mRNAs of miR-19a-3p were identified with the miRDB [34] and TargetScan [35] databases using the default parameters. Common target mRNAs shared between these databases were identified with a Venn diagram. miR-19a-3p binding sites in BDNF-AS were identified using the Ensembl database [36].
Pathways and biological processes were analyzed using the Kyoto Encyclopedia of
Genes and Genomes (KEGG) 2021 Human, Molecular Signatures Database (MSigDB)
Hallmark 2020 and GO Biological Process 2021 libraries in the Enrichr database
[37, 38, 39, 40]. Log2-transformed p-values were calculated for each term,
with p-value
The correlation between miR-19a-3p and BDNF-AS expression in
CC tissue samples in the ENCORI/StarBase (Encyclopedia of RNA interactomes) v2.0
database [41] was analyzed. The expression of miR-19a-3p was transformed
into the Log2 (RPM+0.01) format, while BDNF-AS expression was
transformed into the Log2 (FPKM+0.01) format. Correlation coefficient (R)
values were calculated, and p-value
Genes correlated with BDNF-AS expression were identified in CC tissue
samples from the TCGA dataset using the cBioportal database [42]. Genes with a
Spearman’s Correlation
A protein-protein interaction (PPI) network was constructed using the Search
Tool for the Retrieval of Interacting Genes/Proteins (STRING) v11.5 database
[43], with the following parameters: (1) minimum required interaction score set
to the highest confidence (0.900); (2) Active interaction sources: Experiments,
Gene Fusion, and Co-expression; and (3) Hide disconnected nodes in the network:
ON. A PPI enrichment p-value
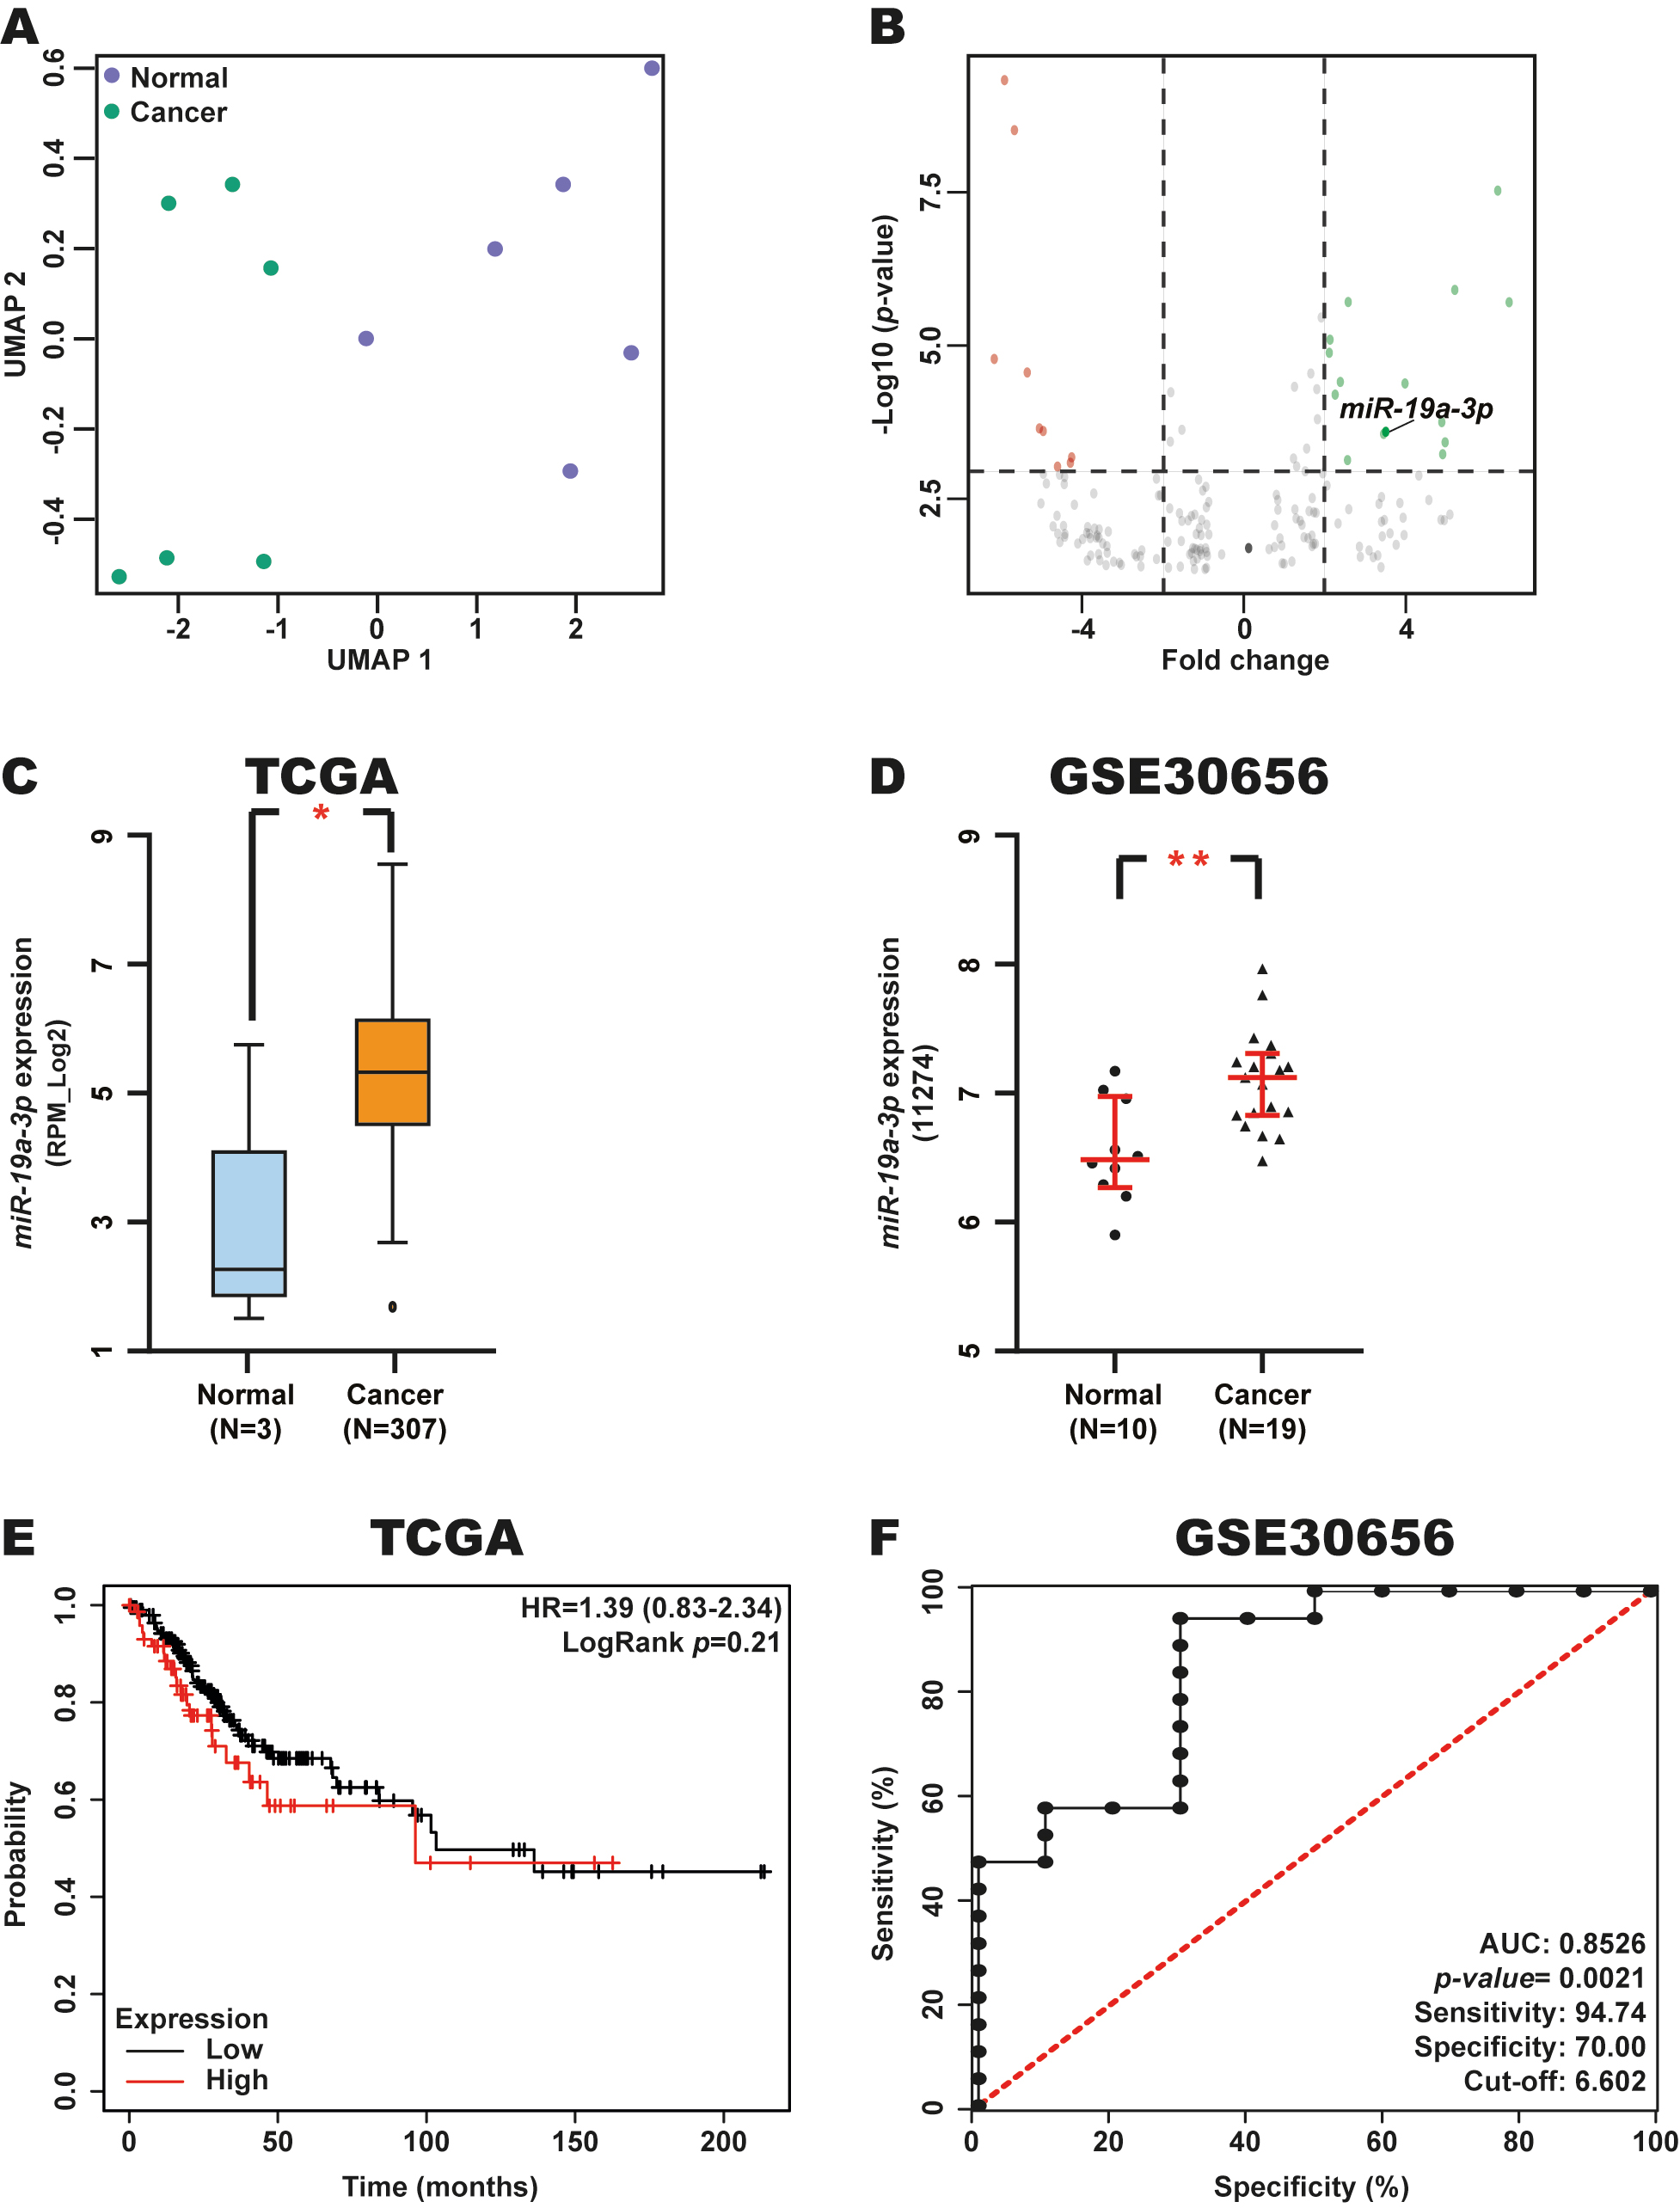
To identify DEmiRNAs in CC, we analyzed the expression of miRNAs in CC tumor samples and normal tissue samples (n = 6 each) using the GSE86100 dataset with the GEO2R tool. Uniform manifold approximation and projection (UMAP) dimensionality revealed a clear separation between these tissue types, confirming that both groups were clearly distinguished (Fig. 1A). A total of 24 DEmiRNAs were identified between CC and control samples, of which 9 were downregulated, and 15 were upregulated in CC tissue samples (Table 1 and Fig. 1B).
 Fig. 1.
Expression, diagnostic and prognostic value of
miR-19a-3p in CC. (A) UMAP analysis of 6 CC and 6 normal tissue samples
from the GSE86100 dataset. (B) Volcano plot of DEmiRNAs from the GSE86100
dataset. (C,D) Validation of miR-19a-3p expression in CC and normal
tissue samples from the TCGA and GSE30656 datasets using the miR-TV and GEO
databases. (E) Prognostic value of miR-19a-3p expression in patients
with CC from the TCGA dataset through a Kaplan-Meier curve using the Kaplan-Meier
Plotter database. Red line: high miR-19a-3p expression; Black line: low
miR-19a-3p expression. (F) Diagnostic value of miR-19a-3p
expression in CC and normal tissue samples from the GSE30656 dataset using a ROC
curve in GraphPad Prism. *p-value
| ID | miRNA | p-value | FC |
| A_25_P00012052 | hsa-miR-196a-5p | 0.00000183 | 6.6 |
| A_25_P00012078 | hsa-miR-7-5p | 0.0000000285 | 6.32 |
| A_25_P00011994 | hsa-miR-18a-5p | 0.00000116 | 5.25 |
| A_25_P00015381 | hsa-miR-205-3p | 0.00034 | 5.01 |
| A_25_P00012034 | hsa-miR-96-5p | 0.00053 | 4.95 |
| A_25_P00016153 | hsa-miR-3653 | 0.00016 | 4.92 |
| A_25_P00014257 | hsa-miR-590-5p | 0.0000378 | 4.01 |
| A_25_P00010997 | hsa-miR-19a-3p | 0.000229 | 3.53 |
| A_25_P00010954 | hsa-miR-363-3p | 0.000248 | 3.47 |
| A_25_P00010614 | hsa-miR-20b-5p | 0.00000182 | 2.6 |
| A_25_P00010547 | hsa-miR-141-3p | 0.000659 | 2.58 |
| A_25_P00010433 | hsa-miR-106b-5p | 0.0000357 | 2.4 |
| A_25_P00010975 | hsa-miR-21-5p | 0.0000574 | 2.27 |
| A_25_P00010610 | hsa-miR-93-5p | 0.00000739 | 2.14 |
| A_25_P00014817 | hsa-miR-15a-5p | 0.000012 | 2.12 |
| A_25_P00010584 | hsa-miR-154-5p | 0.000594 | –4.29 |
| A_25_P00014342 | hsa-miR-654-3p | 0.000729 | –4.32 |
| A_25_P00015540 | hsa-miR-4253 | 0.000839 | –4.64 |
| A_25_P00017457 | hsa-miR-1185-2-3p | 0.000223 | –4.99 |
| A_25_P00016710 | hsa-miR-4655-3p | 0.000202 | –5.09 |
| A_25_P00016741 | hsa-miR-4695-5p | 0.0000251 | –5.39 |
| A_25_P00015004 | hsa-miR-1226-5p | 0.00000000299 | –5.71 |
| A_25_P00015538 | hsa-miR-3137 | 0.000000000464 | –5.96 |
| A_25_P00015649 | hsa-miR-3188 | 0.0000152 | –6.21 |
miRNAs in bold were selected for further analysis. FC values represent log2‑transformed fold changes.
While certain miRNAs identified among these DEmiRNAs (Table 1) have previously been characterized in CC, including miR-21-5p [44, 45] and miR-154-5p [46, 47], others remain poorly characterized in this cancer type. Given the relatively limited research on miR-19a-3p in CC to date, it was chosen as a target for further analysis.
To validate changes in miR-19a-3p expression in CC, we analyzed the levels of this miRNA in CC and normal tissue samples from the TCGA and GSE30656 datasets using the miR-TV and GEO databases. We observed elevated miR-19a-3p expression in CC in these two independent datasets (Fig. 1C,D), supporting our initial findings.
To determine the potential prognostic and diagnostic relevance of miR-19a-3p in CC, we evaluated patient OS based on Kaplan-Meier analysis and AUC values for ROC curves when stratifying patients from the TCGA and GSE30656 datasets according to miR-19a-3p expression levels using the KM-Plotter database and GraphPad Prism, respectively. This analysis revealed that miR-19a-3p expression is not associated with OS in patients with CC (Fig. 1E). However, we found a good AUC (0.8526, p-value = 0.0021) was observed, with excellent sensitivity and specificity of 94.74% and 70.00%, respectively (Fig. 1F), for a cut-off value of 6.602.
These results suggest that miR-19a-3p expression is elevated in CC and that this miRNA may serve as a potential diagnostic biomarker in this type of cancer, supporting its biological and clinical relevance in this malignancy.
To explore the potential role of miR-19a-3p in CC, we next identified potential targets of this miRNA using miRDB and TargetScan databases, identifying 829 common targets in both databases (Fig. 2A). Next, pathway and biological process analyses were performed for these 829 potential targets using the KEGG 2021 Human and GO Biological processes libraries from the Enrichr database. As shown in Fig. 2B, KEGG analysis revealed that the potential targets of miR-19a-3p participate in key pathways to CC, such as the mTOR signaling pathway, Forkhead Box O (FoxO) signaling pathway, and signaling pathways regulating pluripotency of stem cells. Interestingly, the identified biological processes were found to be involved in transcriptional regulation and protein phosphorylation, including the Regulation of transcription, DNA-template, Regulation of transcription by RNA polymerase II, and Negative regulation of gene expression processes (Fig. 2C). A Venn diagram analysis identified 13 targets of miR-19a-3p involved in the top 3 biological processes (Fig. 2D), including four transcription factors (ESR1, YY1, FOXP1 and REST).
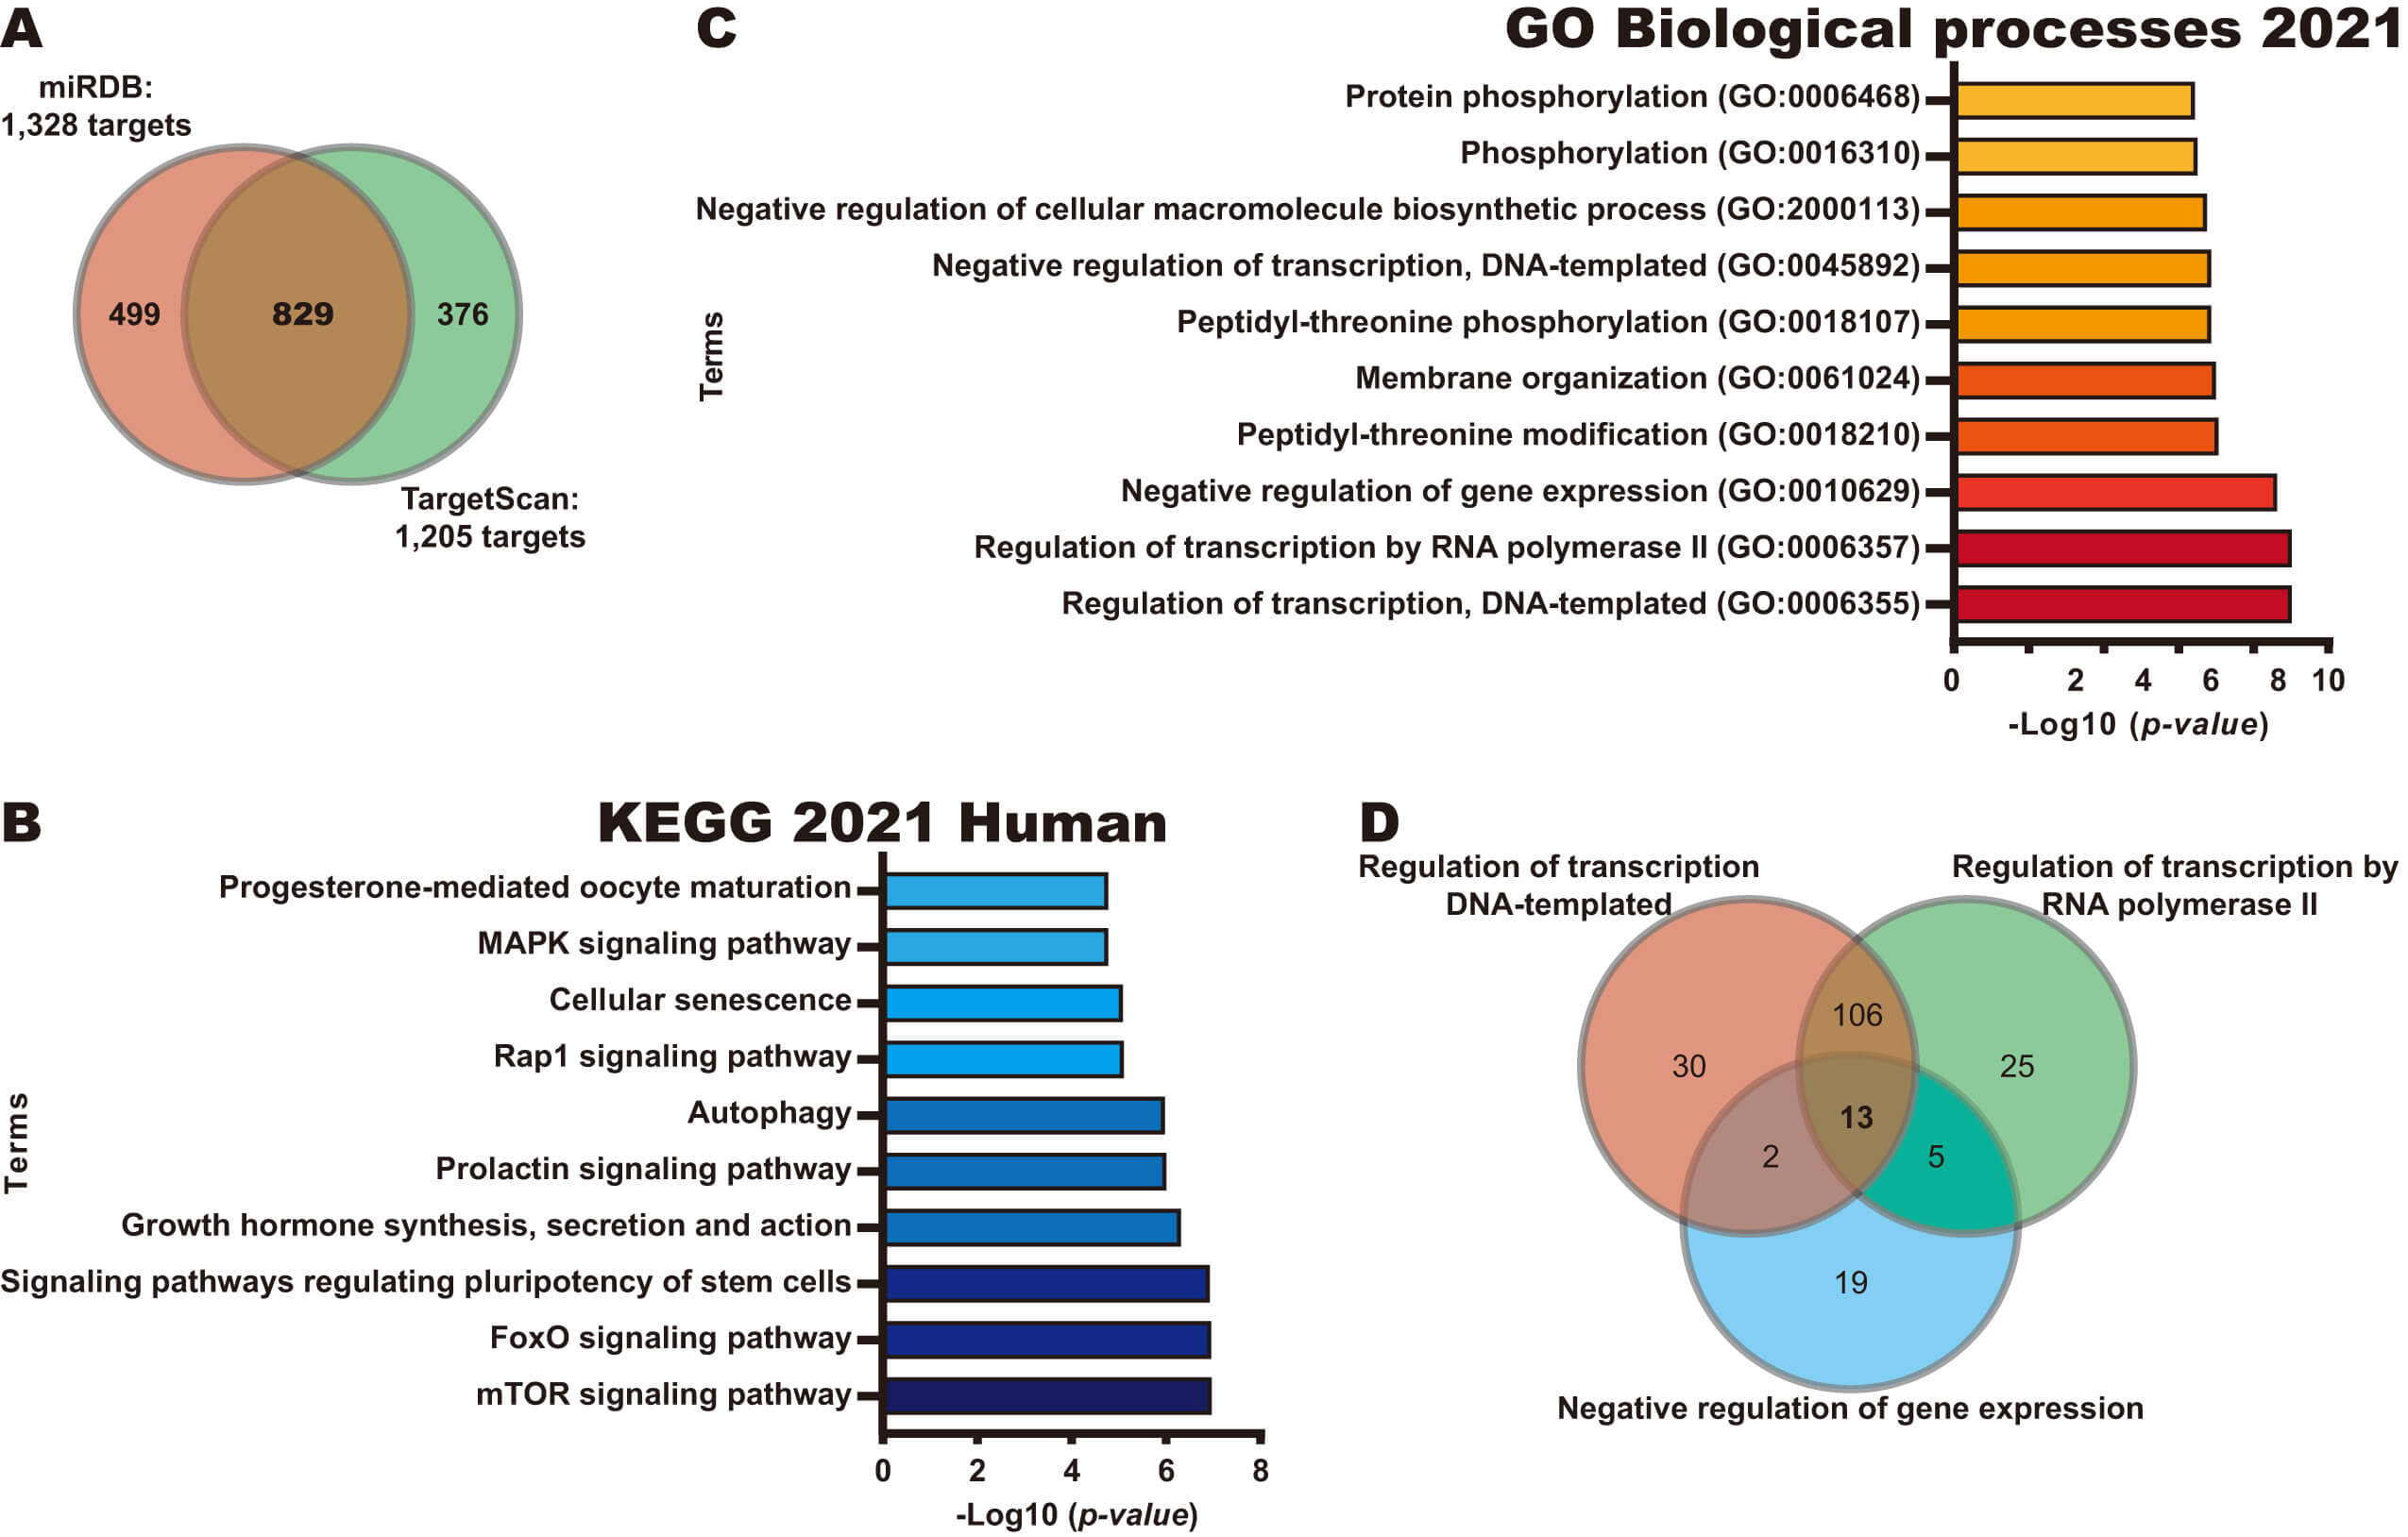 Fig. 2.
Identification of potential pathways regulated by miR-19a-3p. (A) Identification of potential targets of miR-19a-3p using miRDB and TargetScan databases. (B) Pathways analysis of 829 potential targets of miR-19a-3p using KEGG Human 2021 library in Enrichr database. (C) BP analysis of 829 potential targets of miR-19a-3p using GO Biological Processes 2021 library in Enrichr database. (D) Identification of genes in common in the top three BP through a Venn diagram.
Together, our results suggest that miR-19a-3p overexpression may inhibit the expression of its target mRNAs, affecting key pathways and processes to promote CC progression.
Previous studies have reported that miR-19a-3p interacts with certain lncRNAs, such as XIST [48], LINC00094 [49], and KCNQ1OT1 [50]. Low levels of BDNF-AS expression in CC have also been reported, as has the tumor suppressor function of this lncRNA in this cancer type [51]. However, it remains unknown as to whether miR-19a-3p regulates BDNF-AS expression in CC. We therefore focused on this potential regulatory axis in CC.
To explore whether miR-19a-3p is involved in BDNF-AS
regulation in CC, we searched potential binding sites for this miRNA in
BDNF-AS using the Ensembl database. In total, three potential binding
sites for this miRNA were located in intron 7, exon 8, and the
3 UTR′ (Fig. 3A) of BDNF-AS. In addition, RT-qPCR revealed
an inverse association between the expression patterns of these two ncRNAs in
SiHa and HeLa CC cells (Fig. 3B). Moreover, we observed a negative correlation
between miR-19a-3p and BDNF-AS expressions in CC tissue samples
from the TCGA dataset using the ENCORI database (r = –0.1777, p-value =
1.93
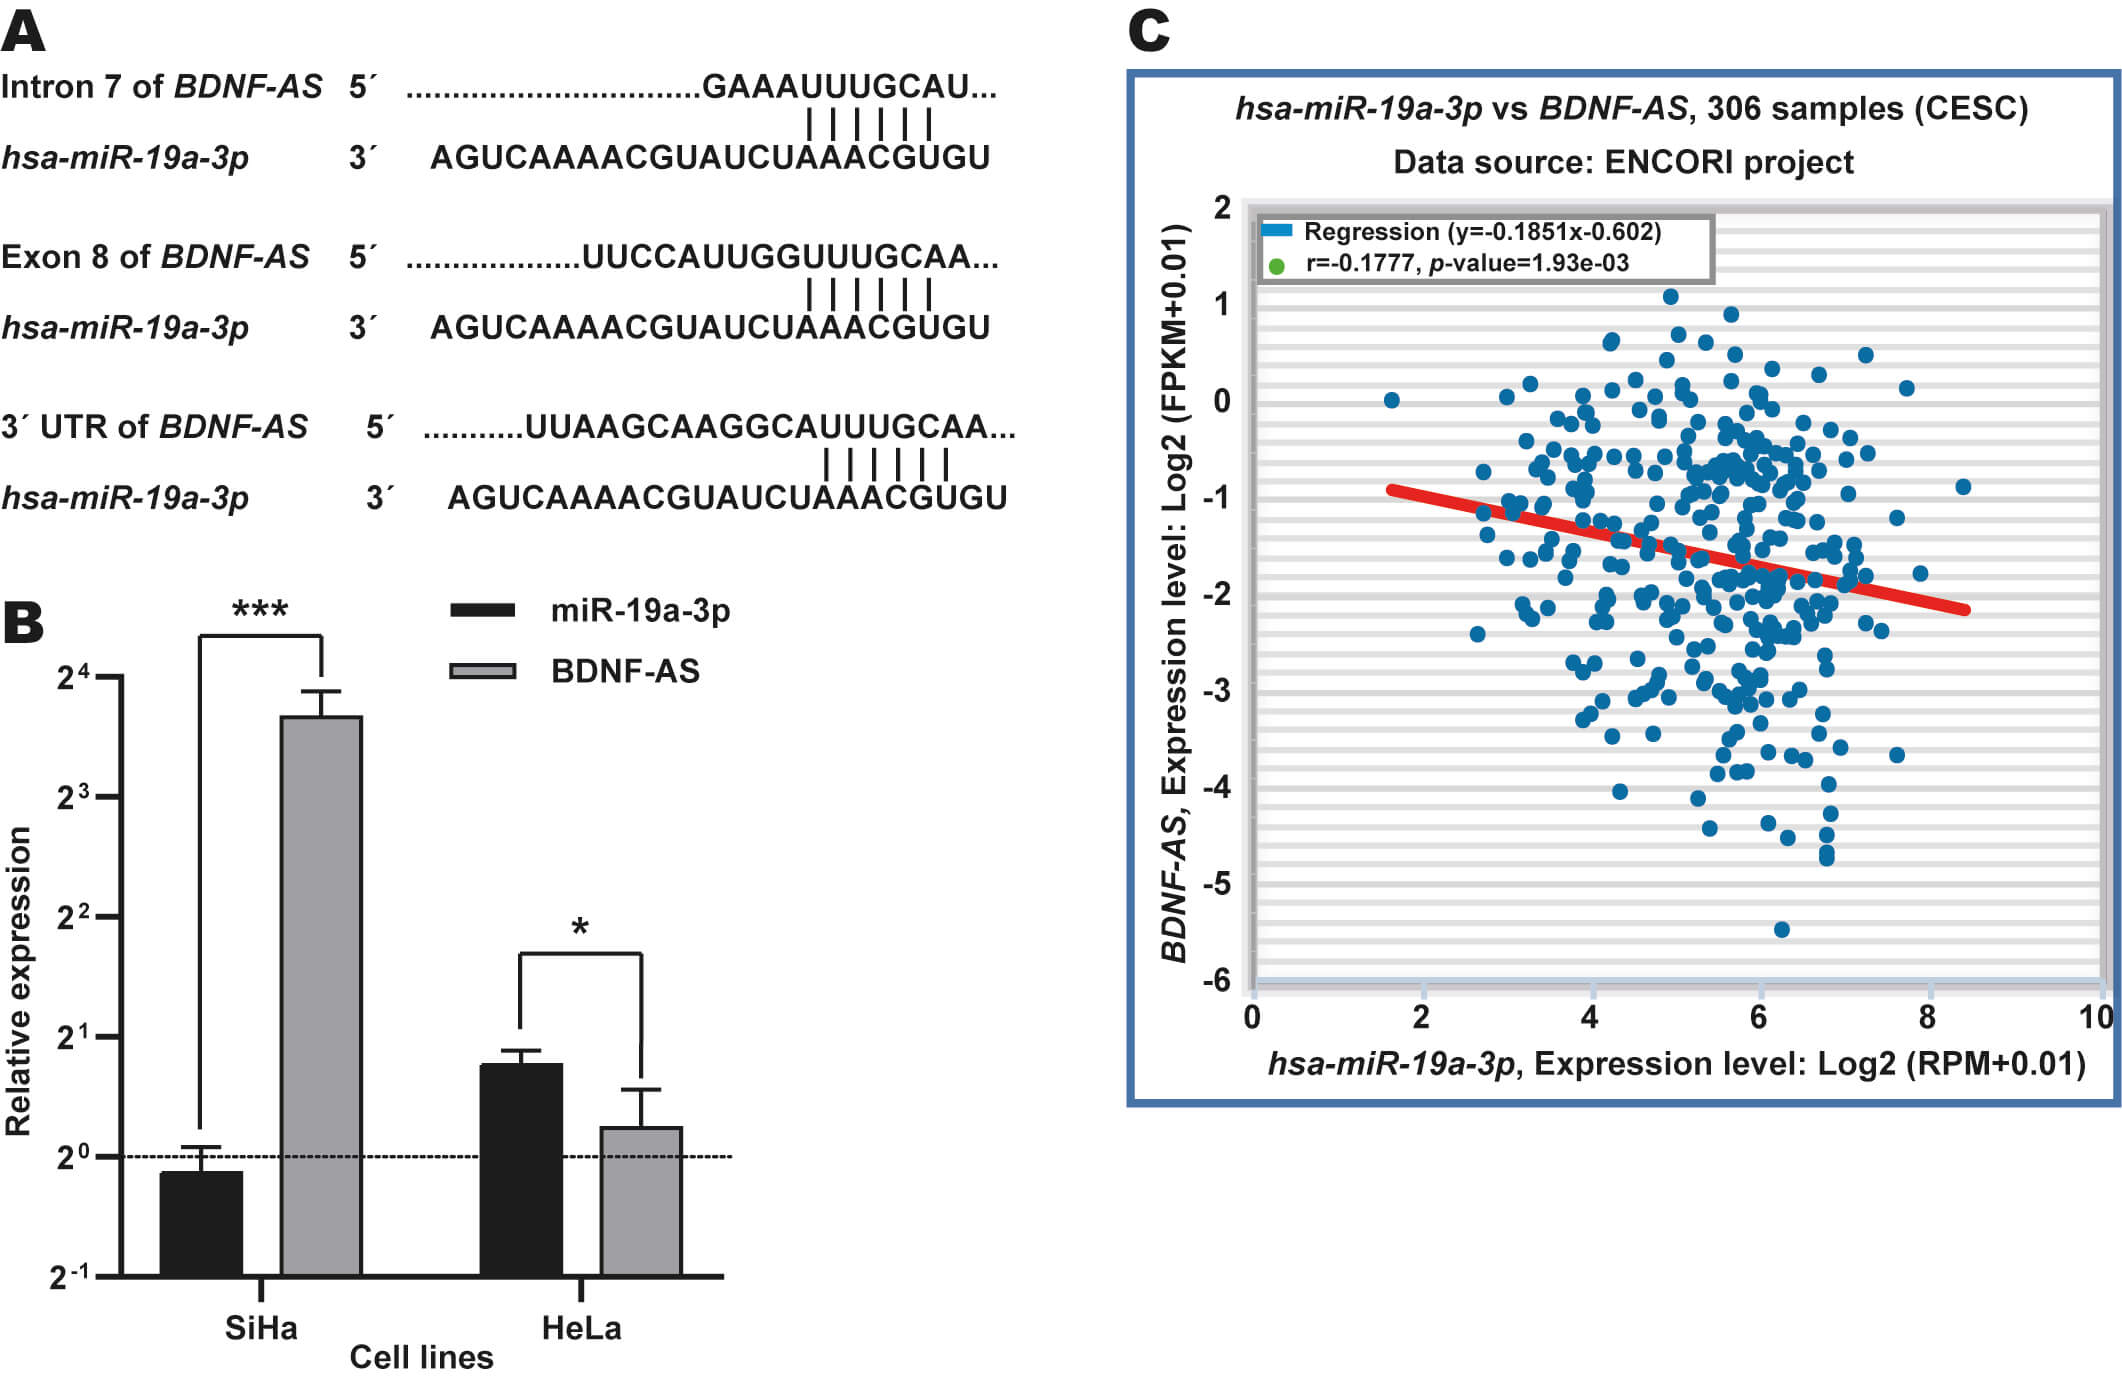 Fig. 3.
Identification of BDNF-AS as target potential of
miR-19a-3p in CC. (A) Identification of binding sites for
miR-19a-3p in intron, exon and 3′ UTR regions in BDNF-AS
using Ensembl database. (B) Expression analysis of miR-19a-3p in CC cell
lines through RT-qPCR assays. Expression levels of miR-19a-3p and
BDNF-AS were determined in HeLa and SiHa cells and they are relative to
C-33A cells (dotted black line). *p-value
These results suggest that miR-19a-3p may regulate the expression of BDNF-AS in CC, which could be due to their potentially direct interaction.
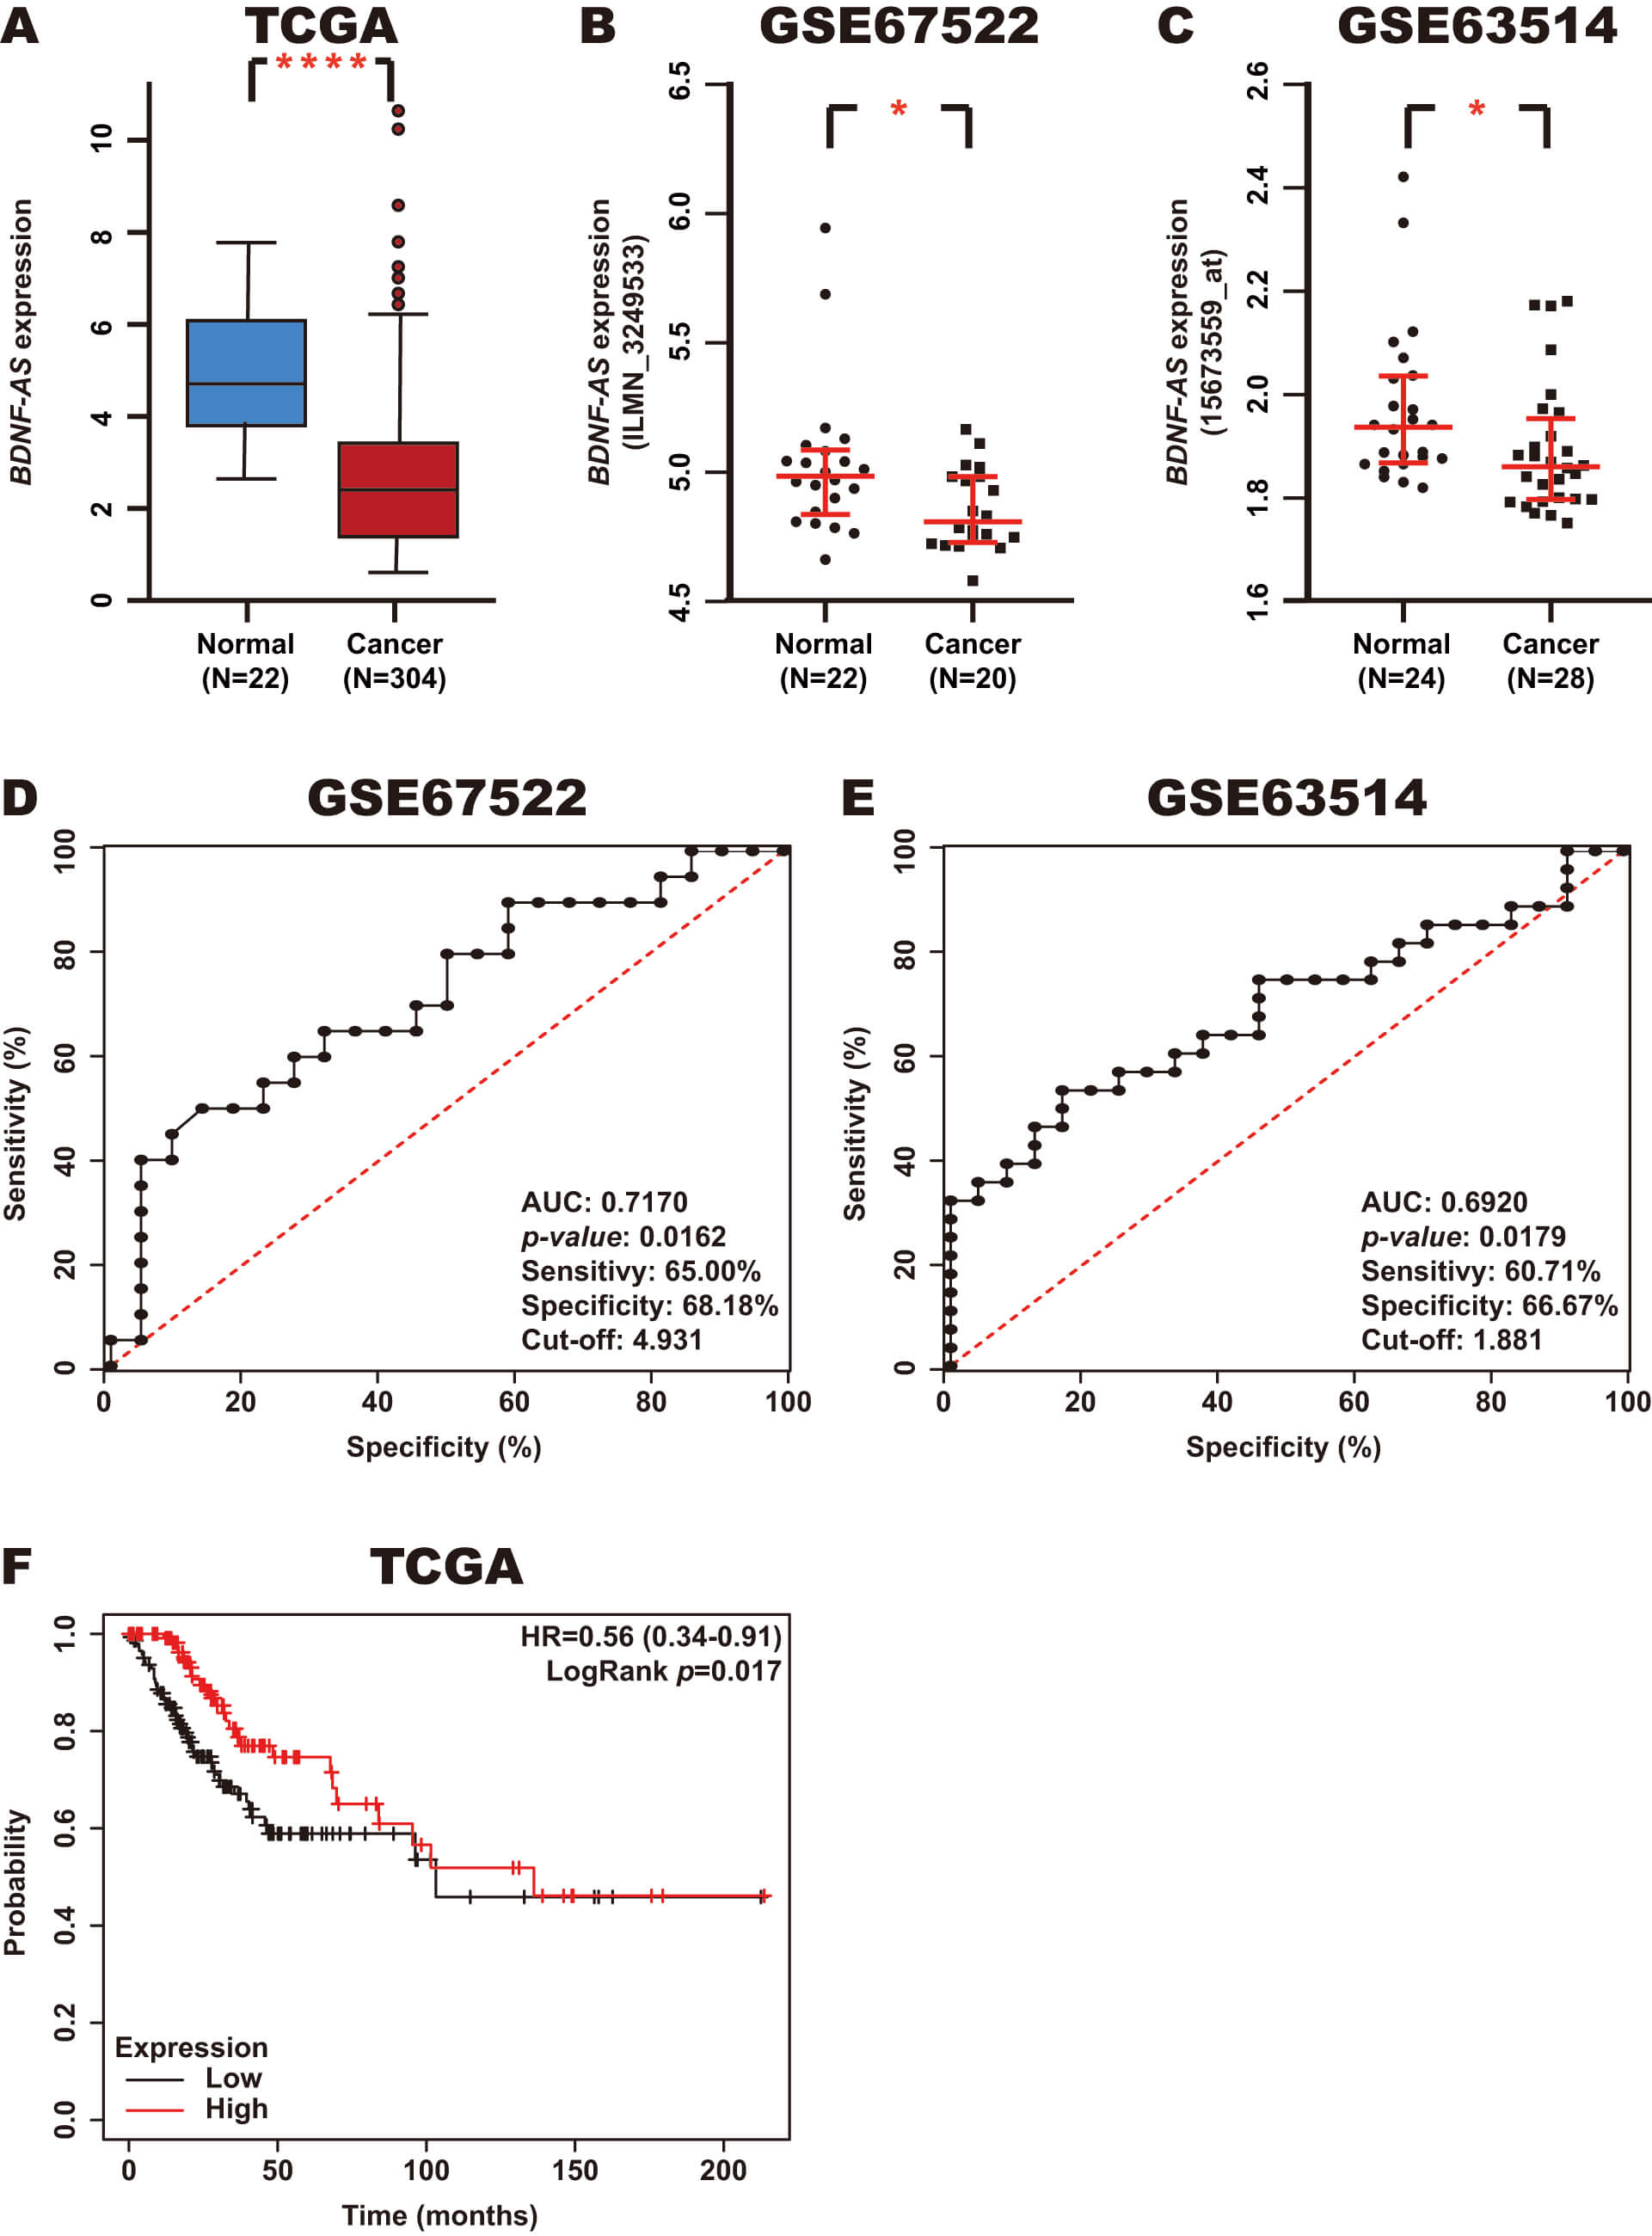
To establish the expression of BDNF-AS in CC, we analyzed CC and normal tissue samples from the TCGA, GSE67522, and GSE63514 datasets using the OncoDB and GEO databases. The results revealed that BDNF-AS expression is decreased in CC tissue samples (Fig. 4A–C).
 Fig. 4.
Expression, diagnostic value, and prognostic value of
BDNF-AS in CC. (A–C) BDNF-AS expression in CC and normal
tissue samples from the TCGA, GSE67522, and GSE63514 datasets was assessed using
the OncoDB and GEO databases. (D,E) The diagnostic value of BDNF-AS
expression in CC and normal tissue samples from the GSE67522 and GSE63514
datasets was assessed using ROC curves in GraphPad Prism. (F) The prognostic
value of BDNF-AS expression in CC tissue samples from the TCGA dataset
was assessed using a Kaplan-Meier curve using the Kaplan-Meier Plotter database.
Red line: high BDNF-AS expression; Black line: low BDNF-AS
expression. *p-value
To investigate the diagnostic value of BDNF-AS expression in CC, a ROC curve analysis was performed based on the expression of this lncRNA in CC and normal samples from the GSE67522 and GSE63514 datasets using GraphPad Prism. The results revealed an AUC of 0.7170 (p-value: 0.0162) and 0.6920 (p-value: 0.0179), with sensitivities of 65.00% and 60.71%, respectively, and corresponding specificities of 68.18% and 66.67% (cutoff: 4.931 and 1.881), respectively (Fig. 4D,E). In addition, the prognostic value of BDNF-AS expression in CC was analyzed using a Kaplan-Meier curve in CC tissue samples from the TCGA dataset using the KM-Plotter database. Notably, low BDNF-AS expression was found to be associated with poor OS (Fig. 4F).
These results suggest that BDNF-AS expression is decreased in CC and may serve as a potential diagnostic and prognostic biomarker.
To identify the potential pathways regulated by BDNF-AS in CC, we first
identified the genes correlated with BDNF-AS expression in CC tissue
samples from the TCGA dataset using the cBioportal database. BDNF-AS
expression was positively correlated with the expression of 826 genes
(Supplementary Table 1), while it was negatively correlated with the
expression of 306 genes (Supplementary Table 2). These 1132 genes were
further analyzed using the KEGG 2021 Human library in the Enrichr database.
Interestingly this approach identified key pathways in CC, such as the
Glycolysis/Gluconeogenesis, Cellular senescence, Tumor Necrosis Factor (TNF)
signaling, Hedgehog signaling, Proteoglycans in cancer, and Central carbon
metabolism in cancer pathways (Fig. 5A). In addition, biological process analysis
revealed that BDNF-AS may be involved in processes including the
following: Positive regulation of protein localization to cajal body,
Ribonucleoprotein complex biogenesis, “De novo” Post-translational protein
folding and Ribosome biogenesis (Fig. 5B). Finally, the 1132 genes were used to
construct a PPI network (Fig. 5C) with 1054 nodes, 204 edges, an average node
degree of 0.387, an average local clustering coefficient of 0.102, an expected
number of edges of 110, and a PPI enrichment p-value of 1.11
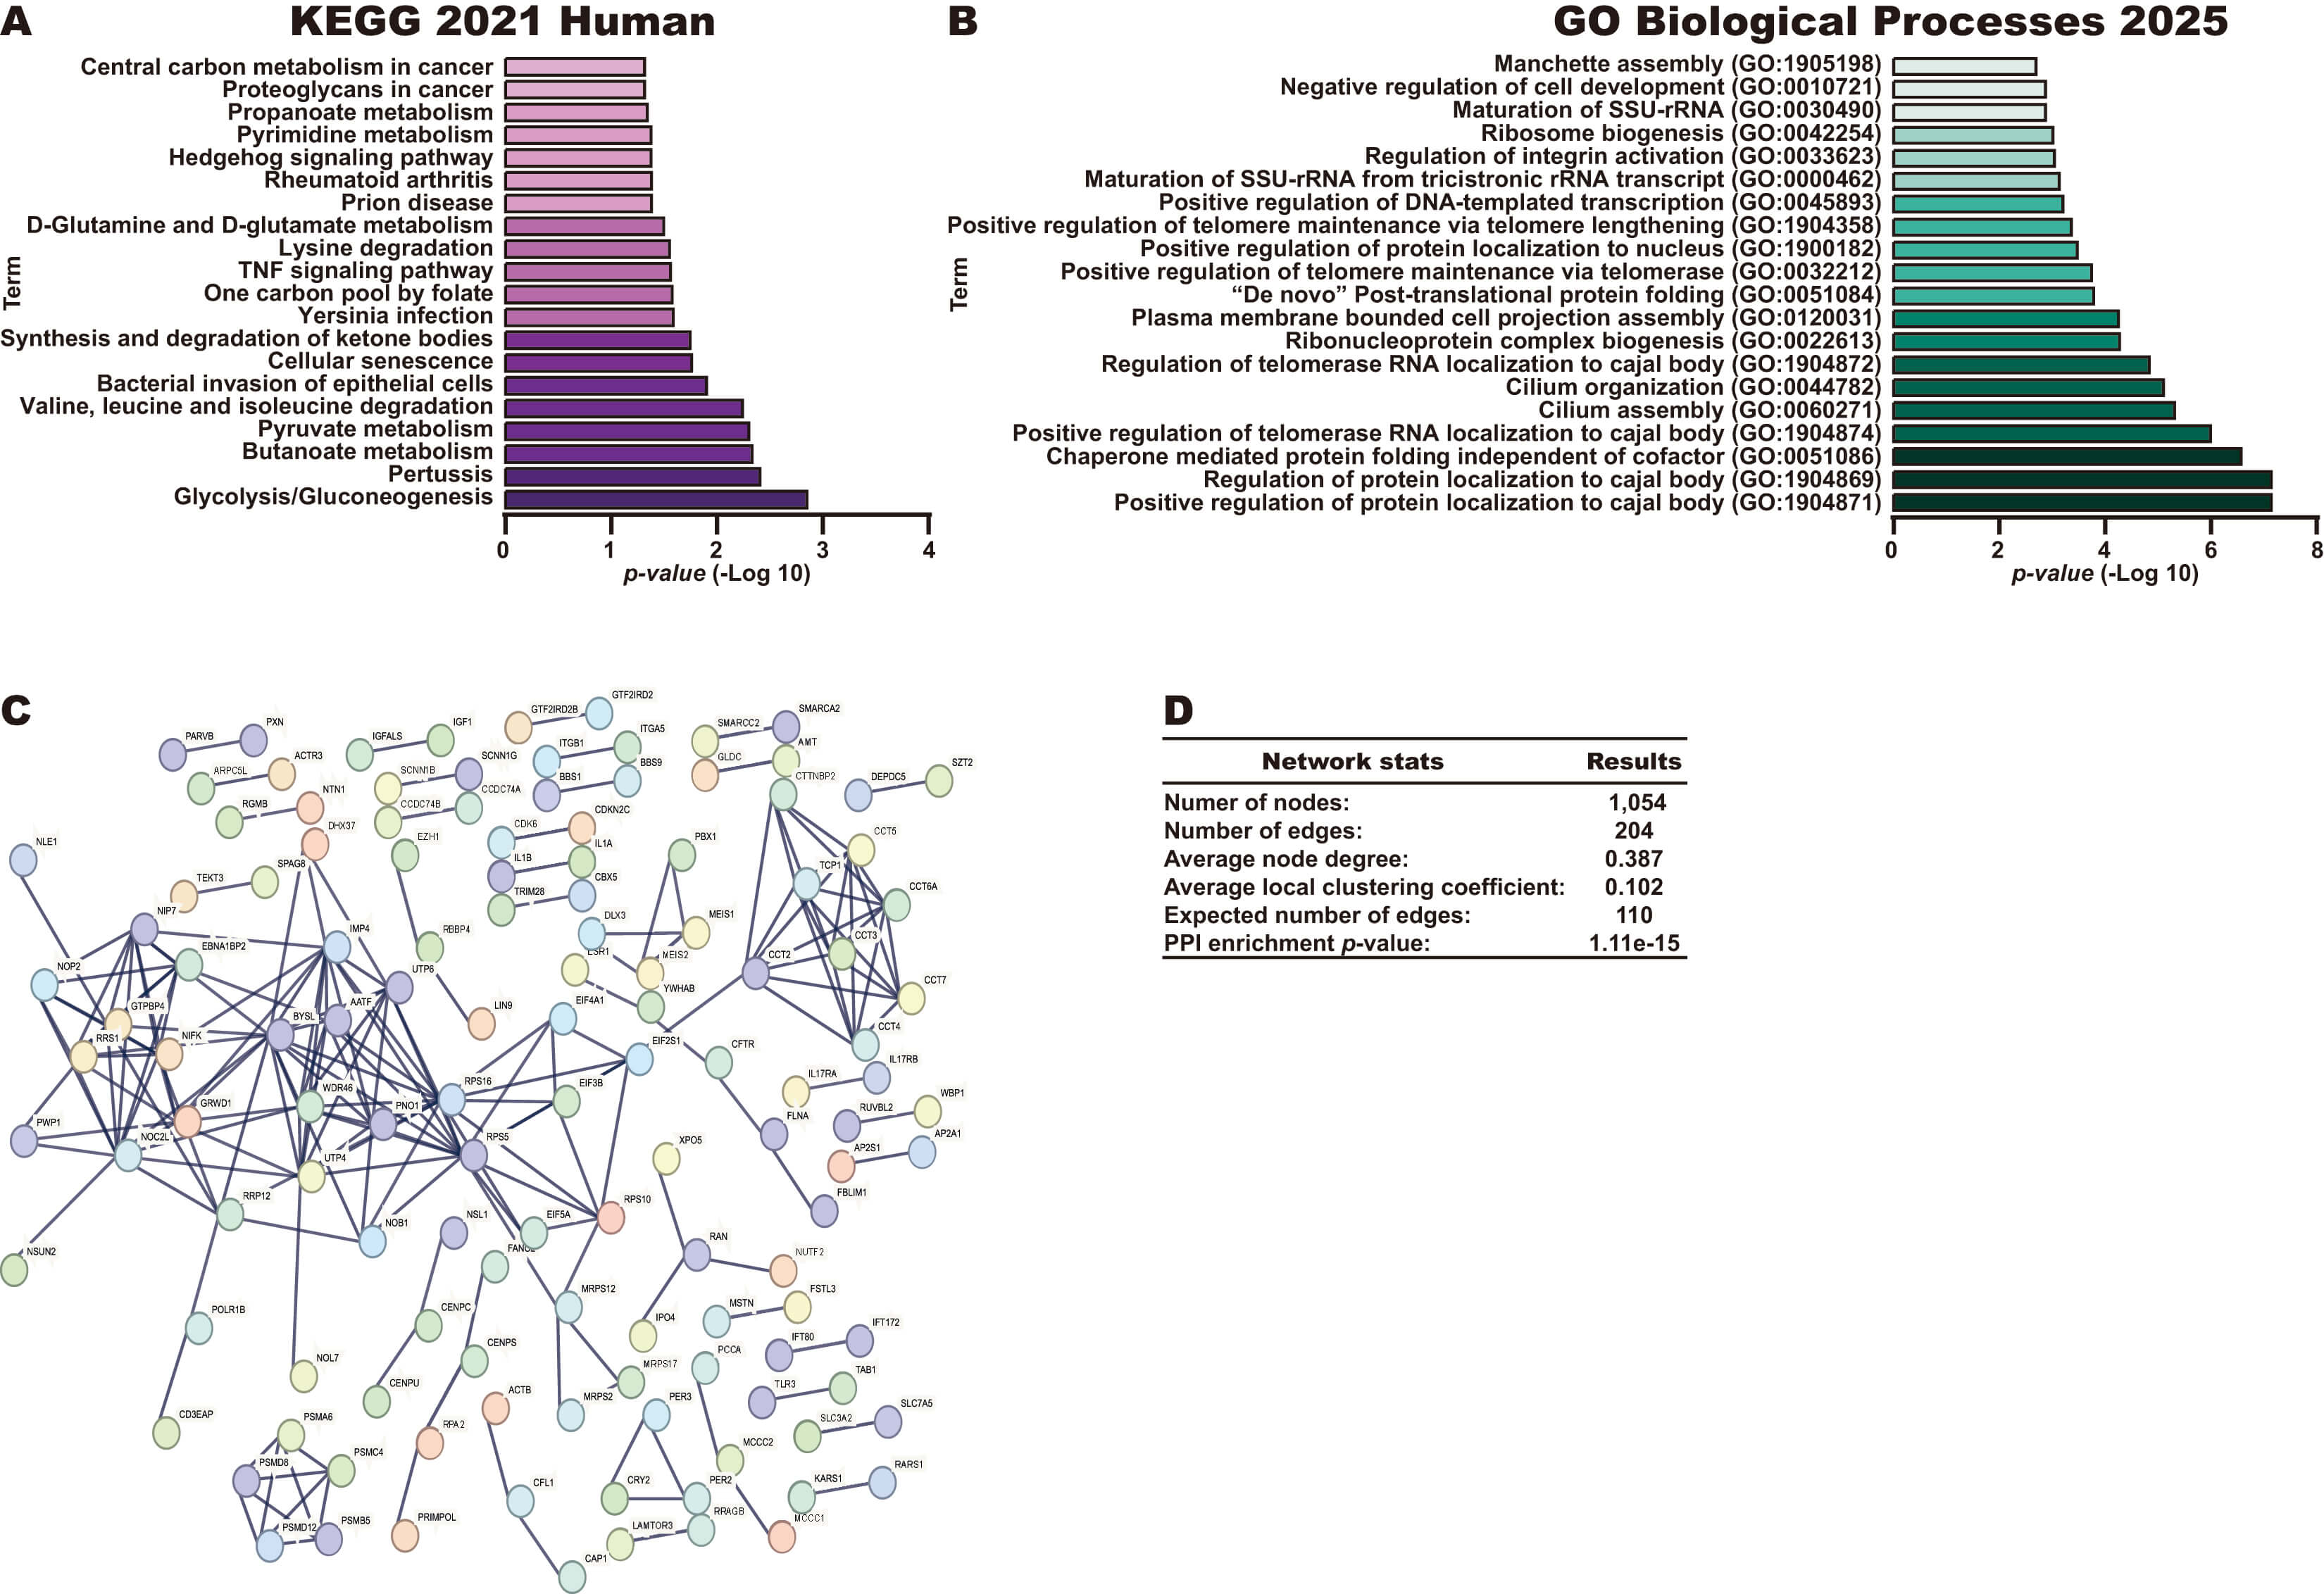 Fig. 5.
Pathways and biological processes of genes that correlate with BDNF-AS in CC. (A) Pathways associated with the 1132 genes that were negatively or positively correlated with BDNF-AS expression in CC tissue samples, as assessed using the KEGG 2021 Human library in the Enrichr database. (B) The top biological process terms associated with the 1132 genes that were negatively or positively correlated with BDNF-AS expression, as assessed using the Biological Process 2021 library in the Enrichr database. (C,D) Construction and analysis of a PPI network incorporating the 1132 genes correlated with BDNF-AS expression in CC tissue samples.
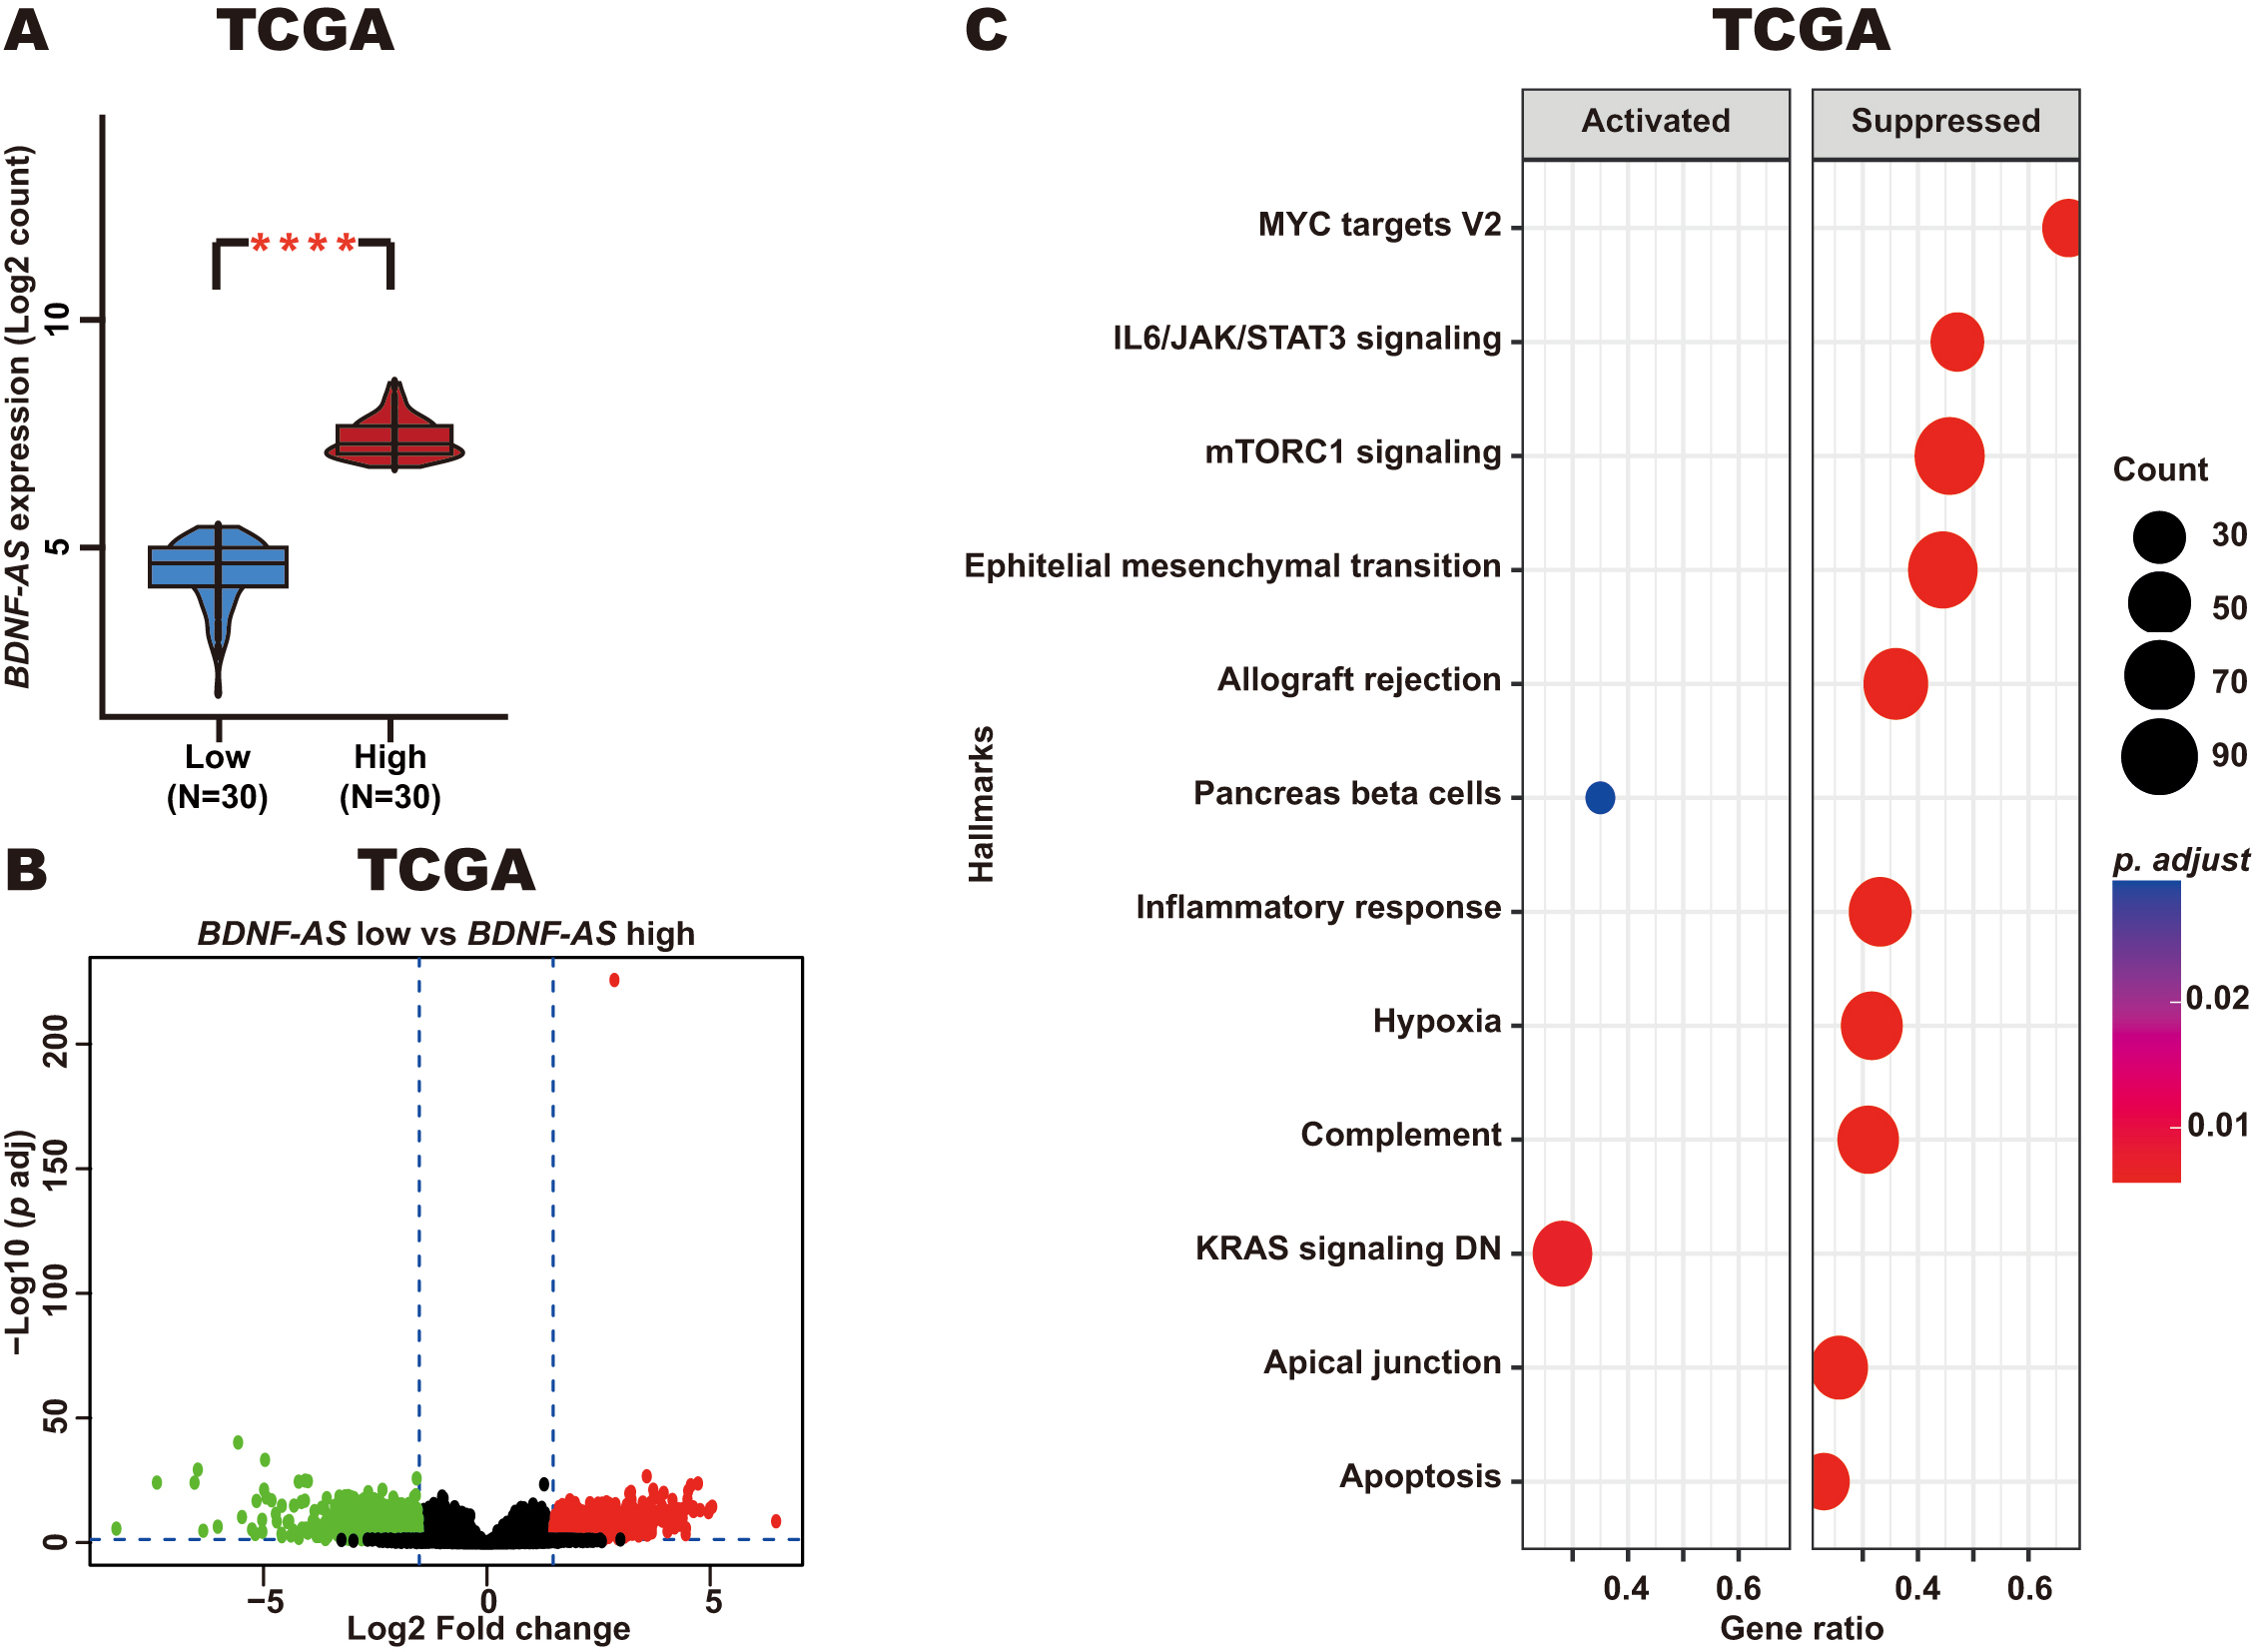
In addition, we identified DEGs when comparing the top 30 CC patients with the lowest levels of BDNF-AS expression and the top 30 patients with the highest levels of BDNF-AS expression (Fig. 6A). For this comparison (low vs high BDNF-AS expression), 1796 DEGs were identified, including 1125 upregulated genes and 671 downregulated genes (Fig. 6B). GSEA analysis revealed that these DEGs were associated with key CC-related pathways, such as the apoptosis, mTORC1 signaling, and IL6/JAK/STAT3 signaling pathways. In patients with CC and high BDNF-AS expression, these pathways were found to be suppressed as compared with CC patients and exhibiting low levels of BDNF-AS expression (Fig. 6C).
 Fig. 6.
Enriched pathways in CC patients with high BDNF-AS
expression. (A) BDNF-AS expression in CC patients with high
BDNF-AS expression (top 30) and low BDNF-AS expression (top 30)
from the TCGA dataset. (B) DEGs were identified when comparing those CC patients
with low and high levels of BDNF-AS expression from the TCGA dataset.
(C) Enriched pathways derived from GSEA analysis of the identified DEGs.
****p-value
These results suggest that BDNF-AS may be involved in the negative regulation of genes involved in key pathways related to CC pathogenesis.
CC ranks as one of the top cancers among women in terms of global incidence and mortality [1]. Several studies have reported that alterations at the epigenetic level, including miRNAs, play a key role in cervical carcinogenesis, progression, and metastasis [5]. miRNAs are small molecules that regulate the expression of their target mRNAs at the post-transcriptional level, thereby affecting cellular processes, such as migration, invasion, proliferation, and apoptosis [52]. In addition, several studies have suggested that some miRNAs offer potential utility as diagnostic, prognostic, and therapeutic biomarkers in CC, including miR-361-5p [52, 53]. There is thus value in identifying and characterizing key miRNAs in CC.
In this study, we determined that miR-19a-3p expression was elevated in CC in three independent RNA-seq and microarray datasets, in line with previously published RT-qPCR evidence [17], supporting our findings. Further mechanistic studies are warranted to clarify how its overexpression arises in CC, potentially through the actions of oncogenic transcription factors, copy number increases, aberrant methylation, or ncRNAs.
Analyses of CC patients OS revealed no association between high miR-19a-3p expression and poor patient survival. Interestingly, ROC curve analysis indicated that miR-19a-3p expression may offer utility as a diagnostic biomarker, although it will be crucial to validate these results in larger cohorts. Its expression can also be analyzed in serum or plasma samples to evaluate its potential use as a non-invasive biomarker. The observed differences between the prognostic and diagnostic value of miR-19a-3p expression in CC in this study may be explained in part by the functional role of this miRNA in CC. For example, its diagnostic value depends on the relative levels of miR-19a-3p expression in CC and normal tissue samples, in line with a role in carcinogenesis, while its prognostic value solely depends on miR-19a-3p expression in patients with CC, in line with the participation of this miRNA disease progression, development, metastasis, and treatment response.
Previous studies have reported that miR-19a-3p plays a central role in CC pathogenesis as an oncomiR [17]. Recently, it has been reported that RBPMS-AS1 overexpression decreases proliferation and epithelial–mesenchymal transition activity via miR-19a-3p/PLCL1 axis in C-33A and HeLa CC cells [17]. In the present study, we identified several mRNA targets of miR-19a-3p that participate in previously reported signaling pathways, including the mTOR pathway [54], supporting our results. We also identified other pathways potentially regulated by miR-19a-3p, such as the FoxO signaling pathway, signaling pathways regulating the pluripotency of stem cells, and the mitogen-activated protein kinase (MAPK) signaling pathway. The FoxO signaling pathway is regulated by FoxO transcription factors, which include growth factors and stress responsive transcription factors, like FoxO1, FoxO3, FoxO4, and FoxO6. This signaling pathway regulates processes, including oxidative stress and oxidation-triggered apoptosis, and cell cycle arrest, exerting tumor suppressor activity in cancer [55]. Stem cell populations have recently been shown to function as key drivers of the initiation and progression of diseases, in addition to contributing to therapy resistance, as in prostate cancer [56]. The MAPK signaling pathway is also a major target of drug resistance in cancer [57]. Several studies have reported that these pathways are central to CC [55, 58, 59], underscoring the potential that miR-19a-3p expression may represent a therapeutic target in this type of cancer.
Biological process analysis revealed that targets of miR-19a-3p are involved in activities linked to transcription factor-mediated regulation of mRNA transcription. Consistently, one study reported ESR1 downregulation in CC [60, 61], while another reported that REST expression decreases in high-grade squamous intraepithelial lesions and CC [62]. Our results suggest the potential existence of miR-19a-3p/ESR1 and miR-19a-3p/REST regulatory axes in CC, although this remains to be formally demonstrated.
Certain miRNAs can act as molecular sponges, thereby downregulating the expression of their mRNA targets in several human diseases, including cancer [63, 64]. miR-19a-3p can also be sequestered by the lncRNA RBPMS-AS1 through a ceRNA-like mechanism, inhibiting cell proliferation, growth, and EMT induction in C-33A and HeLa CC cells [17]. This molecular sponge-like activity is thus vital to the regulation of miR-19a-3p expression, in turn affecting the expression of its target mRNAs. In our study, the lncRNA BDNF-AS was identified as a potential direct target of miR-19a-3p. Consistently, we found that BDNF-AS expression was decreased in CC and negatively correlated with miR-19a-3p expression in CC cell lines and patient samples. These data suggest a potential miR-19a-3p/BDNF-AS axis in CC. However, these results will require experimental validation through miR-19a-3p knockdown, miR-19a-3p overexpression, and luciferase reporter assays in CC cell lines to formally test this hypothesis.
BDNF-AS acts as a tumor suppressor lncRNA in several types of cancers [65, 66]. For example, one study reported that this lncRNA is downregulated in CC tissue samples and CC cell lines. In addition, BDNF-AS overexpression has been shown to limit the proliferation and migration of SiHa and DoTc2-4510 CC cell lines, in addition to suppressing tumor growth, while BDNF expression rescues the effects of BDNF-AS in these CC cell lines, suggesting that BDNF-AS acts as a tumor suppressor lncRNA in CC [51]. Consistently, we detected low levels of BDNF-AS expression in CC tissue samples from three independent RNA-seq and microarray datasets.
In addition, ROC curve analysis suggested that BDNF-AS expression may offer value as a diagnostic and prognostic biomarker in patients with CC, although independent cohort validation will be important. The potential value of BDNF-AS expression as a diagnostic and prognostic biomarker in CC patient blood samples will be of particular interest, given that this is a non-invasive analytical approach.
Moreover, KEGG and biological process analyses of genes correlated with BDNF-AS expression in CC revealed several important signaling pathways involved in this cancer type, including the Glycolysis/Gluconeogenesis, Cellular senescence, TNF signaling, Hedgehog signaling, Proteoglycans in cancer, and Central carbon metabolism in cancer pathways, as well as relevant biological processes. Several studies have emphasized the oncogenic role of these pathways in CC [67, 68, 69, 70, 71]. For example, the Hedgehog signaling pathway is vital to growth, invasion, metastasis, recurrence, drug resistance, and radioresistance in advanced CC [69]. Our results thus offer novel evidence that BDNF-AS reexpression may inhibit proliferation, migration and invasion through the suppresion of these pathways in CC. Future research will be necessary to test this hypothesis through functional assays in the context of BDNF-AS overexpression in CC cell lines. Strikingly, when we classified CC patients according to BDNF-AS expression and identified DEGs between samples with low and high levels of BDNF-AS expression, subsequent pathway analysis suggested that CC patients with high BDNF-AS levels exhibit the suppression of mTORC1 signaling and IL6/JAK/STAT3 signaling. Consistently, these pathways have been shown to be central to the promotion of CC development. For example, JAK/STAT3 signaling promotes CC tumor progression and metastatic development [72]. These findings are of particular clinical relevance given that they offer an opportunity for CC patient treatment with different therapeutic approaches based on the level of BDNF-AS expression, potentially impacting the prognosis of the disease.
In this study, we identified a potential miR-19a-3p/BDNF-AS regulatory axis, which, if validated, could have relevant biological and clinical implications as evidenced by the results of our pathway and process analyses. Together, our results enrich our current understanding of CC biology.
Our present findings are robust, as they were obtained using comprehensive databases and exhibited substantial consistency across datasets. However, all our results remain to be experimentally validated in vitro and in vivo. For example, the pathological relevance of the miR-19a-3p/BDNF-AS potential axis remains to be validated to confirm direct regulatory activity using luciferase reporter assays. Future studies are thus necessary to confirm our bioinformatic results.
In conclusion, our bioinformatic results suggest that miR-19a-3p may act as an oncomiR in CC. Moreover, our data suggest that this miRNA may regulate BDNF-AS expression in this type of cancer. However, this putative miR-19a-3p/BDNF-AS regulatory axis requires further validation. Ultimately, our findings indicate that the expression of these ncRNAs may offer potential diagnostic and prognostic utility as biomarkers in patients with CC, pending validation in larger independent clinical cohorts.
CC, Cervical Cancer; miRNAs, microRNAs; lncRNA, Long non-coding RNAs; GLOBOCAN, Global Cancer Observatory: CANCER TODAY; BDNF-AS, Brain Derived Neurotrophic Factor-Antisense; HLA, Human Leukocyte Antigen; TCGA, The Cancer Genome Atlas; GEO, Gene Expression Omnibus; DEGs, Differentially Expressed Genes; IL6, Interleukin 6; STAT3, Signal Transducer and Activator of Transcription 3; JAK, Janus Kinase; AUC, Area Under the Curve; ROC, Receiver Operating Characteristic; TNF, Tumor Necrosis Factor; BP, Biological Processes; KEGG, Kyoto Encyclopedia of Genes and Genomes; circHIAT1, circular RNA Hippocampus Abundant Transcript 1; REST, RE1 Silencing Transcription Factor; ESR1, Estrogen Receptor 1; HPV, Human Papillomavirus; CI, Confidence Interval; mTORC1, Mechanistic Target Of Rapamycin Kinase 1; RNA-seq, RNA-sequencing; RBPMS-AS1, (RNA Binding Protein, MRNA Processing Factor)-Antisense 1; RT-qPCR, Real Time-quantitative Polymerase Chain Reaction; MAPK, Mitogen-Activated Protein Kinase; AKT, AKT Serine/Threonine Kinase; PLCL1, Phospholipase C Like 1 (Inactive); FoxO, Forkhead Box O; HR, Hazard Ratio; FPKM, Fragments Per Kilobase of exon per Million mapped reads; STRING, Search Tool for the Retrieval of Interacting Genes/Proteins; PPI, Protein-Protein Interaction; miRDB, miRNAs Data Base; ENCORI/starBase, Encyclopedia of RNA Interactomes; MSigDB, Molecular Signatures Database; GAPDH, Glyceraldehyde-3-Phosphate Dehydrogenase; FC, Fold Change.
The data presented in this study are available in miR-TV, OncoDB and GEO databases at https://mirtv.ibms.sinica.edu.tw/, https://oncodb.org/, and https://www.ncbi.nlm.nih.gov/geo/ with the reference number [19, 20] and [21, 22, 23, 24, 25, 26, 27], respectively. The datasets used and analyzed during the current study are available from the corresponding author on reasonable request.
HJW and EGSB: conceptualization. RAA, JOO, AAI, AFR: methodology. FITR, RDM and FDBA: validation. RAA, AAI and GECV: formal analysis. RAA and JAM: investigation. RDM, GECV and RAA: data curation. RAA, AAI and HJW: writing—original draft preparation. EGSB: writing—review and editing. HJW and EGSB: supervision. All authors contributed to editorial changes in the manuscript. All authors read and approved the final manuscript. All authors have participated sufficiently in the work and agreed to be accountable for all aspects of the work.
Not applicable.
Not applicable.
This research received no external funding.
The authors declare no conflicts of interest.
Supplementary material associated with this article can be found, in the online version, at https://doi.org/10.31083/FBL51227.
References
Publisher’s Note: IMR Press stays neutral with regard to jurisdictional claims in published maps and institutional affiliations.