
 , Jekhan Andimadam Madana Saravanan 1,2,†, Azam Ali 2,3, Rajesh Katare 1,*
1 Department of Physiology, Heart Otago, School of Biomedical Sciences, University of Otago, 9016 Otago, New Zealand
2 Centre of Bioengineering and Nanomedicine, Faculty of Dentistry, University of Otago, 9016 Otago, New Zealand
3 Sir John Walsh Research Institute, Department of Oral Rehabilitation, Faculty of Dentistry, University of Otago, 9016 Otago, New Zealand
†These authors contributed equally.
Abstract
Impaired wound healing represents a significant clinical challenge. Persistent inflammation, excessive reactive oxygen species, and impaired angiogenesis are key mechanisms underlying nonhealing ulcers. We developed a multifunctional bioscaffold incorporating natural bioactive compounds as a mechanistic therapeutic strategy.
Polyvinyl alcohol and silk fibroin formed the scaffold matrix, blended with Manuka honey, fenugreek seed extract, and Ghrelin for their antioxidant and proangiogenic properties.
Scanning electron microscopy revealed defect-free nanofibers with diameters below 200 nm. Fourier-transform infrared analysis confirmed successful incorporation of the bioactive components, indicating effective interactions within the polyvinyl alcohol (PVA)-silk fibroin (SF) matrix. Thermal analysis demonstrated improved thermal stability upon addition of the bioactive agents. The 3-(4,5-dimethylthiazol-2-yl)-2,5-diphenyltetrazolium bromide (MTT) assay confirmed the absence of toxicity. Scratch assays confirmed enhanced migration of human umbilical vein endothelial cells, supporting the scaffold’s angiogenic potential. Additionally, the scaffold exhibited superior antioxidant activity and significantly improved cell proliferation.
These findings demonstrate that the developed bioscaffold integrates antioxidant and proangiogenic properties, making it a promising candidate for various biomedical applications, particularly in wound dressings, drug delivery, tissue engineering, and biosensing.
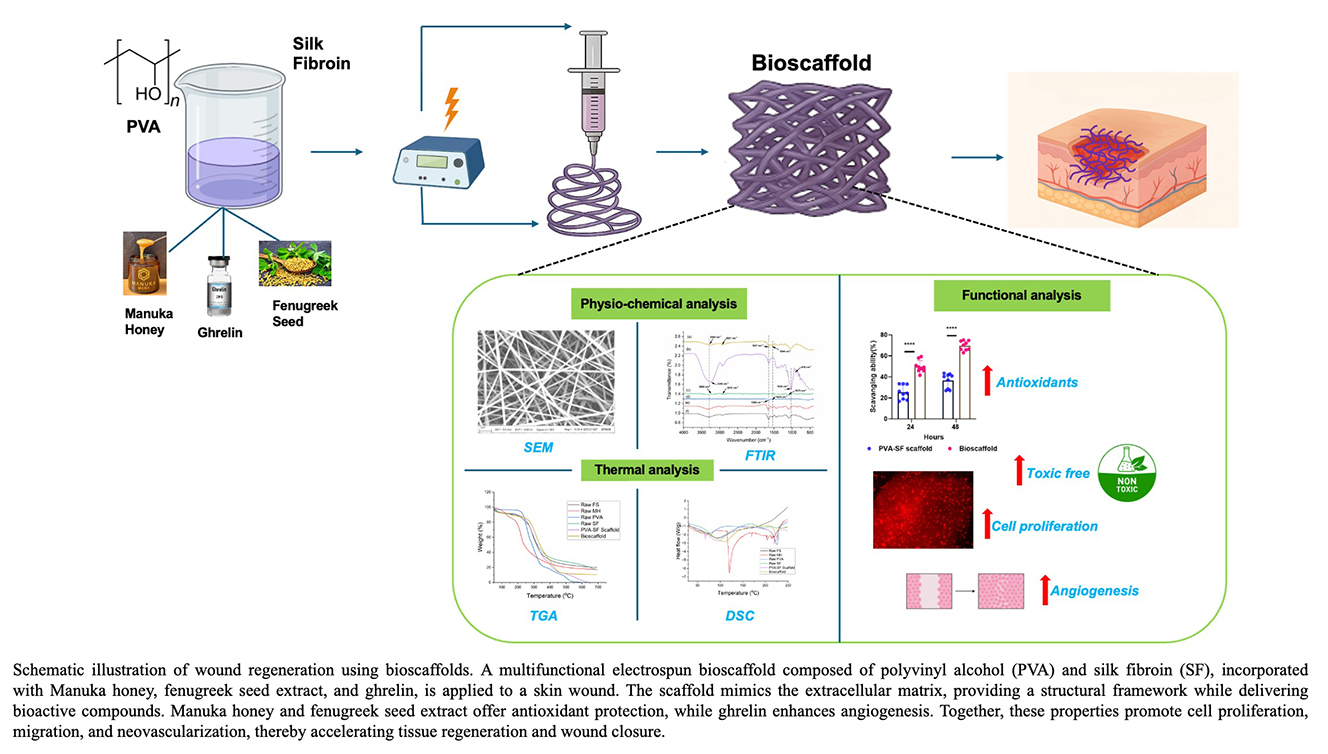
Graphical Abstract
Keywords
- wound healing
- nanofibers
- Manuka honey
- fenugreek seeds
- ghrelin
- angiogenesis
- reactive oxygen species
Skin injury is one of the most common clinical conditions requiring timely intervention to prevent further infection. Skin wounds represent a significant clinical and healthcare challenge, affecting an estimated 1–2% of individuals in developed countries over their lifetime [1]. As our population continues to age, along with the increasing prevalence of conditions such as diabetes and hypertension, it is important to address the expected rise in nonhealing wounds [2], especially since they are associated with increased reactive oxygen species (ROS), persistent infection [3], prolonged inflammation, impaired angiogenesis, and high tendency for secondary infection [4]. Current treatments, such as skin grafts and allografts, are ineffective when associated with comorbidities, in addition to complications such as organ rejection [5]. On the other hand, traditional wound care treatments such as medical bandages, wound dressings, debridement, hydrotherapy, and antibiotics primarily reduce the severity rather than promote wound healing. Therefore, there is an urgent need to explore alternative solutions that promote effective tissue regeneration.
Recent studies highlight the promise of natural bioactive compounds and biomaterials in enhancing wound healing and tissue regeneration [6, 7]. Effective healing relies on coordinated processes, including inflammation, cell proliferation, extracellular matrix formation, and tissue remodelling. Natural compounds can support these processes by creating a bioactive environment that promotes tissue repair when incorporated into scaffolds or dressings. Manuka honey, rich in methylglyoxal, hydrogen peroxide, phenolics, and flavonoids, exhibits antimicrobial, antioxidant, and tissue-repair properties. It promotes fibroblast proliferation, angiogenesis, and collagen deposition, while its low pH and osmotic effects help maintain a moist, infection-resistant wound environment [8, 9]. Fenugreek seeds contain flavonoids, alkaloids, saponins, and polysaccharides that provide antioxidant, anti-inflammatory, and antimicrobial effects. These compounds regulate inflammation, enhance fibroblast activity, support collagen synthesis, and improve moisture retention, all of which contribute to effective healing [10, 11]. In addition to plant-derived compounds, the peptide hormone ghrelin shows strong therapeutic potential due to its anti-inflammatory and proangiogenic properties [12]. It stimulates fibroblast proliferation and vascularisation, improving oxygen and nutrient delivery to healing tissues [13]. Because wound healing involves multiple biological pathways, targeting a single mechanism is often insufficient. Combining Ghrelin with natural bioactive compounds in biomaterial-based scaffolds or dressings offers a promising strategy to enhance tissue regeneration and improve wound-care outcomes.
One of the major challenges in wound healing is delivering therapeutic substances to the wound site and ensuring their stability. A potential solution to these challenges involves using engineered biodegradable polymeric scaffolds that mimic the native tissue. These scaffolds can be tailored to incorporate bioactive components, thereby enabling prolonged, targeted delivery and enhancing their therapeutic effects. Further, bioscaffolds enable interactions between cells and the extracellular matrix (ECM), which drive cellular behaviour and tissue formation [14, 15]. Thus, creating a scaffold that replicates the in vivo architecture of the cells is likely to be beneficial for tissue regeneration [16]. Among several polymers, silk fibroin (SF), a natural protein polymer derived from the Bombyx mori silkworm [17], and polyvinyl alcohol (PVA) [18], a synthetic polymer known for its excellent nanofiber-forming ability, have been widely tested for their efficacy in wound healing. A recent study reported that nanosilver incorporated PVA fibres exhibit stable morphology and good biodegradability. These results underscore the PVA’s suitability for advanced wound dressings [19]. Also, recent studies have shown that Bombyx mori silkworm fibroin (SF) can effectively filter blood toxins, demonstrating its potential as a promising hemosorbent [20, 21]. Hence, combining these natural and synthetic materials into the composite scaffold will gradually increase its biological and thermochemical properties. Previous studies demonstrated that these biodegradable compounds promote accelerated wound healing, attributed to their enhanced degradation stability and excellent cytocompatibility [22, 23].
In this study, we developed a PVA-SF blend nanofiber incorporating natural compounds (Manuka honey and Fenugreek seeds) and the peptide hormone Ghrelin. The scaffold was thoroughly characterized to confirm successful polymer blending, structural stability, and thermal behaviour. Scanning electron microscopy (SEM), Fourier transform infrared spectroscopy (FTIR), thermogravimetric analysis (TGA), and differential scanning calorimetry (DSC) were performed to study the structural and physico-thermal properties of the scaffolds. In vitro assays were conducted to evaluate its antioxidant performance, angiogenic potential, and cytocompatibility toward skin-relevant cells. Together, these analyses demonstrate the potential of the developed bioscaffold to support and accelerate skin wound regeneration through a combination of antioxidant protection and enhanced vascularisation.
Polymers: PVA (molecular weight = 89,000–98,000), 99+% hydrolyzed, was purchased from Sigma-Aldrich, and SF was purchased from Xi’an Herbking Biotechnology (Gaoxin District, Xi’an, Shaanxi, China). The peptide hormone Ghrelin was obtained from Tocris (Batch number: 22a1463, Tocris Bioscience, Bristol, UK) and was kindly gifted by Prof Daryl Schwenke (University of Otago). Manuka honey was kindly gifted by ManukaMed (ref: MM0051C, Manuka Med (Gentell company), Masterton, Wellington region, New Zealand), and fenugreek seeds (Batch no: MZ/MF/23365, Indian Heritage, India) were purchased from the supermarket. Manuka honey was dissolved in the aqueous phase of fenugreek seed; Fenugreek seed powder and Ghrelin were dissolved in MilliQ water. All cell lines were validated by STR profiling and tested negative for mycoplasma.
Polymer solutions for electrospinning were prepared by dissolving PVA and SF at various concentrations and ratios (70:30, 80:20, and 50:50, respectively) in MilliQ water. The mixtures were continuously stirred at 80–85 °C until a homogenous solution was achieved. As PVA is a temperature-sensitive polymer, the solutions were carefully monitored and maintained within this temperature range to preserve polymer stability and ensure reproducible electrospinning performance.
The final bioscaffold formulation used for electrospinning was prepared by dissolving 2.5 g of PVA and 2.5 g of Silk fibroin in 23 mL of MilliQ water. Subsequently, 2% Manuka honey, 20 µg of Ghrelin, and 2 mL of the aqueous phase of fenugreek seed extract phase were incorporated into the polymer solution to obtain a final volume of 25 mL. The selection of polymer concentrations and incorporation levels of the natural derivatives was primarily based on electrospinning feasibility, including stable jet formation, spinning duration, uniform fibre morphology, scaffold integrity, and overall biocompatibility, rather than on achieving a predefined therapeutic dose for a specific wound area. Preliminary electrospinning formulation trials were conducted to identify concentrations that ensured consistent jet stability and uniform nanofiber formation without bead defects (Supplementary Figs. 1–3). For the bioactive components, incorporation levels were guided by ranges reported in the literature that preserve biological activity while maintaining fibre uniformity [13, 24, 25].
The viscosity of the solutions with different ratios was measured using a Discovery Hybrid HR-3 Rheometer (TA Instruments, Newcastle, DE, USA) equipped with an MP61 liquid temperature control device at 20 °C, with cone-plate geometry (40 mm diameter and 1° angle), as described earlier [26].
PVA-SF nanofiber scaffold and bioscaffold (combination of PVA-SF and natural compounds) were fabricated using an electrospinning device (TL-BM, Tong Li Tech Co., Ltd., Nanshan District, Shenzhen, Guangdong, China) with the following conditions: voltage ranging from 8–20 kV, needle to tip collector distance of 11–17 cm and flow rate between 1.2–2.5 mL/h. The parameters were decided following optimization using previously established parameters (Supplementary Figs. 1–3). A 22-gauge needle was used for spinning, and the whole process was carried out at room temperature. The nanofibrous scaffold was collected on aluminium foil wrapped around the collector. After fabrication, the scaffolds were stored in a desiccator until the assay.
The surface morphology of the PVA-SF and bioscaffold was examined using field
emission scanning electron microscopy (JEOL 6700F FE-SEM, JEOL Ltd., Tokyo,
Japan). Each scaffold was placed onto a double-sided carbon tape mounted on a
metal stub prior to scanning; scaffolds were coated with a 10 nm layer of gold
palladium in an Emitech K575X peltier-cooled high-resolution sputter coater (EM
Technologies Ltd, Kent, England). Images were captured at 1000
ATR-FTIR was used to confirm the presence of functional groups in the raw
materials and scaffolds. Scaffolds measuring 1
The degradation rate of the scaffolds was determined using the weight loss method. The scaffolds were cut into small circles of 8 mm diameter using a biopsy puncher (Miltex biopsy punch, Capes Medical, NZ). After recording the initial weight (W1) of the samples, they were placed in a test tube filled with 10 mL PBS and allowed to degrade for different time points (7, 14, 28 days). At each time point, the sample was removed, air-dried for 24 hours, and weighed again (W2). The percentage of scaffold degradation was calculated using the following equation.
Degradation %
2.5.4.1 TGA
TGA was performed to analyse the thermal stability and thermal decomposition of the prepared scaffolds and raw materials using a Q50 TGA analyser (TA Instruments, New Castle, DE, USA). The platinum sample pan (TA Instruments, DE, USA) was loaded with approximately 5–10 mg of sample and heated from 20 °C to 700 °C at a constant heating rate of 10 °C/min under a N2 supply at a flow rate of 20 mL/min. The TRIOS software (TA Universal Analysis 2000 V4.OC, TA Instruments) was used to obtain the data, and OriginPro software (OriginLab, Version 2025b(10.25), MA, USA) was used to analyze and plot the graphs.
2.5.4.2 Differential Scanning Calorimetry (DSC)
The thermal responses of pure PVA, SF, Manuka honey, fenugreek seeds, and scaffolds were determined using a Q1000 differential scanning calorimeter (TA Instruments, New Castle, DE, USA). Approximately 2–6 mg of each sample was weighed into a standard aluminium DSC pan and crimped with a pin-holed standard aluminium lid. The samples were heated from 10 to 300 °C at a controlled rate of 10 °C/min under a dynamic nitrogen atmosphere of 50 mL/min. The DSC data were analyzed using TA Universal Analysis 2000 V4.OC software and OriginPro software were used to analyze and plot the graphs.
2.5.4.3 In Vitro Release Studies
To determine the in vitro cumulative release behaviour of the electrospun bioscaffolds, 10 mg of bioscaffold was immersed in 3 mL of PBS (pH 7.4) and incubated at 37 °C under gentle shaking to simulate physiological conditions. The release medium (0.3 mL) was withdrawn at predetermined time intervals and replaced with an equal volume of fresh PBS. The amount of released bioactive compounds was determined using UV-visible spectrophotometry at the predetermined wavelengths of 310 nm and 330 nm corresponding to the loaded components. The release concentration at each time point (Cₜ) was calculated from the calibration curve of standard solutions. All measurements were performed in triplicate.
The intrinsic antioxidant property of the nanofibrous scaffolds was evaluated using the 1,1-diphenyl-2-picrylhydrazyl (DPPH) assay (Sigma-Aldrich, Molecular weight 394.32 Da). Briefly, a 0.2 mM DPPH solution was prepared by dissolving 7.88 mg of DPPH powder in 100 mL of 99% methanol. For the assay, 5 mg of each scaffold sample was mixed with 1.5 mL of the prepared DPPH solution and incubated at room temperature. The absorbance of the mixture was recorded at 517 nm using a microplate reader (SpectraMax® i3X, catalog number: MDMR-004, CA, USA) at 24 and 48 hours. The DPPH radical scavenging activity was calculated using the following equation:
DPPH (%) = (Acontrol–Asample) / Acontrol
where Acontrol is the absorbance of DPPH radical in methanol, and Asample is the absorbance of DPPH radical plus sample extract.
The cytotoxicity of the scaffold was evaluated using the human umbilical vein endothelial cell line (HUVECs, Thermo Fisher Scientific Limited, New Zealand) and the human keratinocyte cell line (HaCaT, ATCC® CRL-2404) using the CellTiter 96® non-radioactive cell proliferation assay Kit (3-(4,5-dimethylthiazol-2-yl)-2,5-diphenyltetrazolium bromide (MTT), Promega Corporation, Madison, WI, USA). HUVECs were cultured in endothelial basal medium (M200, ThermoFisher), supplemented with a low serum growth supplement (ThermoFisher), 10% Fetal bovine serum (FBS), and 1X Antibiotic-Antimycotic (ThermoFisher). HaCaT cells were cultured in Dulbecco’s Modified Eagle medium (DMEM), supplemented with 10% FBS and 1X Antibiotic-Antimycotic (ThermoFisher). Both cell lines were maintained at 37 °C, 5% CO2, and 95% humidity. For the assay, cells were seeded at a concentration of 10,000 cells/well in 100 µL of complete growth medium in a sterile 96-well flat-bottomed plate (Falcon plate, Corning Coster, USA) and incubated at 37 °C for 24 hours to allow for cell adherence. The following day, 8 mm UV-treated (30 min) scaffolds (PVA-SF scaffold or bioscaffold) were placed directly into the wells and the cells were cultured for an additional 72 hours. For this study, cytotoxicity was monitored only up to 72 hours, a widely recognized standard time point for evaluating acute cell viability on biomaterials [29].
This duration was sufficient to assess the initial biocompatibility and detect any immediate cytotoxic effects of the scaffold components, including PVA, SF, and the incorporated bioactive compounds. Cells without a scaffold served as the control. At the conclusion of the treatment period, the growth media were carefully removed, and cells were gently washed three times with PBS (PH 7.4). Next, 100 µL of PBS and 15 µL of MTT solution were added to each well, followed by a 4-hour incubation at 37 °C. The reaction was then stopped by adding a stop solution, followed by incubation for an additional 1 hour. Afterwards, the absorbance was measured at 570 nm using a microplate reader (SpectraMax® i3X). The MTT assay was performed in triplicate across three independent scaffolds, and cell viability was expressed as a percentage of viable cells relative to the negative control.
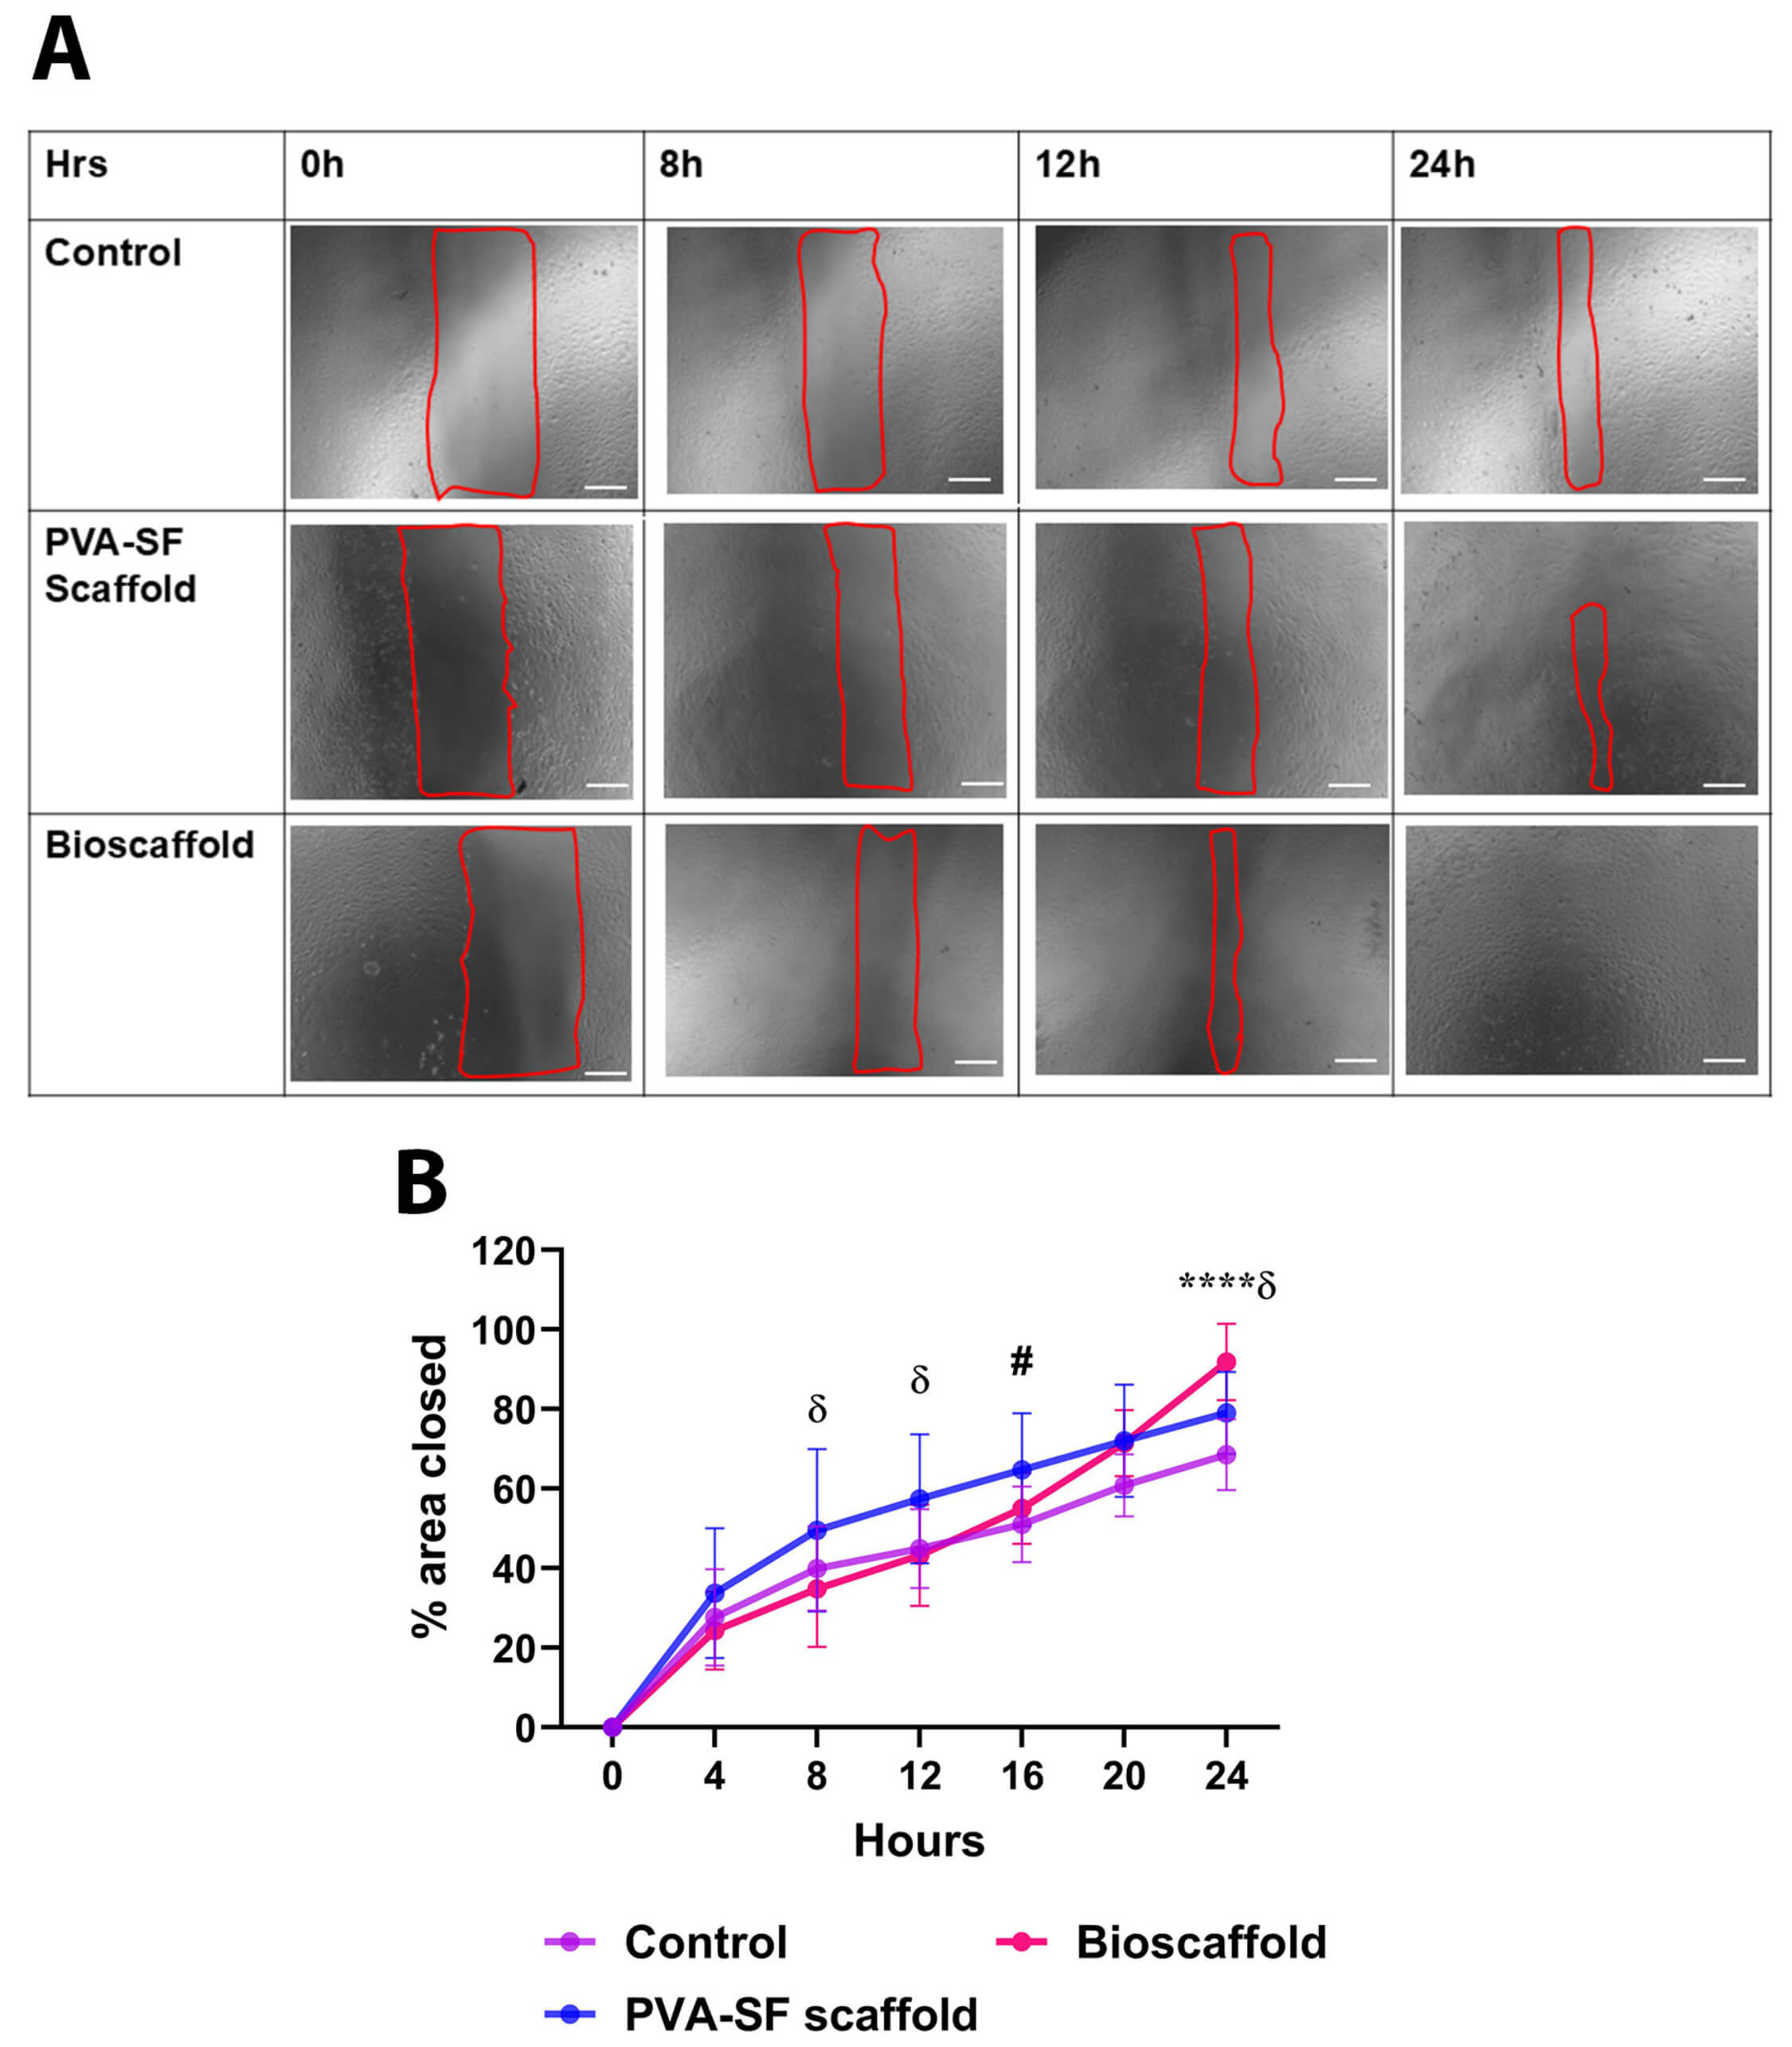
A scratch assay was conducted to determine the effect of the scaffold on HUVEC migration, as a measure of in vitro wound-healing properties. For this experiment, HUVECs were plated at 50,000 cells/well in complete M200 medium into a 24-well plate coated with fibronectin and cultured for 48 hours until the cells reached 90% confluence. Using light pressure, a scratch was created on the monolayer of cells in each well with the sharp end of a 200 µL pipette tip. The cells were then washed twice with PBS to remove cellular debris and replaced with fresh FBS-free M200 medium to ensure the observed wound closure was due to migration rather than proliferation. Subsequently, cell culture inserts with the scaffold and 300 µL FBS-free M200 media were placed on top of the well. Serial images were captured at baseline (time 0) and at 4, 8, 12, 16, and 24 hours after the scratch to monitor cell migration. The images were analyzed using the Wound-Healing Size Tool plugin in FIJI (NIH) to calculate the area not covered by cells. The wound area at each time point is expressed as a percentage of the initial area (time 0), eliminating bias from scratches of varying sizes.
The scratch area at each time point was measured using ImageJ software V1.54s (NIH, MD, USA), and the percentage of wound closure was calculated according to the following formula:
Initial scratch area is time 0 h, scratch area at time t – (4, 8, 12, 16, 20, and 24 h).
The scaffold’s efficacy in promoting cell growth was determined using the
cardiomyocytes (AC-16) cell line. AC-16 are immortalized human ventricular AC-16
received from Dr Mercy Davidson of Columbia University (Institutional Review
Board approval (IRB#X0592) [30]. AC-16 cells are widely used to study cellular
interactions and responses to biomaterials and oxidative stress [31]; hence, we
used AC-16 cells for our study. AC-16 cells were cultured in DMEM supplemented
with 10% FBS and 1% antibiotic-antimycotic. Once the cells reached confluency,
1
All the experiments were carried out in triplicate in different regions on 3
independent scaffolds, and the data were expressed as the mean
The viscosity of the spinning solution determines the surface morphology,
defect-free, and continuous formation of the nanofiber. Hence, the rheological
behaviour of the polymer solutions composed of PVA and SF at different ratios,
with and without the addition of natural components (Manuka honey, fenugreek
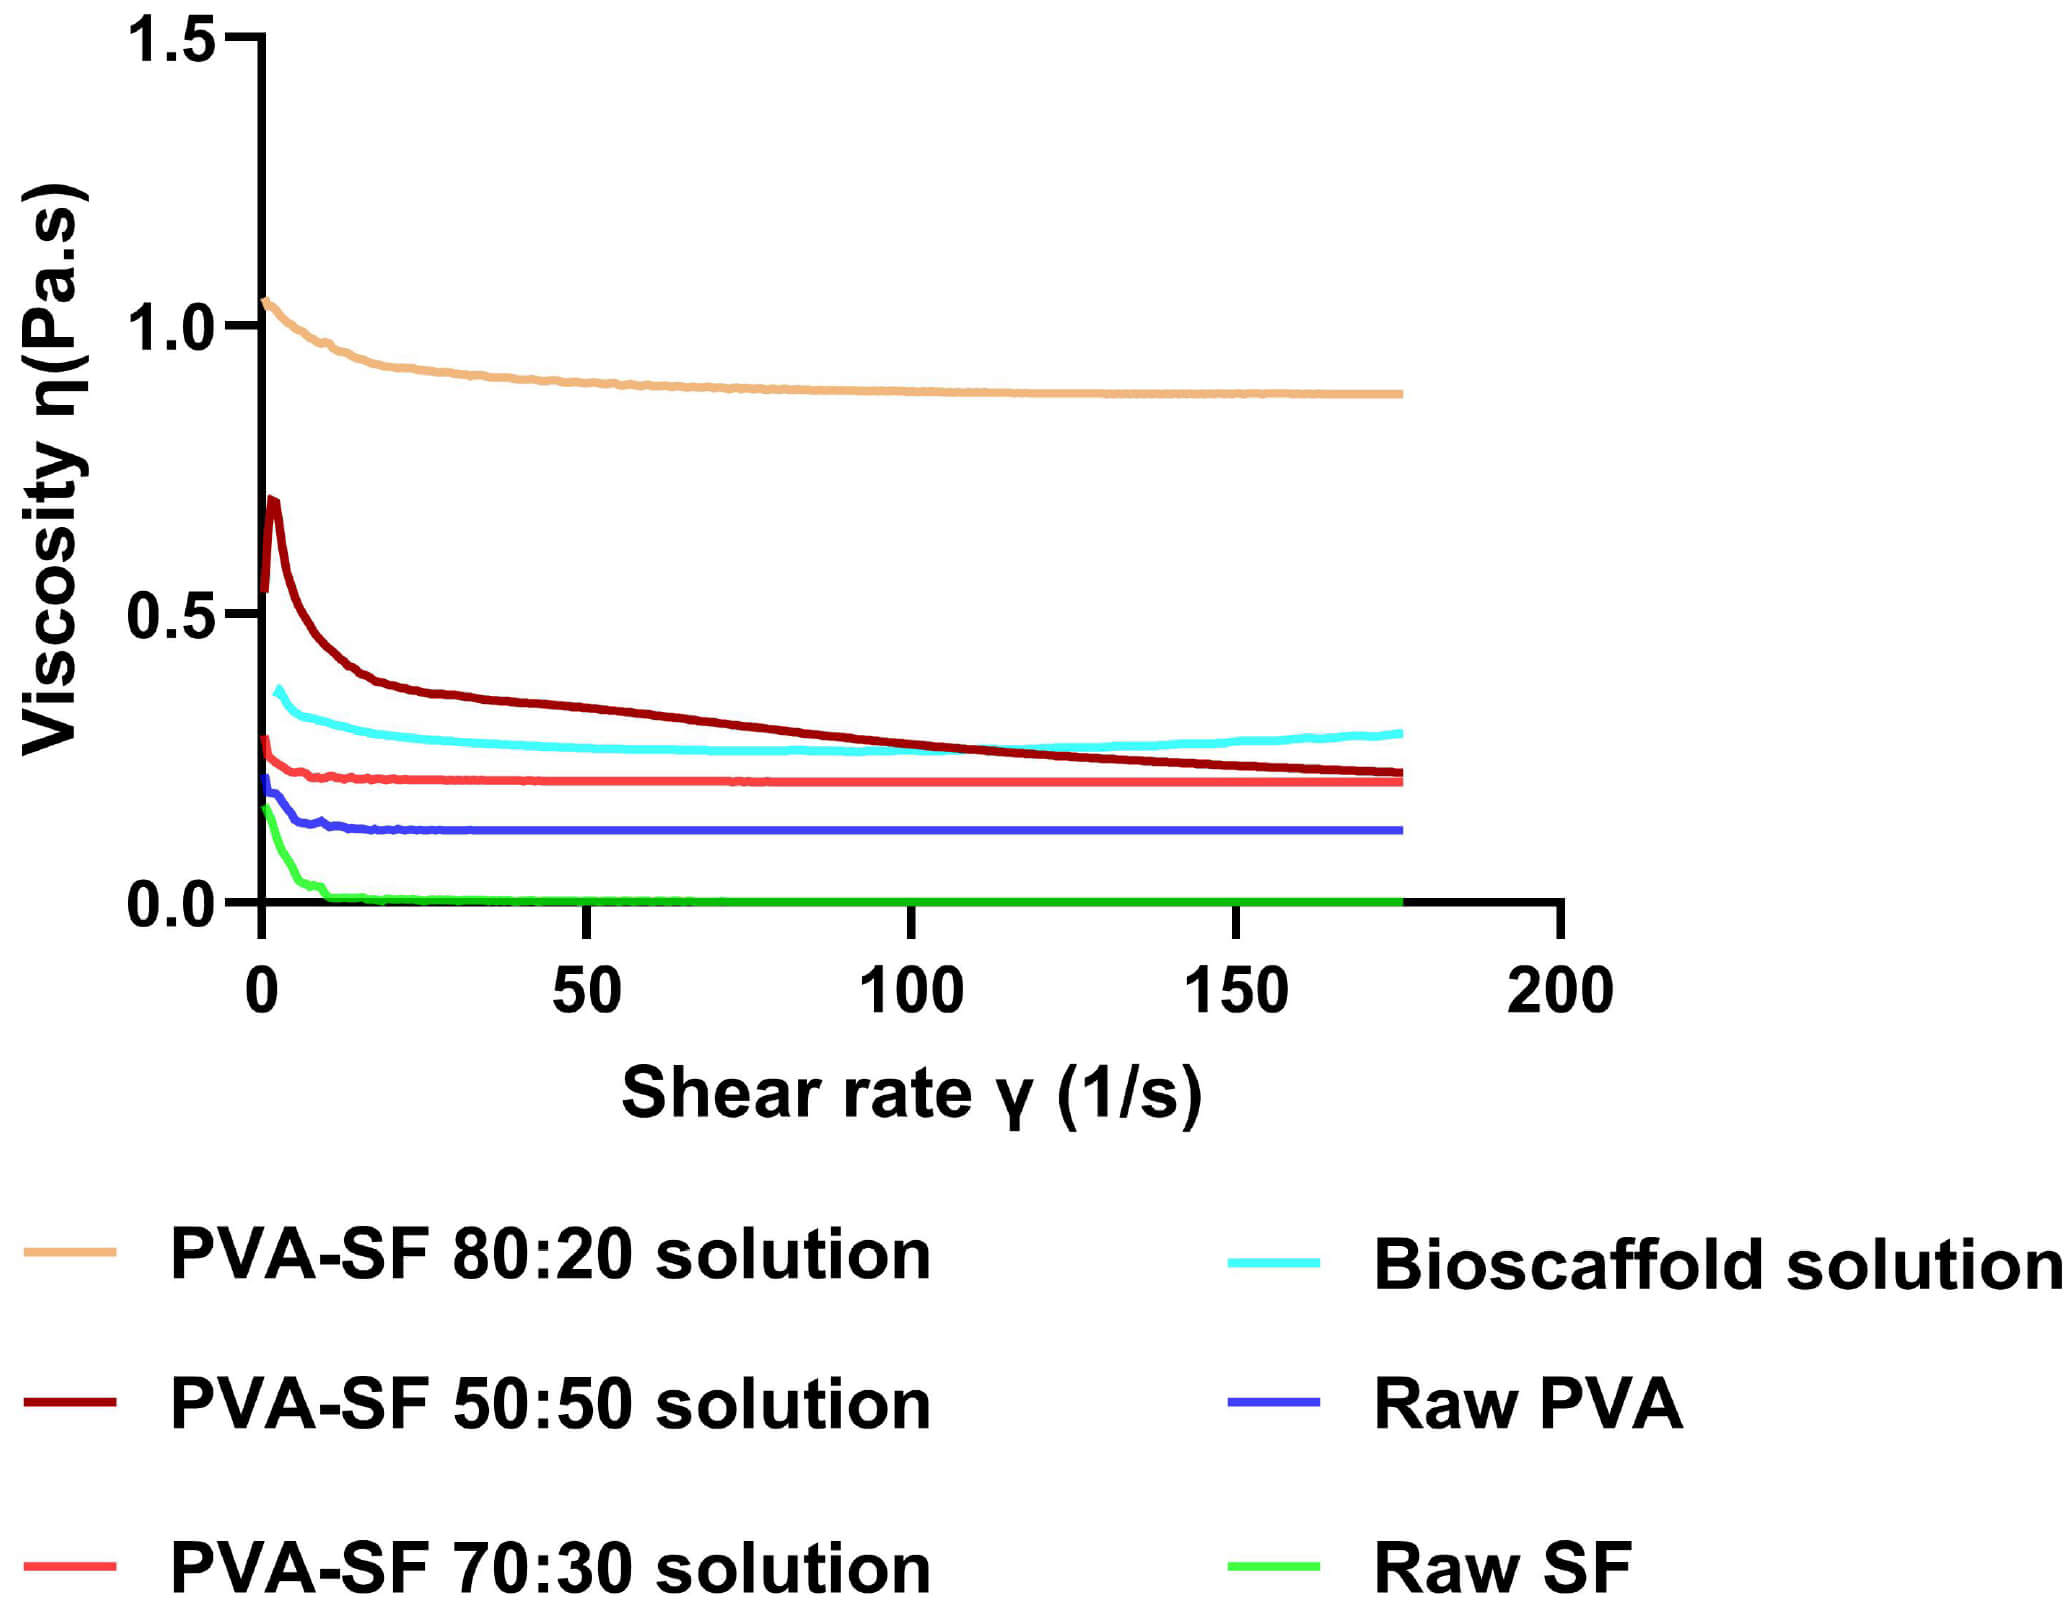
seed, Ghrelin), was investigated using a rheometer. As shown in Fig. 1 and
Supplementary Fig. 4, rheological analysis revealed that the PVA-SF 50:50 formulation exhibited more pronounced non-Newtonian behaviour than the other PVA-SF ratios, as reflected by changes in viscosity with increasing shear rate. Different ratios (70:30, 50:50, 80:20) showed a mixture of high and
low viscosity, depending on their composition. Among these, the PVA-SF 80:20
blend showed the highest viscosity of 1.05 Pa
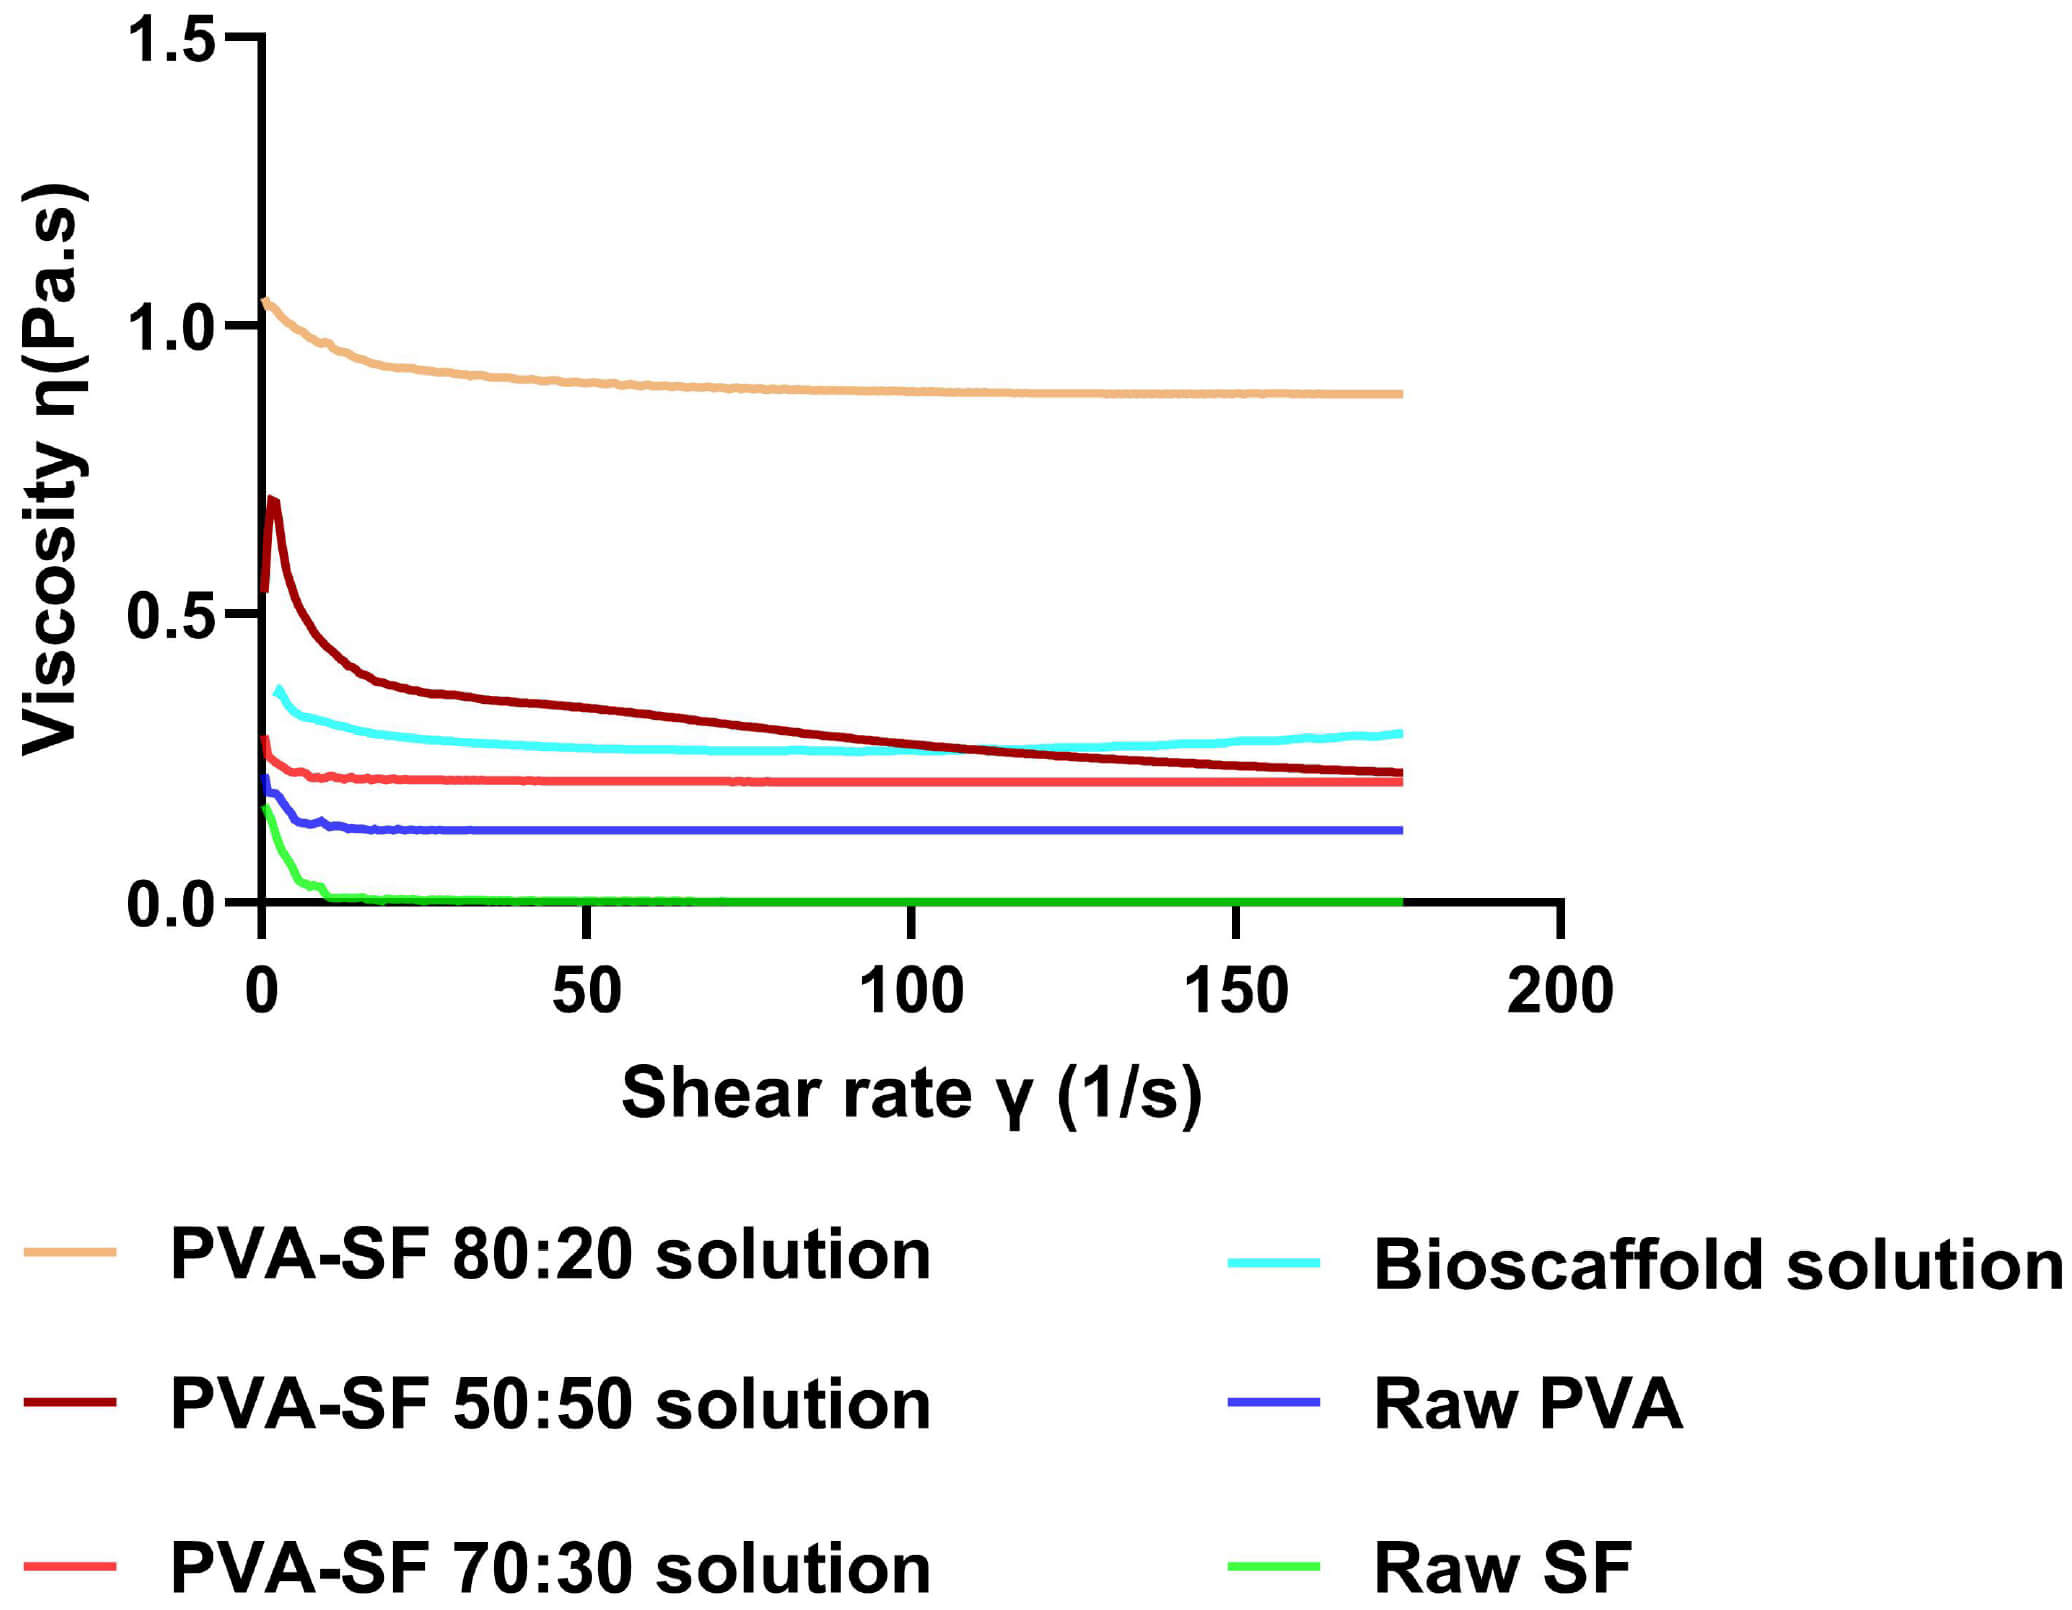 Fig. 1.
Rheology analysis of the spinning solution. The viscosity graph of Raw PVA, Raw SF and PVA-SF at ratios of 70:30, 80:20, PVA-SF 50:50, and after incorporating the natural components (bioscaffold). The PVA-SF 50:50 ratio and bioscaffold solution exhibited a non-Newtonian fluid behaviour, while other preparations exhibited Newtonian fluid behaviour. In the viscosity graphs, the X-axis represents the shear rate, and the Y-axis represents the viscosity. PVA, polyvinyl alcohol; SF, silk fibroin.
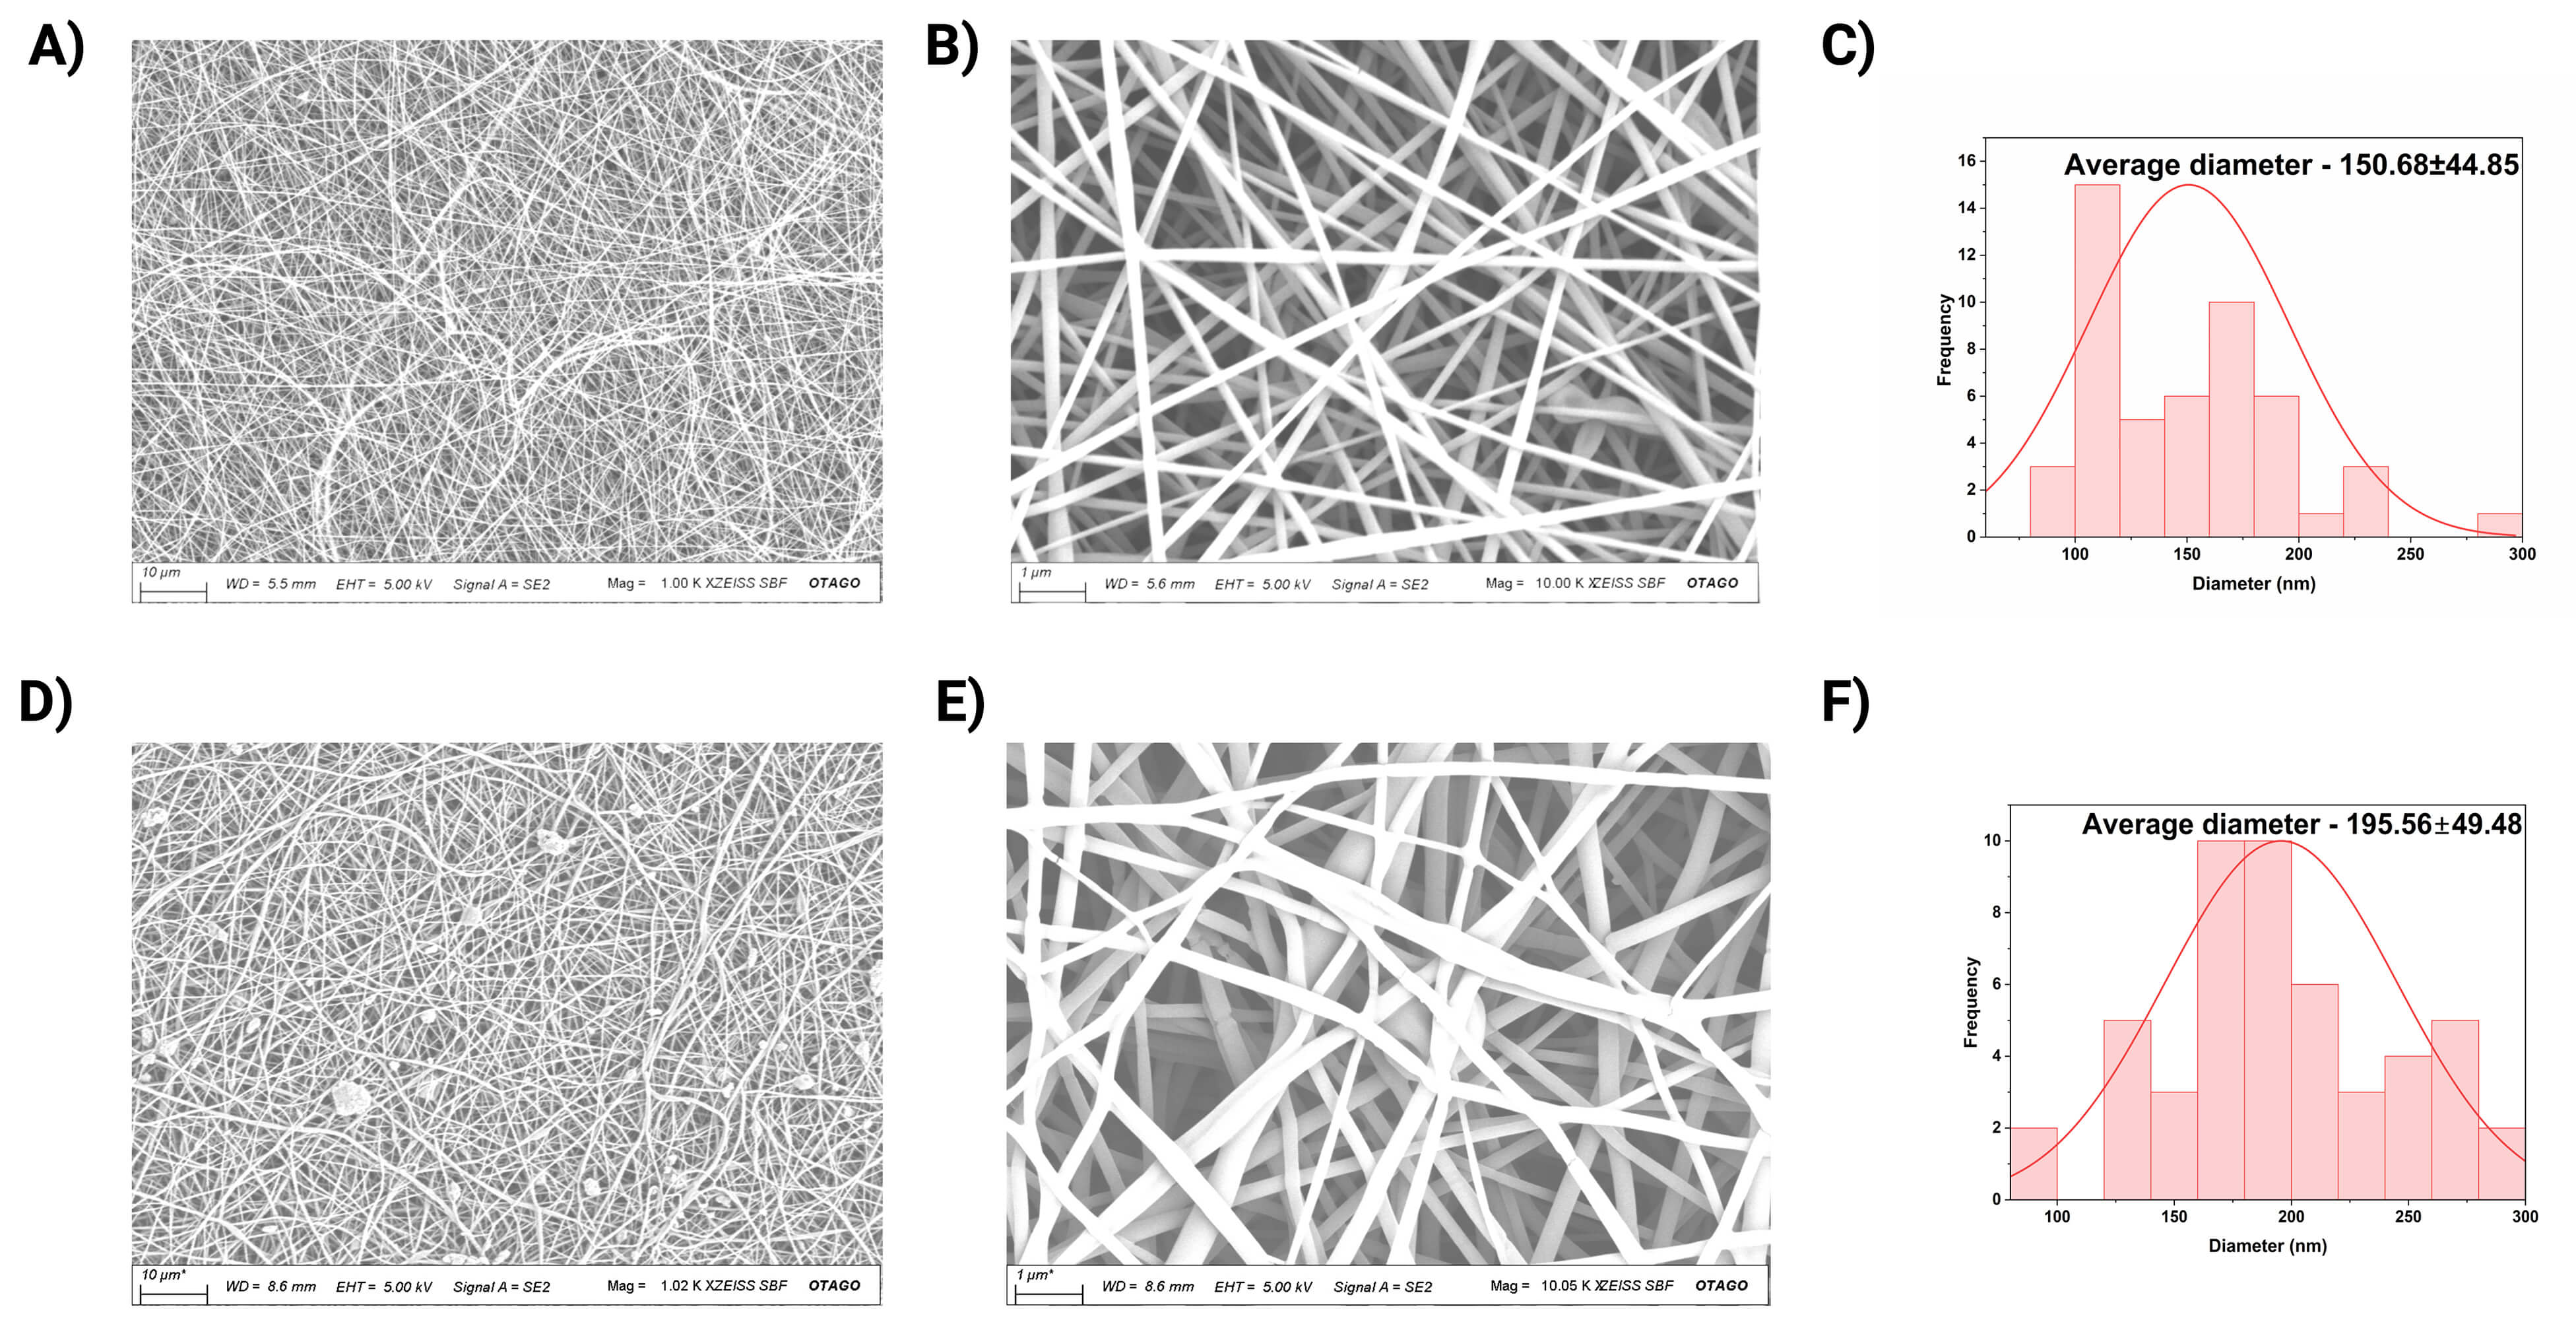
The SEM analysis of the fabricated bioscaffold confirmed the absence of any
major or minor defects apart from minimal nanoscale defects (Fig. 2A,B,D,E and
Supplementary Figs. 5,6). Quantitative analysis confirmed the fibre
diameter of PVA-SF scaffold was in the range 150.68 nm
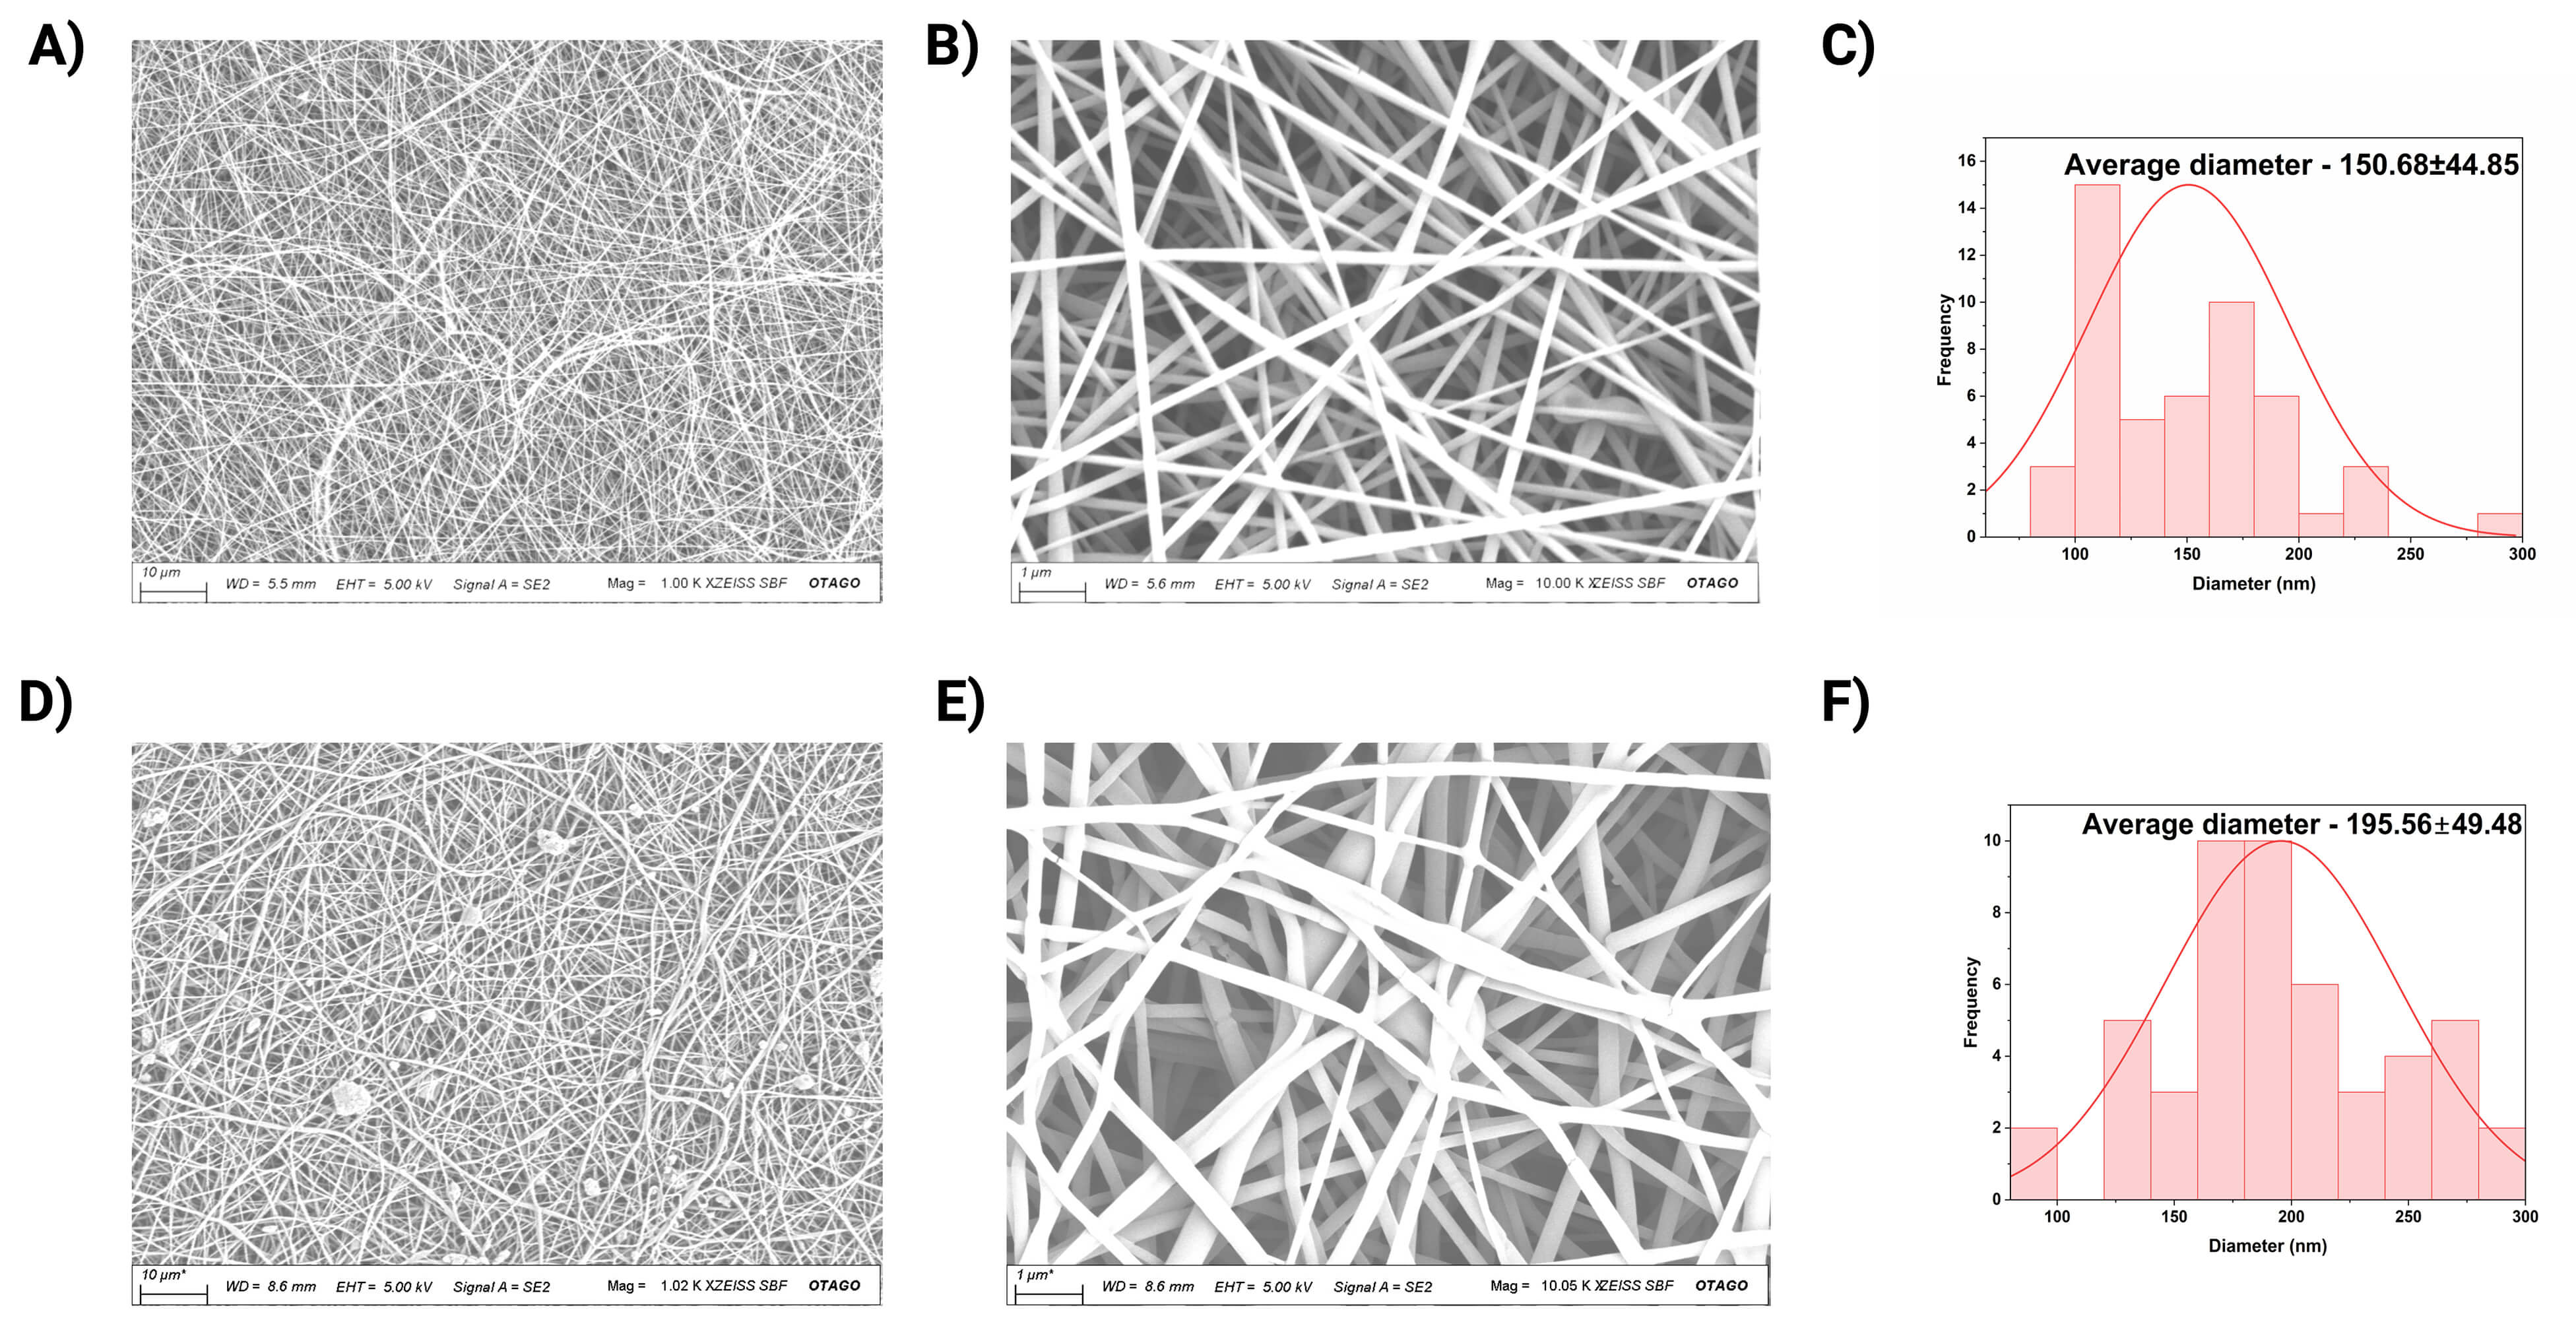 Fig. 2.
SEM analysis of the electrospun nanofibrous scaffolds.
(A,B,D,E) Representative SEM images of PVA-SF (A,B) and bioscaffold (D,E). Panels
(A) and (D) display images at 1000
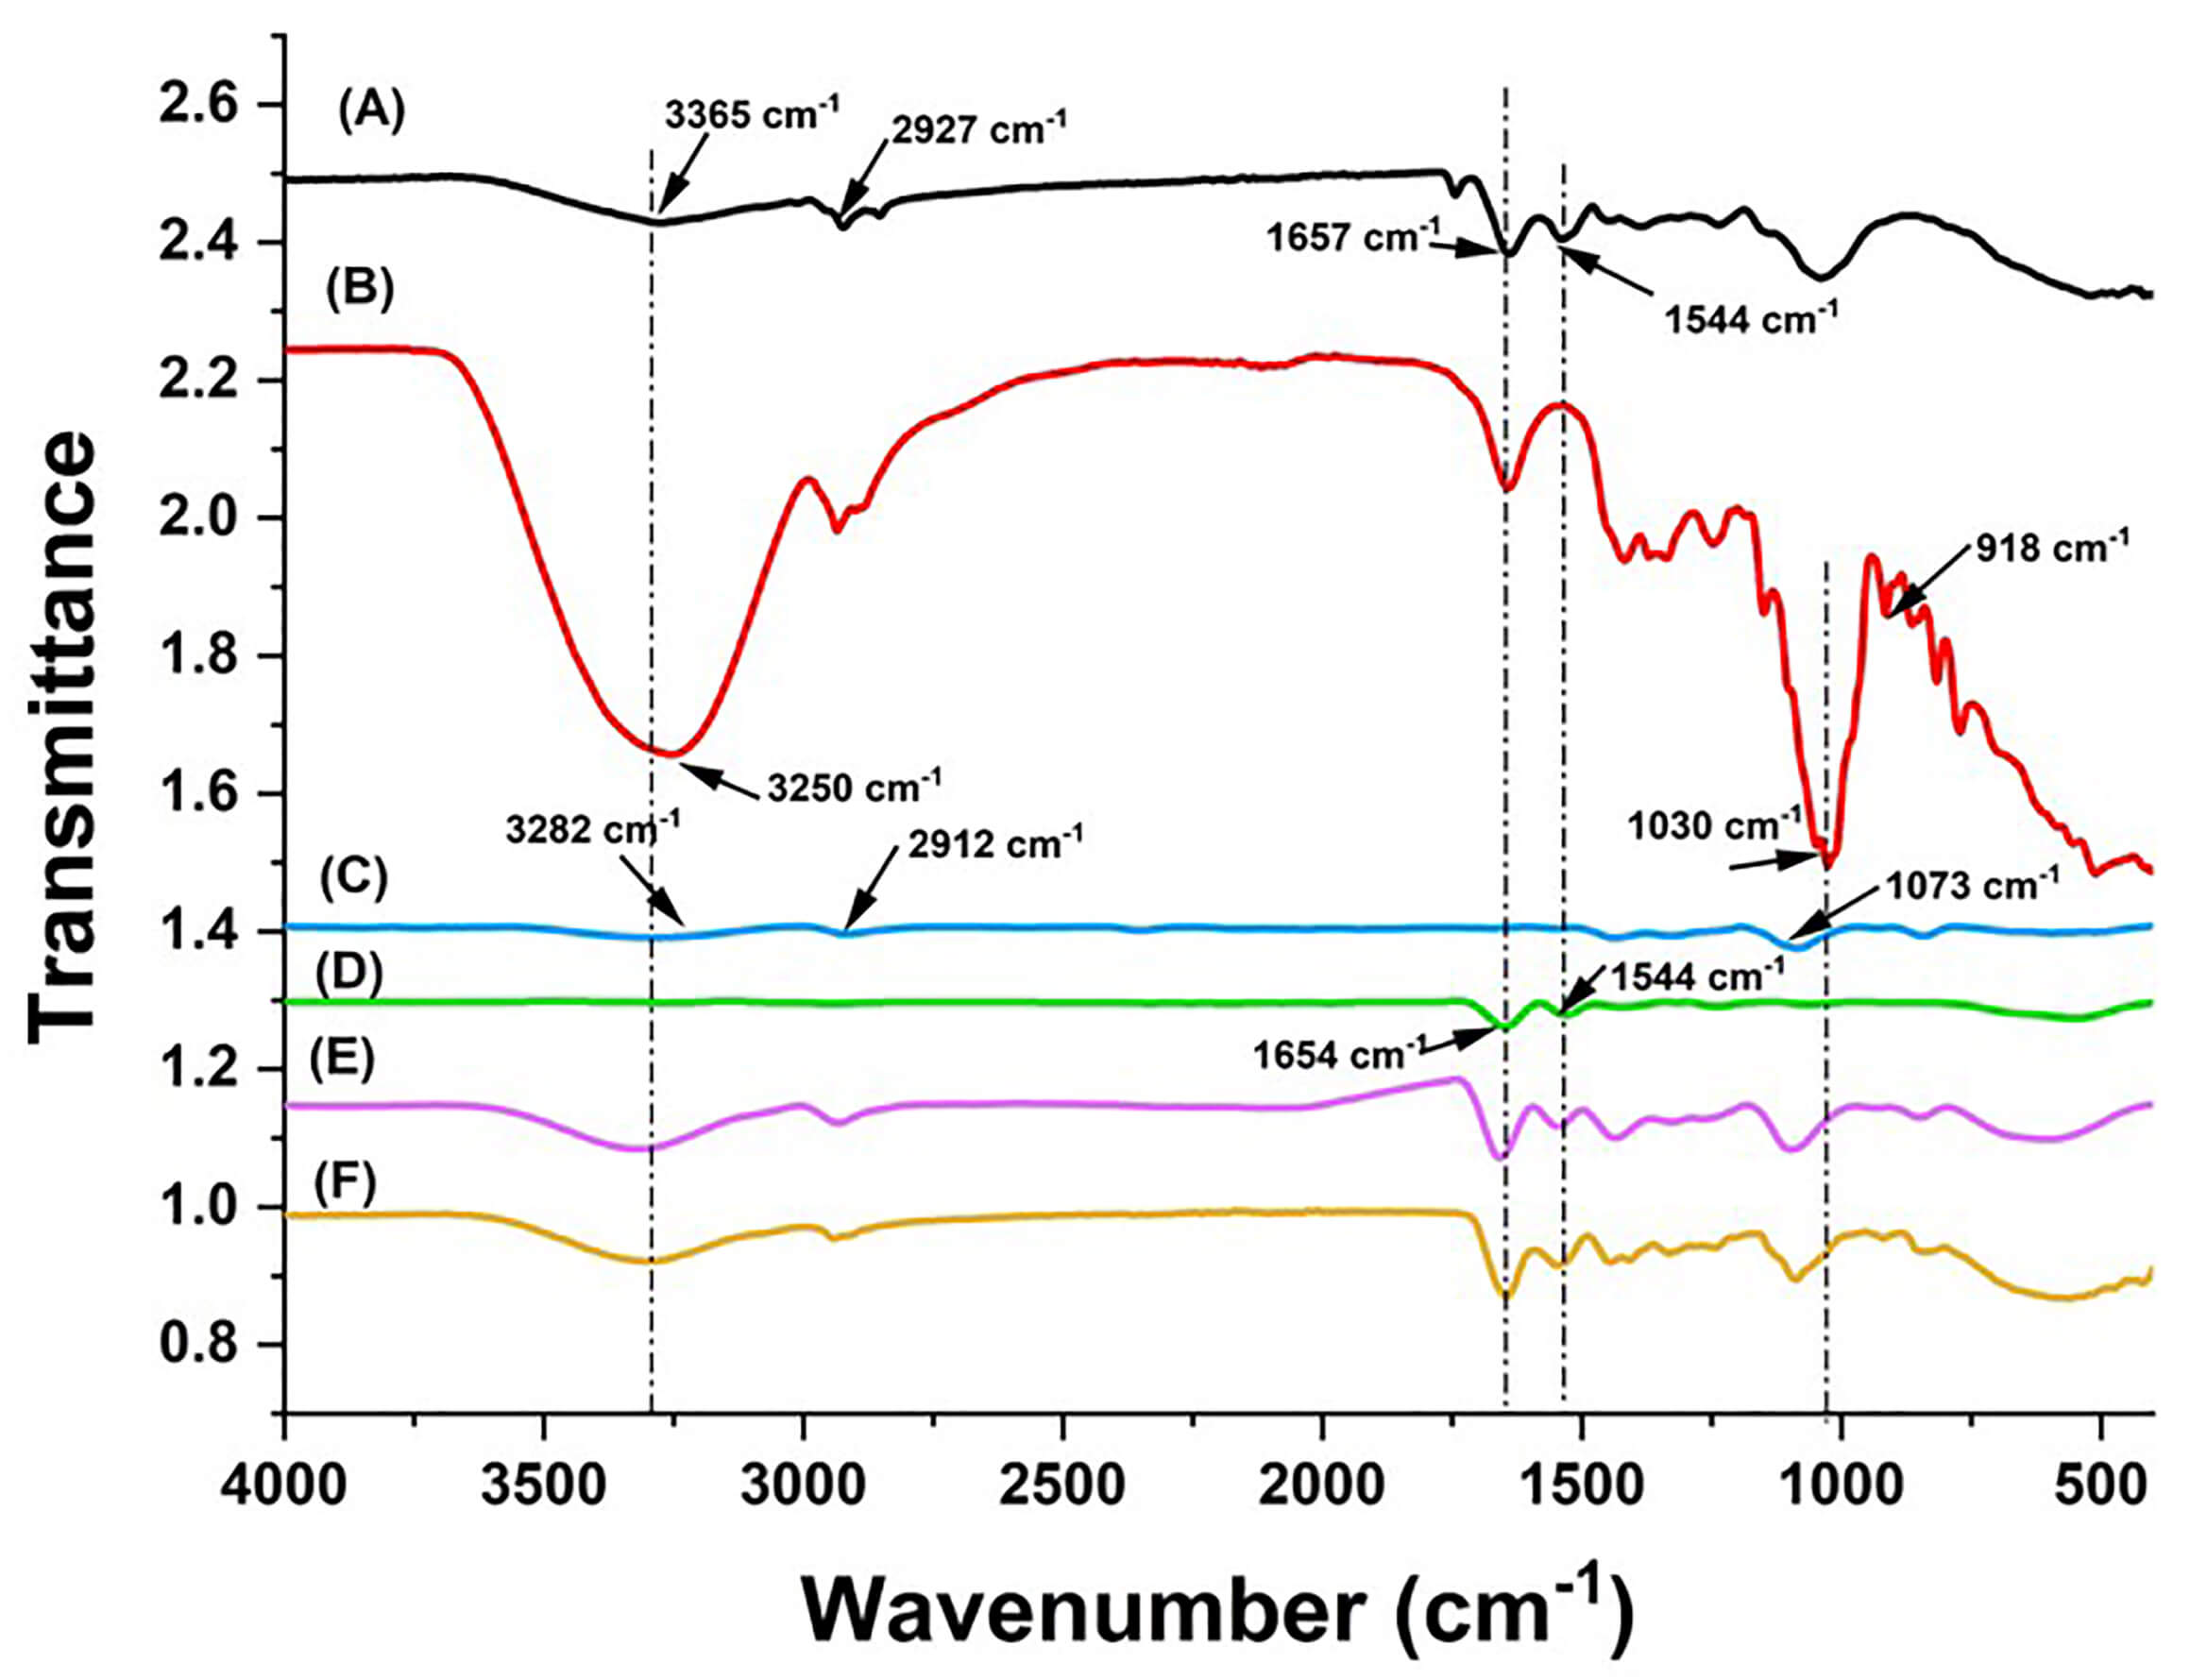
FTIR was used to analyze the chemical interaction of the polymers and to identify the incorporated natural components in the composite matrix (Fig. 3 and individual repeats in Supplementary Fig. 7). Raw Fenugreek seed powder (Fig. 3A) showed its characteristic peak at 3365 cm-1 due to the N–H stretching, followed by a small peak at 2927 cm-1 corresponding to C–H stretching. The appearance of strong peaks at 1657 and 1544 cm-1 denotes the presence of C=O (amide I), and N–H (amide II) [35].
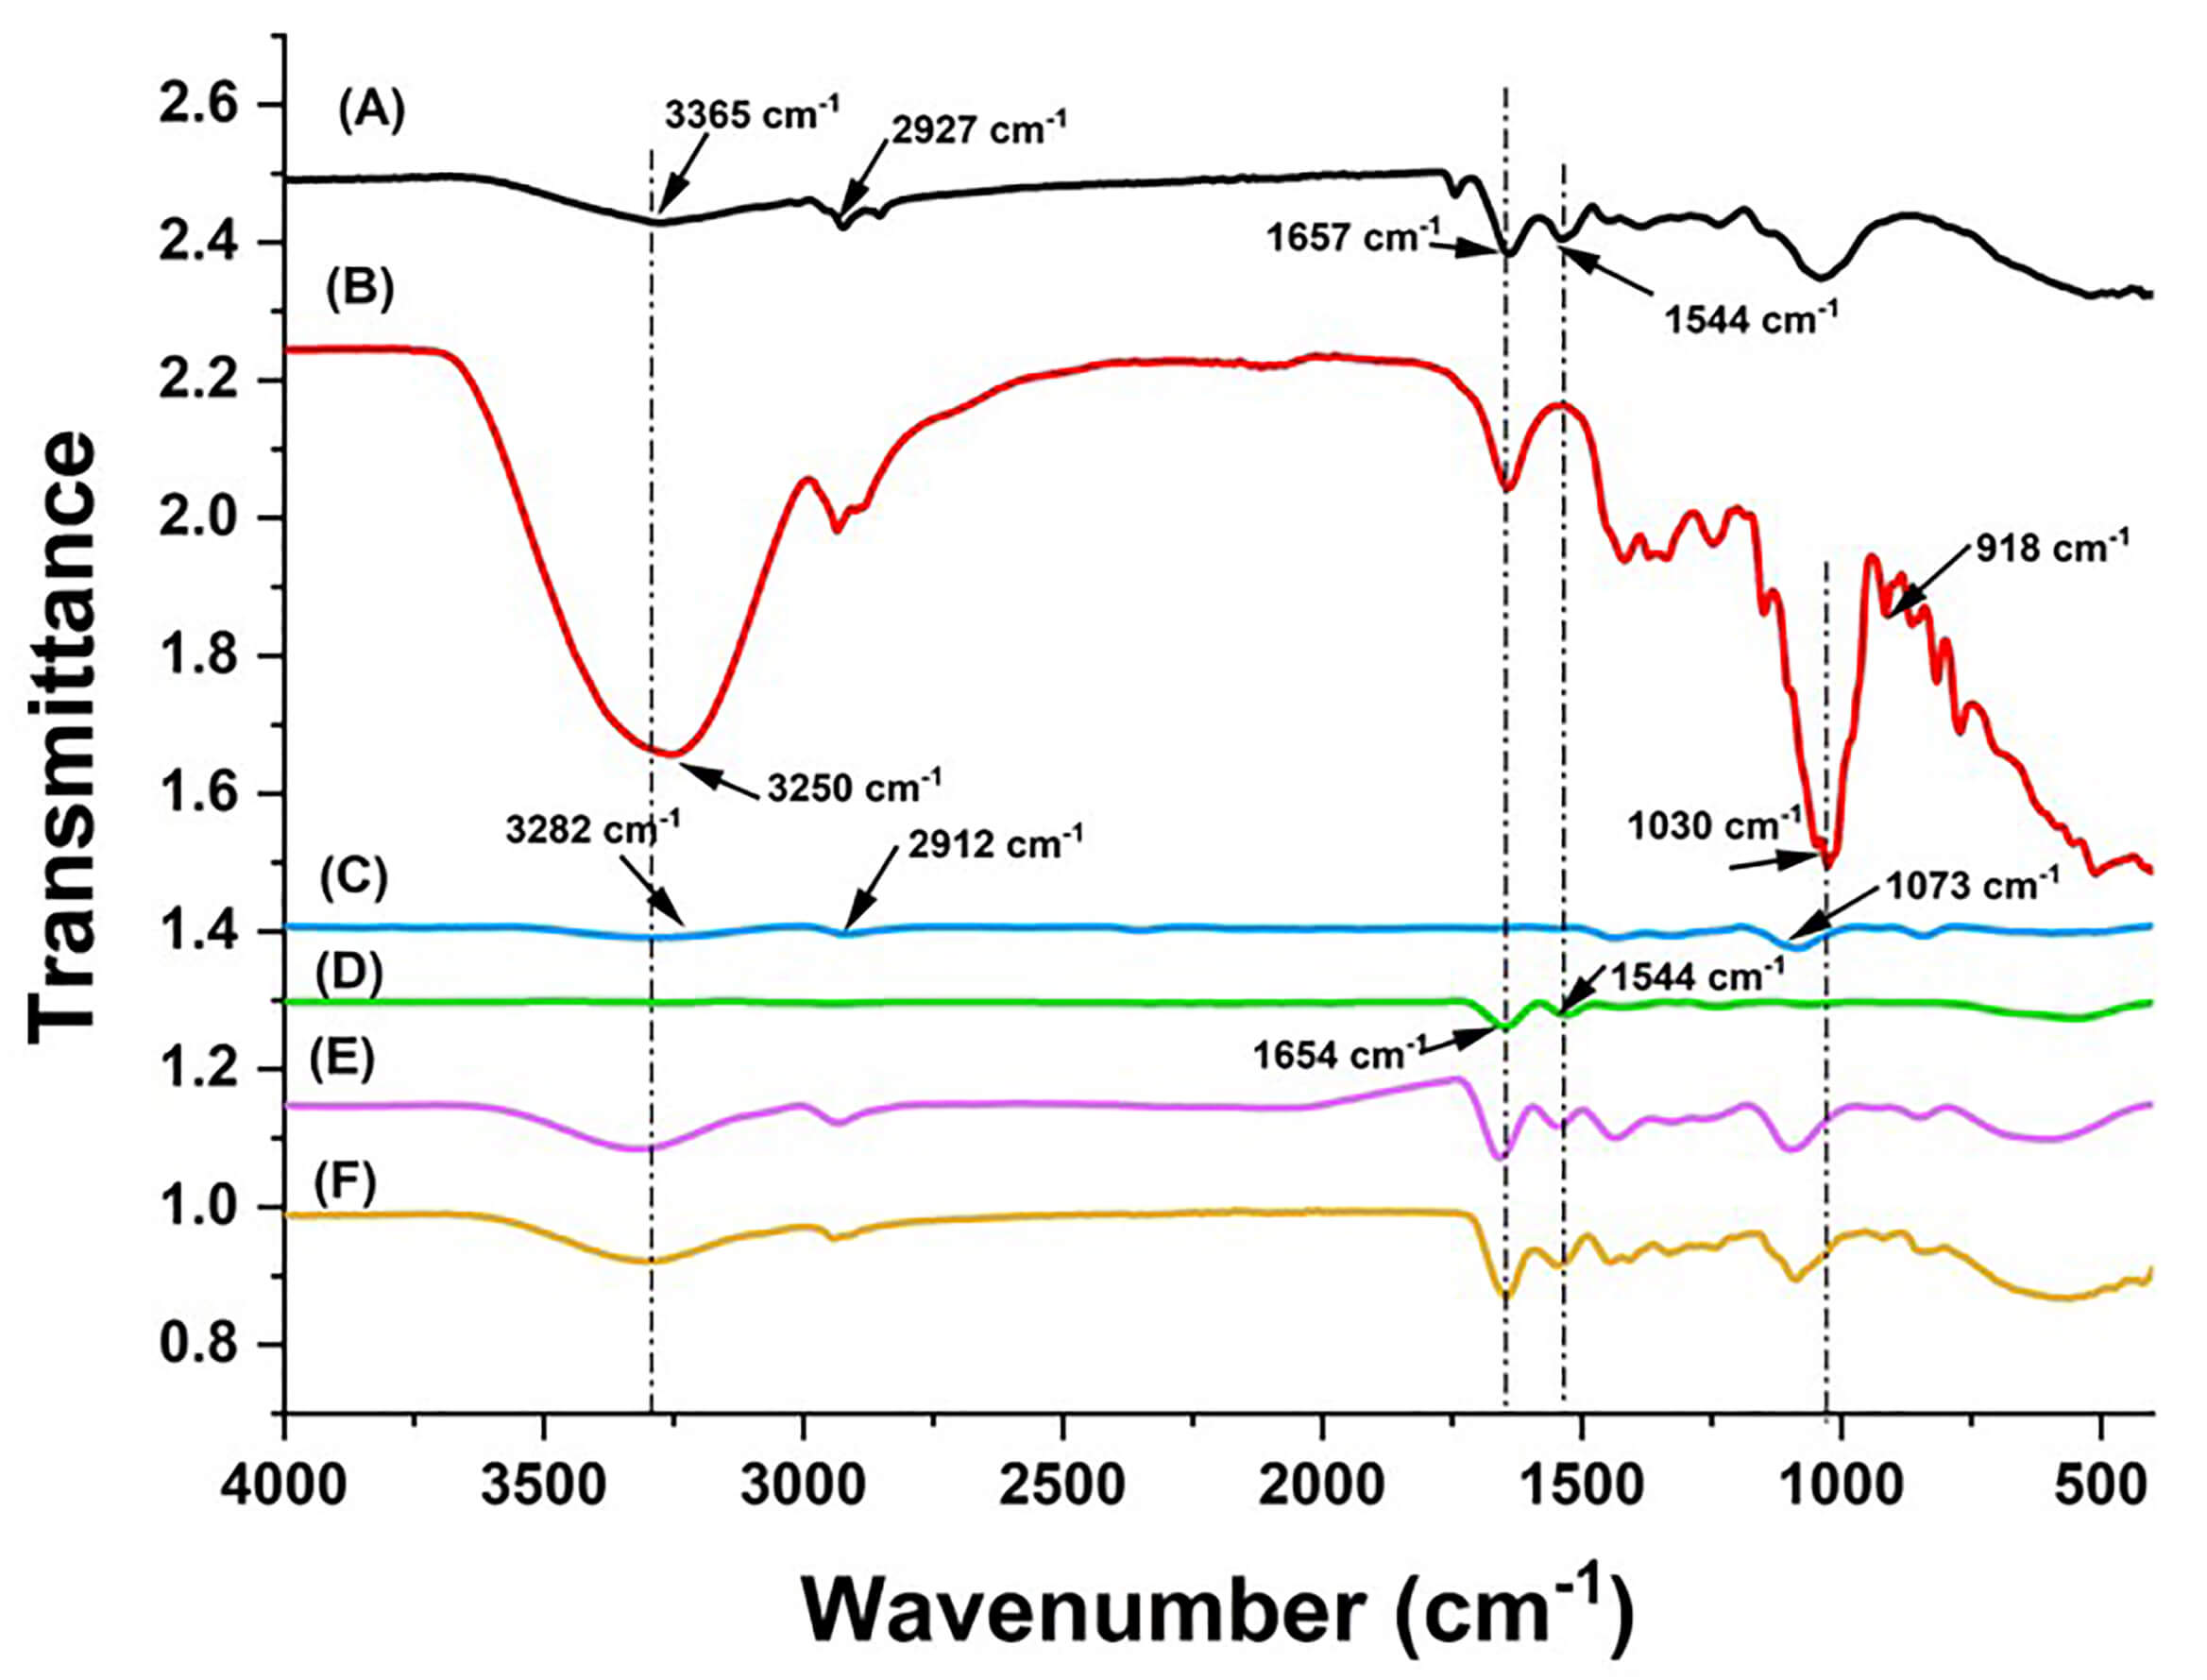 Fig. 3.
ATR-FTIR spectroscopy analysis of the electrospun nanofibrous scaffolds. (A) Raw Fenugreek seeds, (B) Raw Manuka honey, (C) Raw PVA, (D) Raw SF, and an overlaid comparison with the (E) PVA-SF composite and (F) bioscaffold. In the PVA-SF spectrum, notable shifts occur at peaks 3282, 1654, and 1544 cm-1, which correspond to the O–H group, amide I, and amide II, respectively. In the bioscaffold, shift changes occur at amide I, amide II, and 1030 cm-1, which corresponds to C–O stretching (sugar group). The spectra span 400–4000 cm-1, with the x-axis representing wavenumber (cm-1) and the y-axis indicating percentage transmittance. ATR-FTIR, Attenuated Total Reflectance-Fourier Transform infrared Spectroscopy.
Raw Manuka honey (Fig. 3B) showed a broad peak at 3250 cm-1, denoting O–H
stretching. A sharp, dominant peak at 1030 cm-1 corresponds to C–O
(glucose). A small peak at 918 cm-1 corresponds to the C–H bending., and
the bands from 900–750 cm-1 indicate the stretching of C–O and C–C [36].
Raw PVA (Fig. 3C) showed four major peaks at 3282 cm-1 (O–H stretching),
2912 cm-1 (asymmetric stretching of CH2), 1430 cm-1 (CH2
bending), and 1073 cm-1 (stretching of C=O). While raw SF showed the peaks
at 1654 cm-1 (amide Ⅰ, C=O stretching) and 1544 cm-1 (amide Ⅱ, N–H
bending), indicating the presence of
Following the blending of PVA into the SF, the FTIR spectrum of PVA-SF scaffold (Fig. 3E) exhibited the characteristic bands of both PVA and SF, confirming their effective intermolecular interactions. Specifically, we observed a slight shift in the position of amide Ⅰ to 1654 cm-1 upon blending it with PVA. This suggests a strong interaction between the PVA hydroxyl group and the amide groups in the SF. Noticeably, the width of the O–H region (3300–3200 cm-1) broadened in the PVA-SF spectrum. This indicates an increase in hydrogen bonding between the O–H groups of PVA and the C=O groups of SF. Further, the absence of new peaks indicates the uniform blending of PVA-SF polymers. All peaks observed were consistent with the published literature [37, 38].
The electrospun bioscaffold spectrum (Fig. 3F) retained all the major characteristic peaks corresponding to the polymers and the incorporated natural compounds. Notably, the amide I band exhibited a slight shift to 1651 cm-1 compared with the PVA-SF scaffold spectrum, indicating interactions between the hydrogen-bonding networks of the polymers and the incorporated Manuka honey and fenugreek seed extract. This shift confirms the presence of secondary intermolecular interactions between silk fibroin and the natural bioactive components within the nanofiber matrix. The characteristic C–O stretching of Manuka honey 1030 cm-1 and N–H stretching of fenugreek seed 3365 cm-1 were faintly shifted to 1075 cm-1 and 3345 cm-1, respectively, suggesting a slight overlap of hydrogen bonding between the composites and with the N–H groups present in the fenugreek seed. Despite minimal shifts relative to the raw materials, the presence of characteristic peaks in the bioscaffold confirms a good interaction among the different materials within the scaffold.
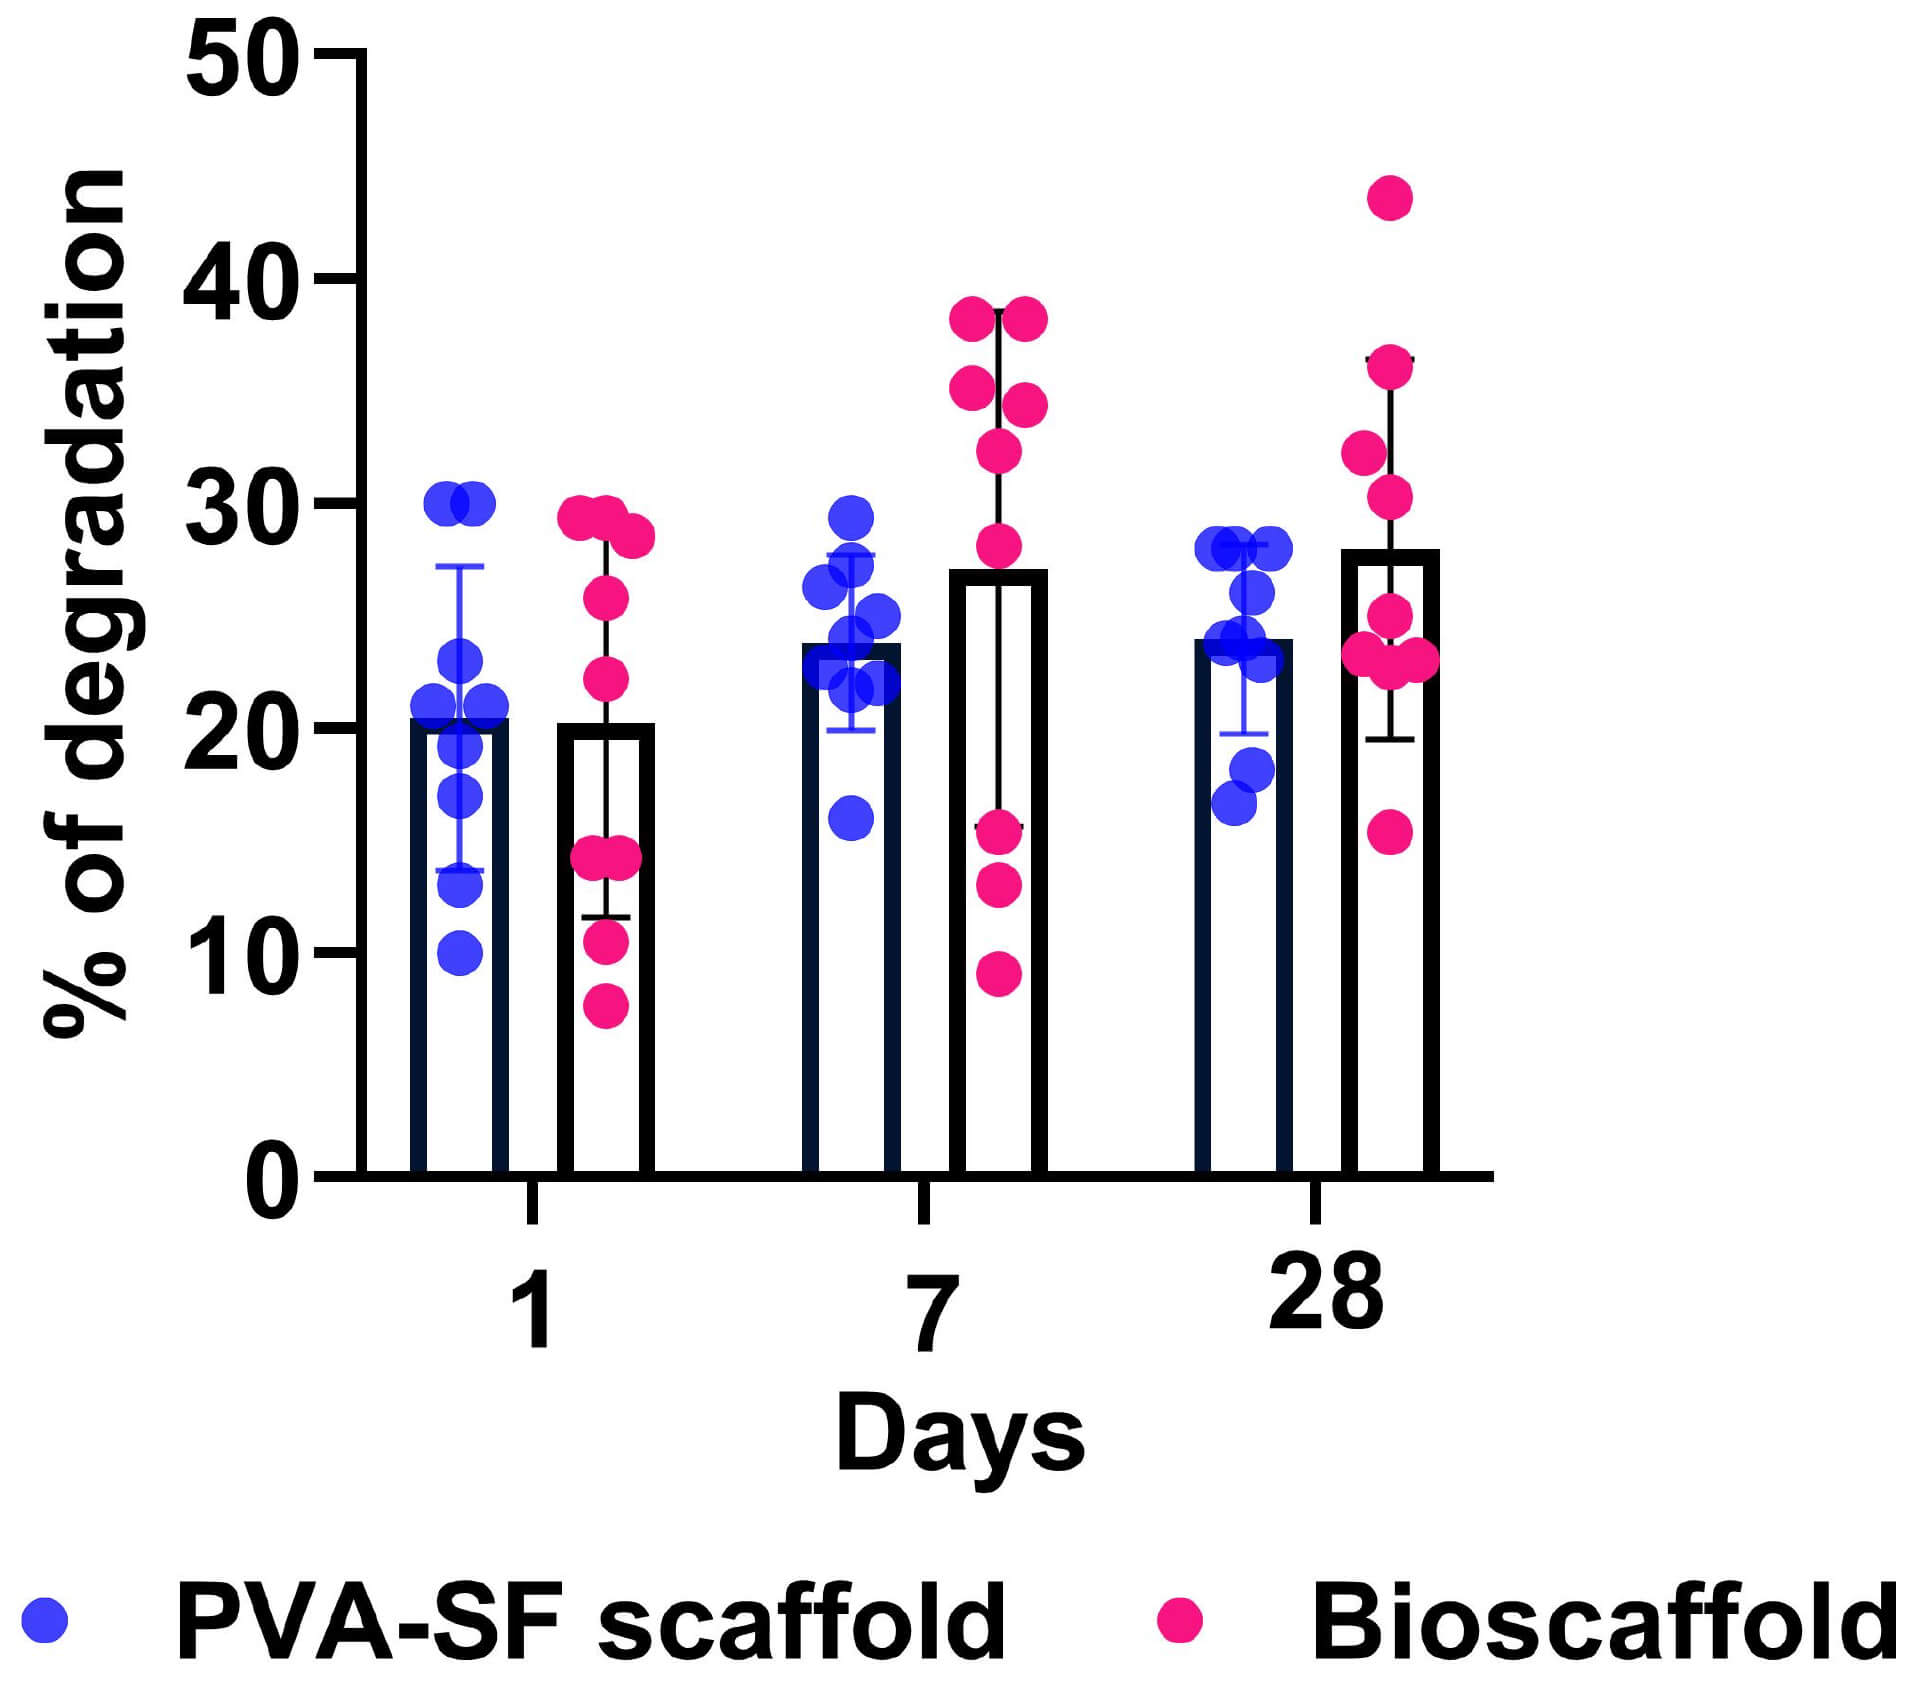
For wound-care applications, an ideal scaffold should degrade gradually while preserving its architecture, thereby supporting tissue repair and enabling controlled release of incorporated bioactive components to achieve optimal therapeutic outcomes. In the present degradation analysis, no statistically significant difference in weight loss was observed between the two scaffold groups (Fig. 4). However, the bioscaffold showed a comparatively higher weight loss at day 7, likely attributable to the hydrophilic nature of the incorporated natural compounds. This early weight loss suggests an initial release of bioactive components from the PVA-SF matrix, which may accelerate early-stage wound-healing responses. Beyond the first week, the degradation rate stabilized for both scaffold groups, with overall degradation remaining below 30% by day 28, indicating sustained structural integrity and a slow, controlled degradation profile.
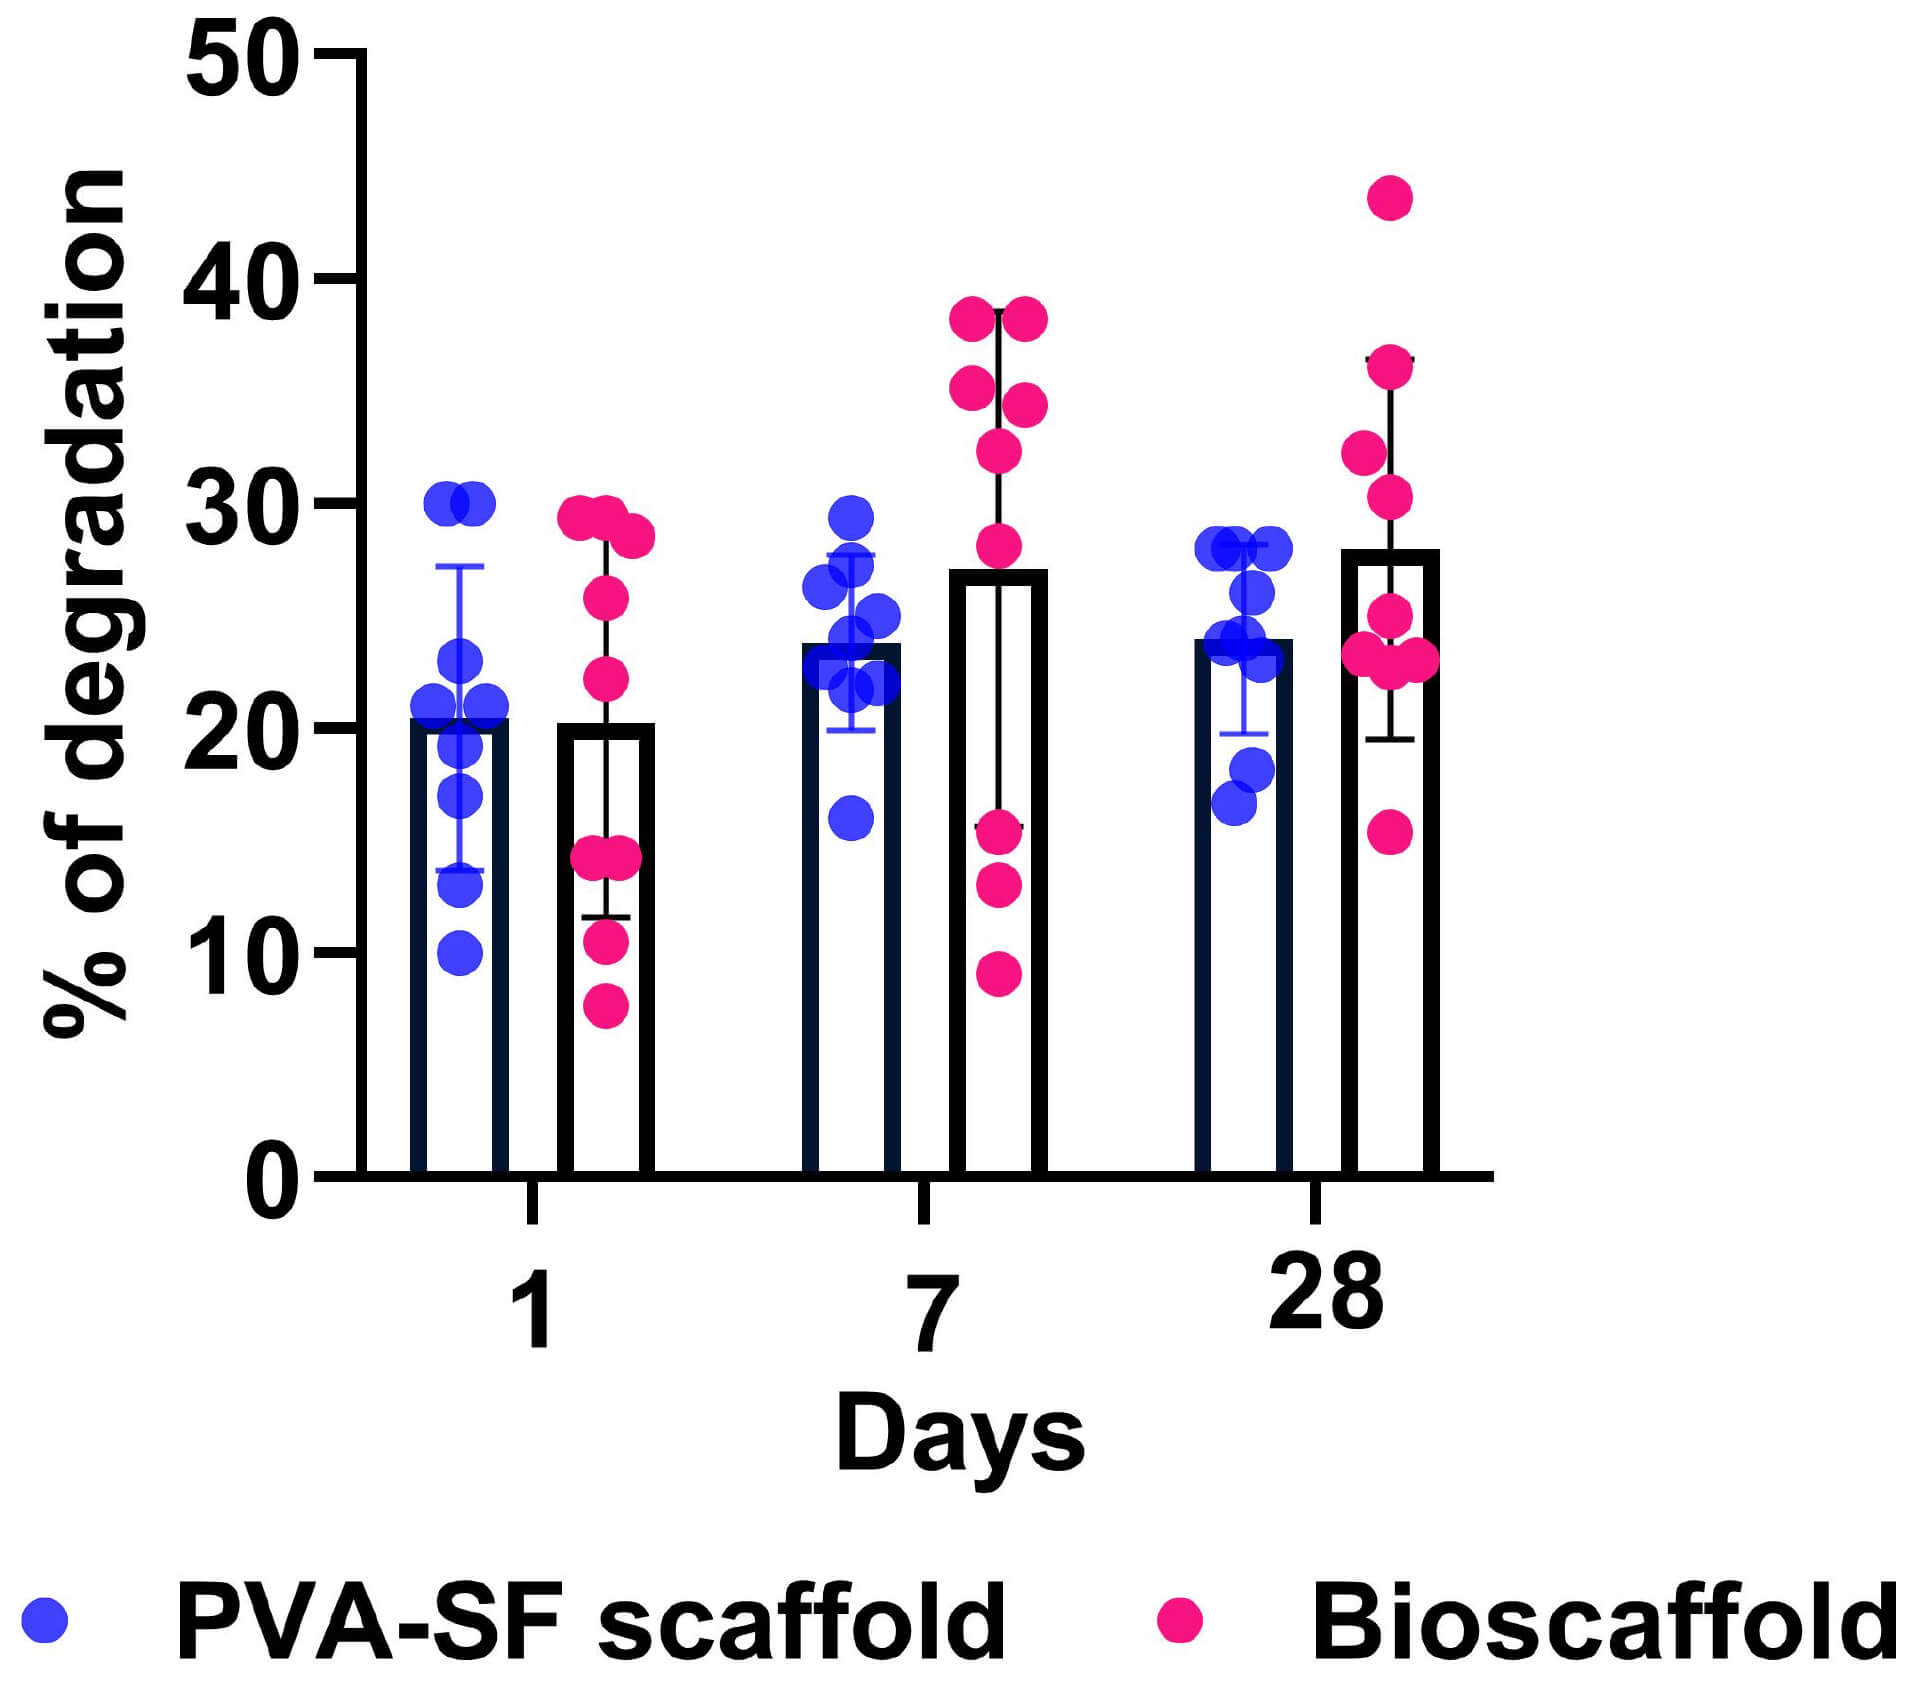 Fig. 4.
Degradation analysis of the electrospun nanofibrous scaffolds.
Quantitative scatter plot bar graphs showing degradation of PVA-SF scaffold and
bioscaffold on day 1, 7, and 28. Data are represented as mean degradation
percentage
A thermal analysis of the nanofibers is essential to evaluate their thermal stability and moisture degradation rate, and to identify the thermal decomposition of the individual materials used. In wound care applications, thermal stability is important for quantifying scaffolds’ stability, which is required to support tissue repair and regeneration; it also helps predict the material’s longer-term in vitro and in vivo degradation behaviour and performance.
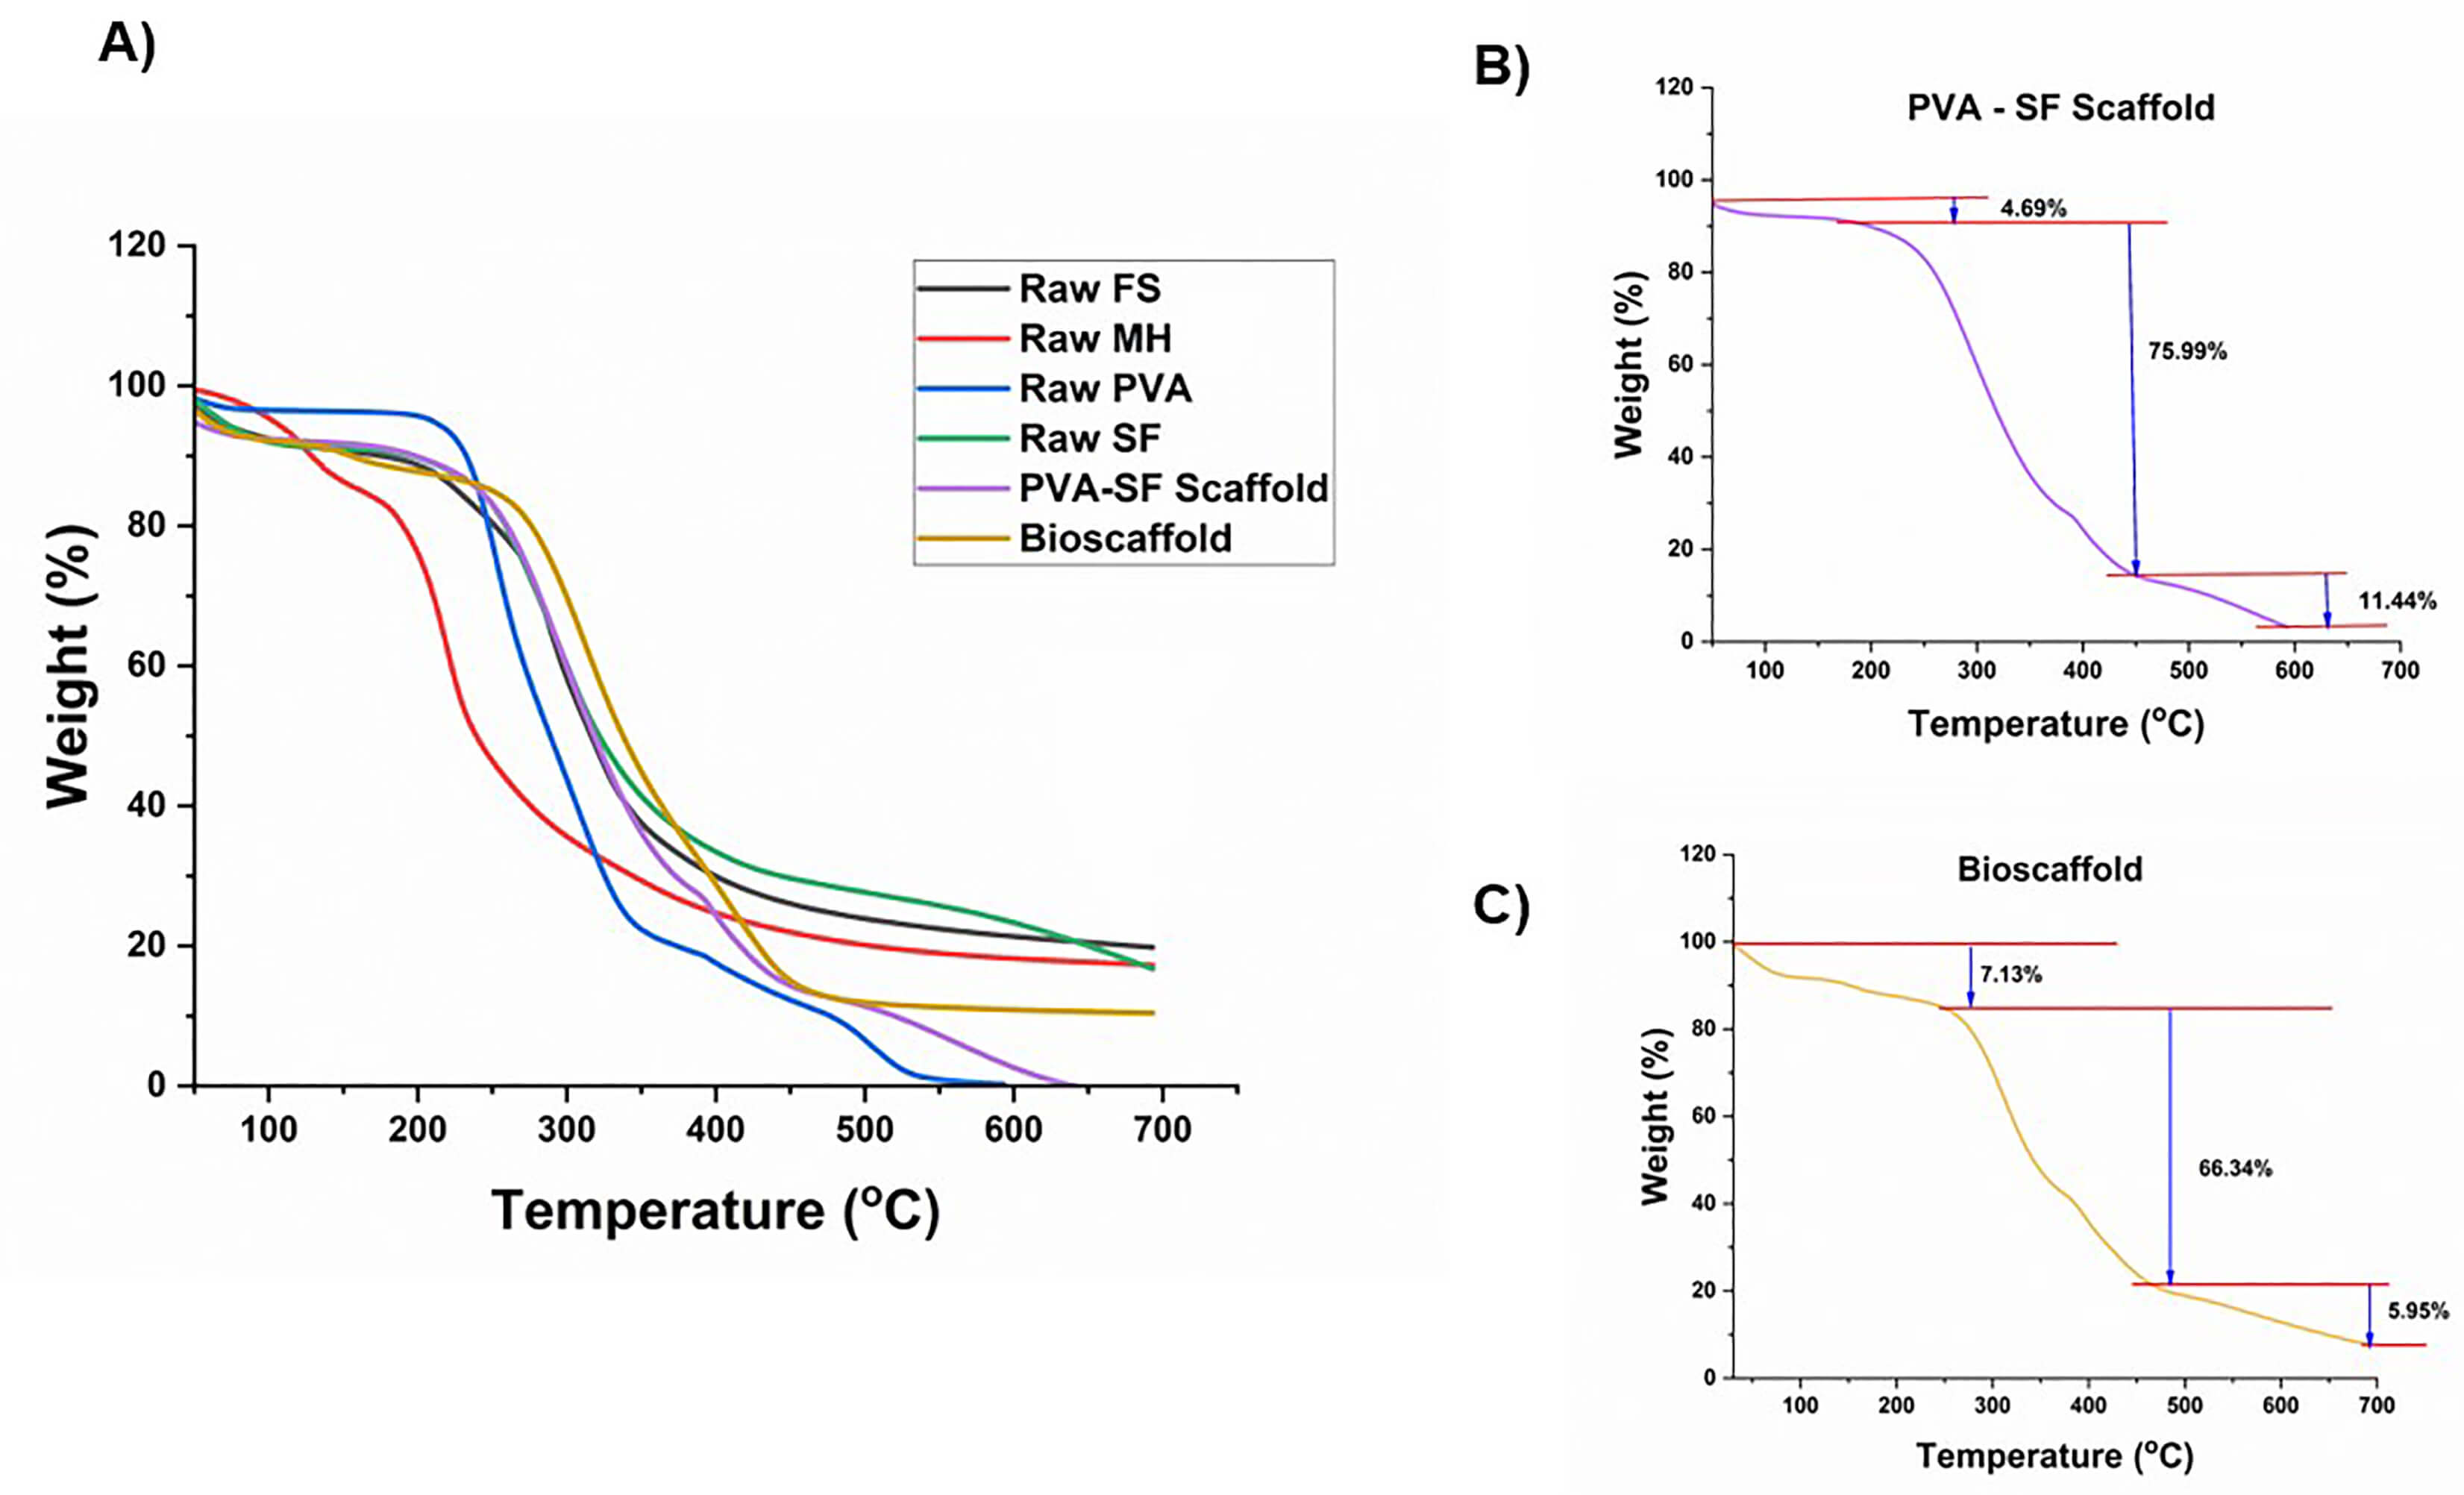
The thermogram of all the raw materials showed an initial weight loss occurring between 80–150 °C, attributed to the evaporation of moisture present in the hydrophilic polymers and the natural components. Subsequently, the thermal degradation of natural components occurred in the range of 220–350 °C, corresponding to the decomposition of carbohydrates, lipids, and sugar molecules inherent in these materials (Fig. 5A and individual repeats in Supplementary Fig. 8) [39, 40, 41].
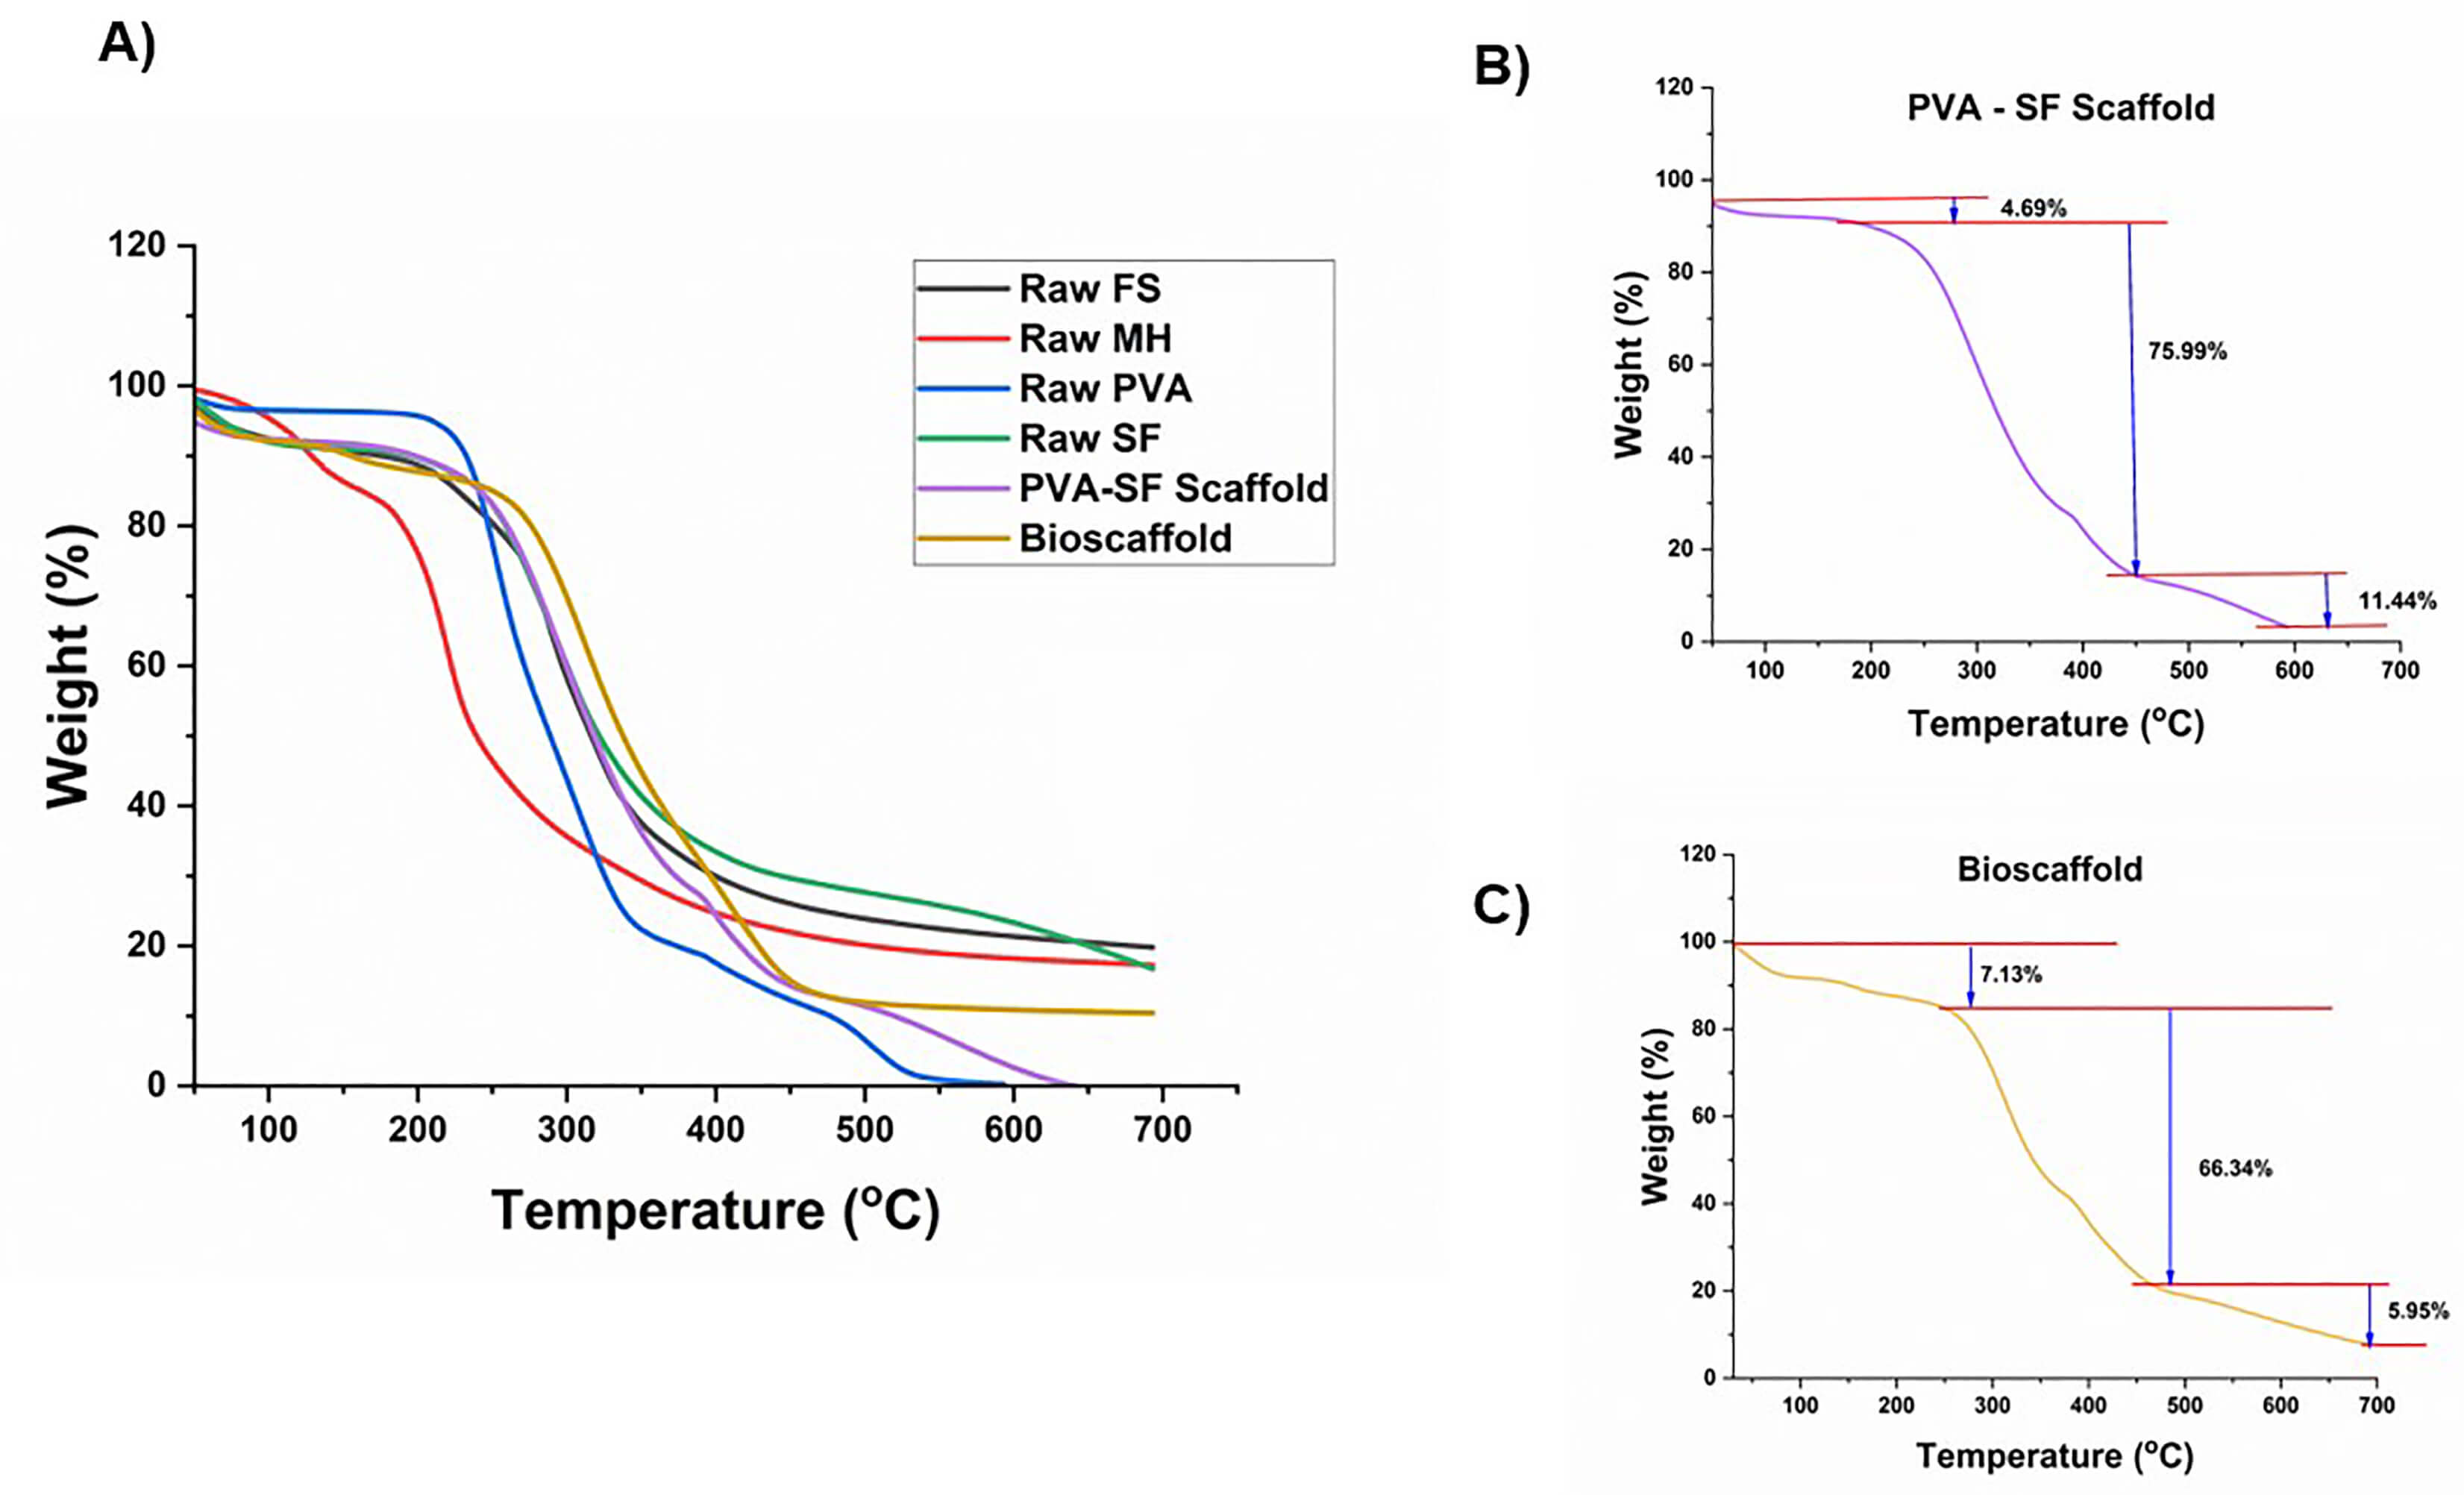 Fig. 5.
Thermal analysis of the electrospun nanofibrous scaffolds. Representative TGA thermogram of Raw Fenugreek seed, Manuka honey, PVA, SF, PVA-SF, and bioscaffolds composites. (A) Raw samples and scaffolds, (B) PVA-SF scaffold, (C) bioscaffold. The X axis represents the temperature (°C), and the Y axis represents the percentage of weight loss. TGA, Thermogravimetric Analysis.
The initial degradation of the PVA-SF scaffold occurred at 150 °C, resulting in a weight loss of 4.69%. A subsequent significant degradation occurred between 250 °C and 300 °C, due to the breakdown of polymer chains including amino groups, vinyl groups, and C–C bonds within the SF and PVA backbones (Fig. 5B) [42, 43, 44]. Beyond 600 °C, the TGA curves plateaued, indicating that the composite nanofibers had fully decomposed, leaving little to no unburned inorganic residue. The decomposition temperature of the PVA-SF composite lies between that of raw SF and PVA, possibly due to an increase in crystallinity during the electrospinning process. Bioscaffolds showed an initial degradation at around 150 °C, resulting in a weight loss of approximately 7.13%. This suggests the presence of new, additional materials. The second decomposition of the bioscaffolds occurred around 270 °C, resulting in a weight loss of approximately 66.36%, which was 9.65% less than the PVA-SF scaffold (Fig. 5C). These findings indicate that the incorporation of new natural compounds enhanced the thermal stability of the bioscaffolds, potentially enhancing their flexibility and resistance to brittleness [45]. Such stability is beneficial for wound-healing applications, as it supports sustained bioactive delivery and helps maintain the scaffold’s structural integrity throughout the tissue-regeneration process.
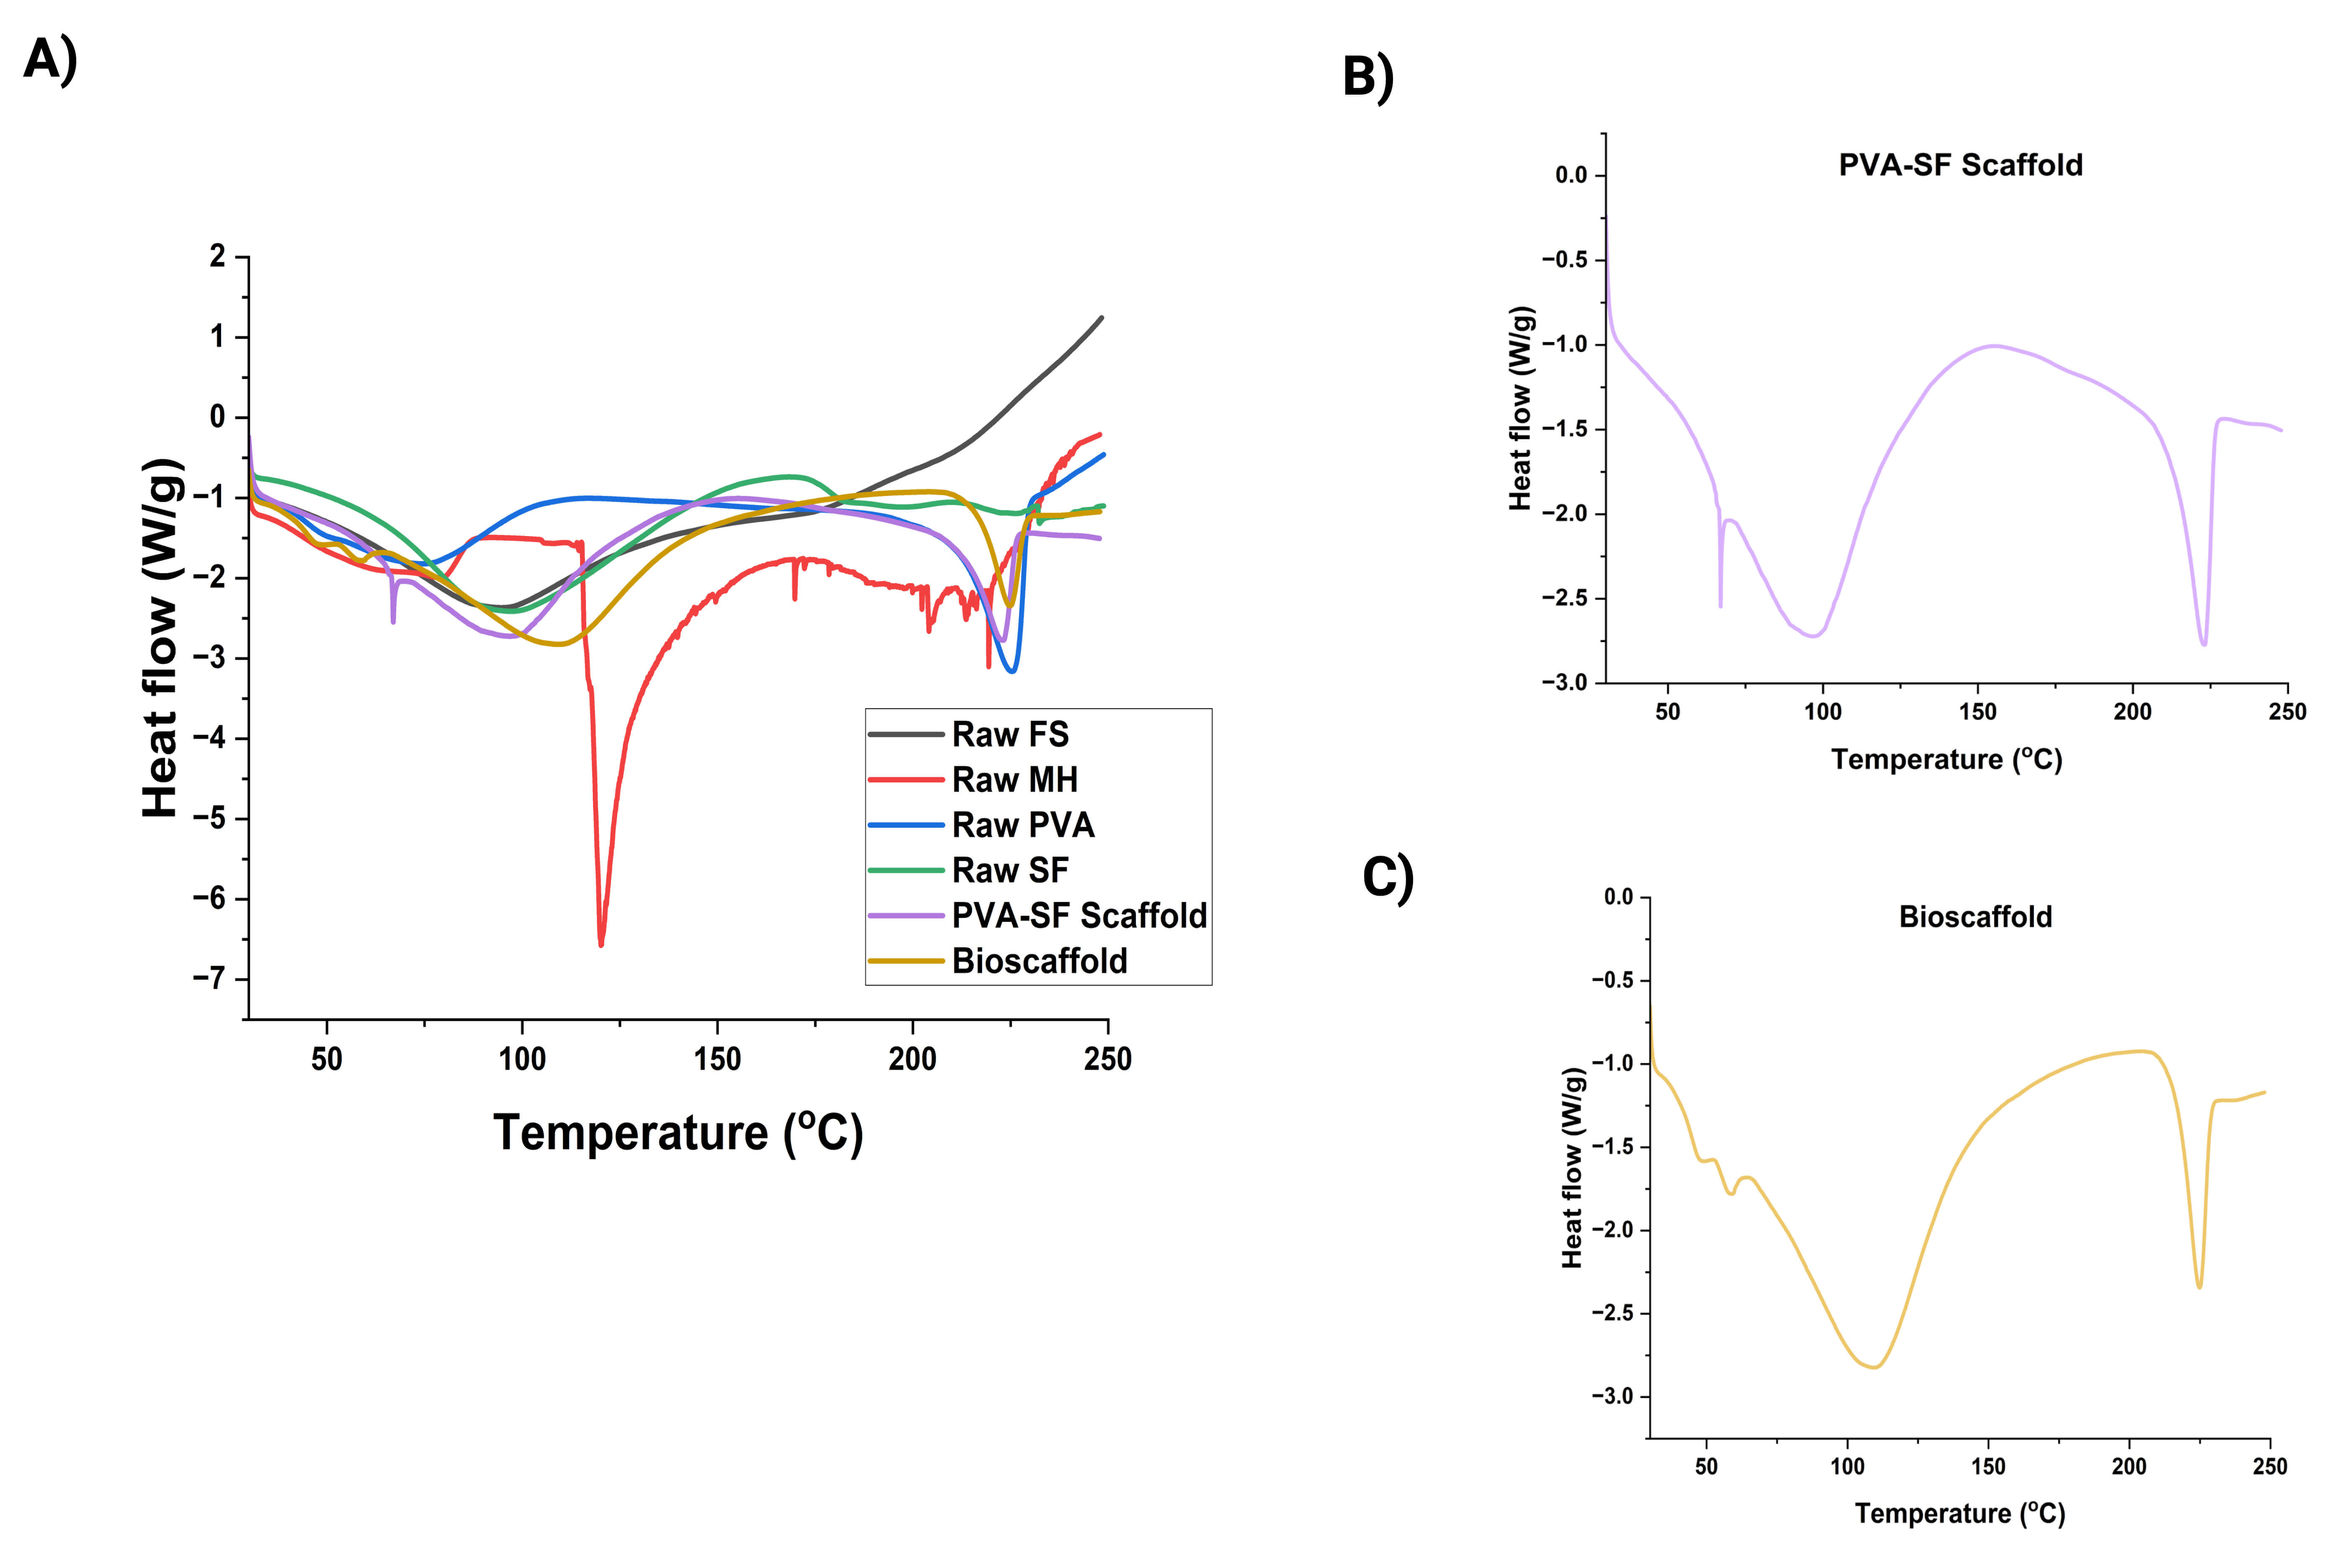
The glass transition temperature (Tg) of raw fenugreek seed was 80 °C, corresponding to protein denaturation and water loss [25, 46]. In the case of raw Manuka honey, two thermal events were exhibited; Tg was observed around 118 °C (Fig. 6A and individual repeats in Supplementary Fig. 9), followed by an endothermic peak around 220 °C, corresponding to the transition of amorphous sugar matrix, such as fructose or glucose, which are the major components of Manuka honey [40, 41].
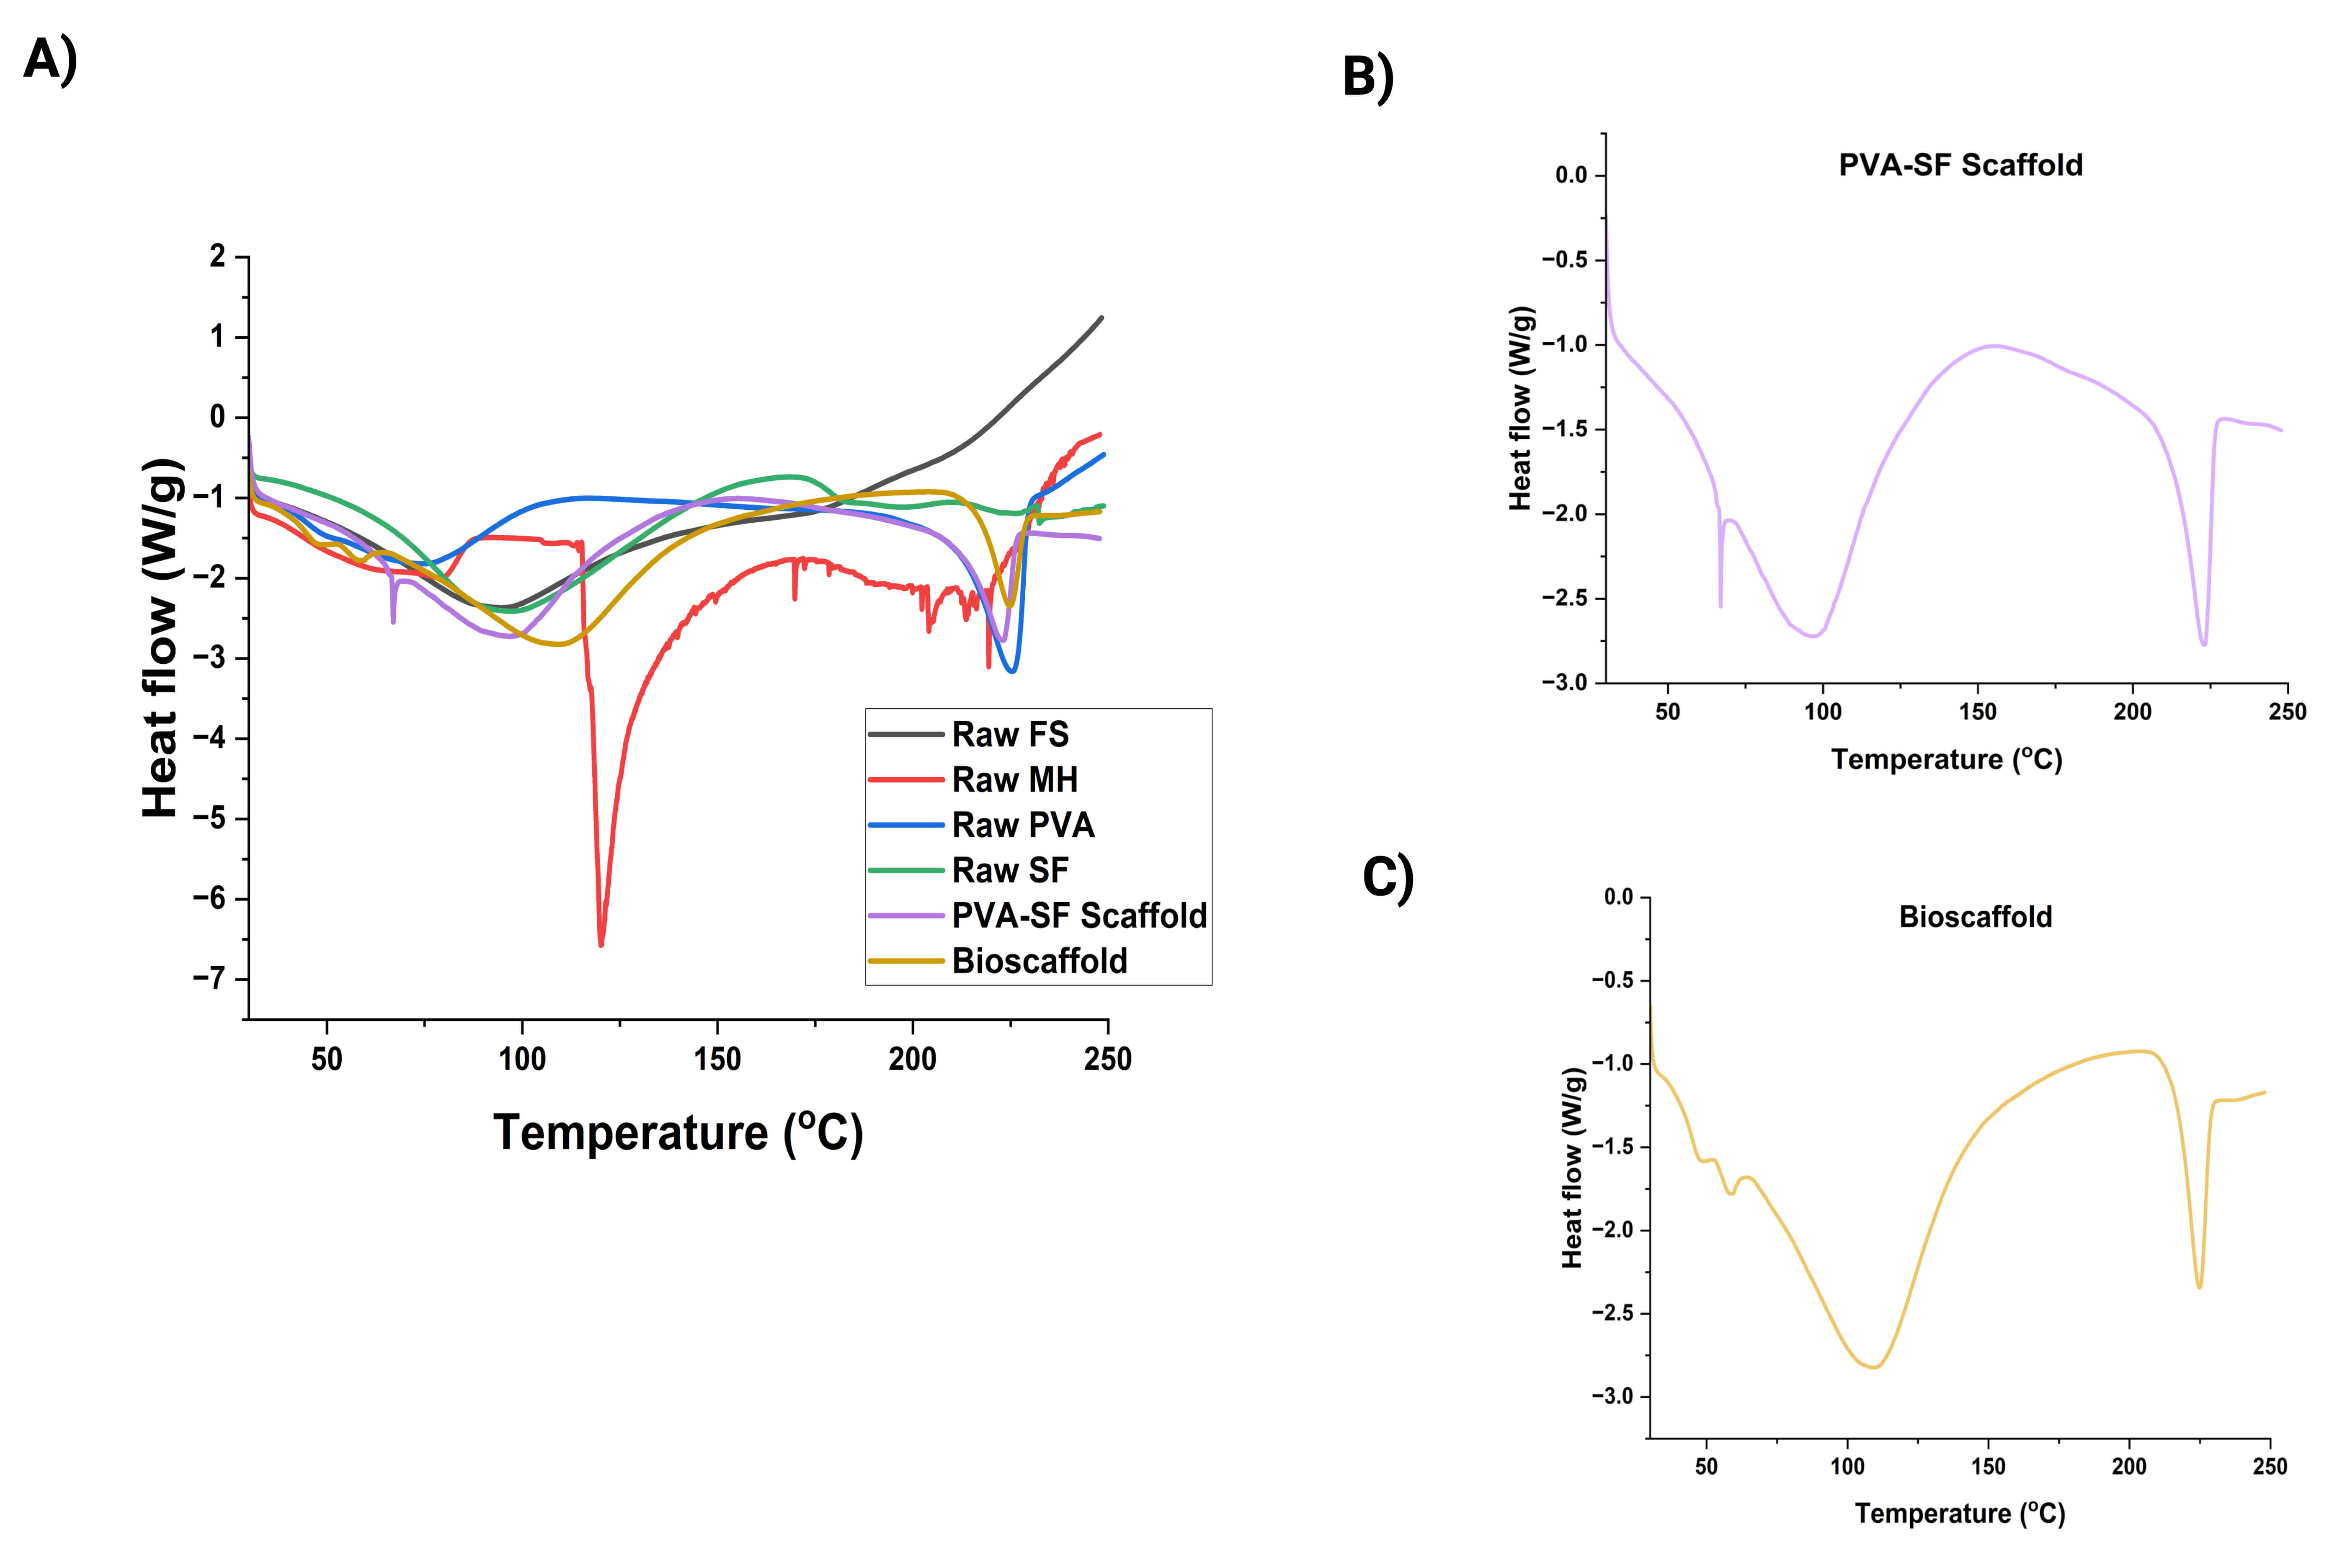 Fig. 6.
DSC thermogram analysis of the electrospun nanofibrous scaffolds. Representative trace of DSC thermogram of Raw fenugreek Seed, Manuka honey, PVA, SF, PVA-SF, and bioscaffold (A), PVA-SF scaffold (B) and bioscaffold (C). The X-axis represents the temperature (°C), and the Y-axis represents the heat flow. DSC, Differential Scanning Calorimetry.
The Tg curves of PVA and SF were observed between 75 and 95 °C, indicating the release of water. This is followed by an endothermic peak between 225 °C and 240 °C, denoting the breakdown of amorphous amide groups in SF and the melting of crystalline domains in PVA [47, 48, 49].
Analysis of the PVA-SF scaffold curve (Fig. 6B) showed a visible shift in the Tg to 90 °C, indicating intermolecular interactions between PVA and SF. Interestingly, Tg of bioscaffold was around 120 °C, 30% higher when compared to the PVA-SF composite (Fig. 6C). Further, the thermal decomposition of the PVA-SF was around 217 °C, which increased to 227 °C after incorporation of natural compounds, indicating that the addition of natural derivatives enhances the overall thermal stability.
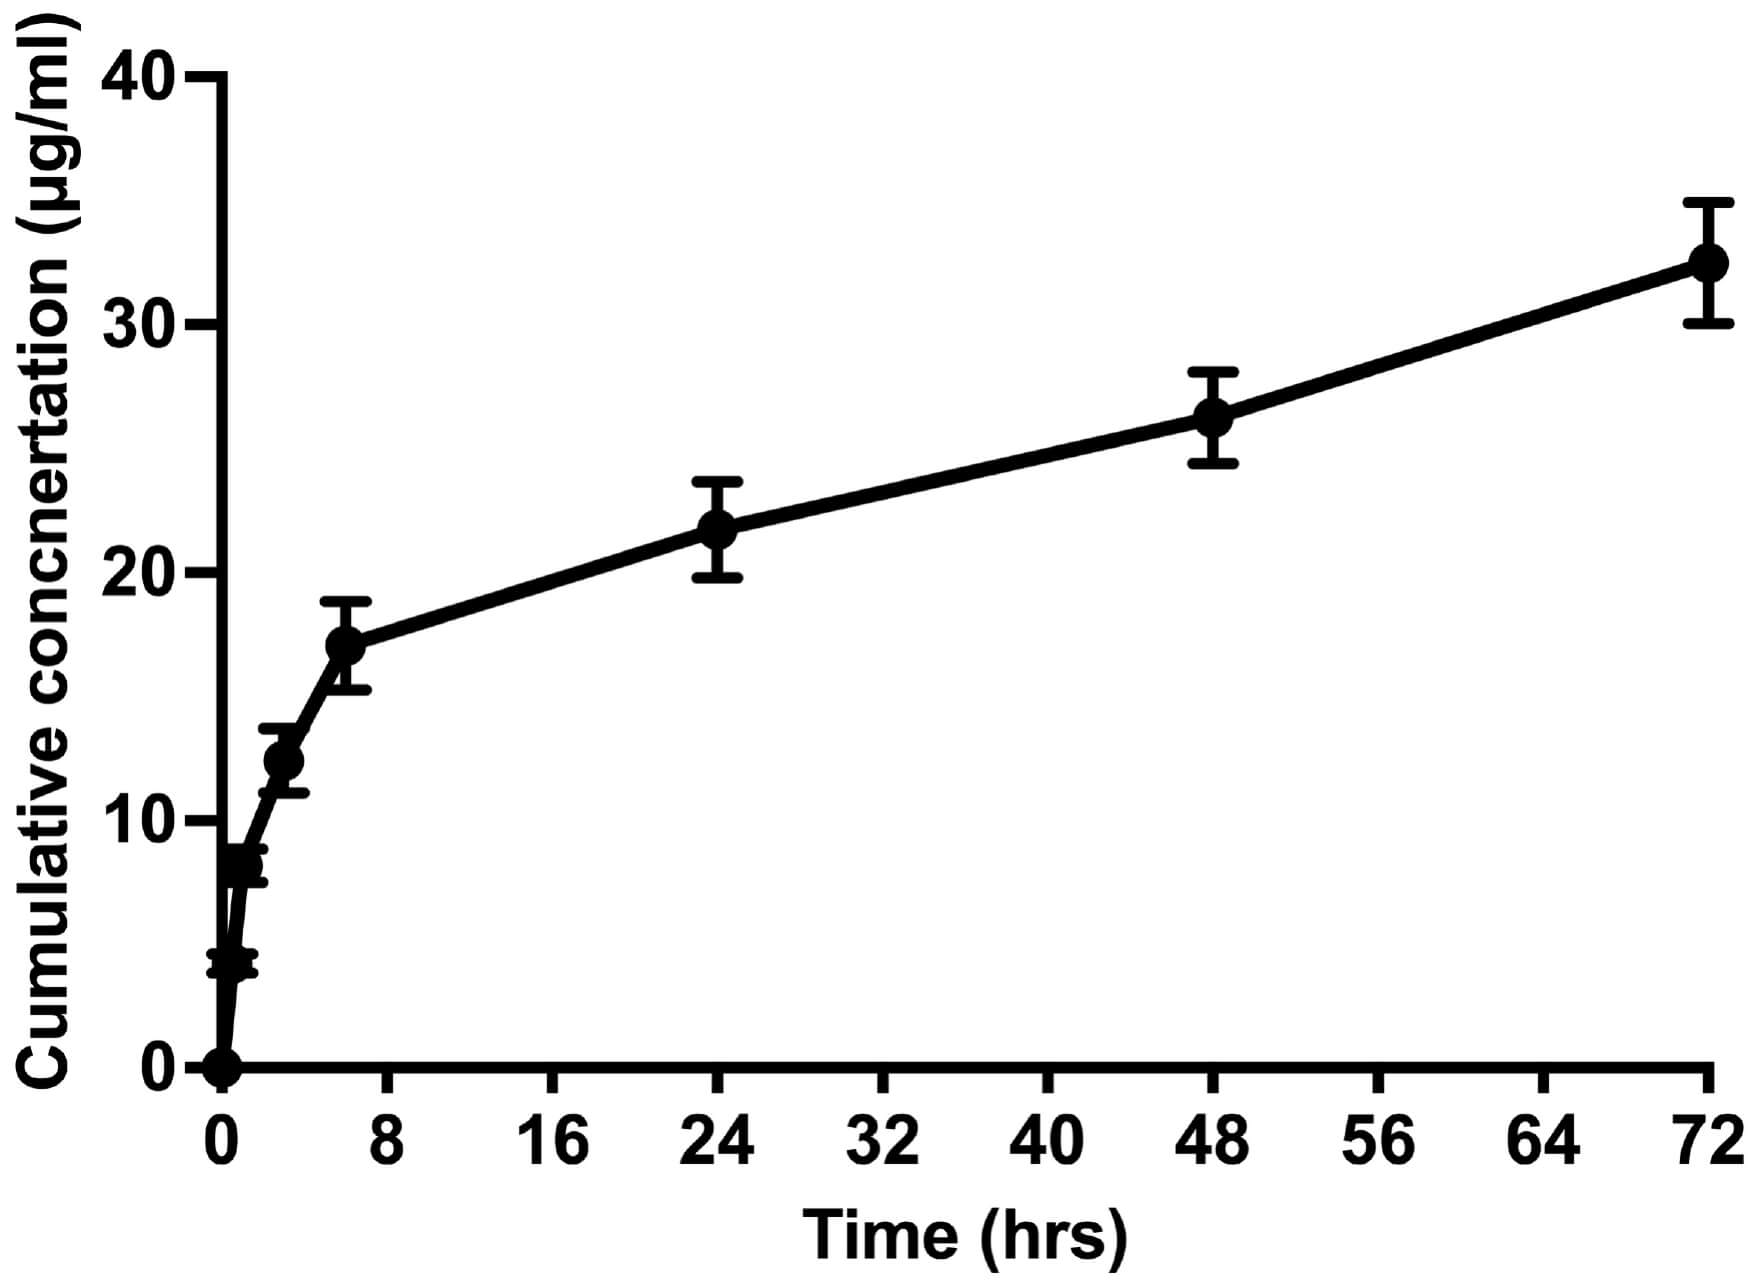
The scaffold exhibited a sustained and time-dependent cumulative release pattern
over 72 h. An initial burst of release was observed at early time points,
reaching 17.0
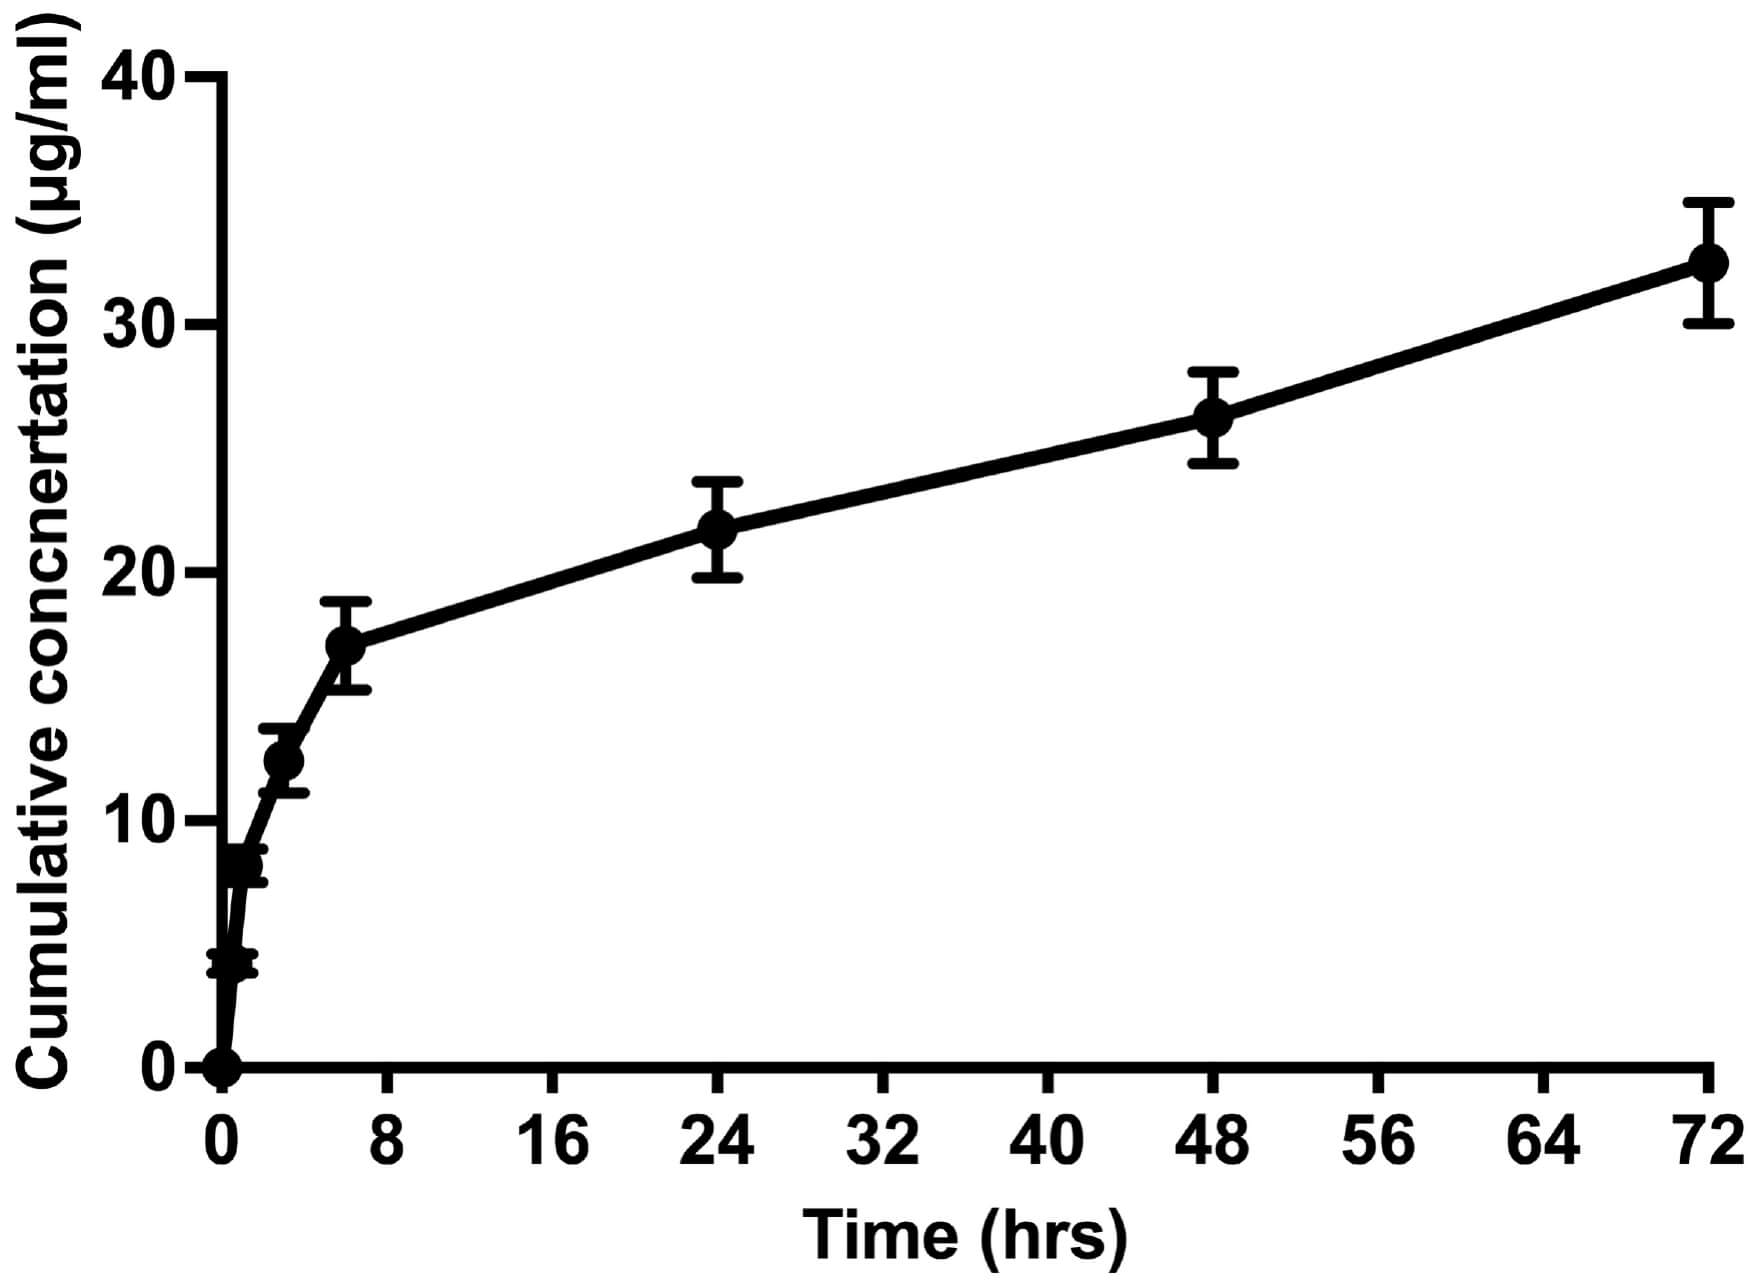 Fig. 7.
Drug delivery analysis of the electrospun bioscaffolds.
Quantitative line graph showing the cumulative release kinetics of natural
compounds incorporated into bioscaffolds. Data presented as µg/mL and are
presented as mean
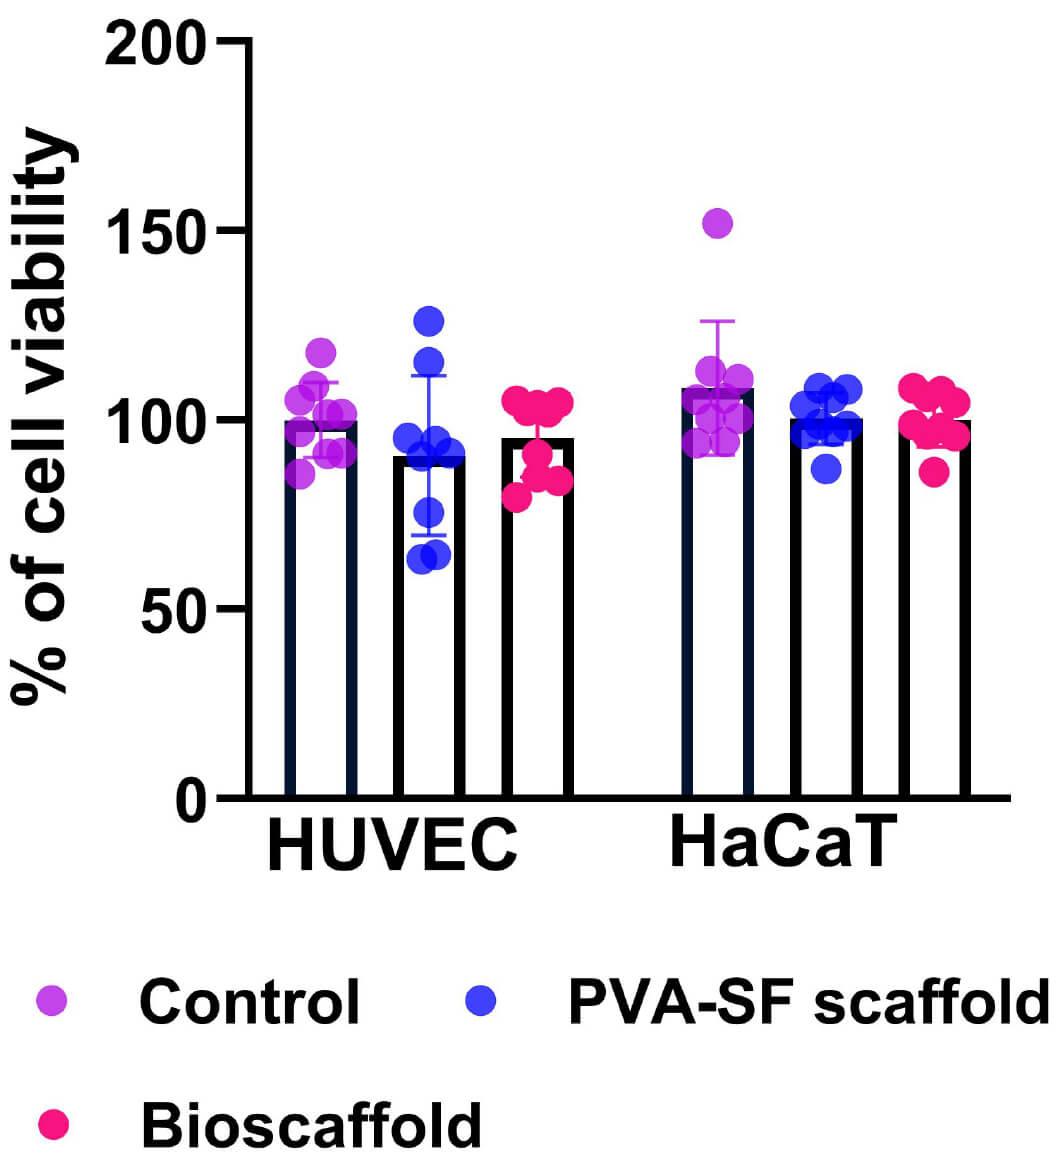
The cytotoxicity of the bioscaffold was assessed using the MTT colourimetric assay. Both PVA-SF and bioscaffolds showed no changes in cell viability for HUVECs and HaCaTs cells (Fig. 8). Over the incubation period of 72 hrs, all the scaffold groups showed no sign of cytotoxicity, confirming that nanofibers are non-toxic and biocompatible. Specifically, the absence of cytotoxic responses demonstrates that the fabricated scaffolds can act as drug delivery systems and provide a supportive microenvironment for effective cell proliferation, thereby accelerating wound repair [50].
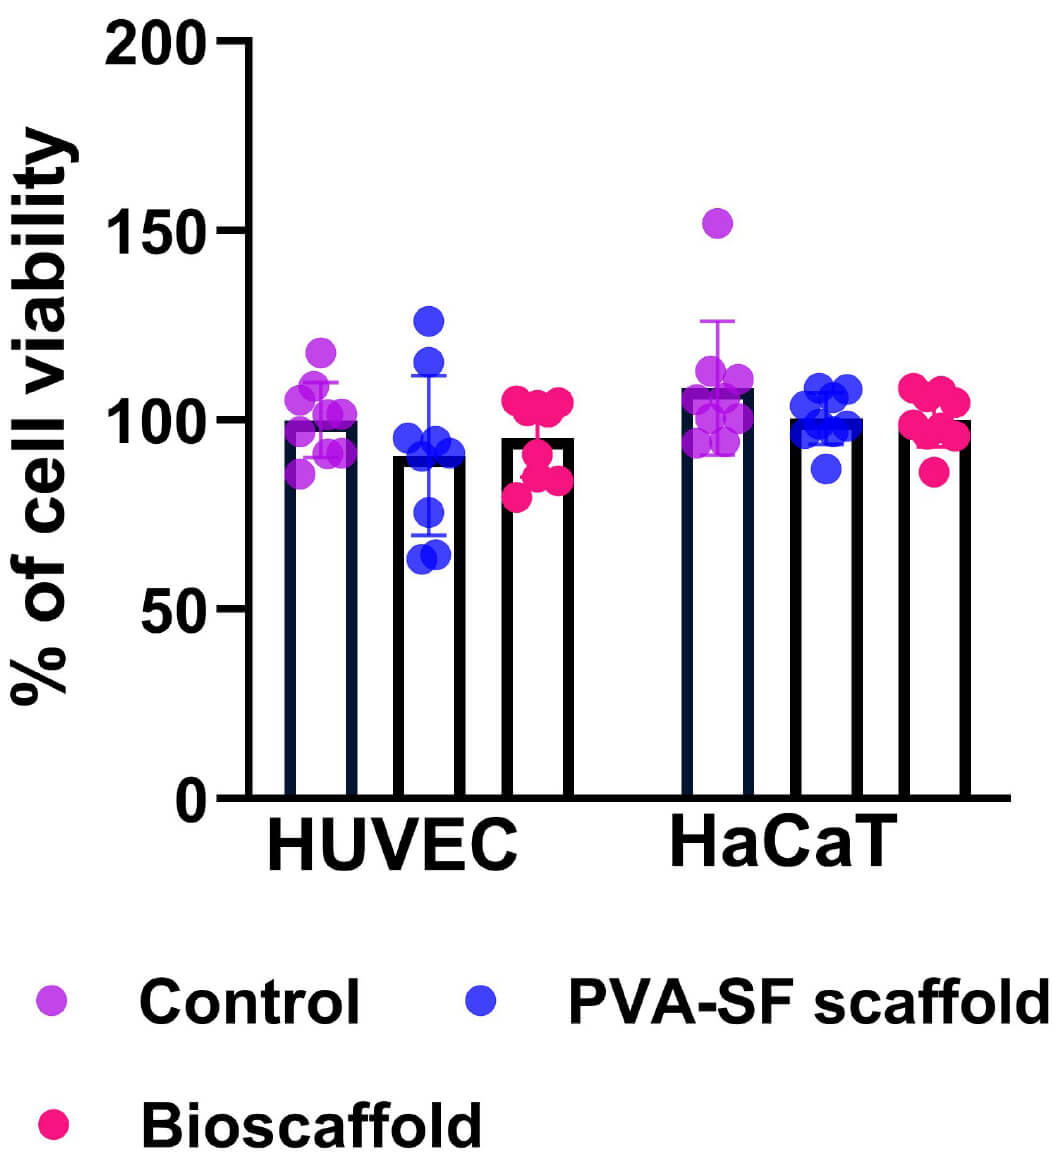 Fig. 8.
Toxicity analysis of the electrospun nanofibrous scaffolds. Quantitative scatter plot bar graphs showing the effect of nanofibrous scaffolds
on the viability of HUVECs and HaCaTs cells. Cell viability was measured 72 hours
after the scaffold was added to the cells. Data are represented as mean
The scratch assay was used to demonstrate the angiogenic potential of
bioscaffolds, which are an essential requirement for effective wound care
dressings. Effective cell migration is a critical step in wound repair, as it
facilitates revascularisation and nutrient delivery and promotes better
regeneration. The PVA-SF scaffold demonstrated better migration rates at 8 hours
(p = 0.019) and 12 hours (p = 0.025) compared to
bioscaffold-treated cells. However, bioscaffold-treated cells showed better
migration (91
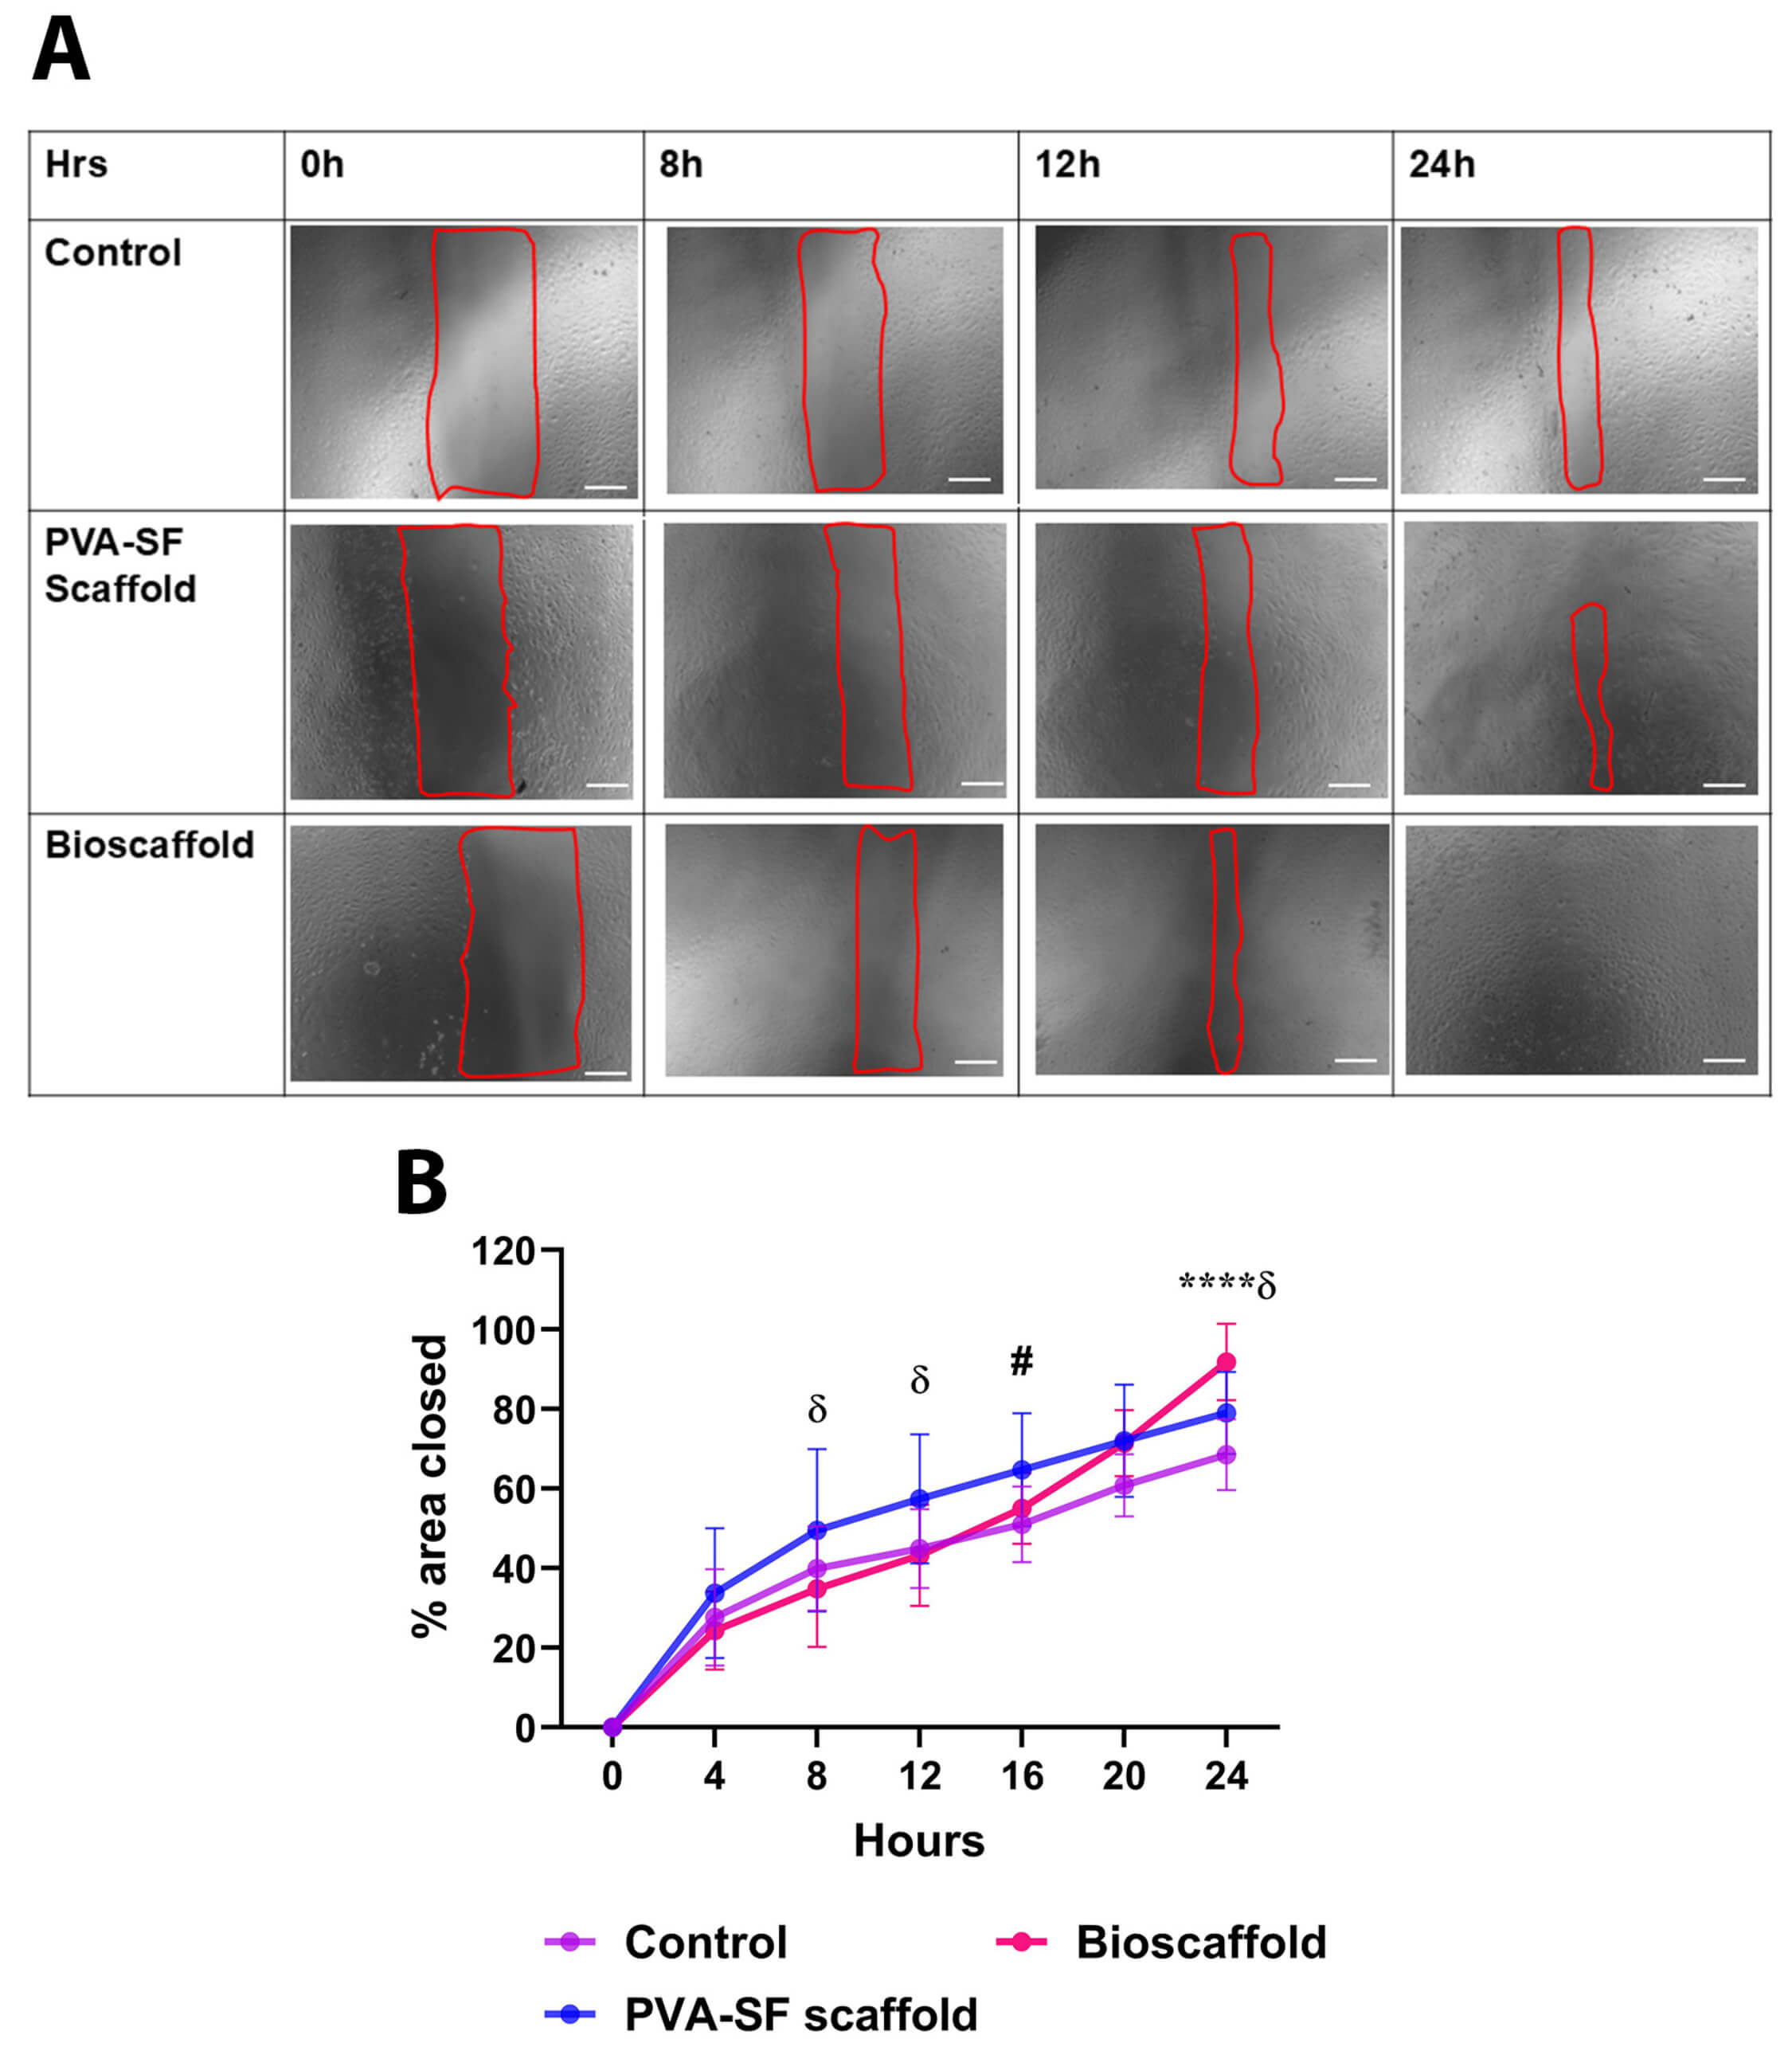 Fig. 9.
Wound healing analysis of the electrospun nanofibrous scaffolds. (A) Representative bright-field microscopic images showing HUVEC migration at
different time points. Images were captured at 4
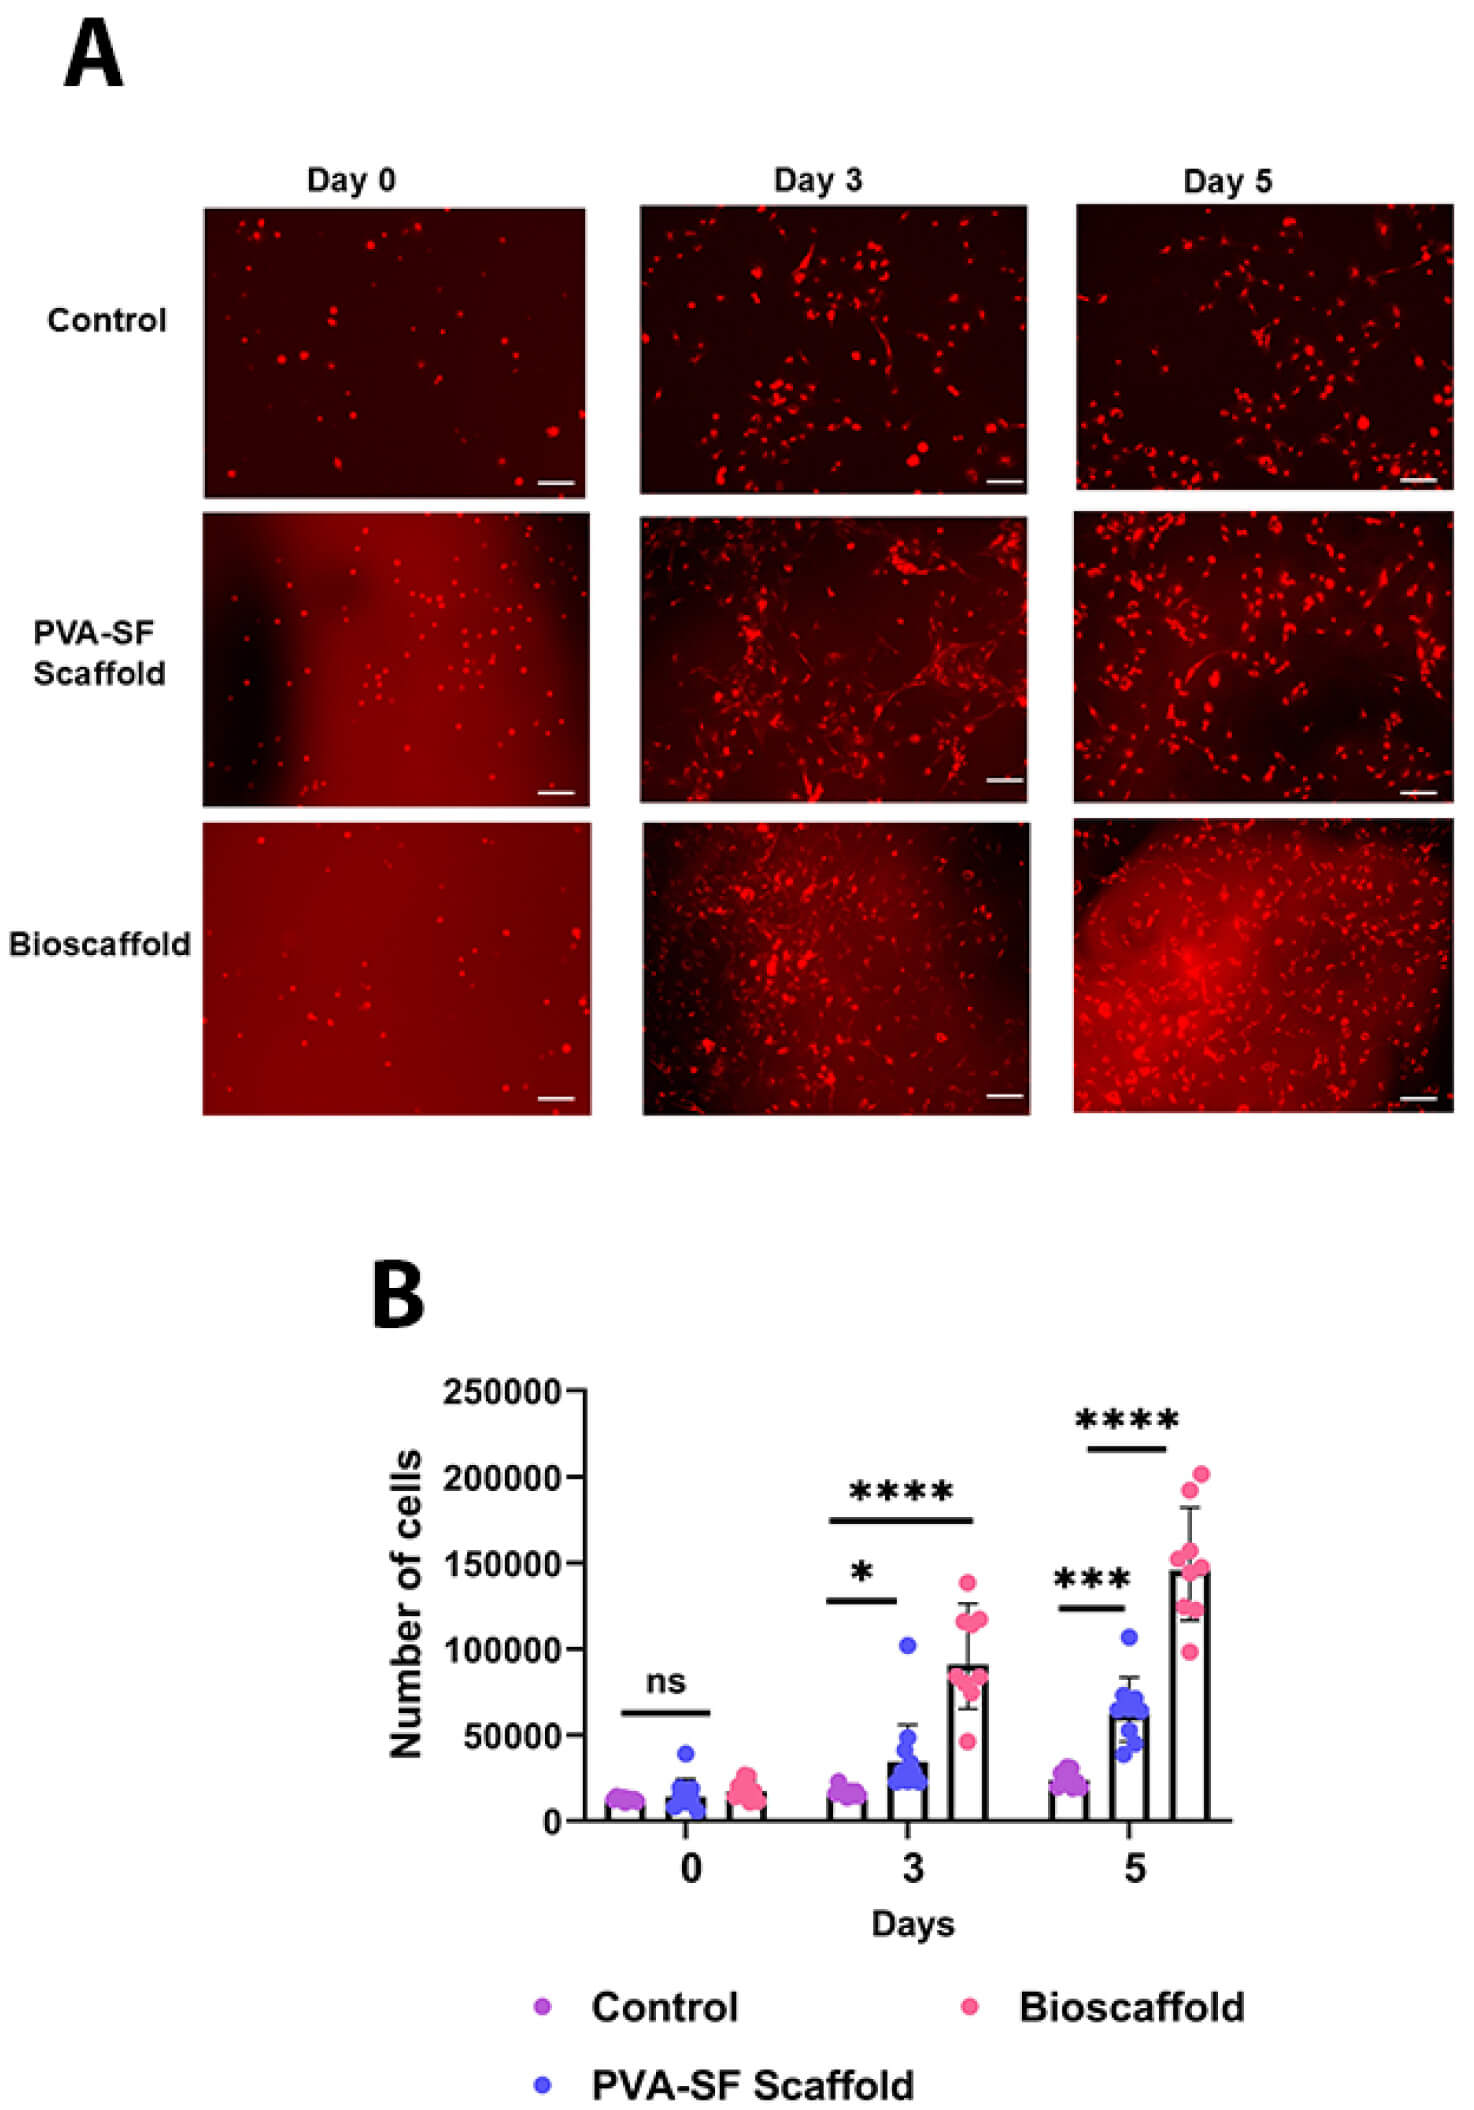
The efficacy of the bioscaffold in supporting cell growth and proliferation was determined using DiI-labelled AC-16 cells. Fluorescence images demonstrated both PVA-SF and bioscaffold supported the proliferation of cells over the cultured period (Fig. 10A). Further quantification on AC-16 cells cultured on the bioscaffold confirmed better growth on bioscaffold compared to other groups (Fig. 10B). Notably, the cells displayed a well-defined elongation and spreading morphology, indicating that the nanofibers successfully mimic the ECM, thereby providing the required microenvironment for the cells to attach and grow.
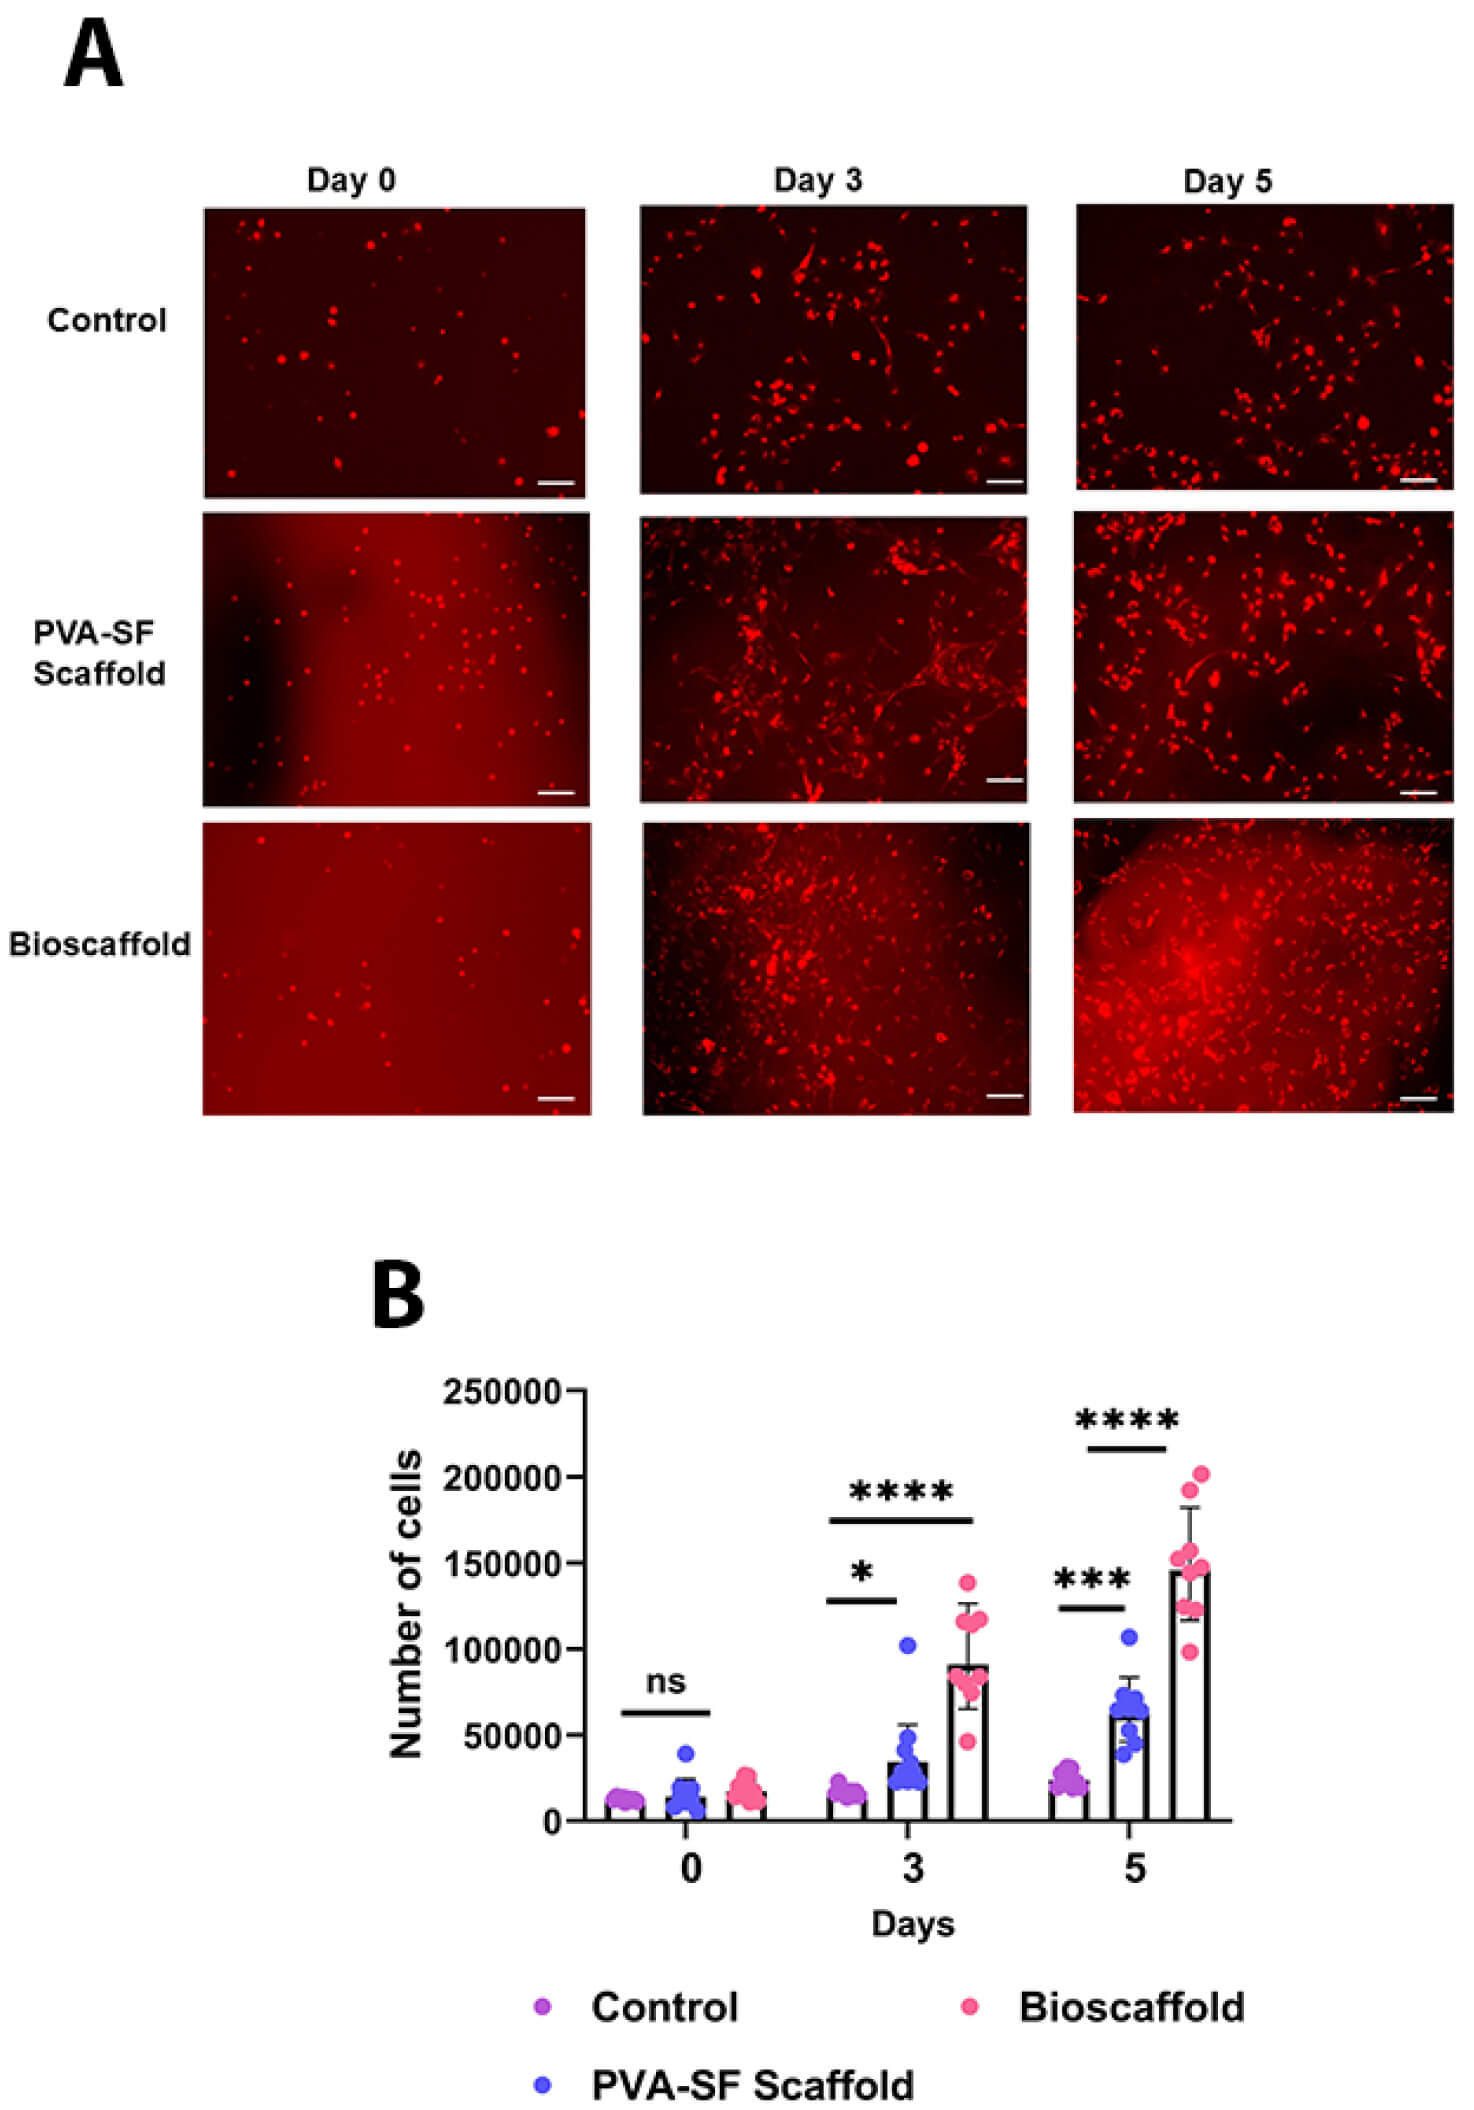 Fig. 10.
Proliferation assay of the electrospun nanofibrous scaffolds. (A) Proliferation of DiI labelled AC-16 cells on nanofibrous scaffolds at different
time points. Images captured at 4
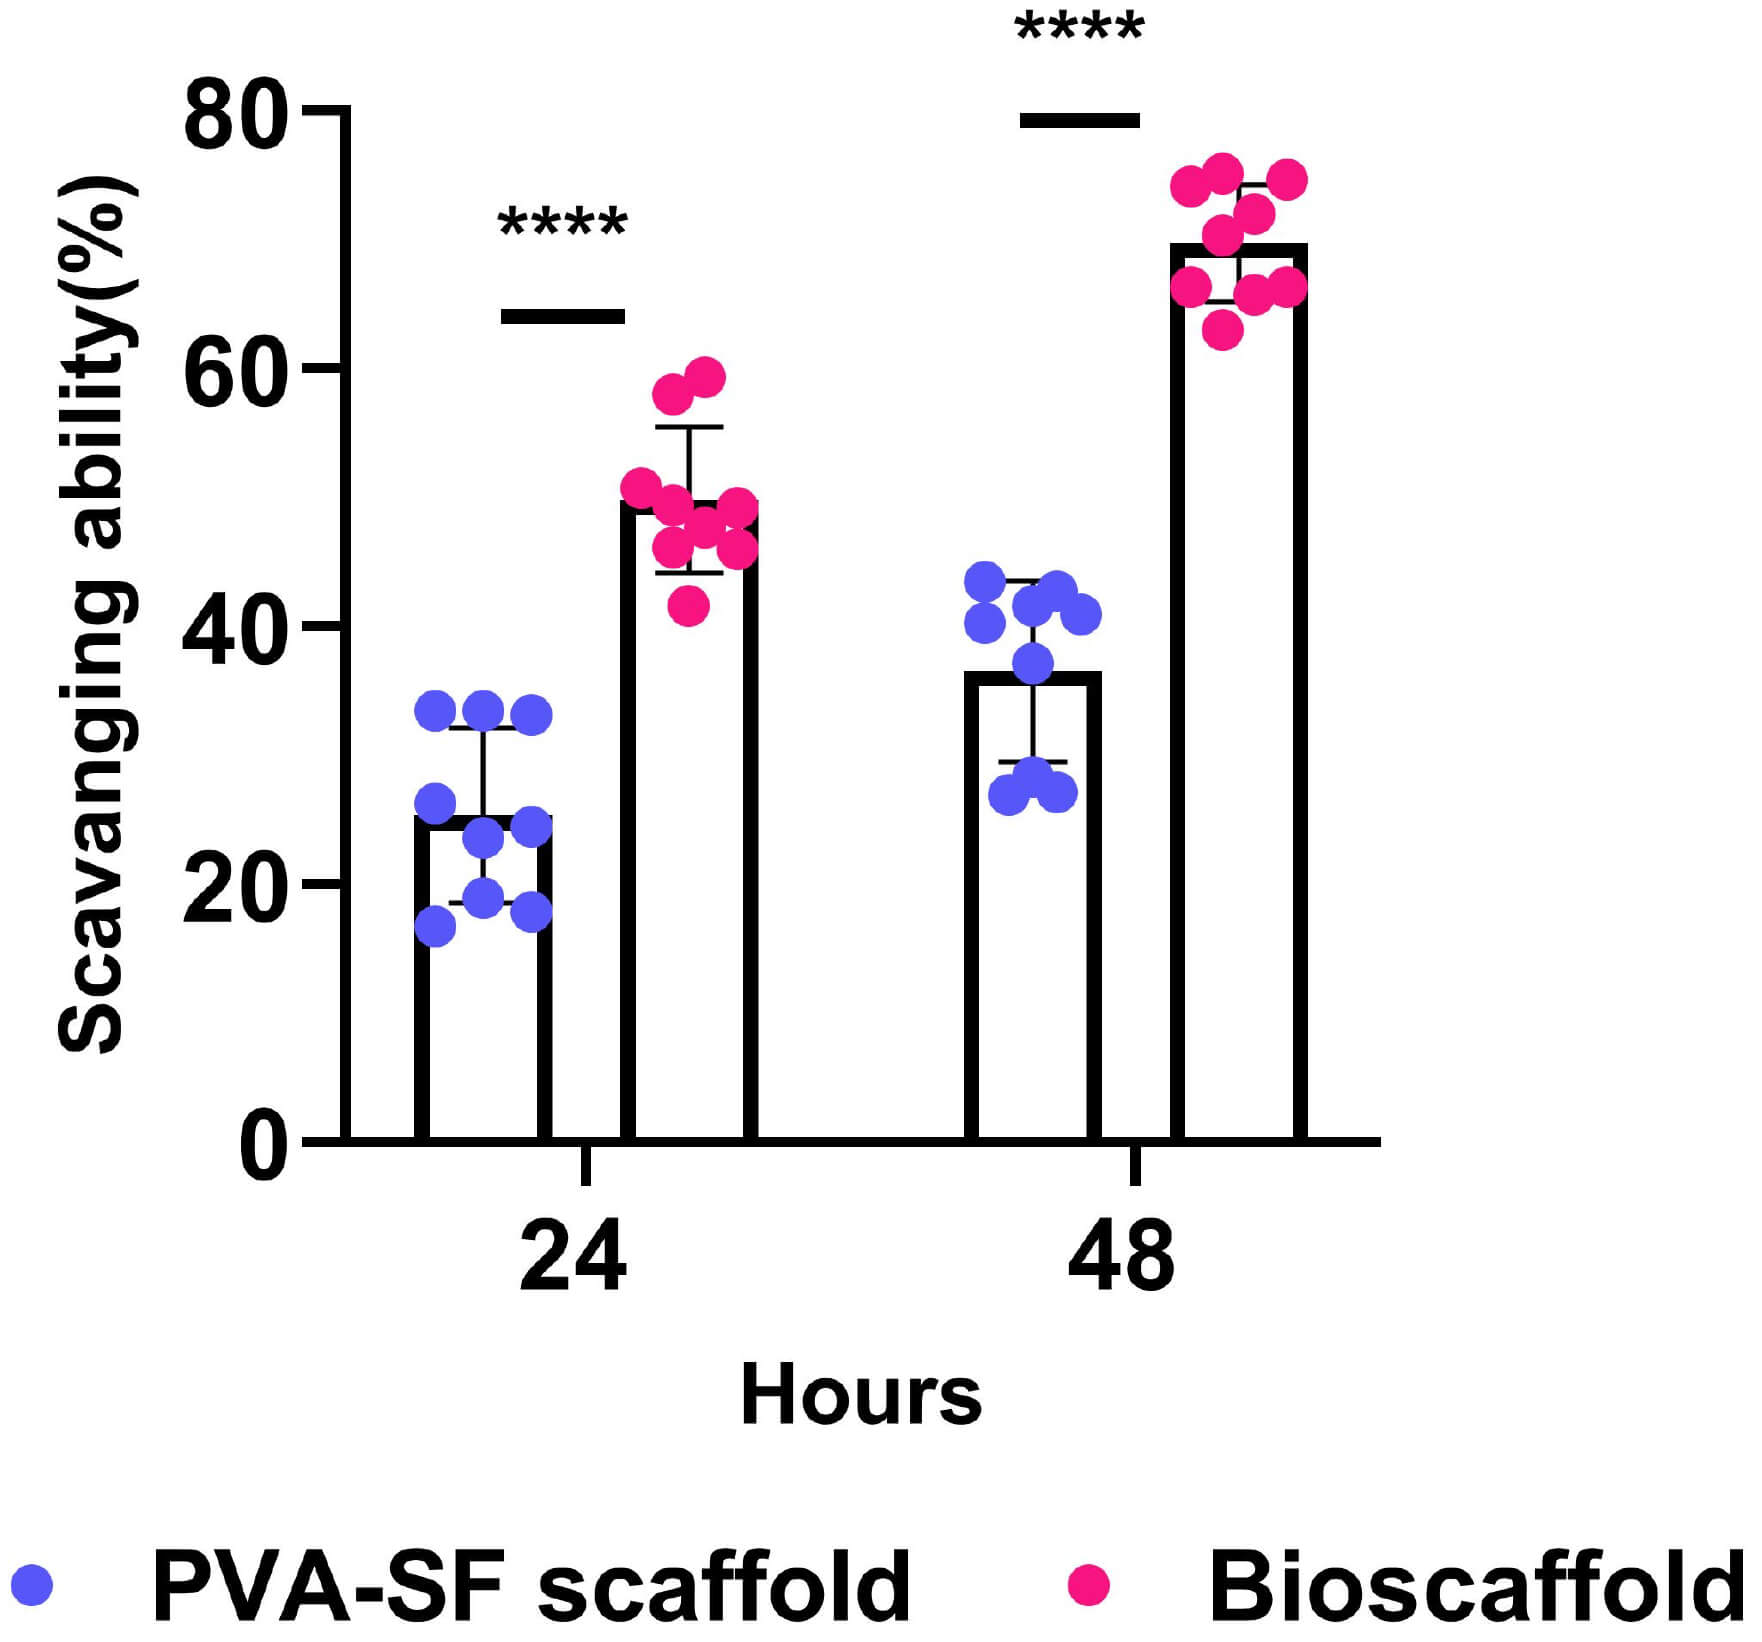
The antioxidant capacity of the scaffolds was evaluated using the DPPH
radical-scavenging assay. Both the PVA-SF scaffold and the bioscaffold exhibited
antioxidant activity (Fig. 11). The bioscaffold demonstrated the highest free
DPPH radical scavenging activity at both 24 (47.24
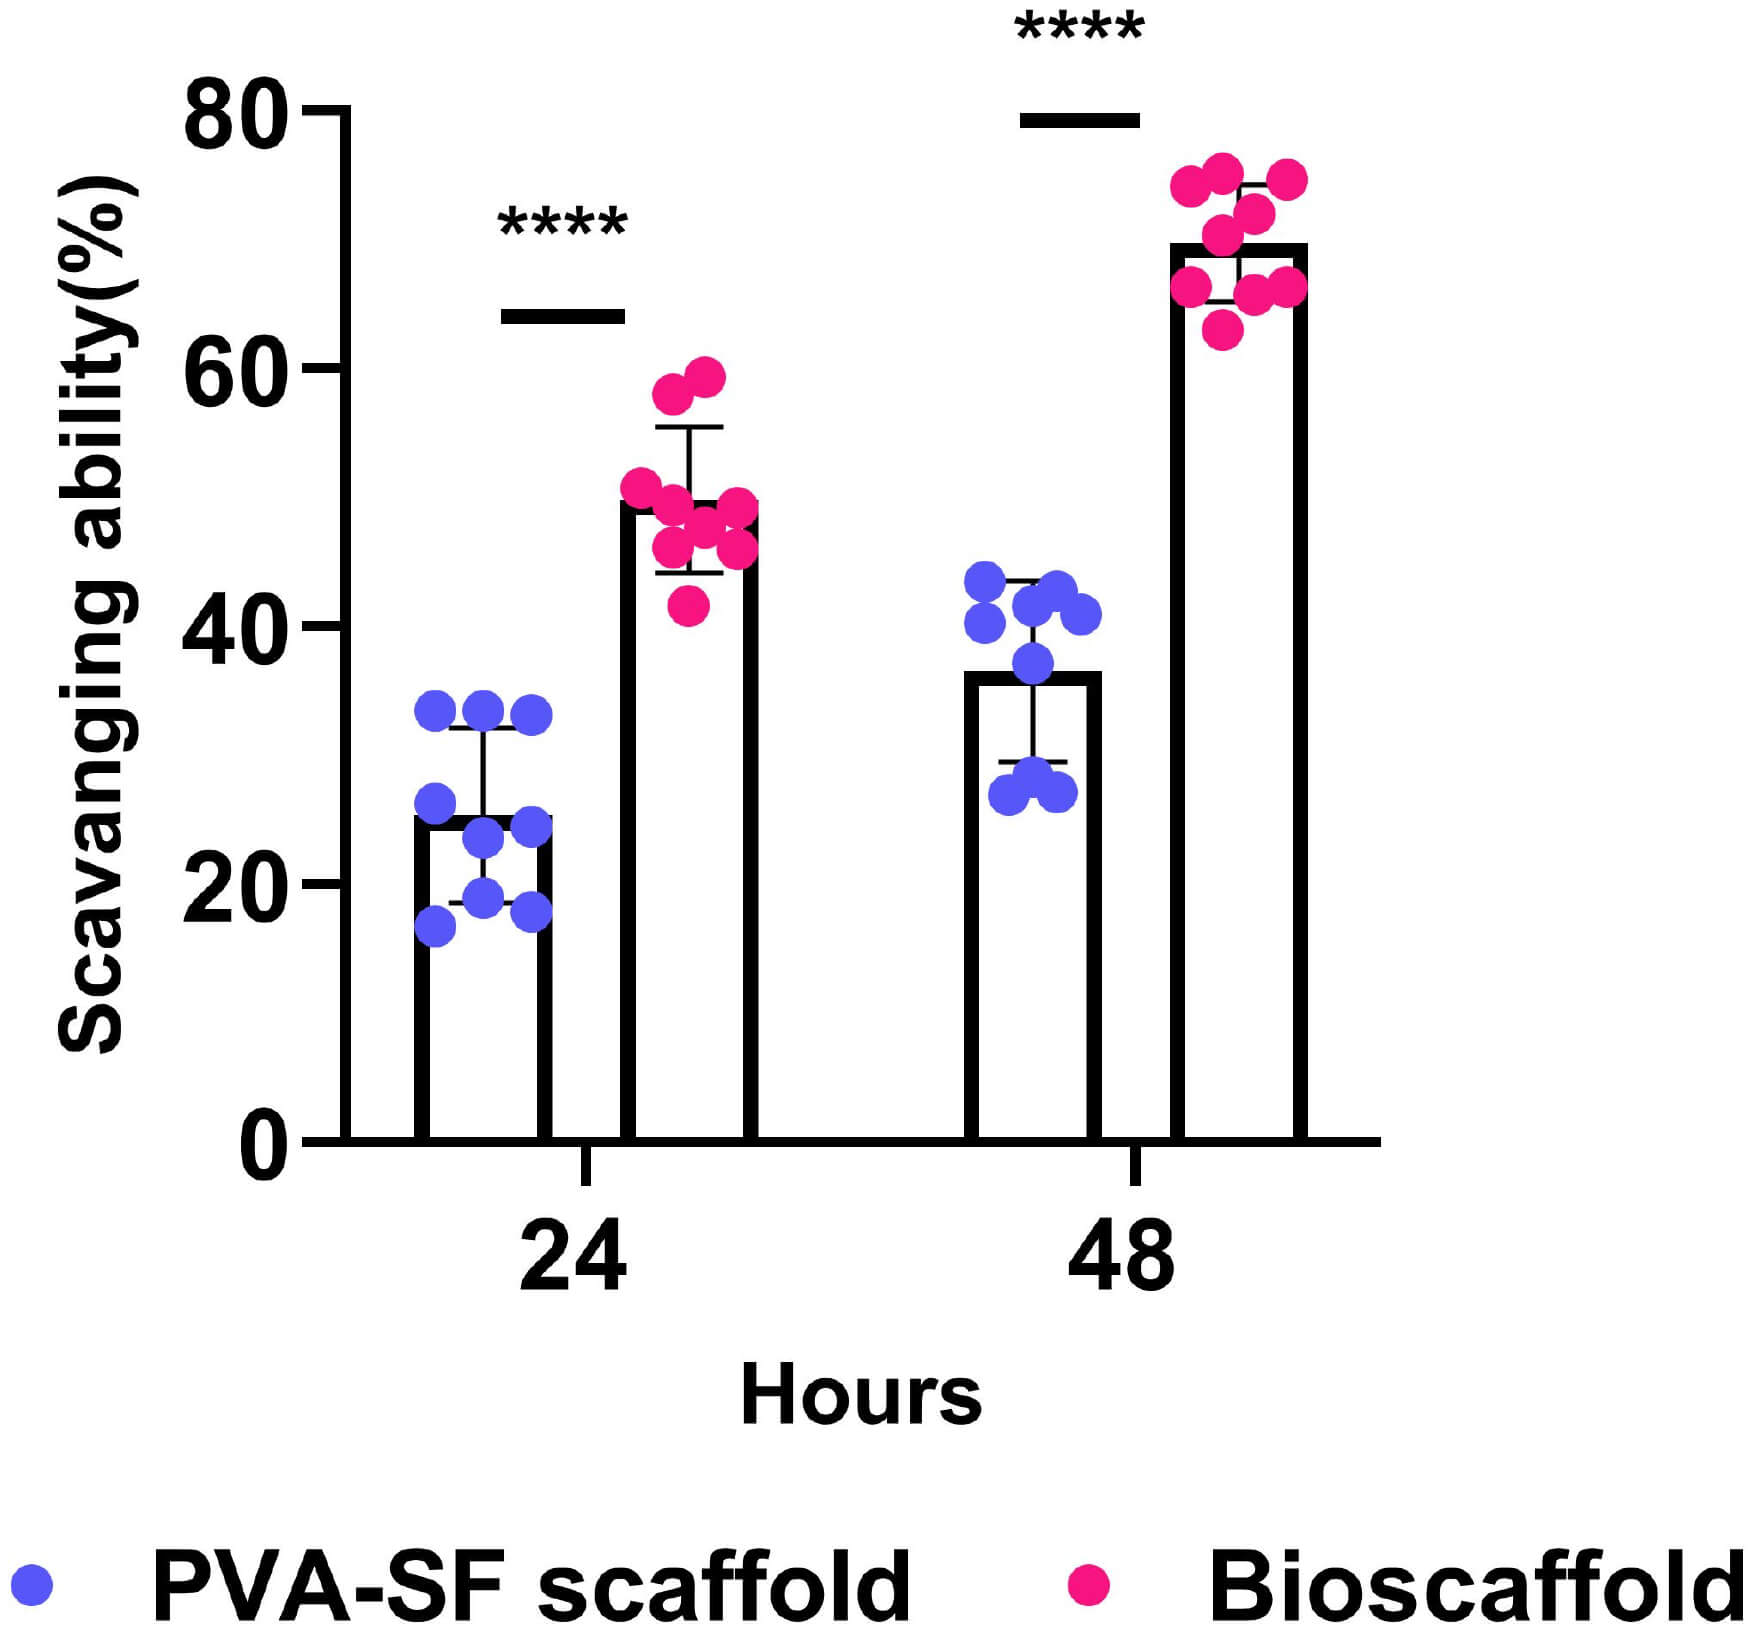 Fig. 11.
Antioxidant activity analysis of the electrospun scaffolds.
Quantitative scatter plot bar graphs showing the DPPH scavenging activity of
scaffolds at 24 and 48 h. Comparison was done using a two-way ANOVA followed by
uncorrected Fisher’s LSD. Data are presented as a percentage of scavenging
ability
Tissue repair and regeneration are dynamic and complex process that requires the coordinated activity of growth factors, ECM components, and both resident and recruited cells. The ECM provides a structural and biochemical scaffold that is essential for cell adhesion, proliferation, migration, and differentiation, thereby guiding effective tissue regeneration [51]. In this study, we successfully fabricated a composite bioscaffold integrating synthetic PVA with natural components such as silk fibroin, Manuka honey, fenugreek seed extract, and Ghrelin. This integration aims to leverage the complementary properties of these materials for wound healing and broader biomedical applications. Wound healing is often impaired by excessive ROS [52], chronic inflammation [53], and inadequate angiogenesis [54]. The natural additives selected for this study, Manuka honey, fenugreek seed extract, and Ghrelin, were chosen specifically to address these barriers. Manuka honey is well documented for its antibacterial and anti-inflammatory effects [55, 56, 57], fenugreek seeds are known for their antioxidant and collagen-promoting properties [25], and Ghrelin is recognized for its proangiogenic and cytoprotective effects [58, 59]. By successfully embedding all three natural additives within a nanofibrous PVA-SF matrix, we aimed to achieve a synergistic, multi-modal therapeutic effect.
Our optimization of the electrospinning process produced nanofibers with diameters less than 200 nm, which are favourable for mimicking the native ECM and enhancing cell-scaffold interactions to promote cell growth, differentiation, and proliferation [32, 33, 34]. SEM analysis confirmed that the fibres were uniform and defect-free. The slight increase in the diameter of the bioscaffold fibres is likely due to changes in viscosity resulting from the incorporation of the natural additives. FTIR spectra indicated successful blending, with minor shifts in functional group peaks suggesting molecular interactions between the polymer matrix and the bioactive compounds. Physicochemical assessments demonstrated that the bioscaffold maintained its structural integrity, experiencing less than 30% degradation over 28 days, indicating its suitability for providing sustained therapeutic support during tissue healing. Thermal analyses (thermogravimetric analysis and differential scanning calorimetry) revealed that incorporating natural compounds, especially Manuka honey, increased the scaffold’s glass transition temperature and thermal stability, potentially enhancing its flexibility and resistance to brittleness [45]. These properties are advantageous for clinical handling and applications requiring prolonged scaffold residence in the wound bed [60]. Functionally, the bioscaffold showed no cytotoxicity in HUVECs and human keratinocytes (HaCaT), fulfilling a fundamental requirement for biomedical use [50]. More importantly, it significantly enhanced endothelial cell migration at 24 hours and supported robust proliferation of human cardiomyocytes, aligning with its intended pro-regenerative role. The bioscaffold’s antioxidant capacity was markedly higher than that of the control PVA-SF scaffold, suggesting it can mitigate ROS-mediated cellular damage, a key factor in chronic wound pathology [52]. Our findings support and extend prior studies that have incorporated individual natural compounds into electrospun scaffolds [57, 61, 62]. By combining these three agents with complementary mechanisms, we observed multifaceted functional benefits without compromising scaffold integrity or biocompatibility. This positions the developed bioscaffold as a promising platform for wound healing and potentially for targeted drug delivery, biosensors, and tissue engineering.
The main limitation of our study is the lack of ghrelin-specific peak in the FTIR spectra, which was likely due to interference or overlap with the polymer spectra. However, the improvement in endothelial cell migration observed in a scratch assay suggests potential incorporation of Ghrelin, although these findings require further validation. Nevertheless, our functional assays demonstrated significant antioxidant and proangiogenic effects in vitro, indicating that the incorporated bioactive agents were released from the nanofiber scaffolds, remained biologically active, and were taken up by cells. Future investigation should focus on the controlled-release kinetics of the bioactive agents, on assessing the bioscaffold in in vivo wound-healing models, and on scaling up fabrication for clinical use.
In summary, we successfully fabricated a composite bioscaffold that integrates synthetic PVA with natural components, including silk fibroin, Manuka honey, and fenugreek seed extract with potential incorporation of Ghrelin. Although previous studies have incorporated individual natural compounds into electrospun scaffolds [57, 61, 62], to our knowledge, this is the first report of a bioscaffold with this combination as a mechanistic therapeutic strategy. A combination of these three agents, with complementary mechanisms, exhibited sustained degradation, enhanced angiogenesis, cell proliferation, and increased antioxidant capacity, without compromising scaffold integrity or biocompatibility, making it a strong candidate for wound healing and potentially for targeted drug delivery, biosensors, and tissue engineering.
AC-16, Cardiomyocytes; ATR-FTIR, Attenuated total reflectance Fourier transform infrared spectroscopy; DiI, 1,1′-Dioctadecyl-3,3,3′,3′-Tetramethylindocarbocyanine Perchlorate; DMEM, Dulbecco’s modified Eagle medium; DPPH, 1,1-diphenyl-2-picrylhydrazyl; DSC, Differential scanning calorimetry; ECM, Extracellular matrix; FBS, Fetal bovine serum; FTIR, Fourier-transform infrared; HaCaT, Human keratinocyte cell line; HUVEC, Human umbilical vein endothelial cell line; M200, Endothelial basal medium; MTT, 3-(4,5-dimethylthiazol-2-yl)-2,5-diphenyltetrazolium bromide; PBS, Phosphate buffer saline; PVA, Polyvinyl alcohol; ROS, Reactive oxygen species; SEM, Scanning electron microscopy; SF, Silk fibroin; Tg, The glass transition temperature; TGA, Thermogravimetric analysis.
The datasets used and analyzed during the current study are available from the corresponding author on reasonable request.
SS: Writing – original draft, Software, Formal analysis, Validation, Investigation, Methodology, Data curation. JAMS: Writing – original draft, Software, Formal analysis, Validation, Investigation, Methodology, Data curation. AA: Writing – review & editing, Conceptualisation, Resources, Supervision. RK: Writing – review & editing, Conceptualisation, Funding acquisition, Resources, Supervision. All authors read and approved the final manuscript. All authors have participated sufficiently in the work and agreed to be accountable for all aspects of the work.
Not applicable.
The authors would like to thank the Otago Electron Microscopy Team for their immense support with scanning electron microscopy and Manuka Med New Zealand for providing Manuka honey samples for this study. The graphic abstract was created with BioRender.com (Katare, R. (2026) https://BioRender.com/5s3toyf) and powerpoint.
This research was supported by funding from the Ministry of Business, Innovation and Employment NZ (UOOX2205). JAMS is supported by the PhD scholarship from the Heart Foundation NZ (Grant id-PJ-0000154).
All authors declare no conflicts of interest. Despite they received samples from Manuka Med New Zealand, the judgments in data interpretation and writing were not influenced by this relationship. Given his role as the Guest Editor and Editorial Board member, Rajesh Katare had no involvement in the peer-review of this article and has no access to information regarding its peer review. Full responsibility for the editorial process for this article was delegated to Francesca Diomede.
During the preparation of this work, the authors used ChatGPT4.0 and Grammarly in order to check and correct the language and typographical and grammatical errors. After using this tool/service, the authors reviewed and edited the content as needed and take full responsibility for the content of the publication.
Supplementary material associated with this article can be found, in the online version, at https://doi.org/10.31083/FBL50459.
References
Publisher’s Note: IMR Press stays neutral with regard to jurisdictional claims in published maps and institutional affiliations.