

 , Weixiao Nan 1,3,*
1 College of Animal Science and Technology, Jilin Agricultural University, 130118 Changchun, Jilin, China
2 College of Agriculture, Chifeng University, 024000 Chifeng, Inner Mongolia Autonomous Region, China
3 Joint International Research Laboratory of Modern Agricultural Technology, Ministry of Education, Jilin Agricultural University, 130118 Changchun, Jilin, China
†These authors contributed equally.
Abstract
Arginine (Arg) is a functional amino acid implicated in tissue growth, but its effects on deer antler reserve mesenchymal cells (RMCs) remain unclear.
We evaluated Arg-induced changes in the proliferation and chondrogenic differentiation of RMCs in vivo and in vitro and characterized the associated transcriptomic signatures.
Dietary supplementation with Arg increased the proportion of Ki67-positive cells in the mesenchymal cell–rich region of growing antlers. In vitro, Arg enhanced RMC viability and 5-Ethynyl-2′-deoxyuridine incorporation assay (EdU)incorporation in a dose-dependent manner, with 400 μM showing the strongest effect. RNA sequencing revealed broad transcriptional remodeling, with enrichment of extracellular matrix (ECM)/adhesion programs and growth-related pathways including PI3K-Akt, Wnt and mTOR signaling pathway. Arg also enhanced chondrogenic differentiation, as indicated by stronger Alcian blue staining and increased expression of SOX9 and COL2A1. During chondrogenic induction, Arg (800 μM) was associated with activation of mTOR signaling and attenuation of Wnt/β-catenin output.
Collectively, these findings show that Arg promotes the expansion and chondrogenic differentiation of RMCs. Moreover, the Wnt/β-catenin and mTOR pathways are candidate signaling axes linked to Arg responses.
Graphical Abstract
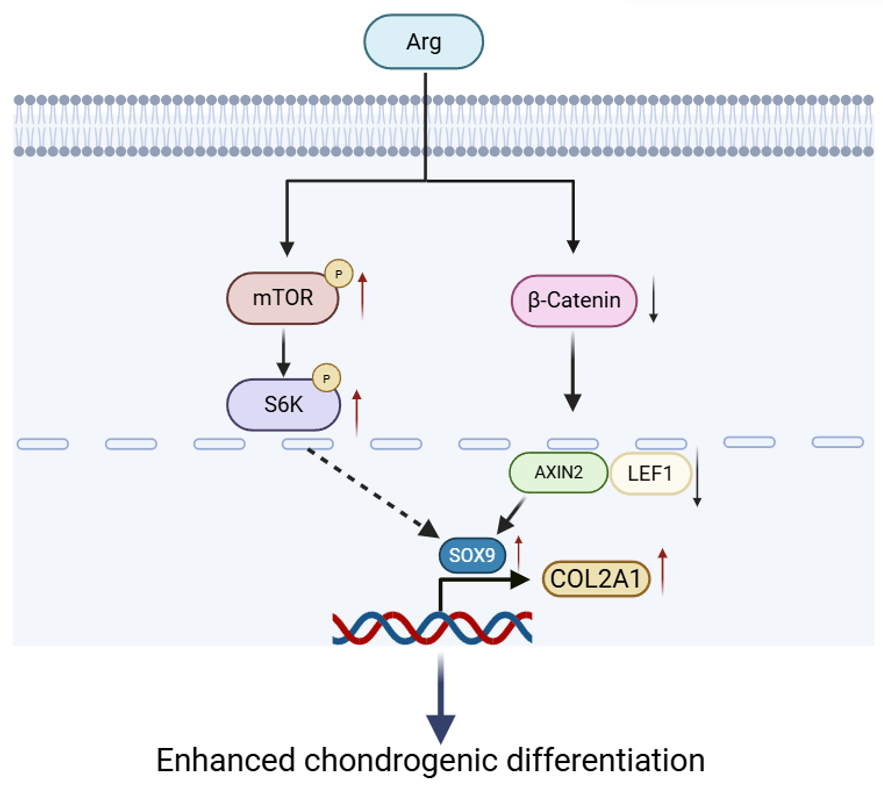
Keywords
- mesenchymal stem cells
- cell proliferation
- β-catenin
- mTOR
- arginine
Deer antlers represent a unique example of rapid and repeated organ regeneration in mammals, making them a key model for studying tissue growth, morphogenesis, and repair [1]. During antler development, the growth center produces cartilage at an unusually high rate [2]. This rapid chondrogenesis relies on a population of progenitor cells from the reserve mesenchyme that are capable of continual expansion and differentiation into various lineages [3]. Consequently, the proliferation and chondrogenic differentiation of antler reserve mesenchymal cells (RMCs) are crucial cellular processes that drive antler growth and tissue regeneration [4].
Chondrogenesis is governed by the coordinated regulation of lineage-determining transcriptional programs and assembly of the extracellular matrix (ECM) [5]. The transcription factor SOX9 is widely recognized as a master regulator of chondrocyte fate [6]. SOX9 drives the expression of key cartilage matrix genes such as COL2A1 and promotes the deposition of cartilage-like ECM components, including glycosaminoglycans and proteoglycans [7]. In addition to transcriptional regulation, cartilage formation is strongly influenced by the extracellular microenvironment [8]. ECM receptor interactions and focal adhesion signaling, largely mediated by integrins and adhesion complexes, regulate cell adhesion and migration, mechanotransduction, and downstream gene expression programs [9]. These ECM-derived cues can also interact with canonical growth and differentiation pathways, including PI3K-Akt, Hippo signaling mediated by YAP and TAZ, mTOR, and Wnt signaling, thereby integrating mechanical cues, nutrient availability, and biosynthetic demand during cartilage development and regeneration [10, 11]. However, it remains unclear how nutrient cues link to these regulatory networks and influence antler RMCs.
Arginine (Arg) is a conditionally essential amino acid that has multiple roles in regulating cell growth and metabolism [12]. Besides serving as a substrate for protein synthesis, Arg is an important precursor of nitric oxide and polyamines, as well as being involved in amino acid-sensing pathways that control anabolic signaling [13, 14]. Importantly, the availability of Arg has been shown to affect nutrient-sensitive mTORC1 signaling through specific sensing mechanisms, thereby supporting cellular biosynthesis and proliferation [15]. An increasing number of studies have also suggested that Arg can influence stem and progenitor cell behaviors and tissue repair processes by modulating growth signaling and metabolic states [15, 16, 17].
Based on this biological rationale, we previously conducted a feeding experiment using rumen-protected Arg [18]. This supplementation strategy was found to significantly increase circulating Arg levels and further improve antler yield, suggesting a potential causal relationship between Arg supply and antler growth. Although our in vivo phenotypic data support a promoting effect of Arg on antler production, the cellular targets, key transcriptional regulatory programs, and signaling networks that underlie this effect remain unclear. In particular, rapid antler growth depends on the sustained expansion and chondrogenic differentiation of RMCs, together with extensive ECM production and remodeling [19]. To elucidate the molecular mechanisms by which Arg promotes antler growth, one needs to systematically examine how it influences the proliferation and chondrogenic potential of RMCs at the cellular and molecular levels, as well as identify the associated transcriptional programs and signaling modules.
Therefore, the aims of this study were to investigate whether Arg promotes the proliferation of antler RMCs, how it reshapes their transcriptomic profiles, how it enhances chondrogenic differentiation, and whether it is associated with changes in pathway-related signaling signatures.
The experimental protocol was approved by the Animal Ethics Committee of Jilin
Agricultural University (Approval ID: 20220614005). Sixteen healthy,
four-year-old male sika deer (Cervus nippon, average body weight: 108
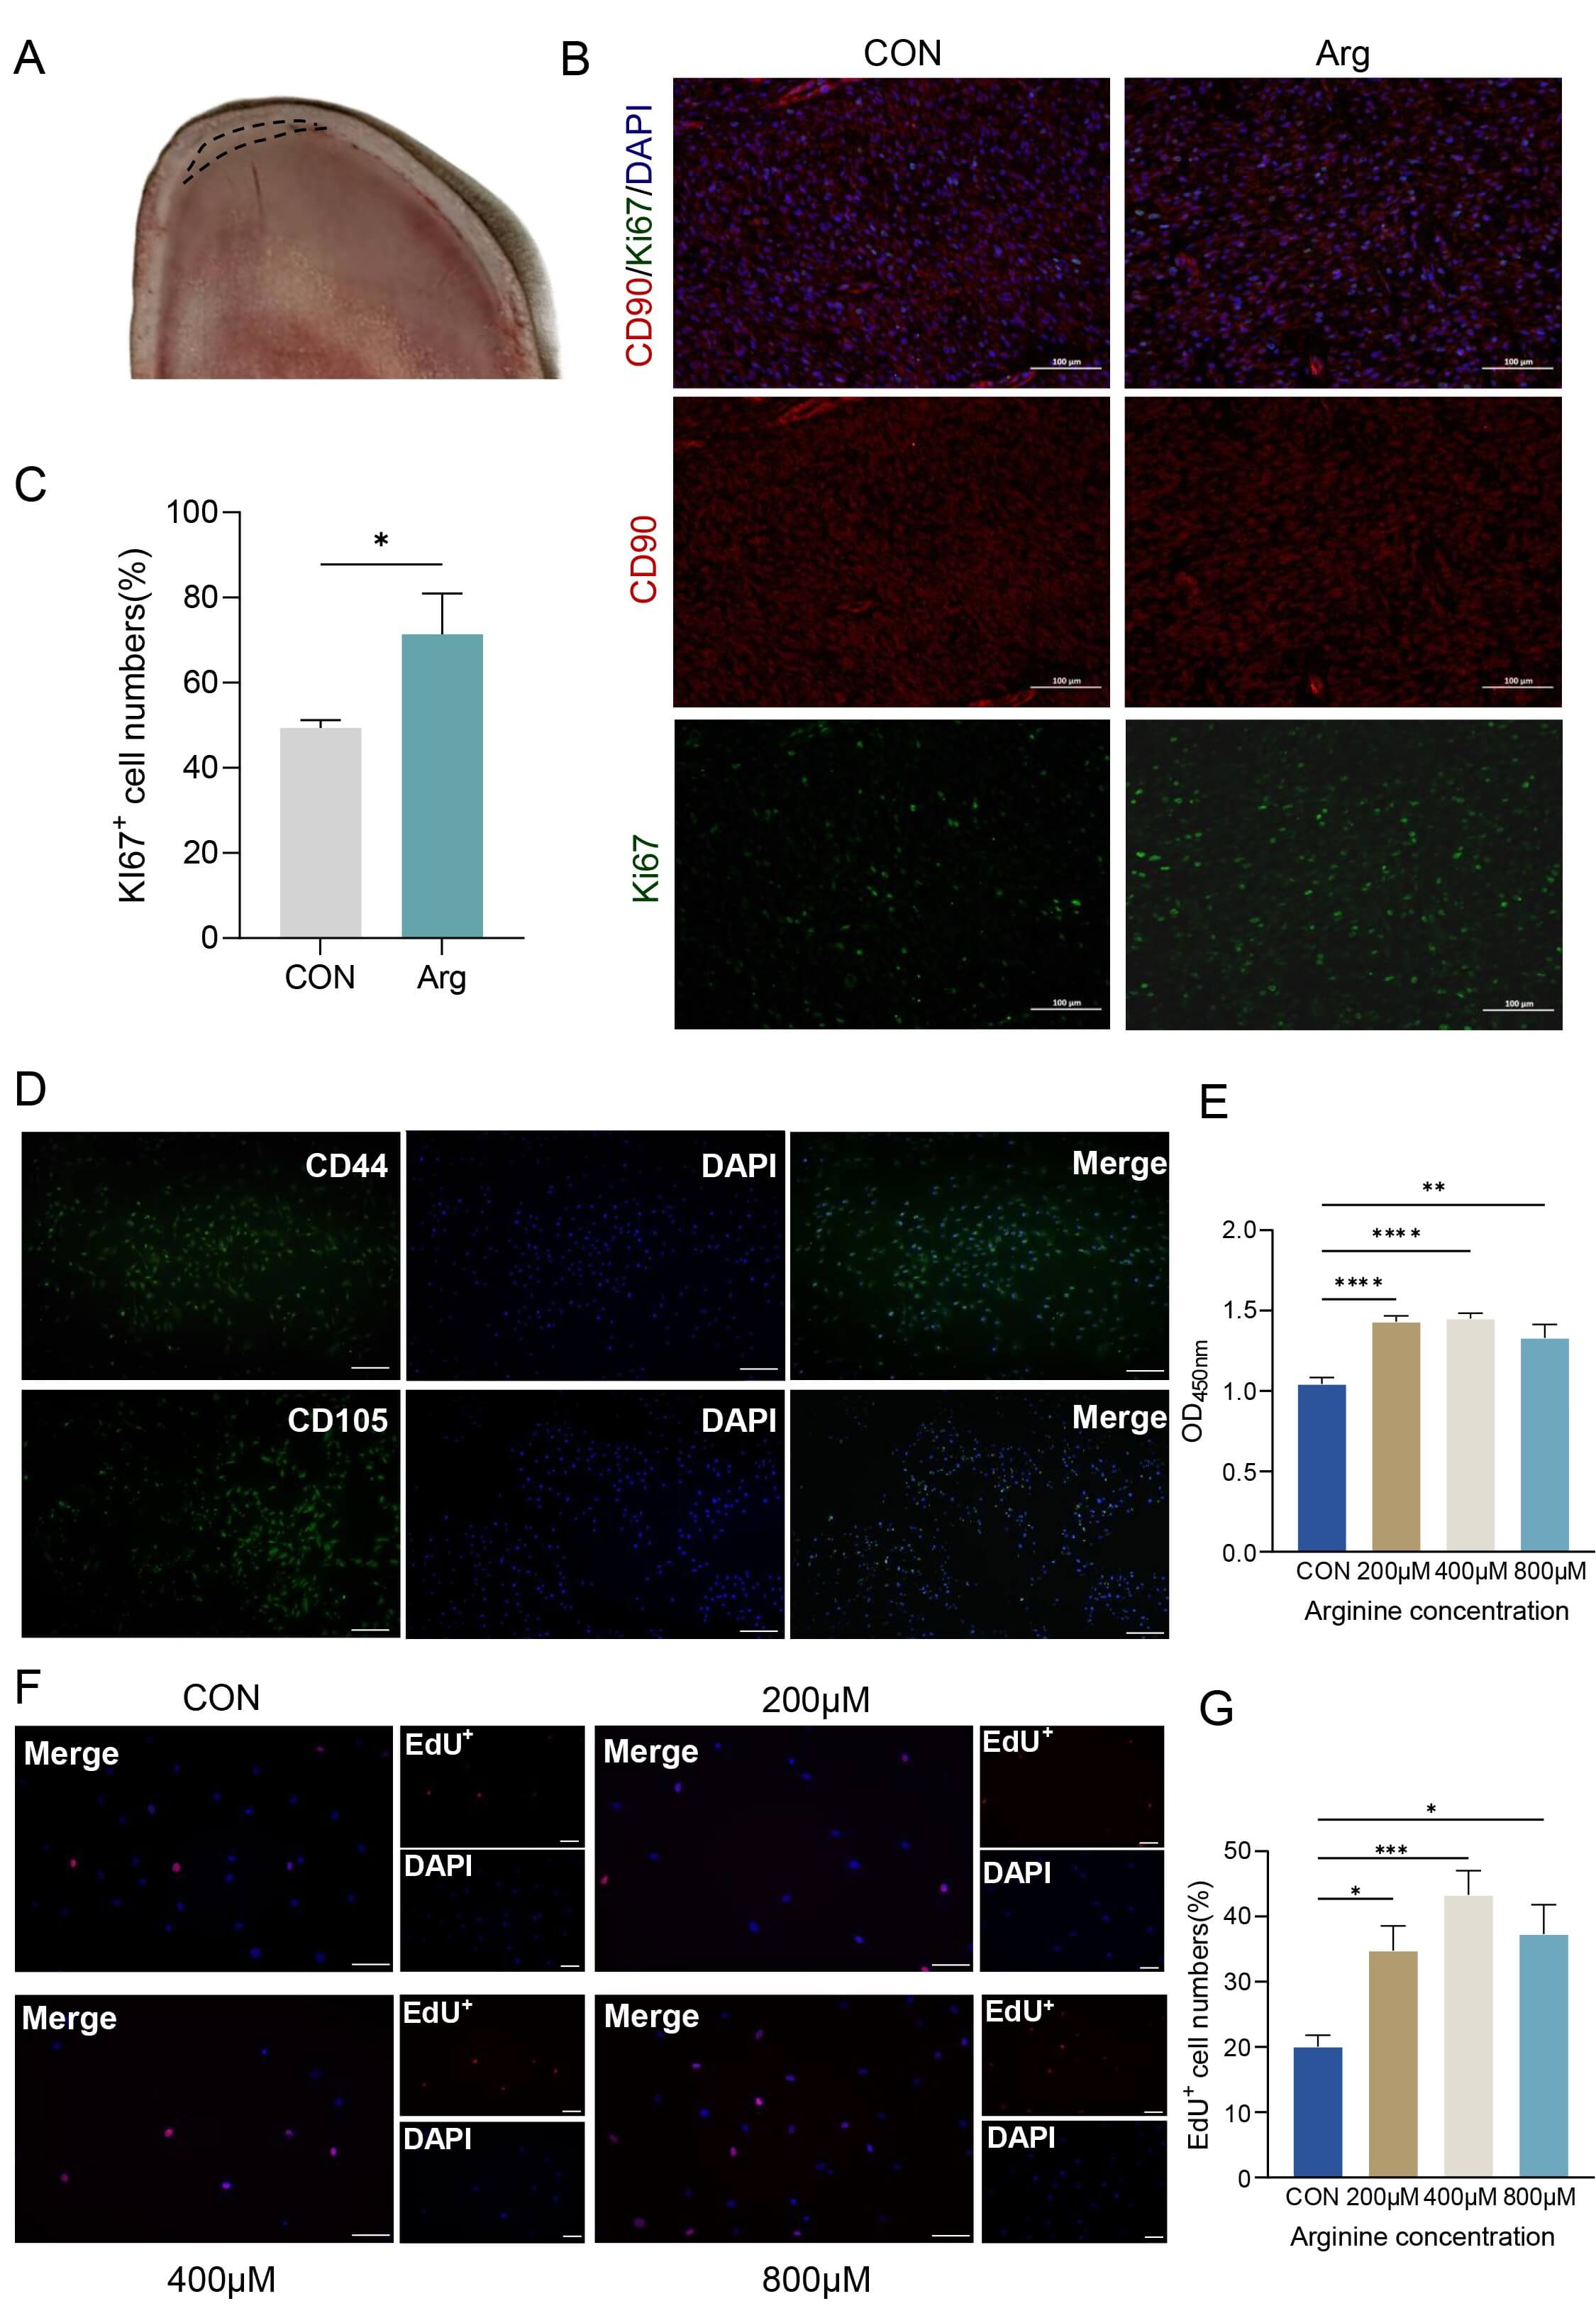
RMCs were isolated following an established protocol [20], and antler reserve mesenchymal layer (Fig. 1A) was minced and digested with 0.2% type II collagenase (093186, Gibco, Grand Island, NY, USA) at 37 °C for 2 h. After removing collagenase, digested complexes were cultured in growth medium consisting of Dulbecco’s Modified Eagle Medium (DMEM, 6125246, Gibco, Grand Island, NY, USA) supplemented with 10% fetal bovine serum (FBS, F8318, Sigma-Aldrich, St. Louis, MO, USA) and 1% penicillin-streptomycin (15140-122, Gibco, Grand Island, NY, USA) at 37 °C in a humidified incubator with 5% CO2. Cells from passages 3–5 were used for all experiments. The identity of the primary cells was validated by flow cytometric analysis of surface markers. Mycoplasma contamination was tested using the Myco-Lum™ Luminescent Mycoplasma Detection Kit for Low Sensitivity Instrument (Beyotime, C0297S). The B/A ratio was 0.76, which is below the negative threshold of 0.9 according to the kit instructions; therefore, the cells were considered mycoplasma-negative.
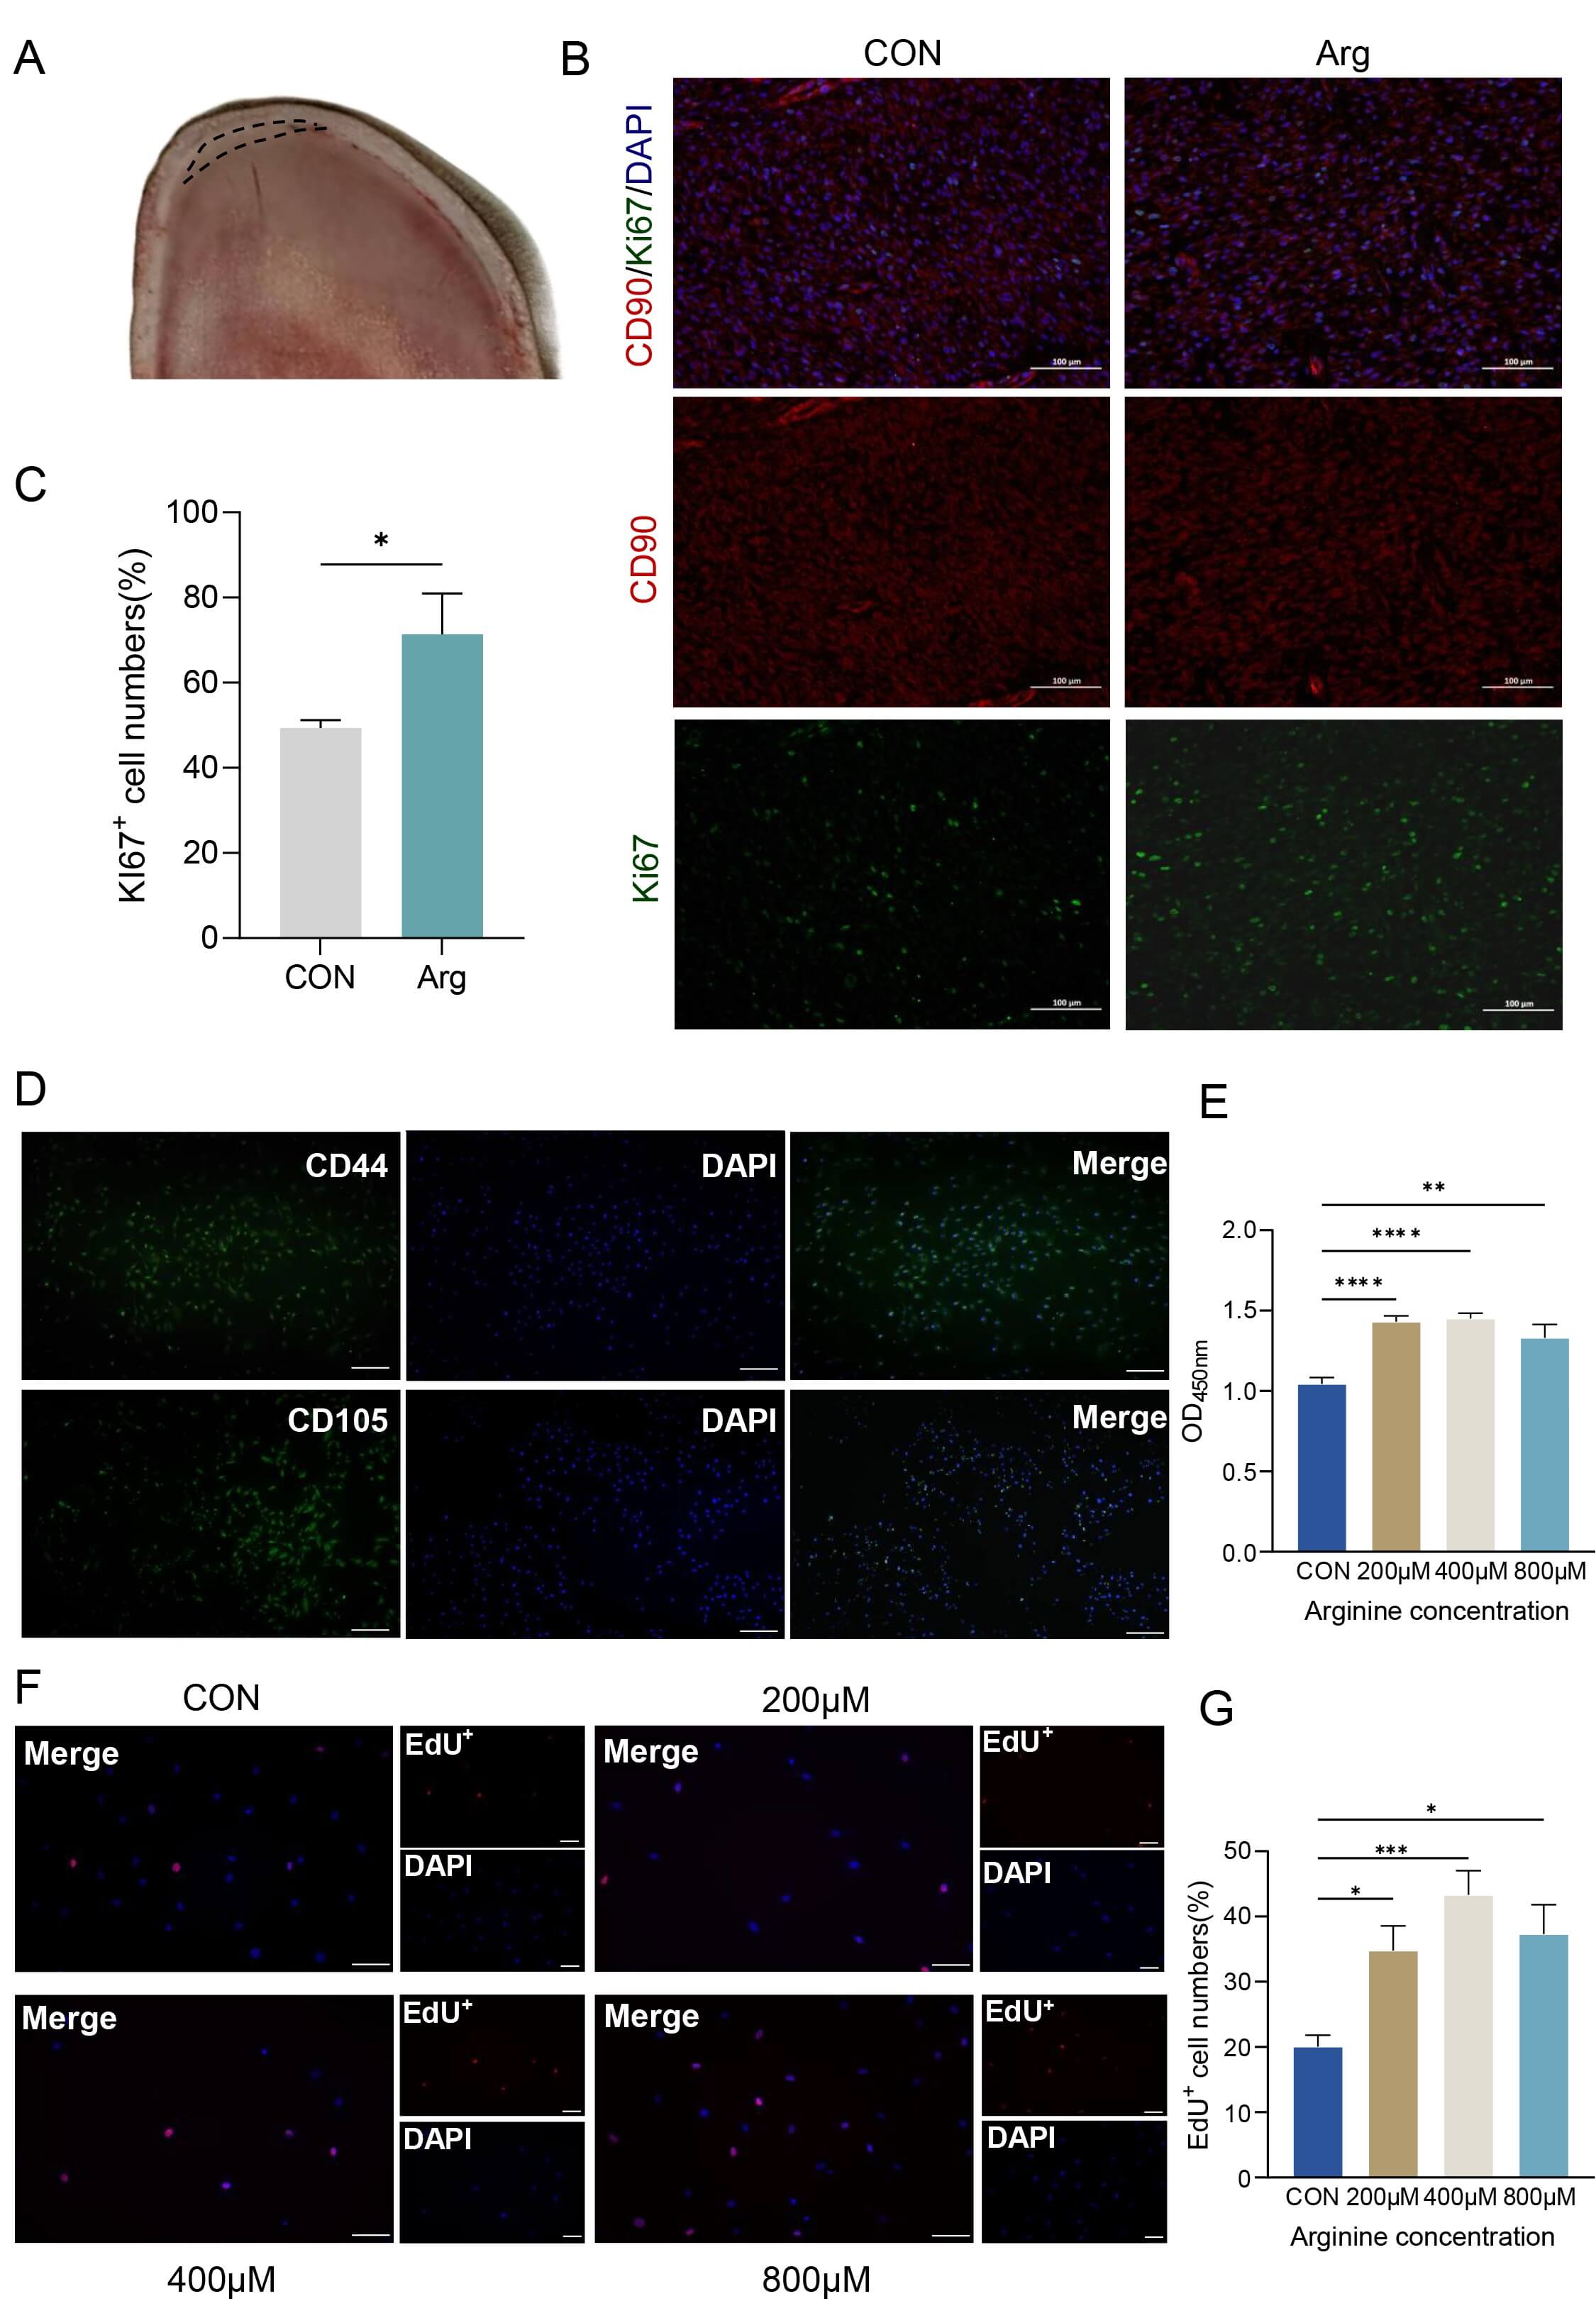 Fig. 1.
Arginine promotes the proliferation of RMCs in vivo
and in vitro. (A) Schematic diagram of the antler sampling site. (B)
Sections were co-stained for the proliferation marker Ki67 (green) and the
mesenchymal marker CD90 (red). Nuclei are counterstained with DAPI (blue). Scale
bar, 100 µm. (C) Quantitative analysis of the percentage of
Ki67-positive cells from images in (A,B). Data are presented as mean
Antler tissue was fixed in 4% paraformaldehyde at 4 °C for 24 h, decalcified in decalcification solution at room temperature with solution changes every 3 days, then dehydrated through graded ethanol, cleared in xylene and embedded in paraffin. Sections (4 µm) were cut with a rotary microtome, mounted on poly-L-lysine–coated slides and dried. For immunofluorescence, sections were deparaffinized in xylene, rehydrated through descending ethanol to water, and subjected to antigen retrieval in 10 mM citrate buffer (pH 6.0) by microwave heating for about 10 min. After cooling, sections were washed with PBS, permeabilized with 0.3% Triton X-100 (P0096, Beyotime, Shanghai, China) and blocked with 10% normal goat serum for 30 min at room temperature. Slides were incubated with CD90 (27178-1-AP, dilution 1:500; Proteintech, Wuhan, China) and Ki67 (27309-1-AP, dilution 1:500; Proteintech, Wuhan, China) antibody at 4 °C overnight, washed, and then incubated with a fluorophore-conjugated secondary antibody (A0453, dilution 1:500; Beyotime, Shanghai, China) for 1 h in the dark. Nuclei were counterstained with DAPI (ZE0815, Vector Laboratories, Newark, CA, USA), and sections were mounted with anti-fade medium. Images were captured using a fluorescence microscope under identical settings, and fluorescence signals were analyzed with ImageJ software (Version 1.53t, National Institutes of Health, Bethesda, MD, USA). All animal samples were coded by a third party who was not involved in the histological quantification, and the histological quantification was performed in a blinded manner to avoid subjective bias.
RMCs were cultured in a 24-well cell culture dish for immunofluorescence. Cells
were incubated with the indicated primary antibodies CD44 (5675-1-AP, dilution
1:500; Proteintech, Wuhan, China), CD105 (10862-1-AP, dilution 1:500;
Proteintech, Wuhan, China) or
To examine the differentiation ability of RMCs, osteogenic and chondrogenic
differentiation was induced in vitro. Briefly, cells were seeded at 5
Flow cytometry was performed to assess the expression of CD44 and CD105 in isolated RMCs. Cells were harvested, washed with PBS, and incubated with the corresponding primary antibodies or isotype controls, followed by incubation with the appropriate fluorescent secondary antibody. After washing, the cells were analyzed using a flow cytometer (BD Biosciences, San Jose, CA, USA), and the data were processed with FlowJo software (Version 10.8, BD Biosciences, Ashland, OR, USA). Positive gates were set according to the isotype control.
To assess the effect of Arg on RMCs proliferation, cells were treated with
various L-Arg concentrations in an L-Arg-deficient basal medium (MA0545,
Meilunbio, Dalian, Liaoning, China). L-Arg (A8094, Sigma-Aldrich, St. Louis, MO,
USA) was dissolved in PBS to prepare a stock solution and then diluted into the
Arg-deficient basal medium to the indicated final concentrations (0, 200, 400,
and 800 µM). Control cells received the same volume of vehicle. RMCs were
seeded in 96-well plates at a density of 3
For RNA Sequencing (RNA-seq), cells cultured under proliferative conditions were
treated with 400 µM Arg, which showed the strongest pro-proliferative
effect. Total RNA was extracted from control and 400 µM Arg-treated RMCs (n
= 3 biological replicates per group) using TRIzol reagent (RE34142520,
Invitrogen, Carlsbad, California, USA). RNA integrity was confirmed with an
Agilent 2100 Bioanalyzer (RIN
Micromass cultures were used to assess Arg’s effect on RMCs chondrogenic
differentiation [24]. Briefly, 1.5
Total RNA was reverse transcribed using the PrimeScript RT reagent Kit (RR037A, Takara, Kusatsu, Shiga, Japan). Quantitative Real-Time PCR (qRT-PCR) was performed on a CFX96 Touch system (CFX96 Touch System, Bio-Rad, Hercules, CA, USA) using TB Green Premix Ex Taq II (RR820A, Takara, Kusatsu, Shiga, Japan). Gene expression was normalized to glyceraldehyde-3-phosphate dehydrogenase (GAPDH) and quantified using the 2-ΔΔCt method. The primer sequences are listed as follows: SOX9 forward, 5′-CAAGAACAAGCCGCACGTCAAG-3′, and SOX9 reverse, 5′-TCTCGCTCTCGTTCAGCAGTCT-3′; COL2A1 forward, 5′-GTGGAGCAGCAAGAGCAAGGA-3′, and COL2A1 reverse, 5′-AGCAGGCGGAGGAAGGTCAT-3′; LEF1 forward, 5′-CGGGTGGTGTTGGACAGATTAC-3′, and LEF1 reverse, 5′-GCGTTACGATGGCTGGATGAG-3′; AXIN2 forward, 5′-GGCGATCAGGACGGTGCTTA-3′, and AXIN2 reverse, 5′-GCTTGGAGACGATGCTGTTGTT-3′; GAPDH forward, 5′-AGATGGTGAAGGTCGGAGTG-3′, and GAPDH reverse, 5′-CCTTTCCATTGATGACGAGC-3′.
Total protein was extracted using RIPA lysis buffer. Equal amounts of protein
(20 µg) were separated by sodium dodecyl sulfate-polyacrylamide gel
electrophoresis (SDS-PAGE), transferred to polyvinylidene difluoride (PVDF,
IPVH00010, MilliporeSigma, Burlington, MA, USA) membranes, and blocked. Membranes
were incubated overnight at 4 °C with primary antibodies. The following
primary antibodies were used: rabbit COL2A1 (ab307674, dilution 1:1000; Abcam,
UK), rabbit SOX9 (P48436, dilution 1:1000; Cell Signaling Technology, Danvers,
MA, USA), rabbit mTOR (28273-1-AP, dilution 1:5000; Proteintech, Wu Han, China),
rabbit p-mTOR (5536T, dilution 1:1000; Cell Signaling Technology, Danvers, MA,
USA), rabbit p70 S6 Kinase (2708T, dilution 1:1000; Cell Signaling Technology,
Danvers, MA, USA); rabbit p-p70 S6 Kinase (Thr389) (9234T, dilution 1:1000; Cell
Signaling Technology, Danvers, MA, USA), mouse
All quantitative data are presented as mean
The antler reserve mesenchymal layer in the antler growth center was selected
for analysis (Fig. 1A). CD90 and Ki67 double immunofluorescence staining were
performed in this region (Fig. 1B). CD90 (red) labels the mesenchymal stem cells,
Ki67 (green) labels proliferating cells, and DAPI (blue) stains the nuclei.
Compared with the control group, the Arg group showed a marked increase in the
proportion of Ki67-positive cells among CD90-positive cells, with stronger green
fluorescence signals overall. Quantitative analysis (Fig. 1C) revealed that Arg
treatment significantly increased the proportion of Ki67+ cells (p
The primary cultured cells displayed a typical spindle-shaped morphology
(Supplementary Fig. 1A). Immunofluorescence (Fig. 1D) and flow
cytometric analysis (Supplementary Fig. 1B) showed high expression of
CD44 and CD105, and multilineage differentiation assays confirmed their
osteogenic (Supplementary Fig. 1C), and chondrogenic
(Supplementary Fig. 1D) and adipogenic (Supplementary Fig. 1E)
differentiation potential. Together, these findings indicate that the isolated
cells possess mesenchymal stem cell characteristics. The CCK-8 assay demonstrated
that Arg treatment increased cell viability compared with the control group, with
the 400 µM group exhibiting the strongest effect (Fig. 1E, p
To identify the molecular pathways by which Arg promotes RMCs proliferation, we
performed RNA-seq analysis on cells from both the control group and the
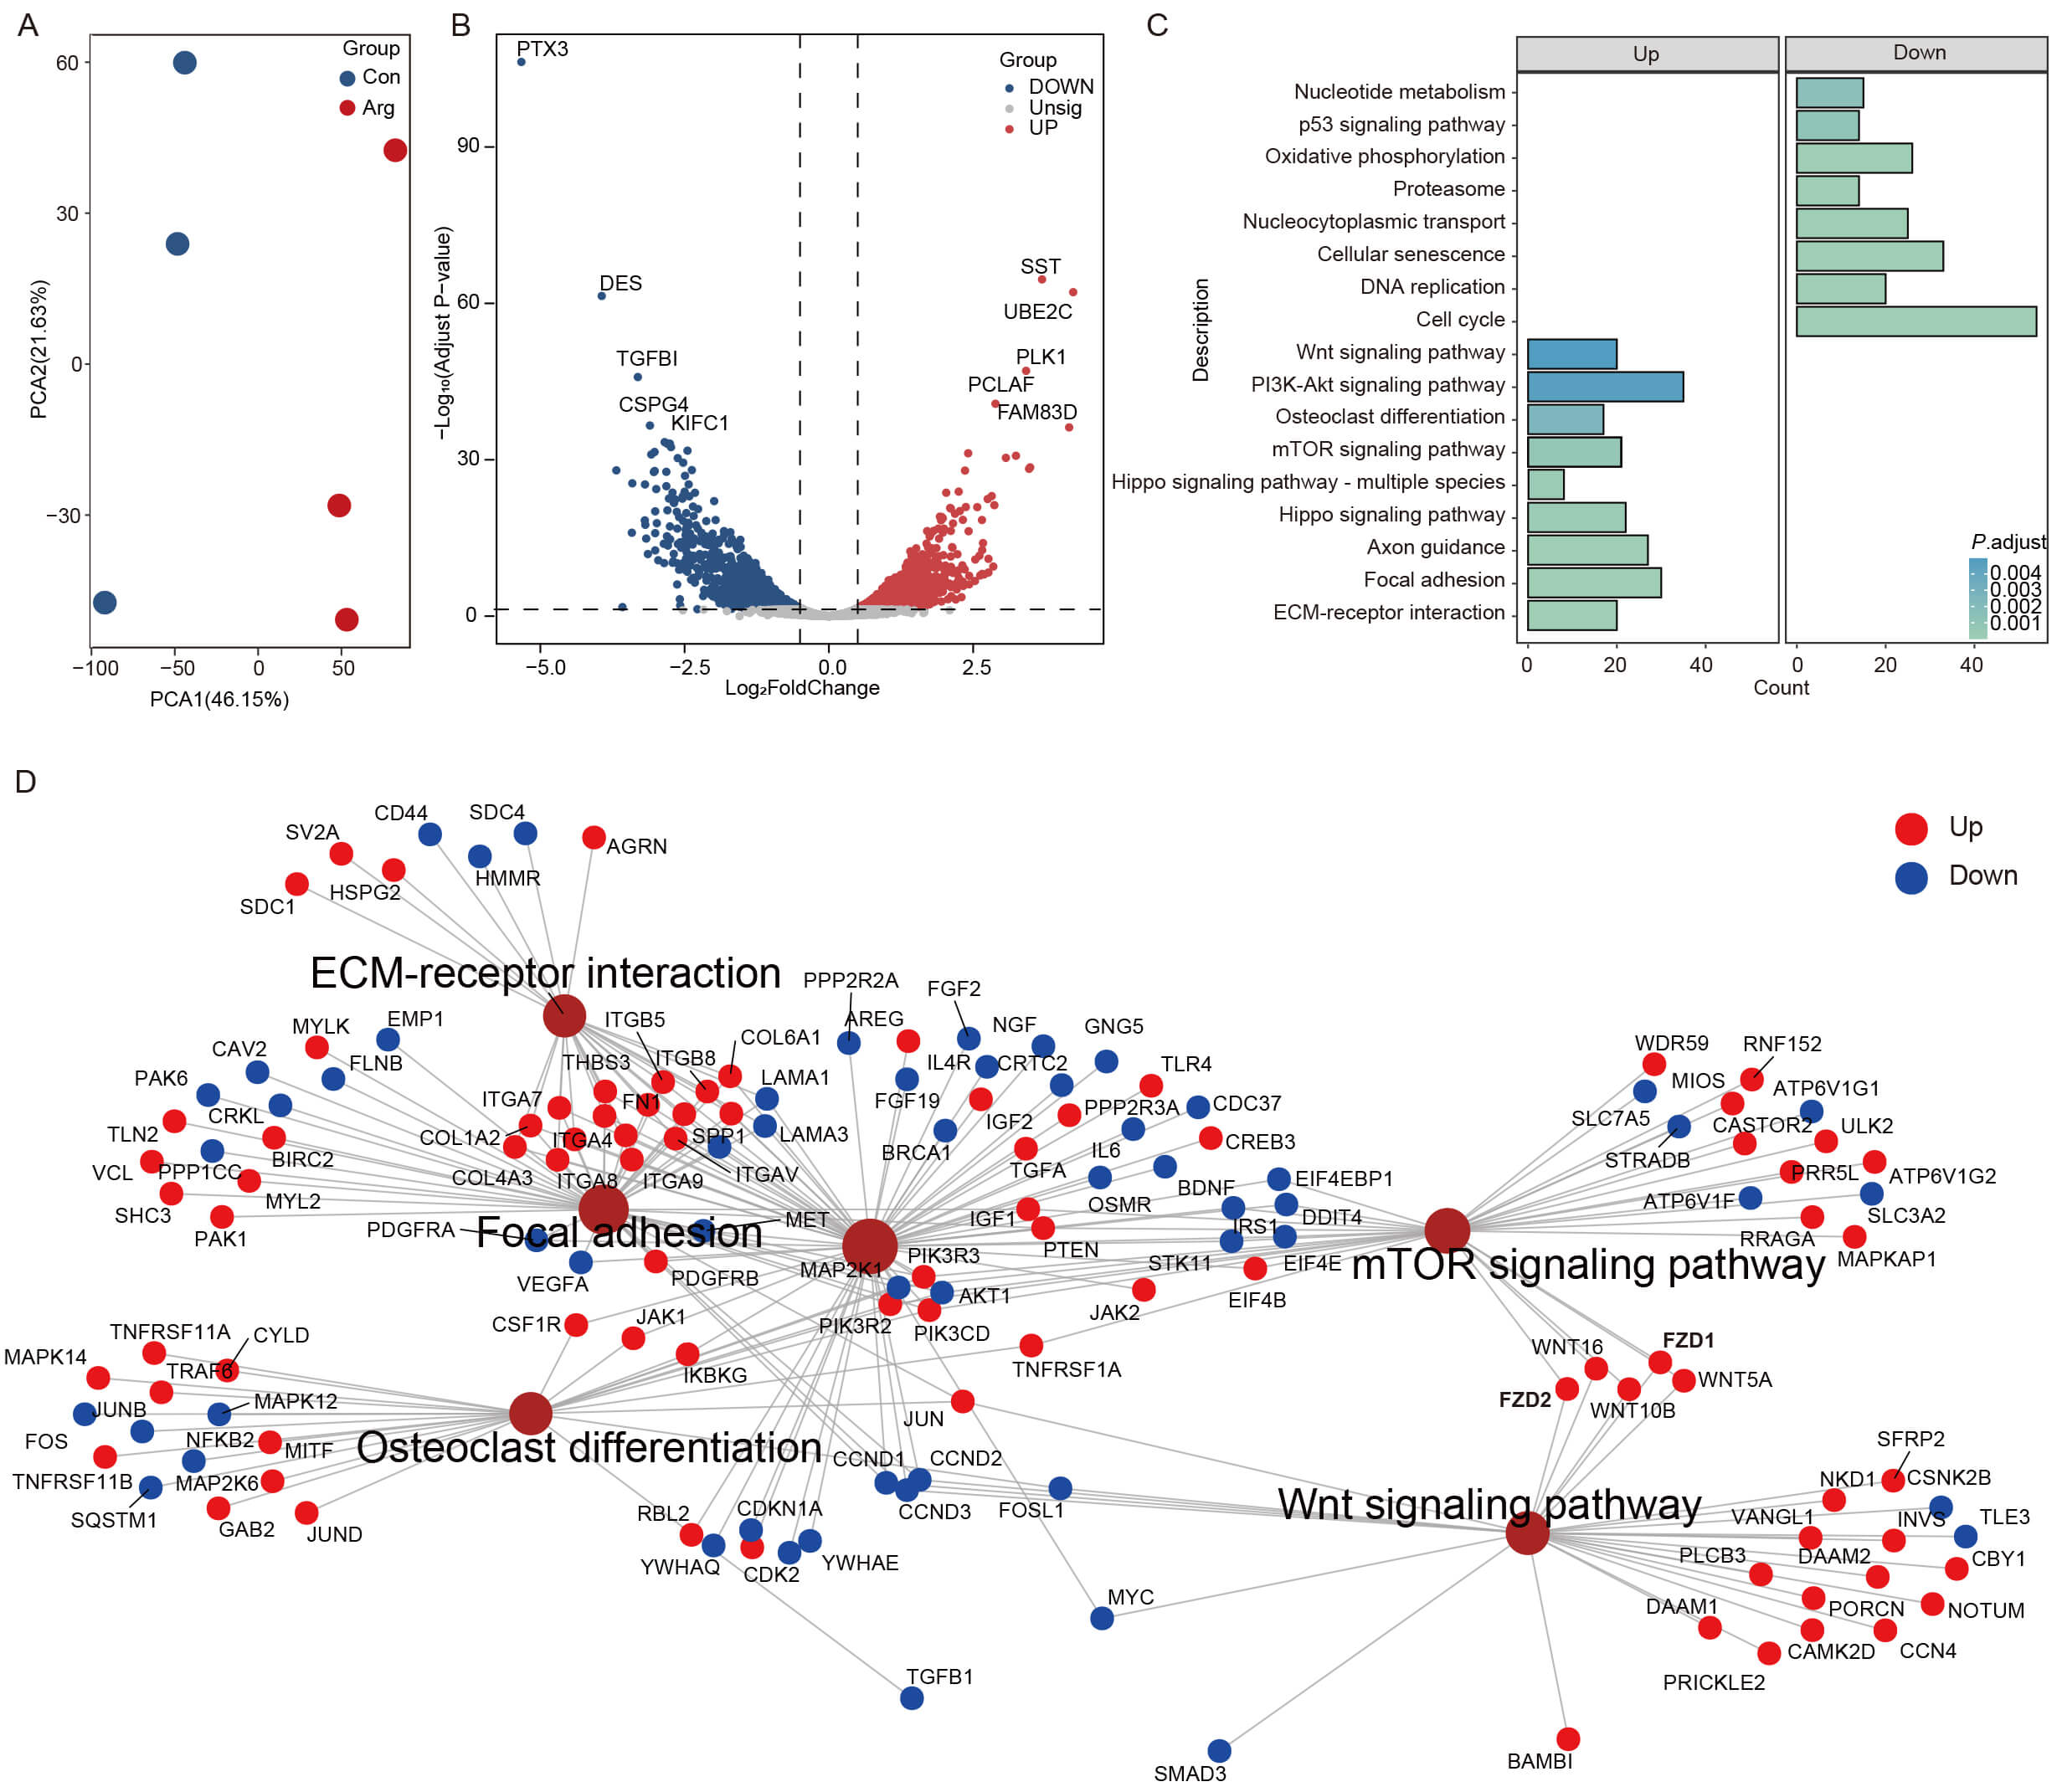
400 µM Arg-treated group. PCA revealed a clear separation between the two
groups, indicating distinct global transcriptional profiles, with PC1 and PC2
together accounting for 67.78% of the total variance (Fig. 2A). Differential
expression analysis using
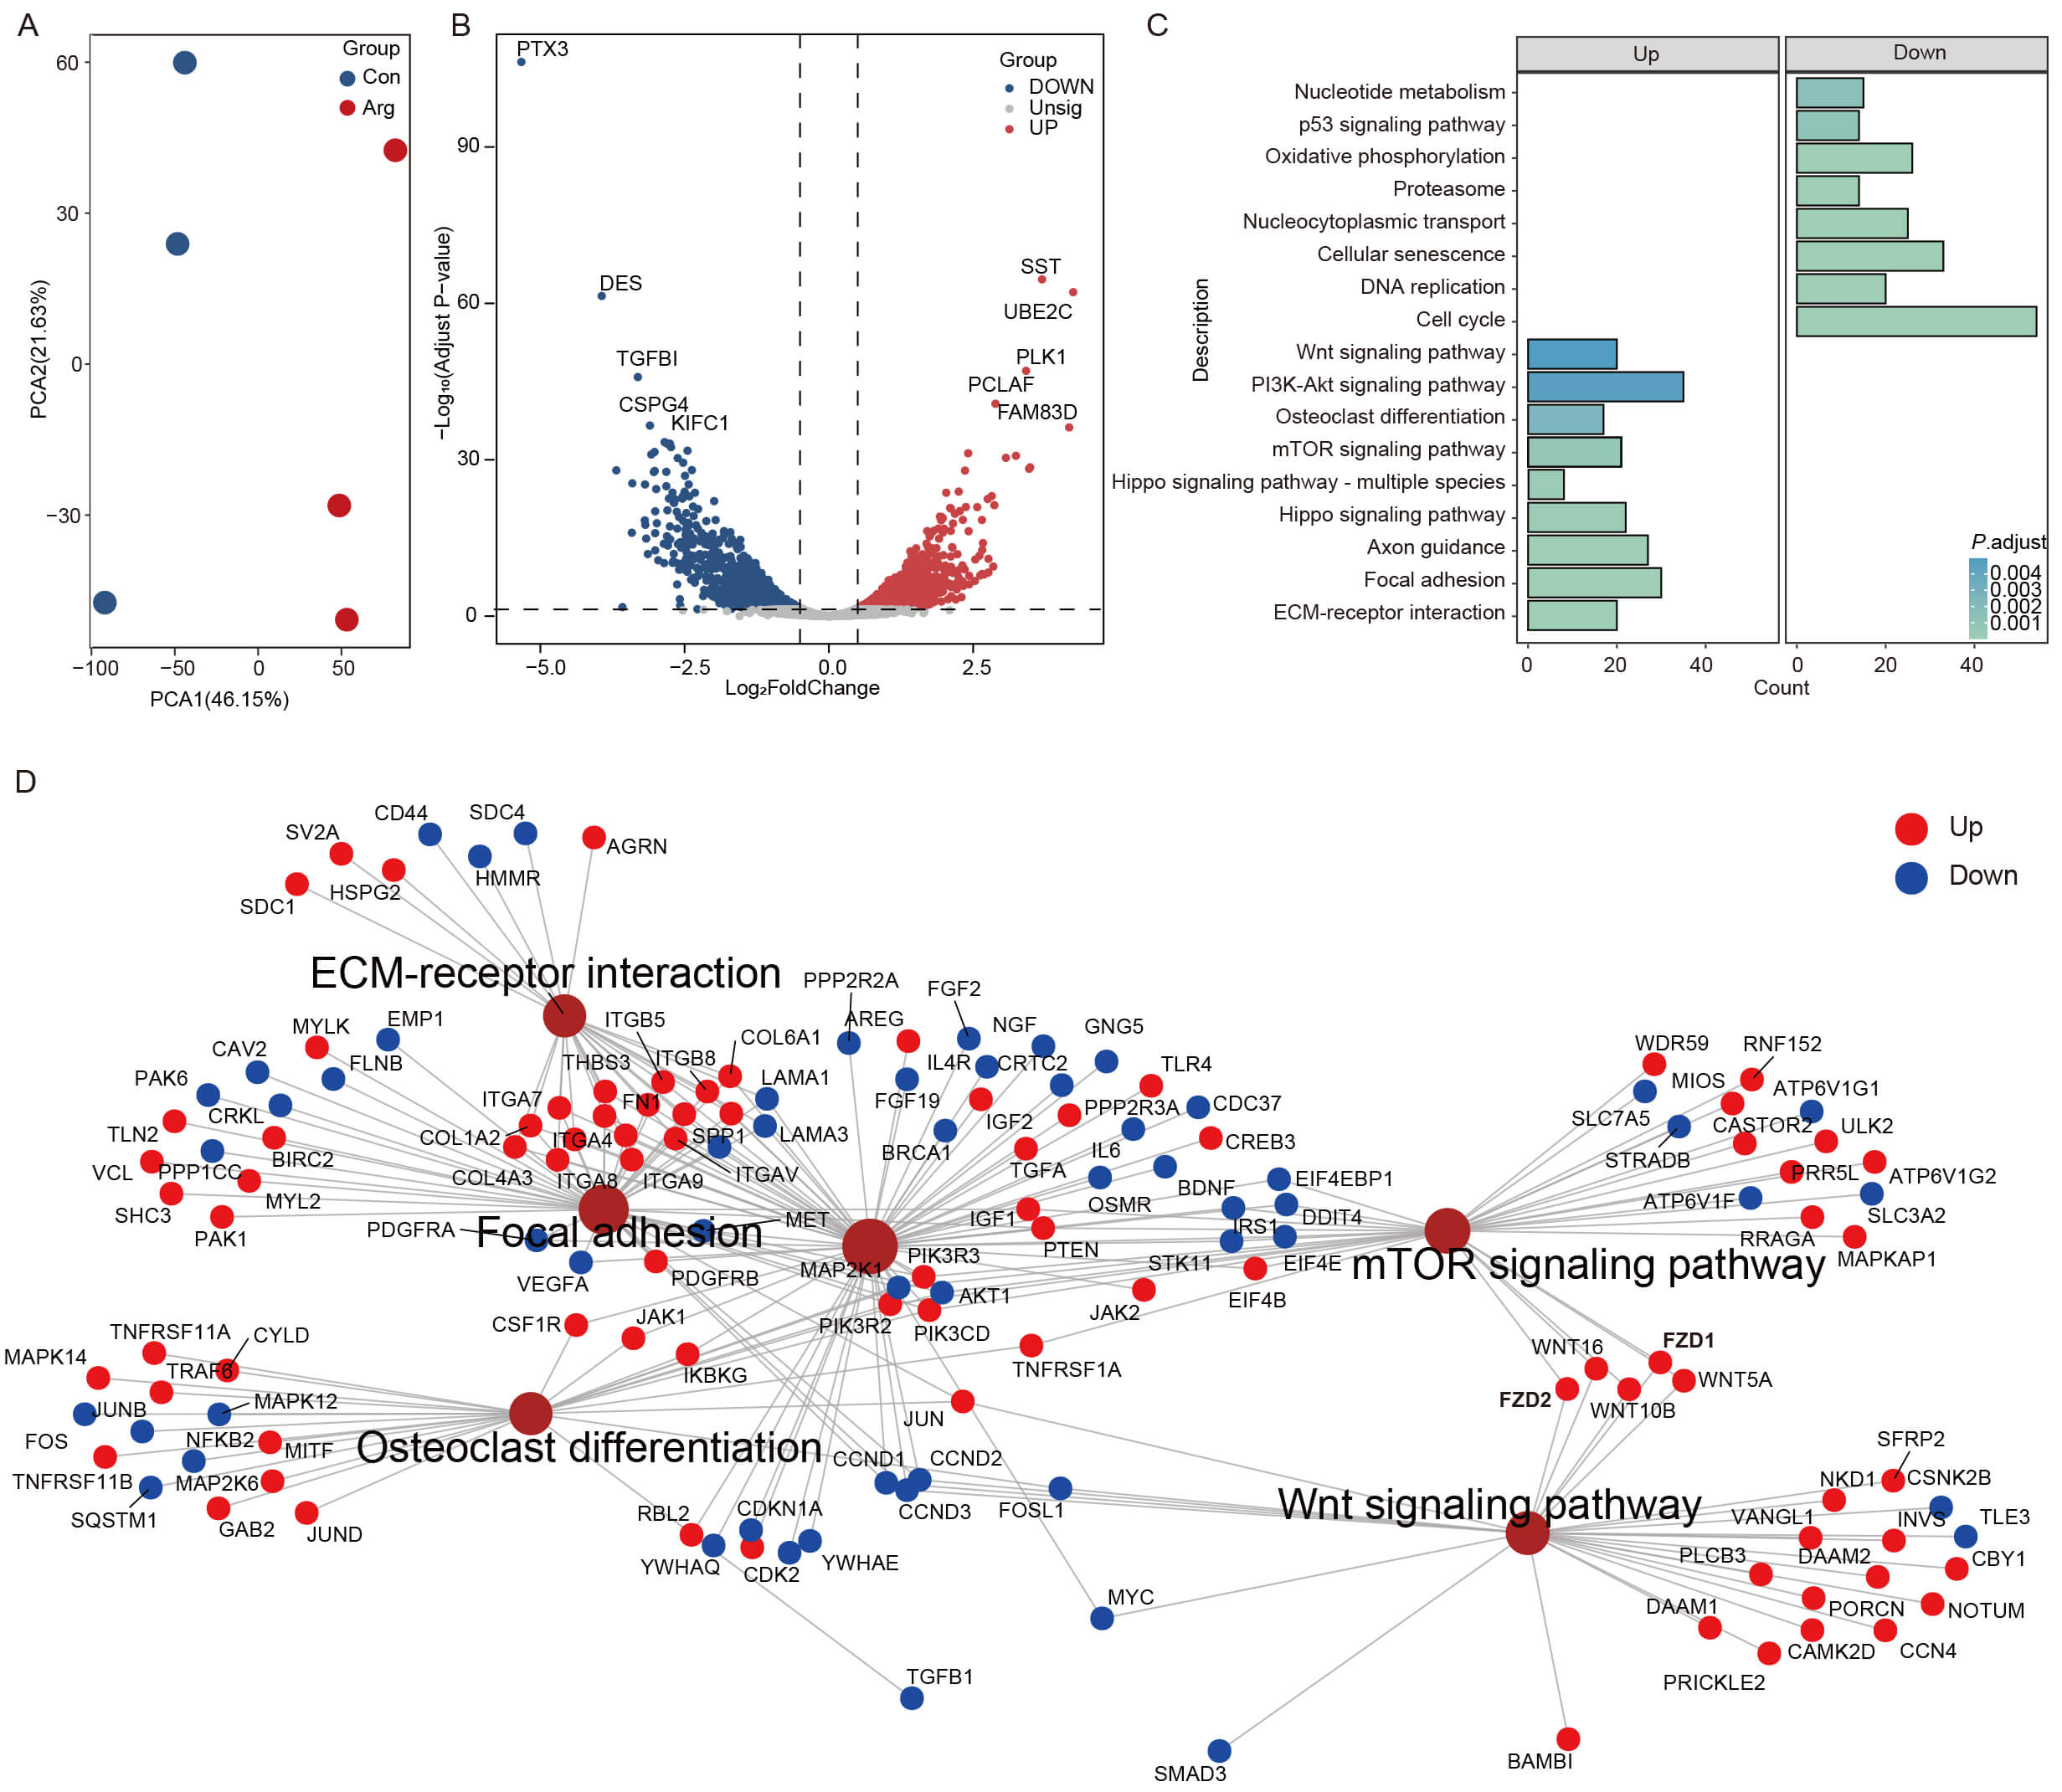 Fig. 2.
Transcriptomic profiling of RMCs in response to arginine
treatment. (A) PCA plot showing distinct transcriptional profiles between the
CON and Arg groups. (B) Volcano plot of differentially expressed genes (DEGs).
Significantly upregulated (red) and downregulated (blue) genes are highlighted.
(C) KEGG pathway enrichment analysis of upregulated and downregulated DEGs (based
on
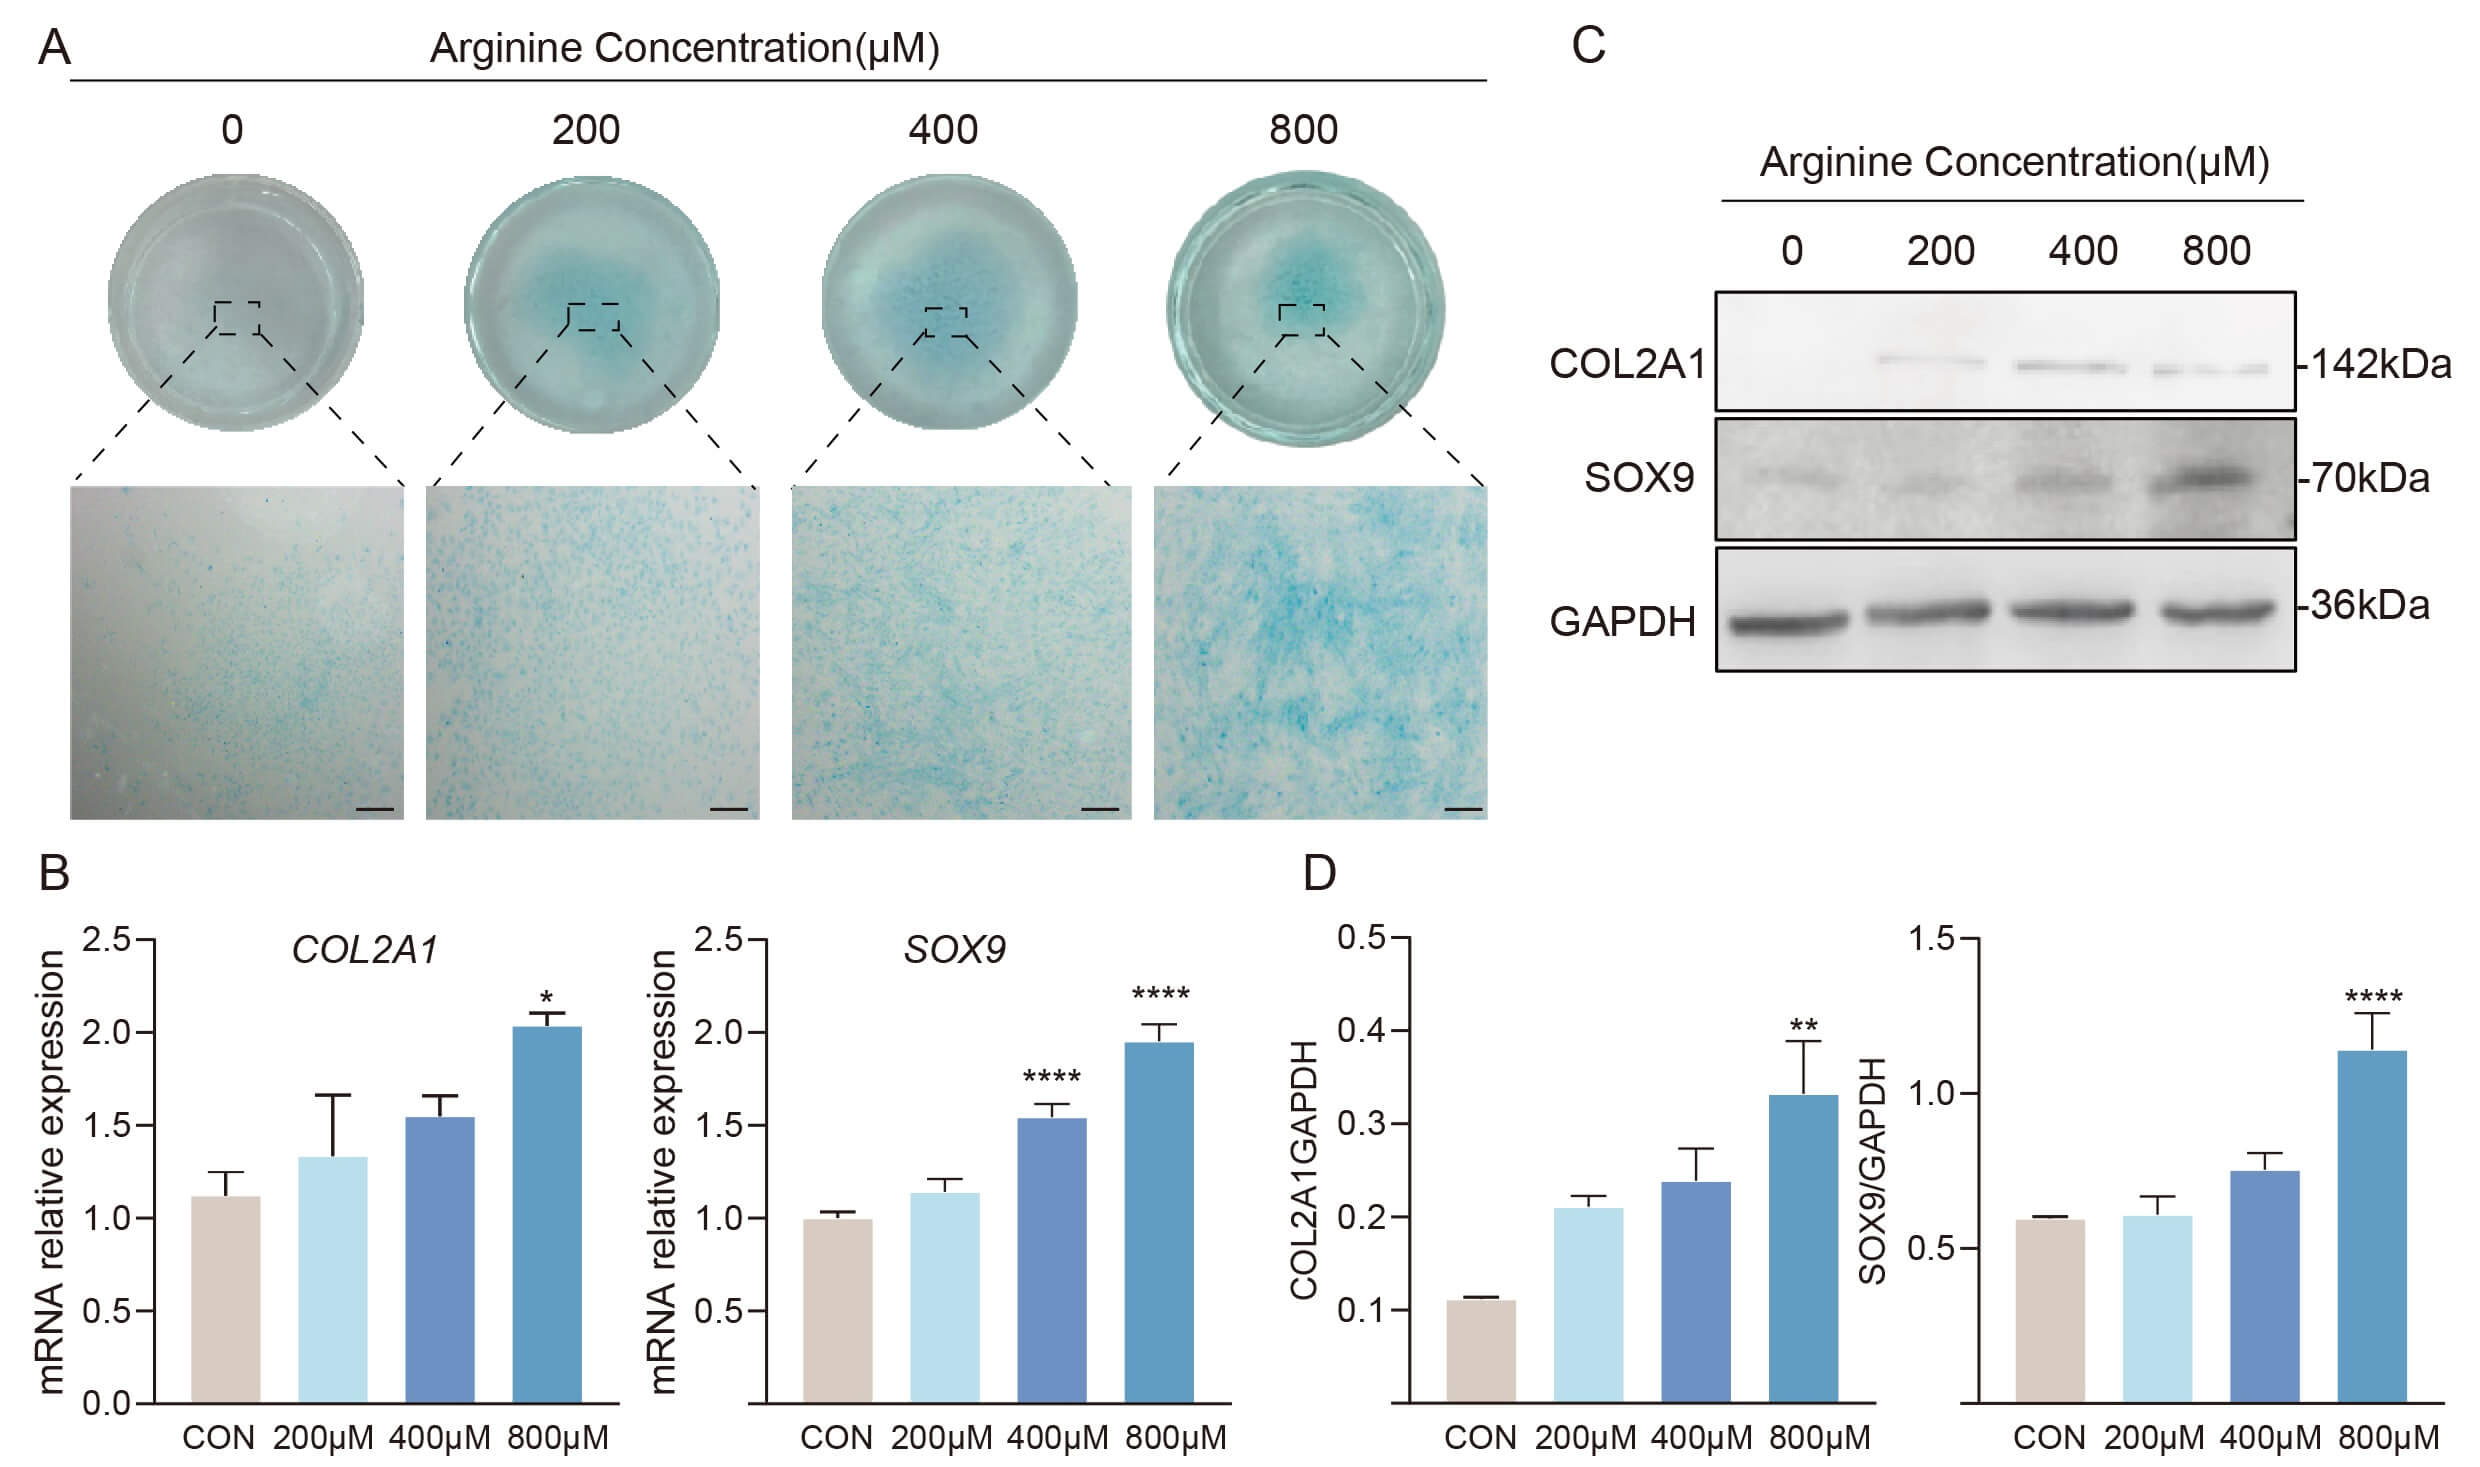
To validate the role of Arg in promoting commitment of RMCs to the chondrogenic lineage, an in vitro chondrogenic induction system was supplemented with different concentrations of Arg and cell differentiation was subsequently induced for 4 d. Alcian blue staining revealed that cells treated with 200 µM, 400 µM, or 800 µM Arg showed a significantly larger staining area compared to the CON group, indicating increased cartilage matrix deposition and a higher level of chondrogenic differentiation (Fig. 3A). Similarly, qPCR (Fig. 3B) and Western blot (Fig. 3C,D) analyses confirmed that Arg treatment markedly increased both the mRNA and protein levels of the key chondrogenic markers SOX9 and COL2A1. Overall, these findings demonstrate that Arg boosts the chondrogenic differentiation potential of RMCs.
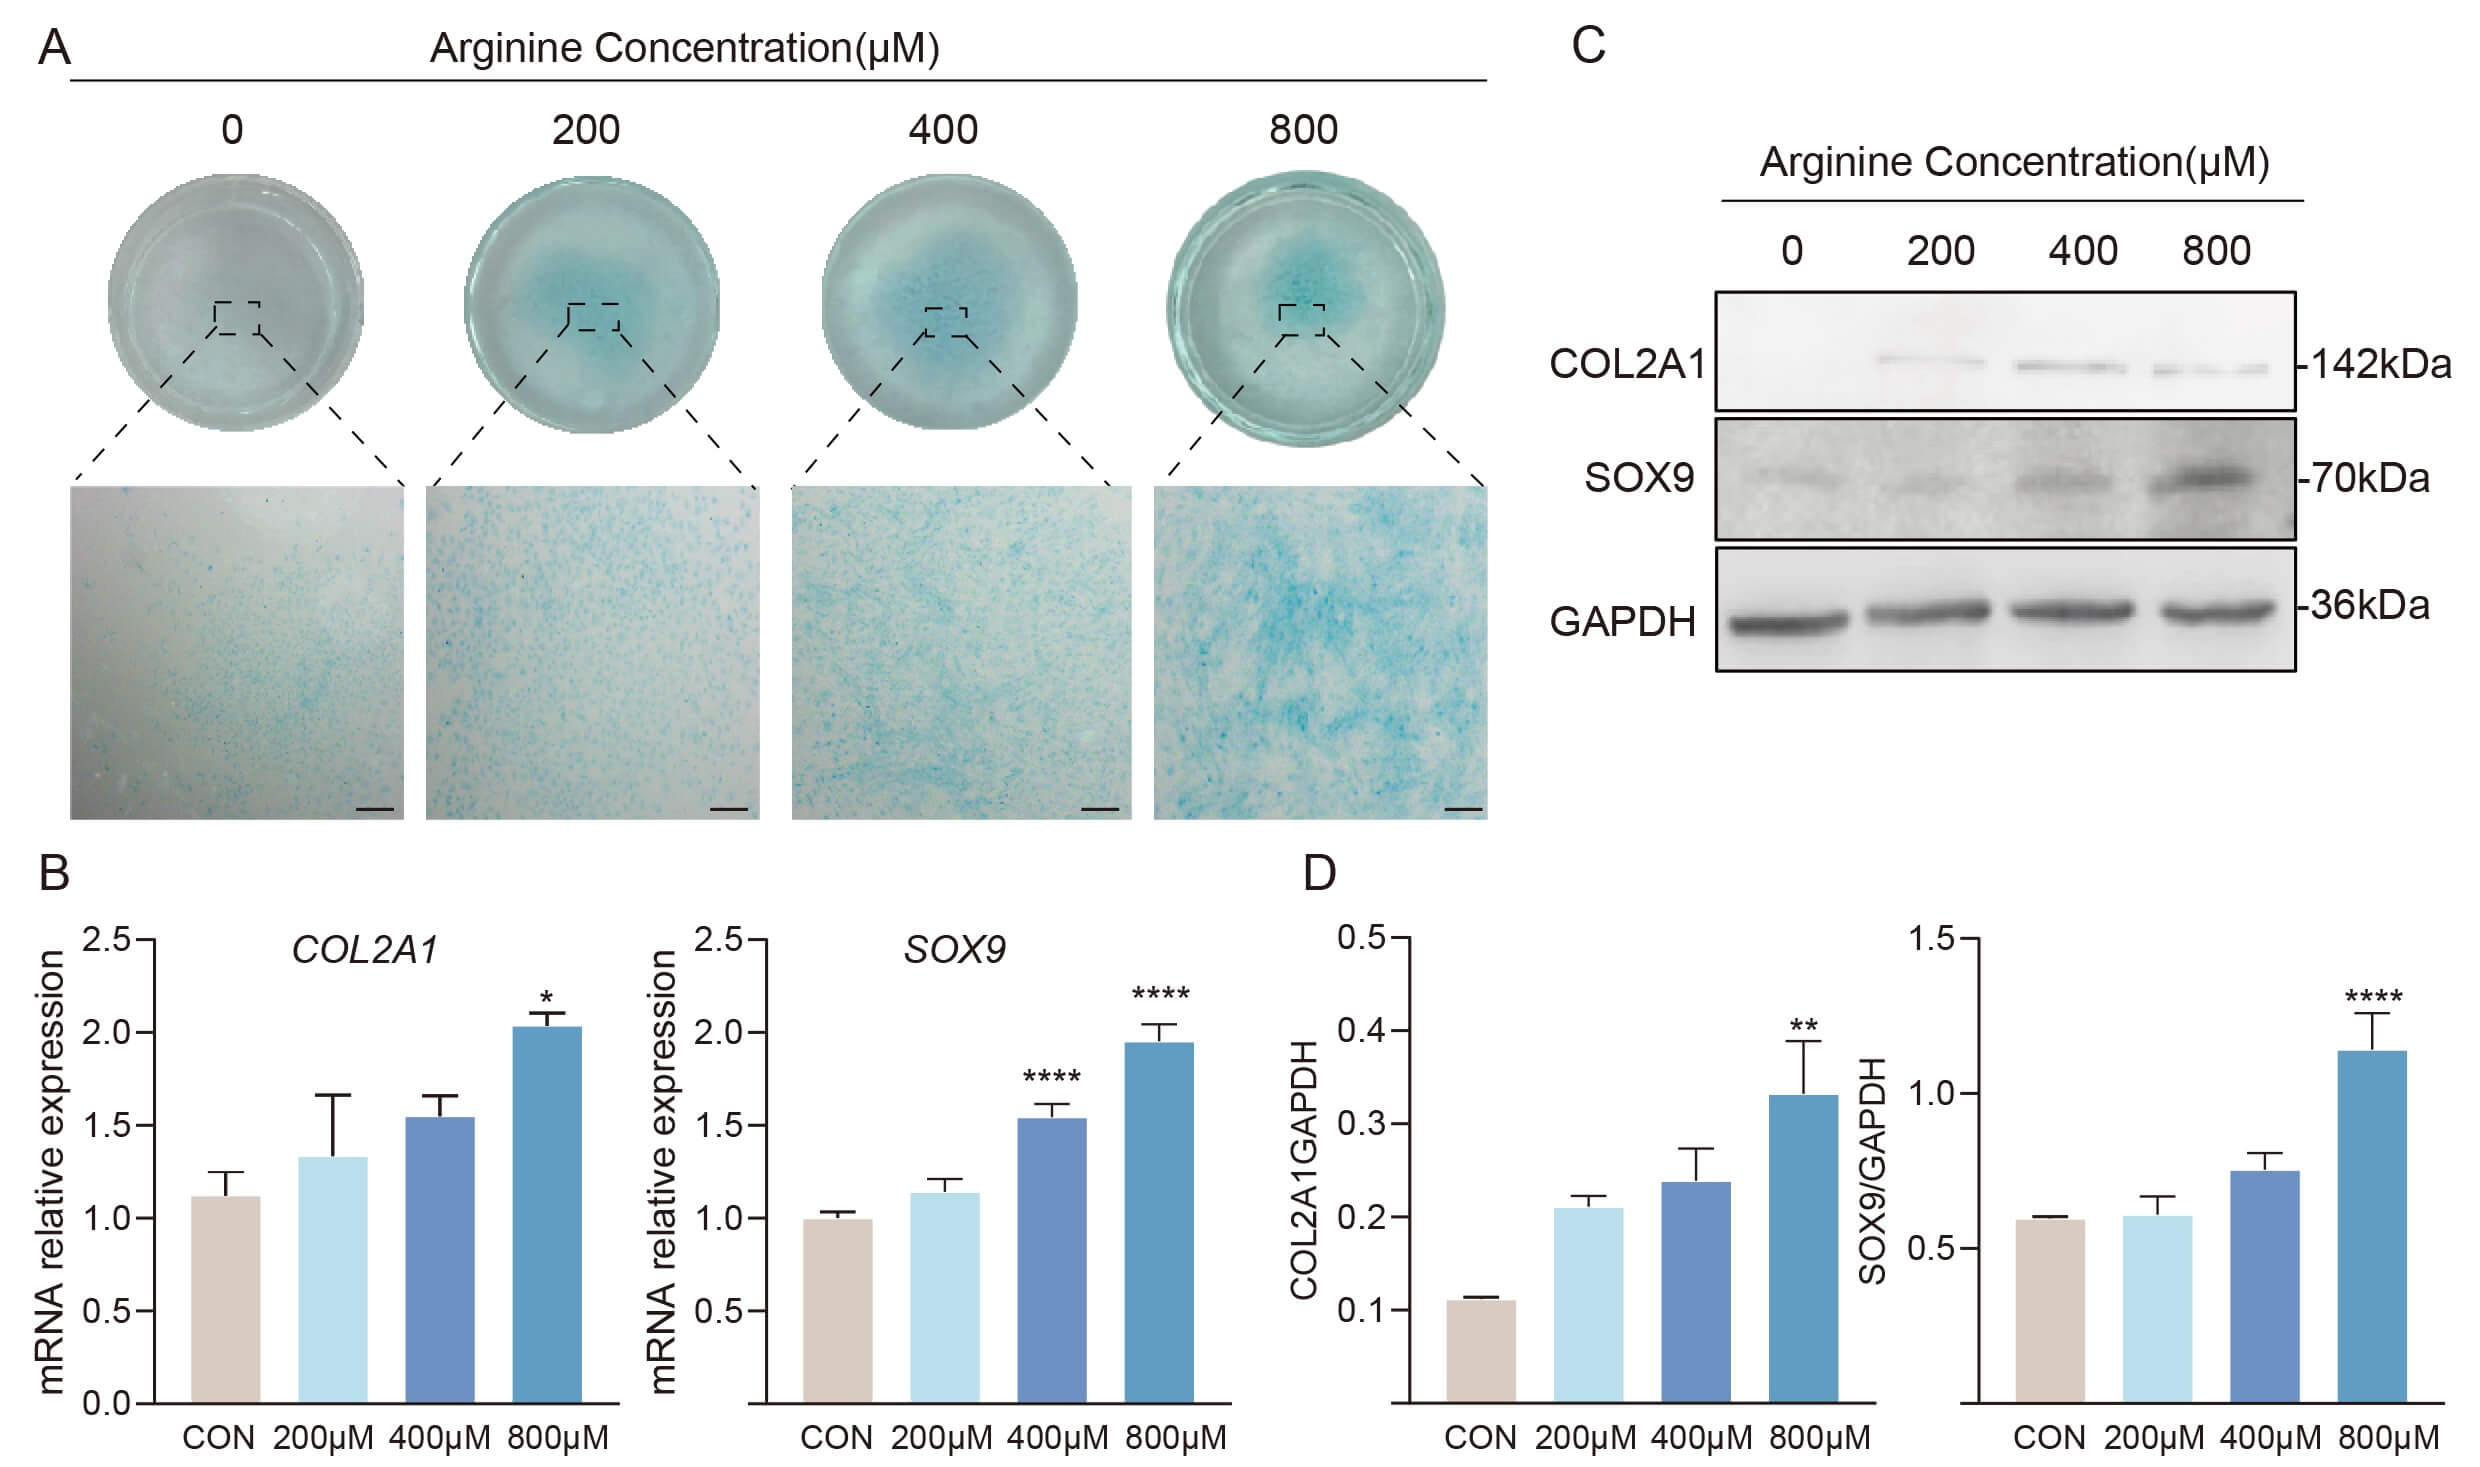 Fig. 3.
Arginine enhances chondrogenic differentiation of RMCs. (A) Alcian Blue staining of micromass cultures after 4 d chondrogenic induction with the indicated concentrations of arginine, showing increased proteoglycan deposition (n = 3). Scale bar, 800 µm. (B) Relative mRNA expression levels of chondrogenic marker genes COL2A1 and SOX9 as determined by qRT-PCR. Data are presented as mean
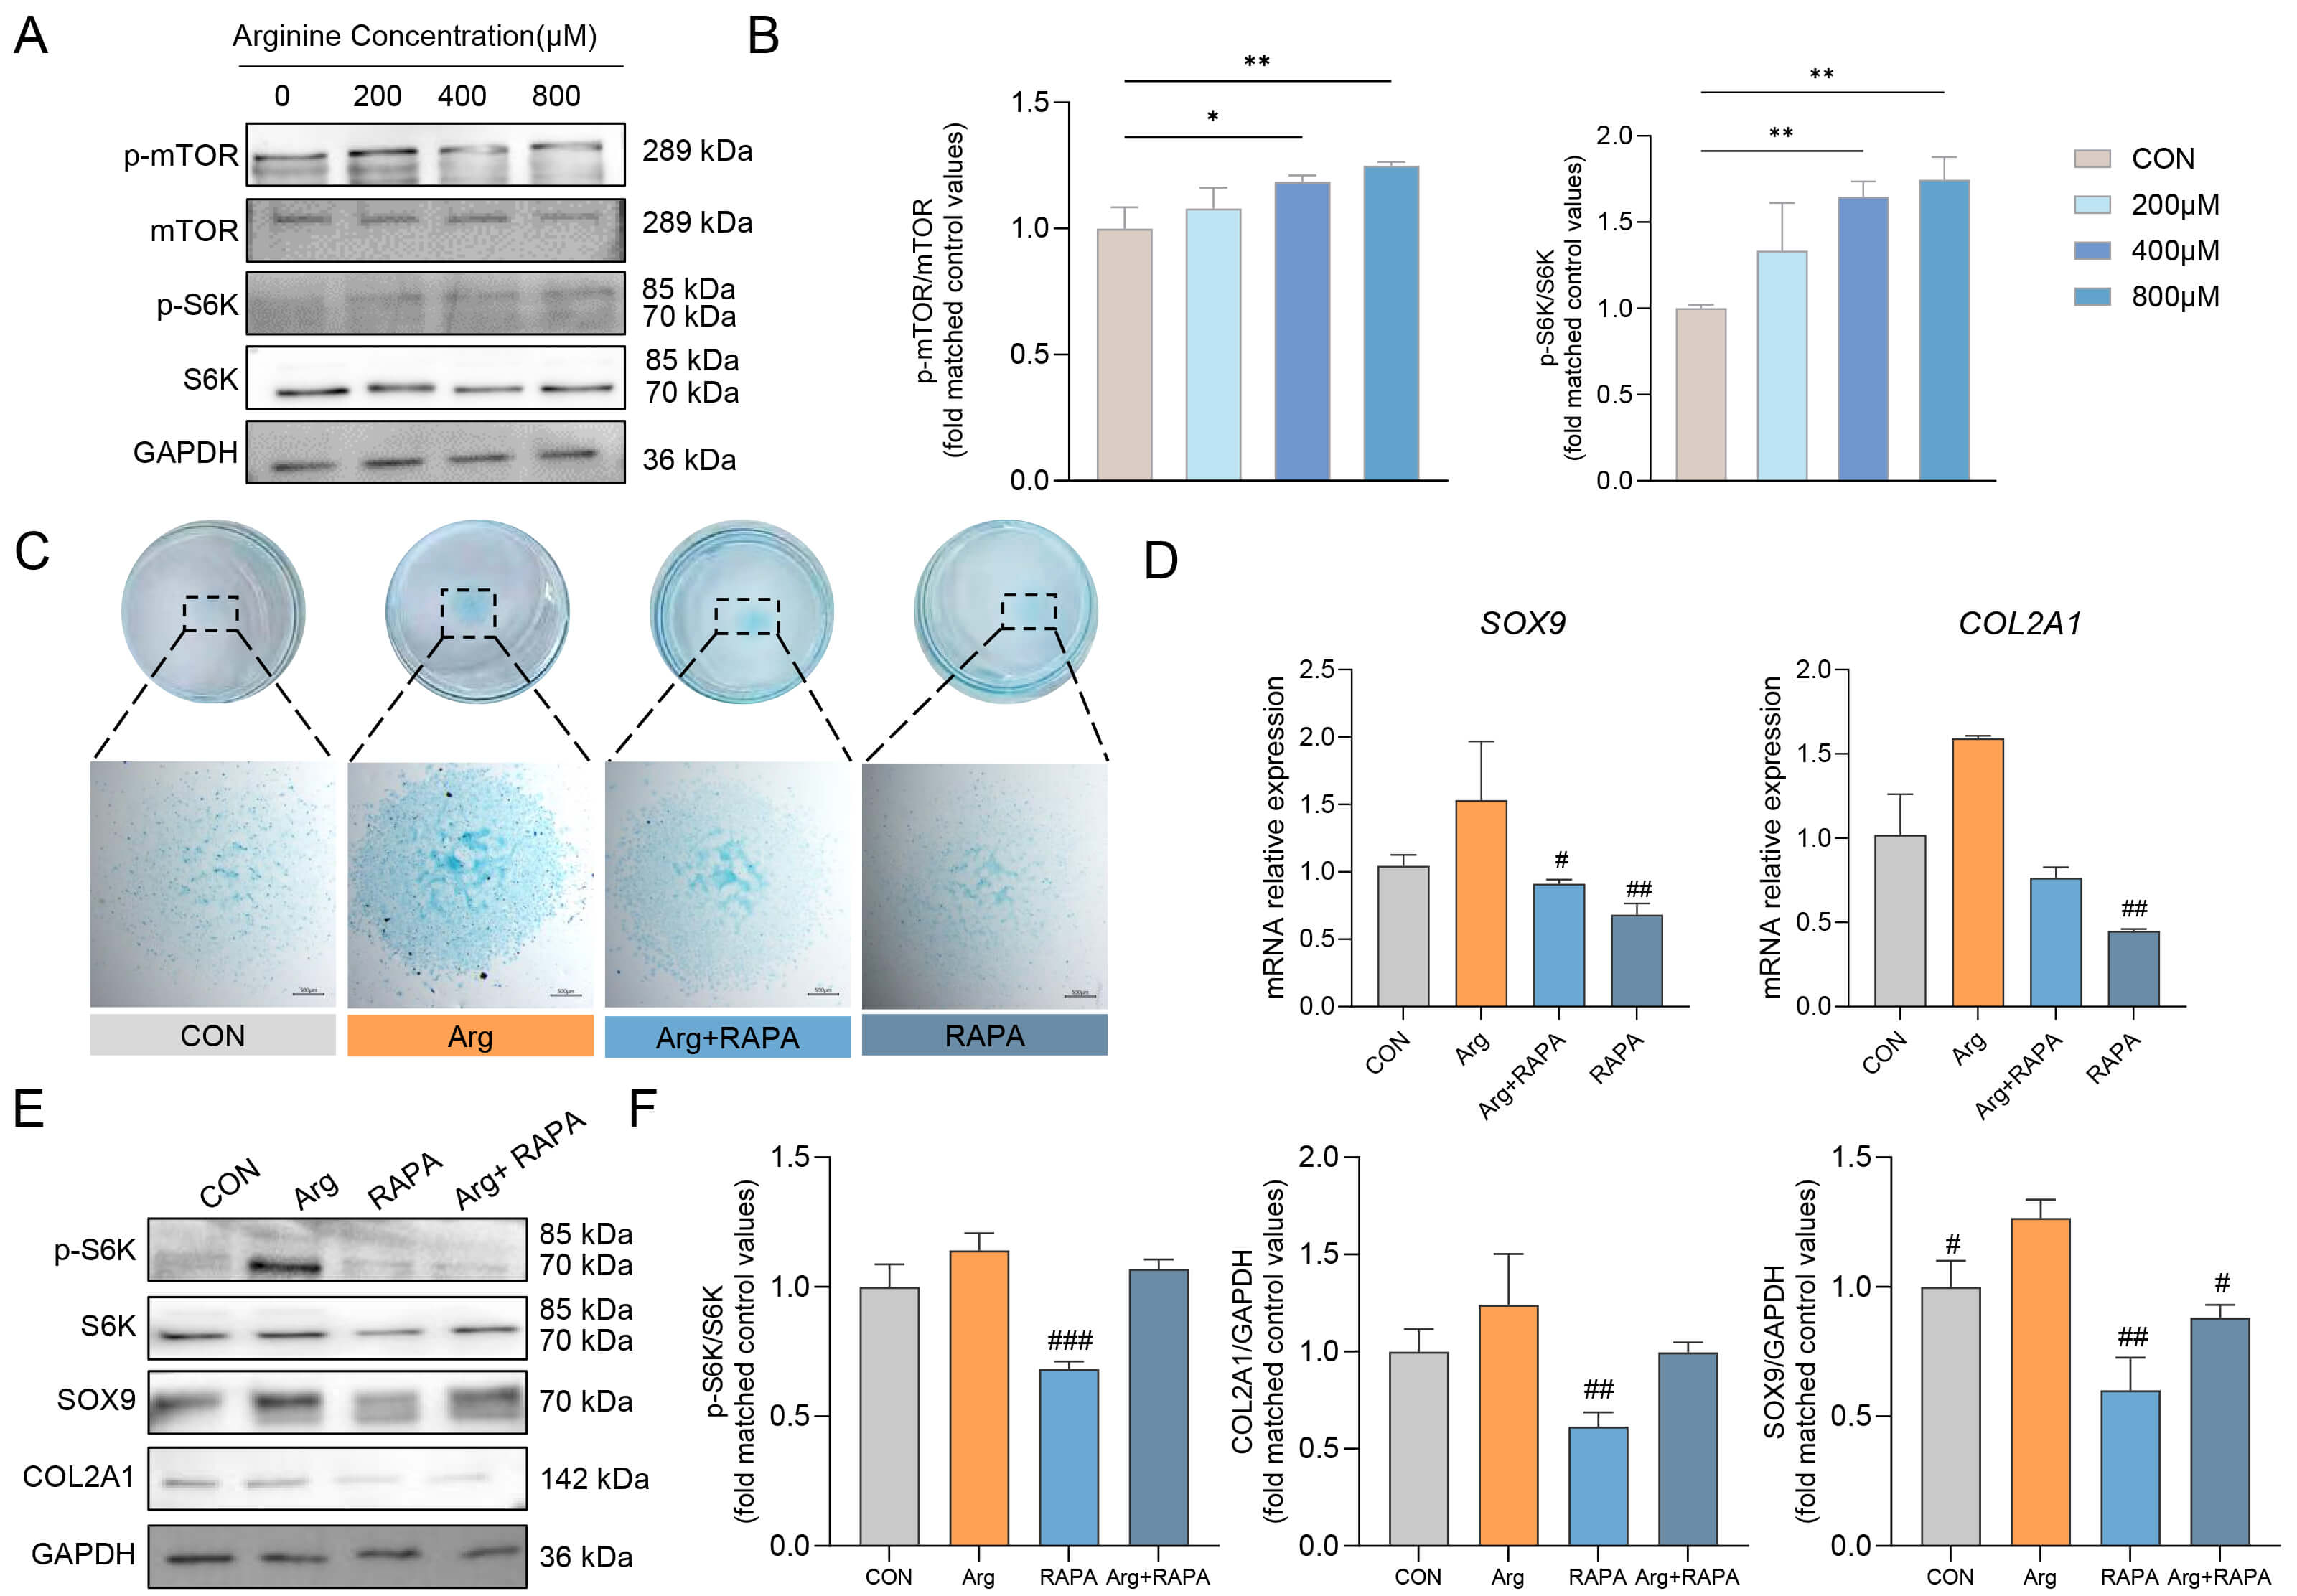
To determine whether mTOR signaling contributes to Arg-induced chondrogenesis, we performed pharmacological perturbation experiments during chondrogenic induction. The phosphorylation levels of mTOR and its downstream target S6K were analyzed after Arg treatment. Western blot analysis showed that Arg increased the p-mTOR/mTOR and p-S6K/S6K ratios during chondrogenic differentiation, indicating enhanced mTOR signaling under Arg treatment (Fig. 4A,B).
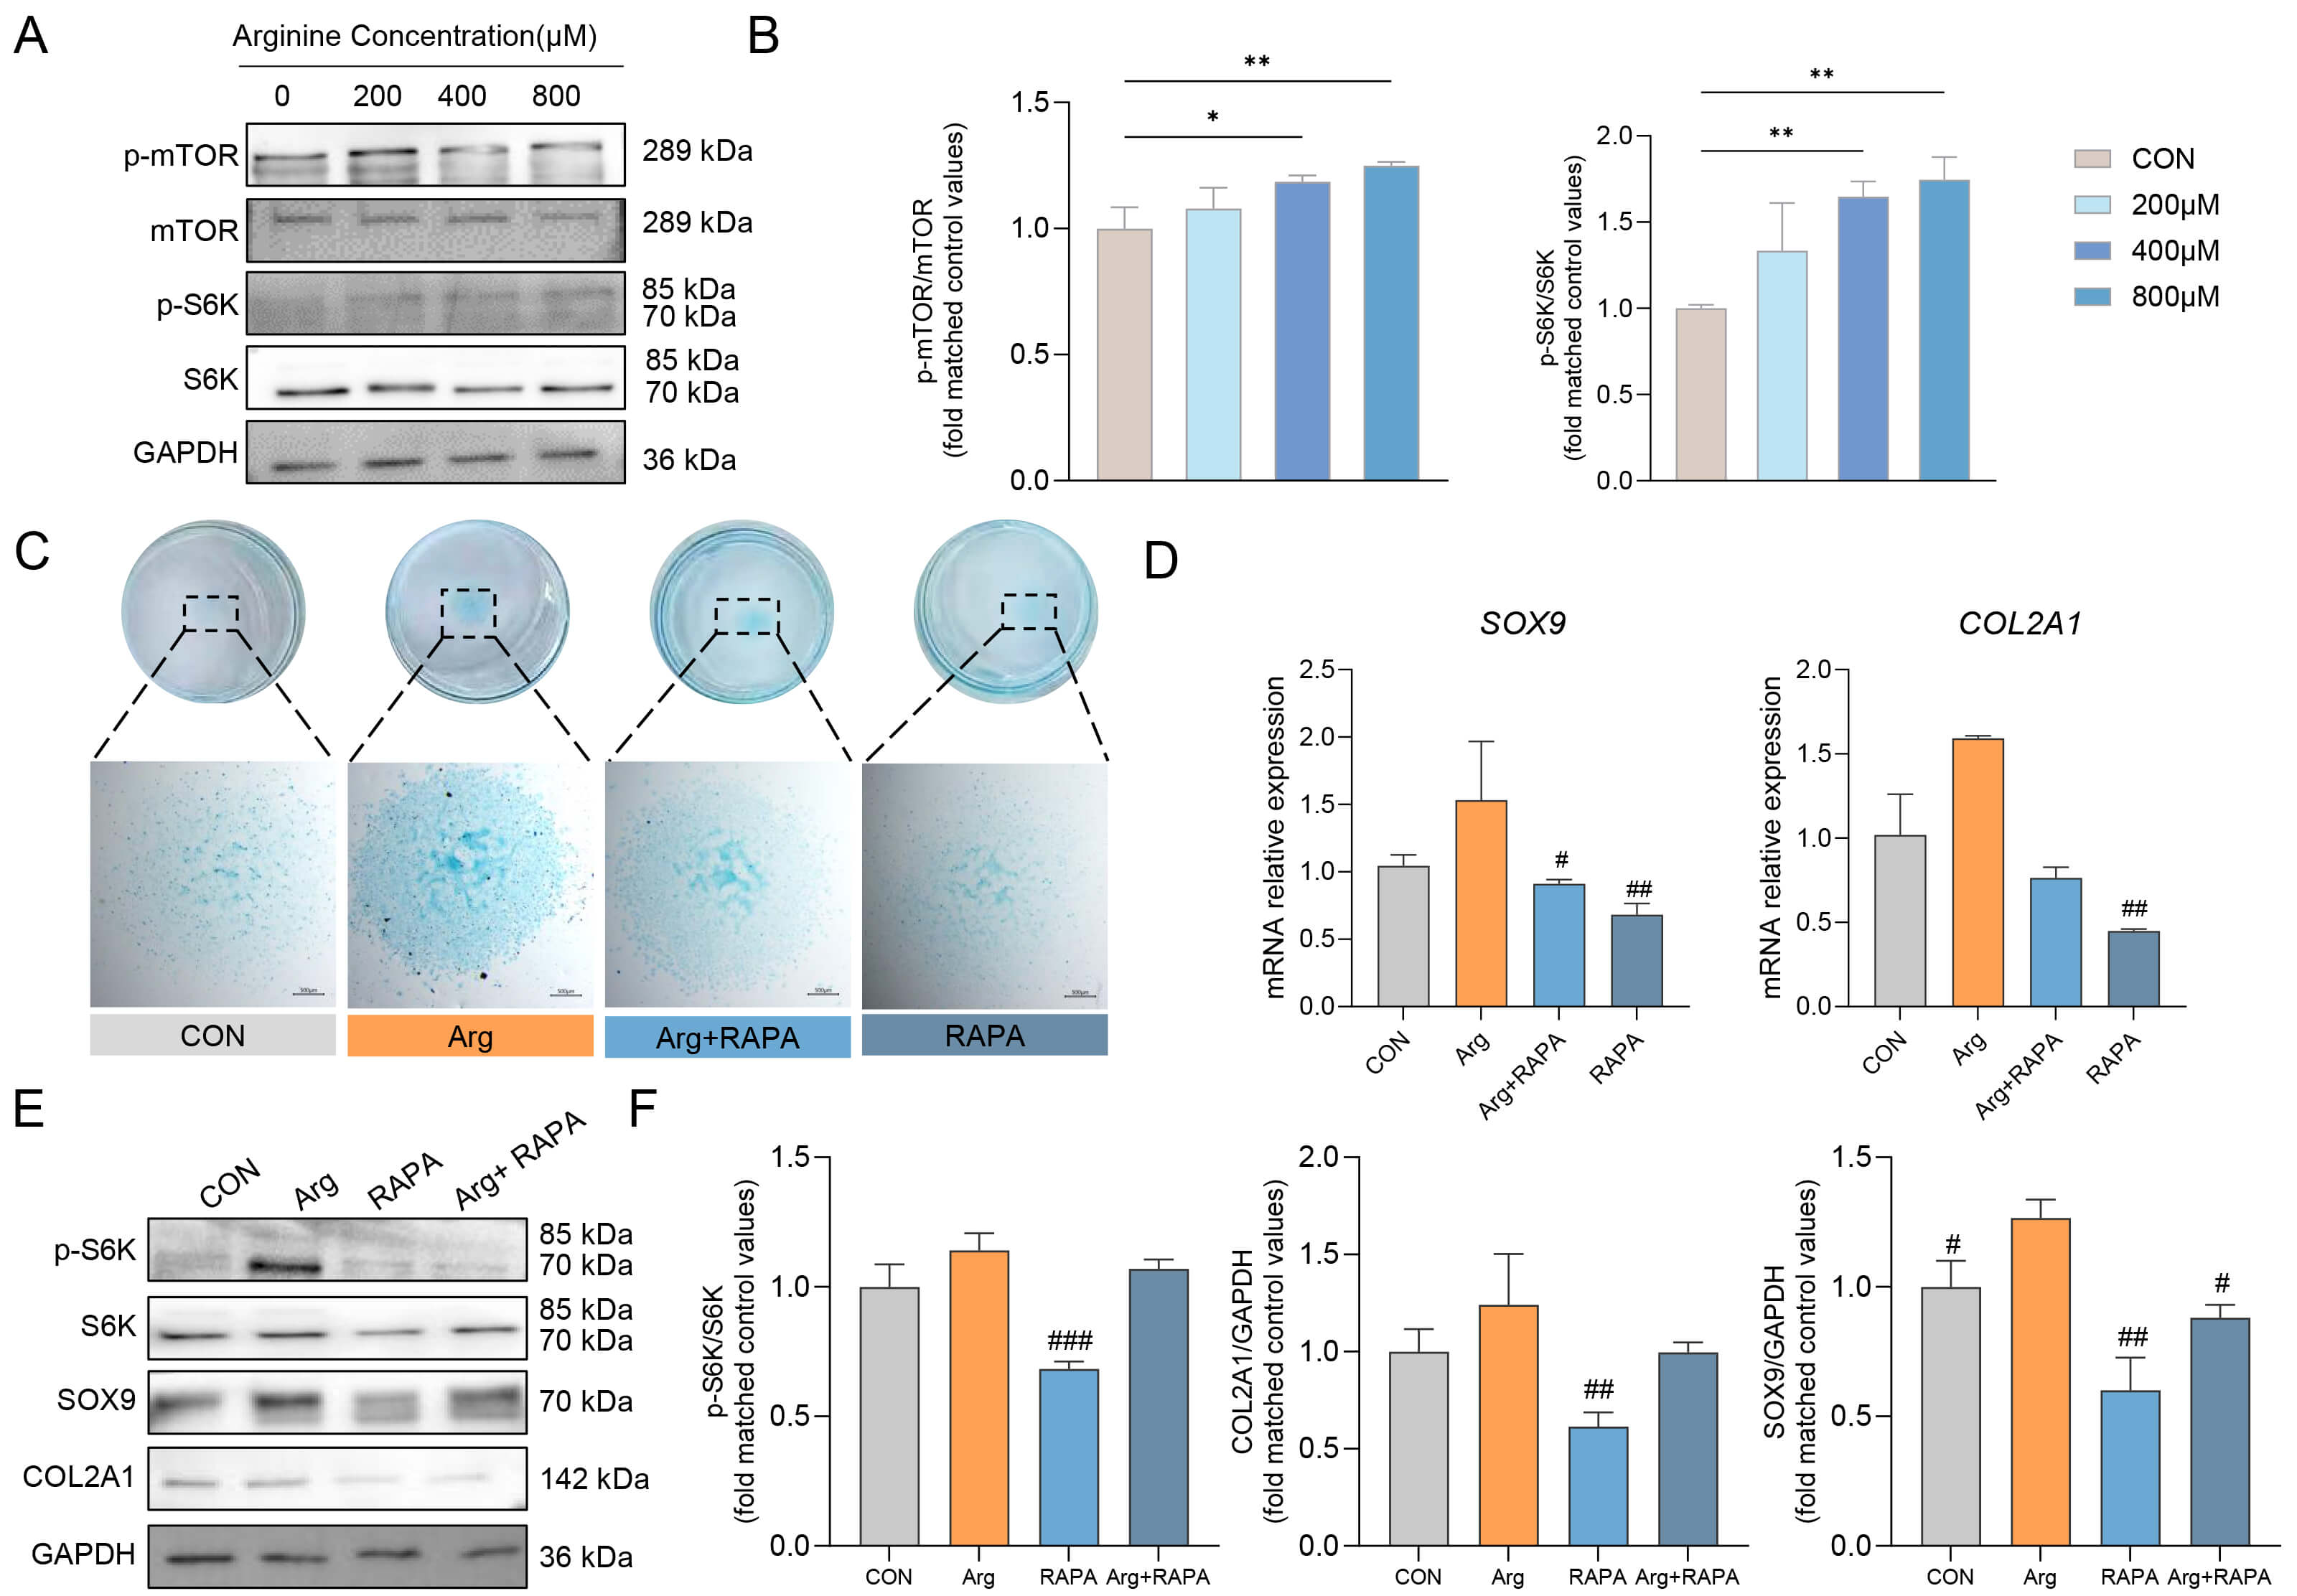 Fig. 4.
Arg activates mTOR signaling during chondrogenic differentiation of RMCs. (A) Western blot analysis of p-mTOR, mTOR, p-S6K, and S6K in RMCs treated with different concentrations of Arg. (B) Quantification of the p-mTOR/mTOR and p-S6K/S6K ratios (n = 3). (C) Alcian blue staining of chondrogenic differentiation in the CON, Arg, Arg+RAPA, and RAPA groups (n = 3). Scale bar, 500 µm. (D) Relative mRNA expression of SOX9 and COL2A1 in the CON, Arg, Arg+RAPA, and RAPA groups (n = 3). Western blot analysis (E) and quantification (F) of p-S6K/S6K, SOX9, and COL2A1 protein expression in the CON, Arg, Arg+RAPA, and RAPA groups (n = 3). Data are presented as mean
To further assess the role of mTOR activity, RAPA (an inhibitor of mTOR signaling) was applied during chondrogenic induction. Alcian blue staining revealed that Arg promoted the deposition of cartilage matrix, whereas this effect was attenuated by RAPA (Fig. 4C). Consistent with this observation, the mRNA expression levels of SOX9 and COL2A1 were increased in the Arg group, but reduced in the Arg+RAPA group (Fig. 4D). Western blot analysis further showed that RAPA decreased the p-S6K/S6K ratio and attenuated Arg-induced upregulation of SOX9 and COL2A1 (Fig. 4E,F). Together, these results suggest that mTOR activity is involved in the Arg-enhanced chondrogenic differentiation of RMCs.
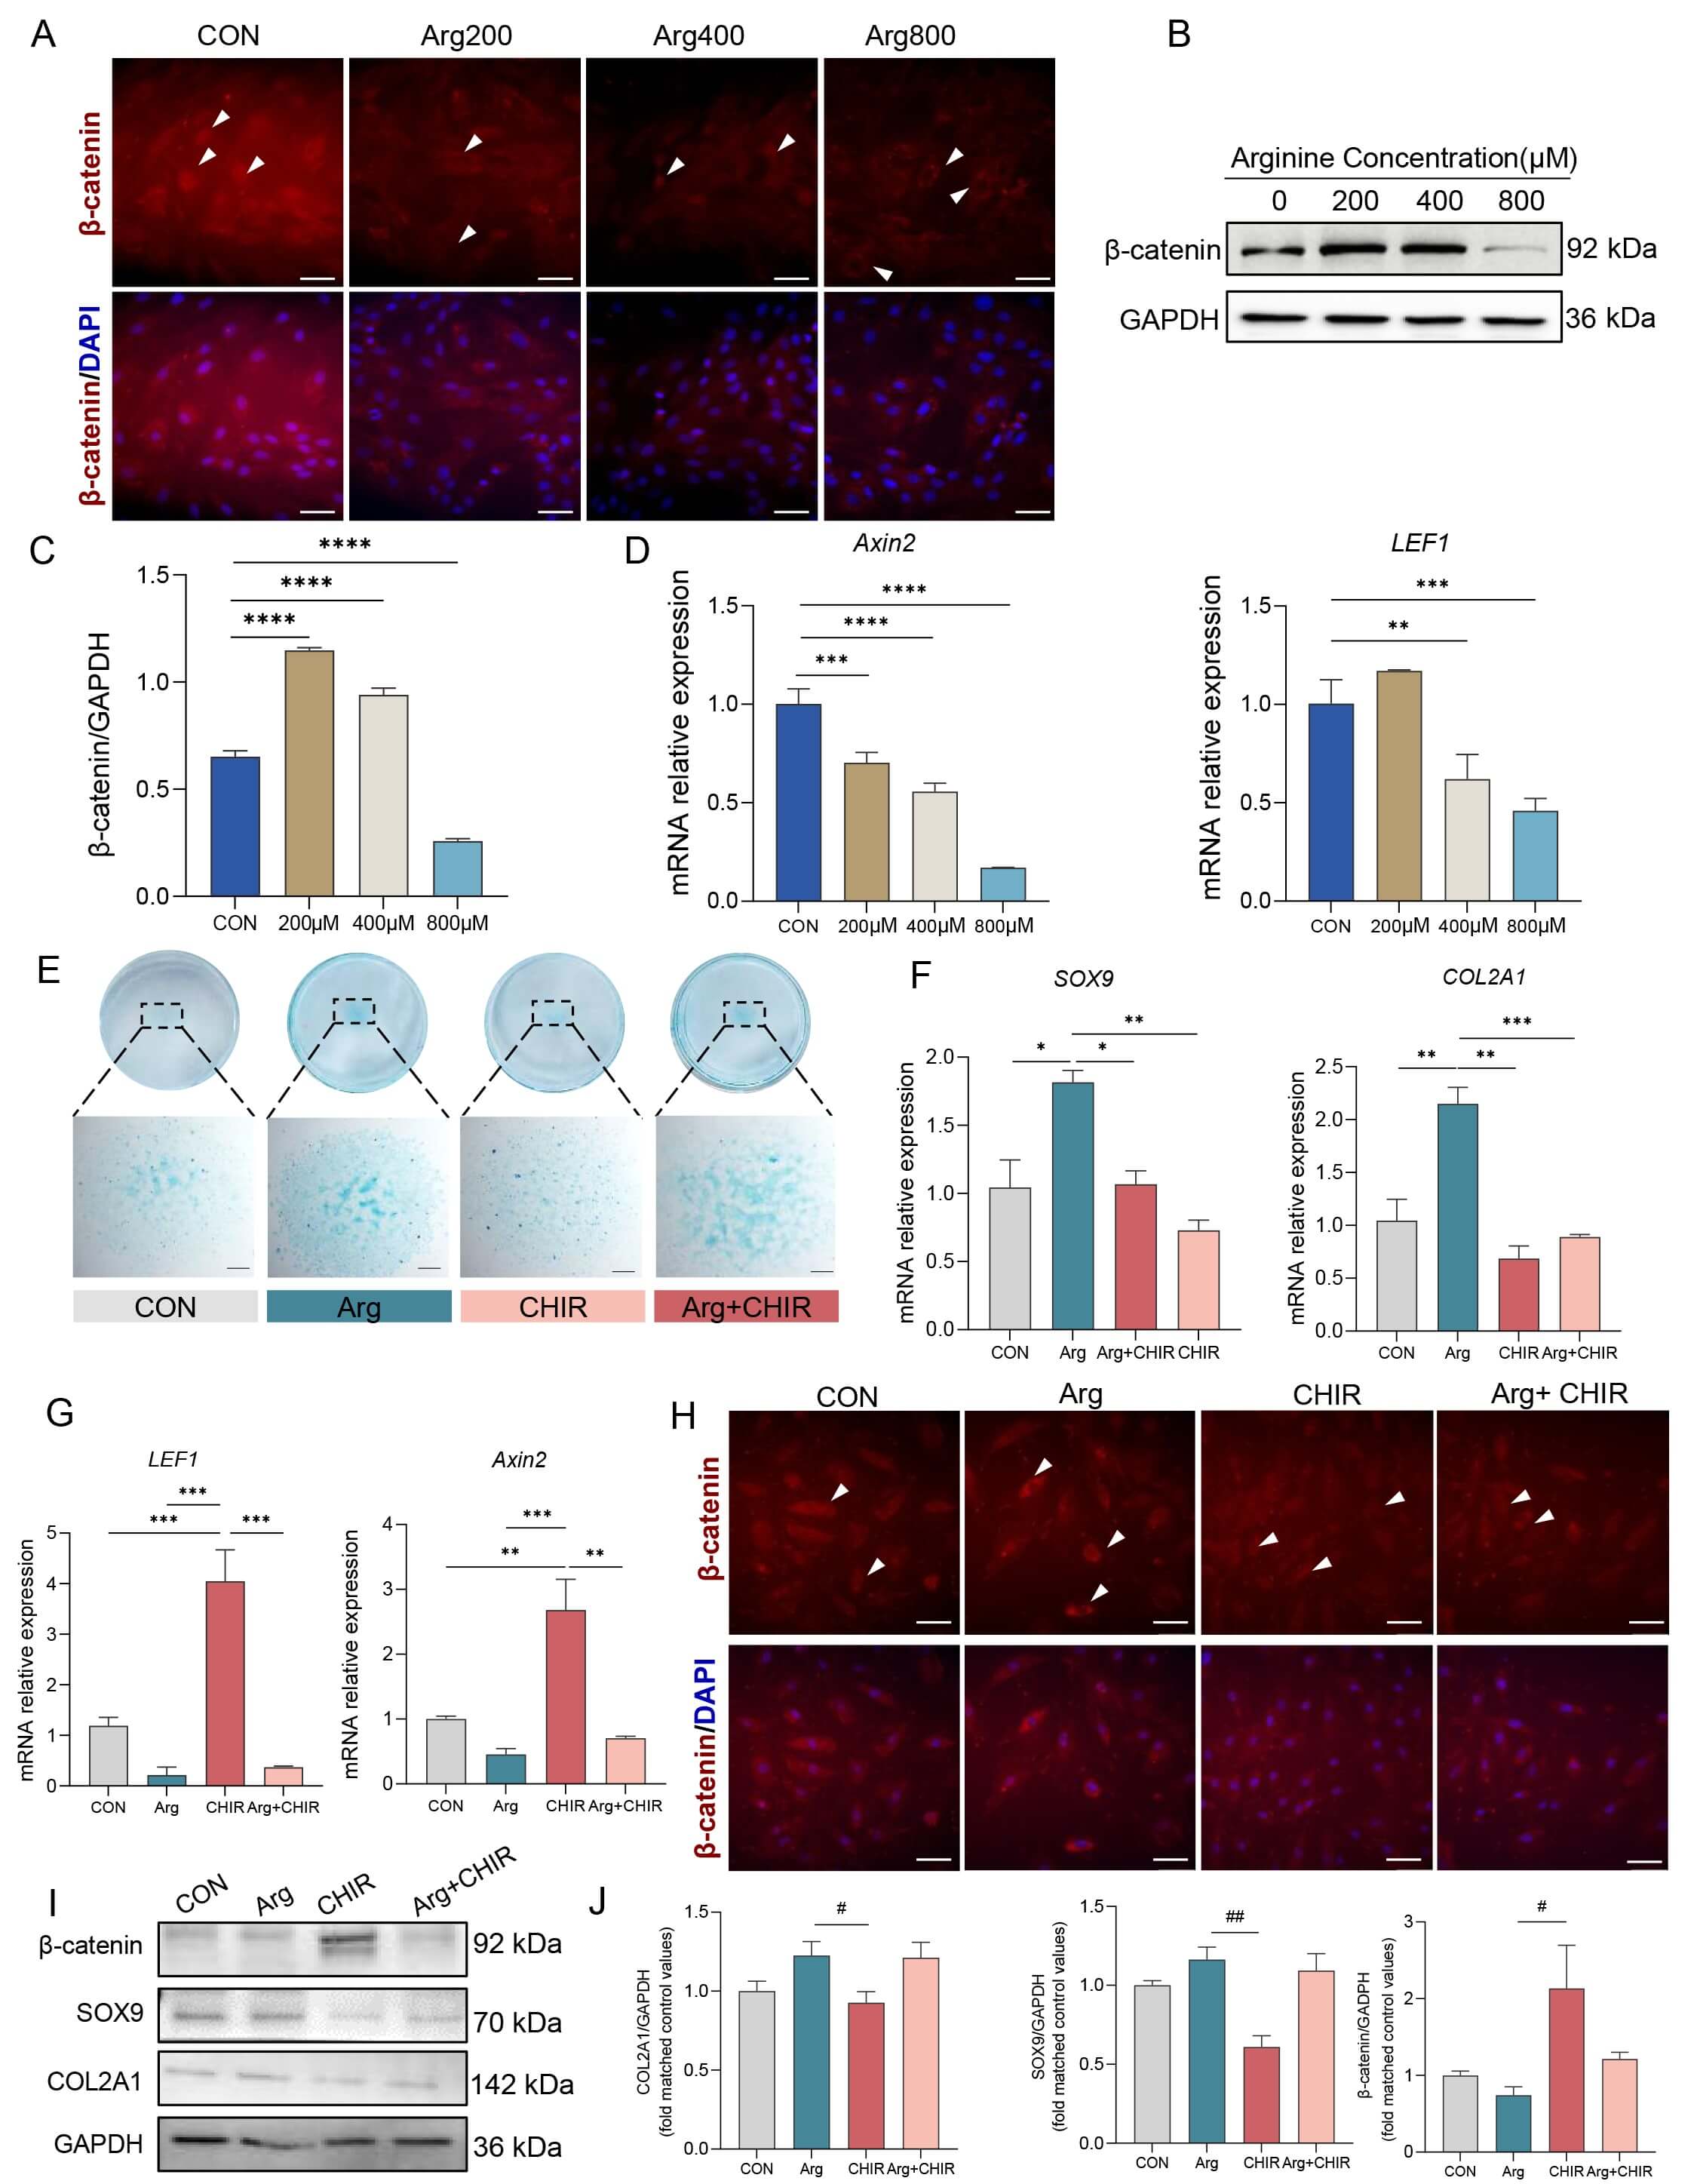
To examine Wnt/
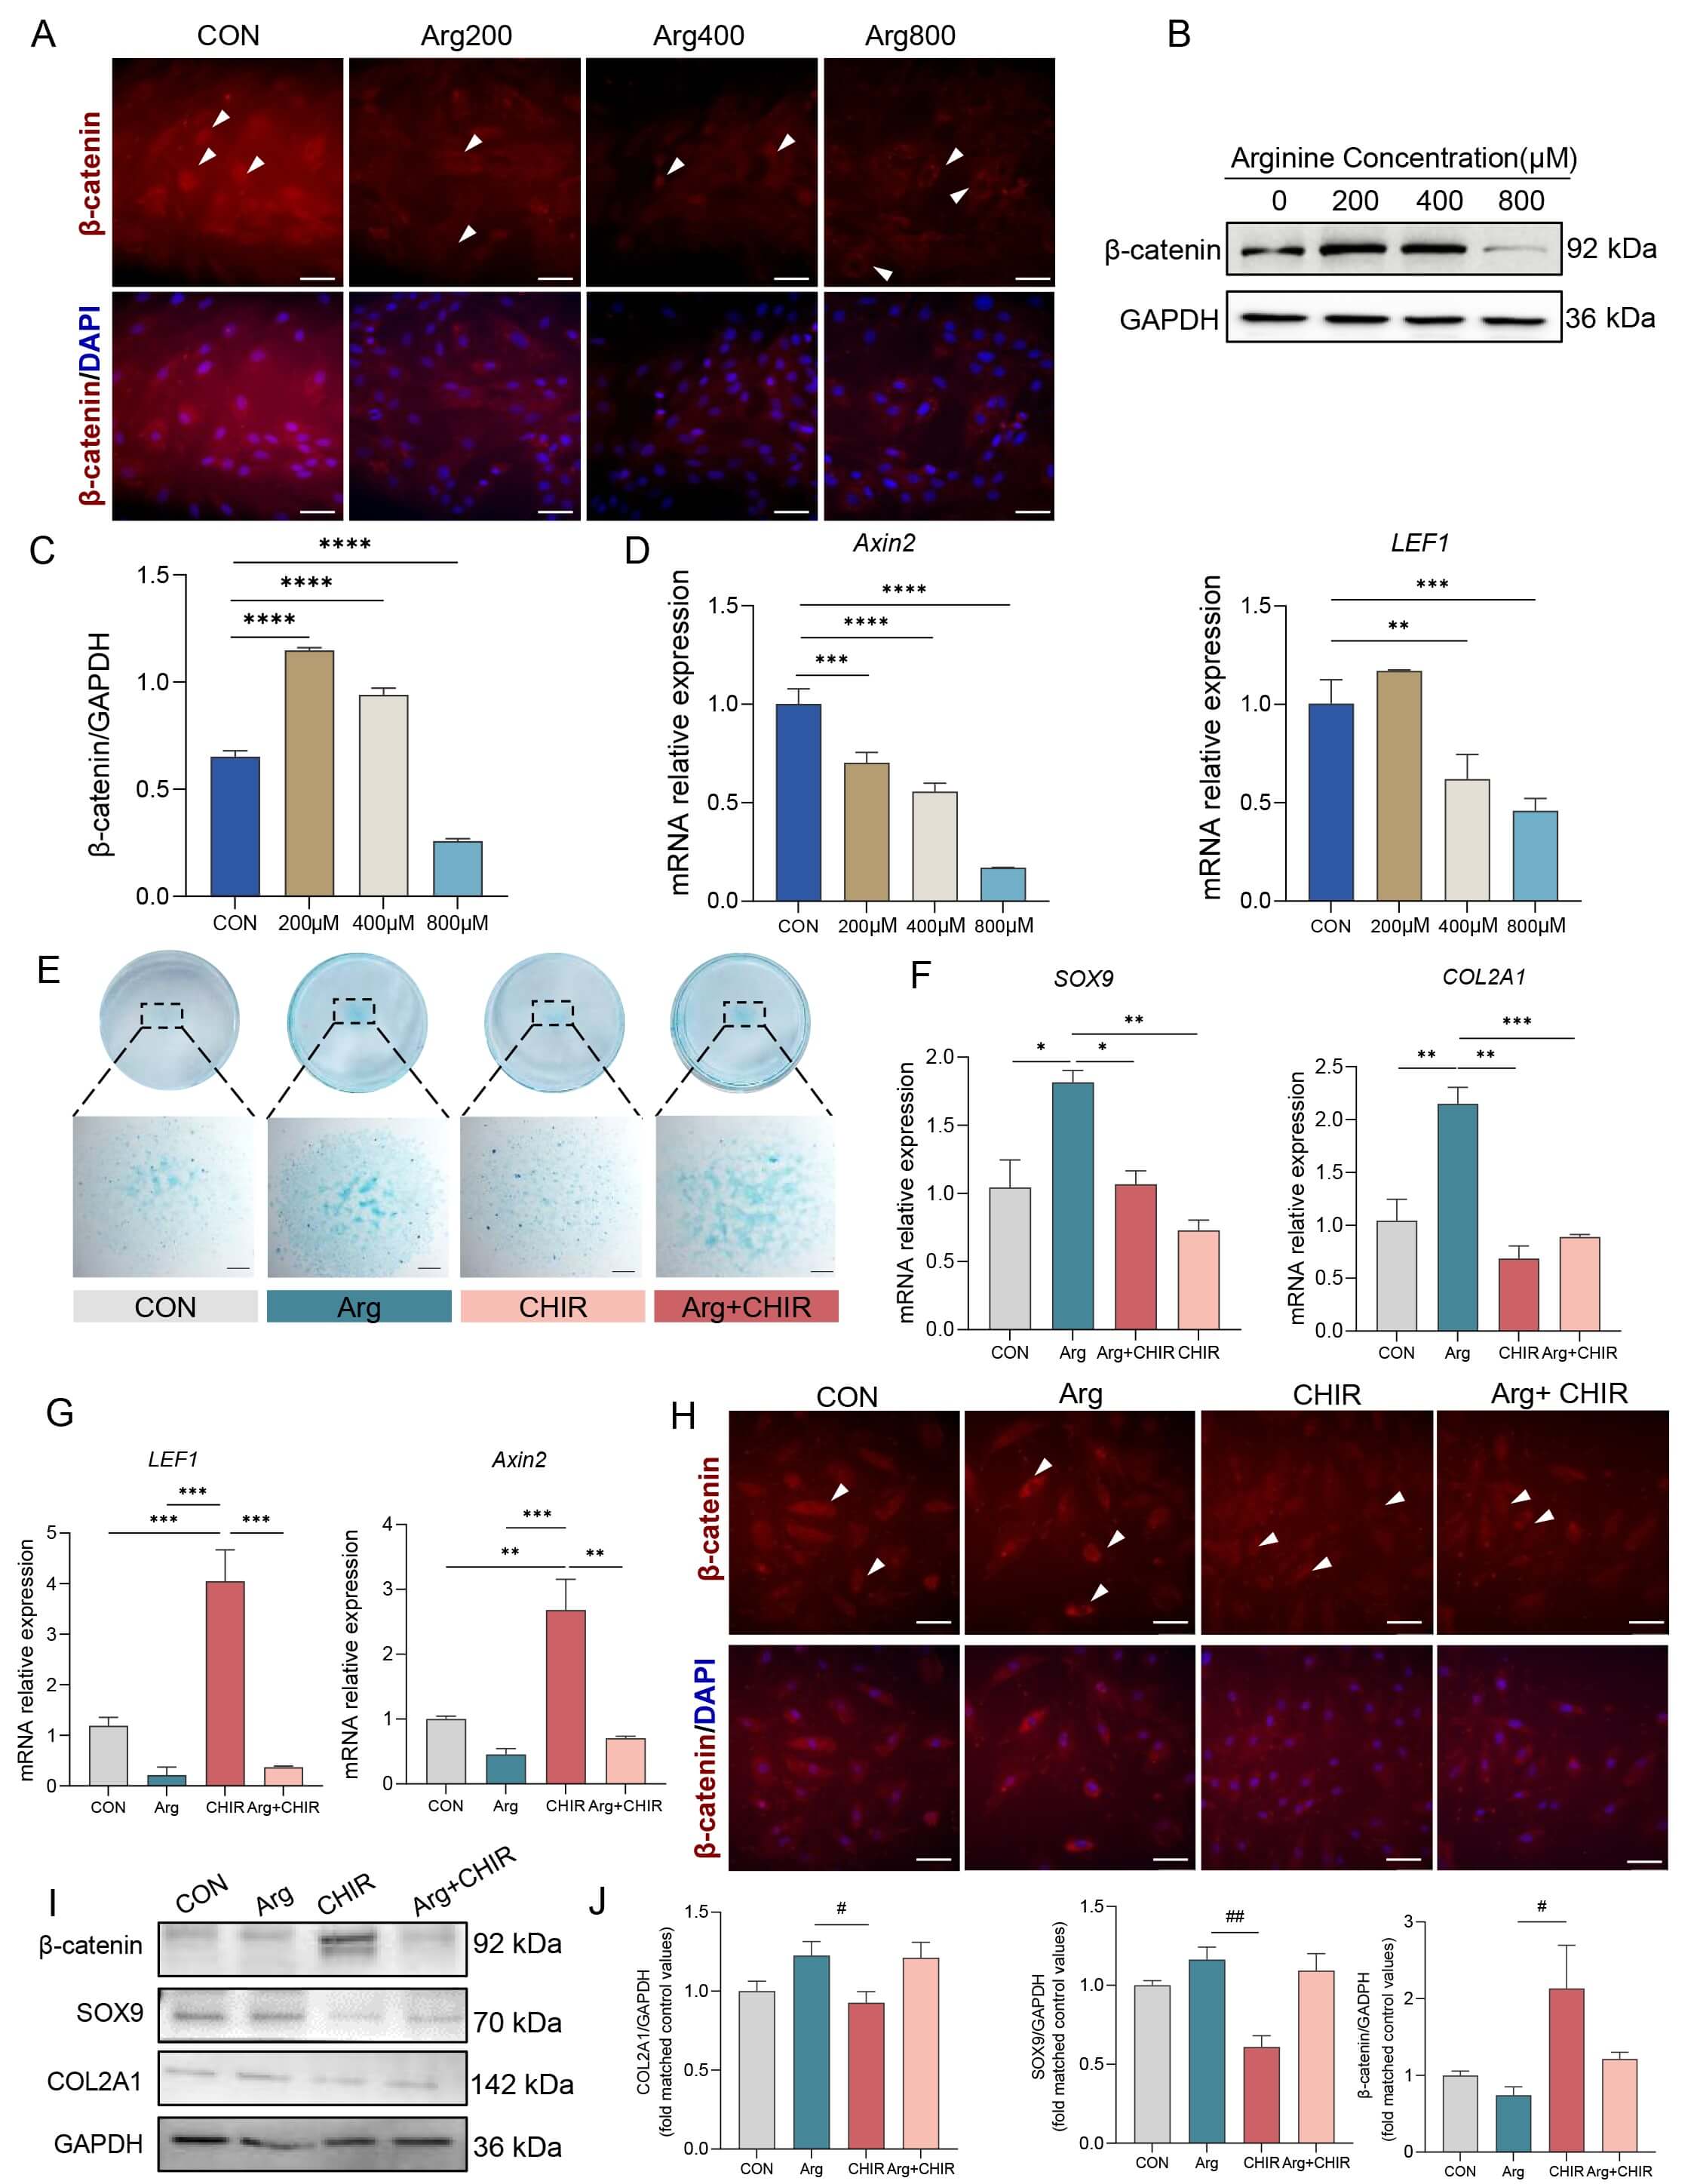 Fig. 5.
Effects of Arg and CHIR on the Wnt/
To further investigate the role of Wnt/
Deer antlers represent a unique mammalian model of rapid organ regeneration.
They are characterized by rapid cartilage formation that originates from the
growth center reserve mesenchyme, where mesenchymal progenitors undergo
substantial expansion and chondrogenic commitment to support antler growth [1].
Arg is a conditionally essential amino acid with established roles in nutrient
sensing and stem/progenitor cell function. In the present study, we showed that
Arg significantly enhances the in vitro proliferation of RMCs, as
evidenced by increased cell viability and DNA synthesis [15, 25]. Transcriptomic
profiling further revealed that Arg induces coordinated remodeling of ECM
adhesion programs and multiple growth- and differentiation-related signaling
networks, in line with the central role of cell-ECM interactions in regulating
chondrocyte lineage behaviors [26]. Functionally, Arg also potentiates
chondrogenic differentiation, as evidenced by enhanced cartilage-like matrix
deposition and increased SOX9/COL2A1 expression. Additional activity-related and
pharmacological analyses also suggest that Arg modulates Wnt/
The pro-proliferative effect of Arg observed by CCK-8 and EdU assays aligns with the broader idea that amino acid availability can promote stem/progenitor cell expansion by linking metabolic supply to growth-control signaling, primarily through nutrient-sensitive pathways such as mTORC1 [27]. Additionally, several upregulated DEGs in Arg-treated RMCs (including UBE2C, PLK1, PCLAF, and FAM83D) are well-known cell-cycle regulators involved in DNA synthesis and mitotic progression, thus providing a transcriptional basis for the increased DNA synthesis observed with EdU staining. UBE2C promotes correct cell-cycle progression [28, 29]; PLK1 is crucial for multiple mitotic steps [30]; PCLAF regulates DNA synthesis via PCNA interaction [31]; and FAM83D is involved in spindle organization and efficient cell-cycle progression [32]. At the pathway level, enrichment of PI3K-Akt, Hippo, and mTOR signaling among the upregulated gene sets indicates that Arg may activate multiple interconnected growth-control pathways that coordinate nutrient status, biosynthesis needs, and cell-cycle progression [27, 33]. KEGG enrichment analysis revealed that the downregulated DEGs were mainly associated with pathways related to DNA replication, cell cycle, cellular senescence, and p53 signaling. However, the enrichment of downregulated genes in these categories should be interpreted with caution, since these pathways include not only proliferation-associated genes but also checkpoint- and growth-restraining regulators such as CDKN1A, CDKN2B, CDKN2C, CDKN2D, GADD45A, and TGFB1. Therefore, the proliferative effect of Arg was interpreted primarily on the basis of phenotypic assays, including Ki67 staining, CCK-8, and EdU incorporation. Notably, the enrichment of osteoclast differentiation-related terms might reflect shared remodeling-related transcriptional programs rather than direct osteoclast formation in RMCs. However, this aligns with the broader regenerative process of antler growth, where rapid endochondral ossification and coordinated tissue remodeling are essential, and osteoclast-related activities are closely linked to regeneration and bone turnover [34, 35].
A key feature of the transcriptomic response is an ECM-adhesion hub, with ECM-receptor interactions and focal adhesion at its core, thus connecting many DEGs. This indicates that Arg-induced transcriptional changes are partly centered on cell-ECM interactions [36]. Mechanistically, ECM components (e.g., collagens, laminins, fibronectin) and their receptors (integrins) regulate adhesion and migration and transmit extracellular mechanical cues into intracellular signaling through integrin adhesion complexes and focal adhesions, thereby driving mechanotransduction and shaping downstream gene expression programs [37]. Matrix stiffness, adhesion-site availability, and integrin-mediated cytoskeletal tension are well known to influence proliferation-differentiation decisions in mesenchymal stem cells. Chondrogenic commitment is particularly sensitive to mechanical and adhesive microenvironmental cues [38]. Importantly, ECM-adhesion signaling intersects with PI3K-Akt, Hippo (YAP/TAZ), and mTOR networks, providing a plausible systems-level bridge linking ECM cues with growth and nutrient-sensing regulation, consistent with the coordinated pathway enrichment observed in our dataset [33, 39, 40]. In the physiological context of antler development, rapid tissue reconstruction requires sustained cell expansion, migration, and massive matrix deposition, making ECM remodeling and adhesion dynamics biologically essential. Therefore, the ECM-adhesion hub identified here provides a coherent link between Arg-responsive transcriptional programs and key processes underlying the rapid development of antler cartilage [41].
At the functional level, Arg significantly enhanced the chondrogenic differentiation of RMCs. The increased Alcian blue–positive area indicates greater accumulation of sulfated glycosaminoglycans/proteoglycans, providing direct evidence of cartilage-like matrix formation [42]. This phenotypic change was supported by molecular assays showing increased mRNA and protein levels of SOX9 and COL2A1. SOX9 is a master transcription factor for chondrogenesis and drives the expression of significant cartilage matrix genes, including COL2A1 [43]. Therefore, concurrent upregulation of the SOX9-COL2A1 axis is a hallmark of activated chondrogenic programming [6]. Notably, these differentiation outcomes align with the transcriptomic enrichment of ECM/adhesion modules. During chondrogenesis, ECM remodeling and cell–matrix interactions not only shape the microenvironment required for condensation and tissue assembly, but also influence the efficiency of matrix synthesis and deposition [44]. Accordingly, Arg-induced upregulation of ECM and adhesion-related components may provide a favorable structural and signaling context that supports enhanced cartilage matrix accumulation.
With respect to the pathway signals suggested by transcriptomics, it is
important to interpret the Wnt/mTOR findings conservatively. RNA-seq enrichment
indicates that Wnt- and mTOR-related gene sets are transcriptionally responsive
to Arg treatment, but enrichment alone does not establish pathway activation [27, 45]. An important point requiring careful interpretation is that the effect of
Arg on
Although we incorporated pharmacological perturbation experiments and additional
activity-related readouts, including the p-S6K1/S6K1 ratio, nuclear localization
of
In summary, this study found that Arg promotes the proliferation of deer RMCs
both in vivo and in vitro, and enhances their chondrogenic
differentiation potential. During chondrogenic induction, 800 µM Arg was
associated with attenuation of canonical Wnt/
The datasets used and analyzed during the current study are available from the corresponding author on reasonable request.
This study involved the following contributions: Investigation: RD, HLL, YZ, and XD; Validation: WN, RD, XD, and HHL; Formal analysis: HHL and YZ; Writing—original draft preparation: RD, HLL, and WN; Writing—review and editing, Visualization, and Funding acquisition: HS. All authors contributed to editorial changes in the manuscript. All authors read and approved the final manuscript. All authors have participated sufficiently in the work and agreed to be accountable for all aspects of the work.
The experimental protocol was approved by the Animal Ethics Committee of Jilin Agricultural University (Approval ID: 20220614005). Animal testing follows the 3R (Replacement, Reduction, Refinement) principle and the ARRIVE guidelines, the Regulations for the Administration of Affairs Concerning Experimental Animals of China, the national standard Laboratory Animal—Environment and Housing Facilities (GB 14925-2010), and the Guidelines for Ethical Review of Laboratory Animal Welfare (GB/T 35892-2018).
Not applicable.
This work was funded by the National Key Research and Development Program of China (2023YFD1302000), the Science and Technology Development Program from Jilin Province (20230101271JC), the Jilin Agricultural Research System (JLARS-2025-080205), and the Science and Technology Research Project of the Jilin Provincial Department of Education (JJKH20261452KJ).
The authors declare no conflicts of interest.
Supplementary material associated with this article can be found, in the online version, at https://doi.org/10.31083/FBL50041.
References
Publisher’s Note: IMR Press stays neutral with regard to jurisdictional claims in published maps and institutional affiliations.