


1 Department of Cardiology, Chinese People’s Liberation Army Rocket Force Characteristic Medical Center, 100088 Beijing, China
2 The Graduate Training Base of Jinzhou Medical University, Department of Cardiology, Chinese People’s Liberation Army Rocket Force Characteristic Medical Center, 100088 Beijing, China
3 Department of Nuclear Radiation Injury and Monitoring, Chinese People’s Liberation Army Rocket Force Characteristic Medical Center, 100088 Beijing, China
4 Medical Research Department, Chinese People’s Liberation Army Rocket Force Characteristic Medical Center, 100088 Beijing, China
5 Department of General Medicine, Chinese People’s Liberation Army Rocket Force Characteristic Medical Center, 100088 Beijing, China
6 Department of Respiratory Medicine, Chinese People’s Liberation Army Rocket Force Characteristic Medical Center, 100088 Beijing, China
Abstract
This study aimed to investigate the protective effect of Tectorigenin against irradiation-induced endothelial cell damage and to elucidate the underlying mechanism, thereby identifying potential therapeutic targets for irradiation-induced heart disease.
An in vitro radiation-induced injury model was established to evaluate oxidative stress and apoptosis. Mitochondrial morphology was assessed by transmission electron microscopy, while mitochondrial function was evaluated using JC-1 staining, MitoSOX staining, immunofluorescence, and ATP assays. To investigate the involvement of mitophagy in the underlying mechanism, a mitophagy inhibitor, PINK1 siRNA, and PINK1 overexpression were employed.
Tectorigenin significantly attenuated radiation-induced oxidative stress and apoptosis, suppressed mitochondrial reactive oxygen species (ROS) generation and membrane depolarization, and attenuated mitophagy activation through downregulation of PINK1 and Parkin expression. Notably, PINK1 inhibition potentiated these protective effects, whereas PINK1 overexpression abrogated Tec-mediated protection.
Tectorigenin alleviated irradiation-induced injury through suppressing the activation of PINK1-mediated mitophagy, thereby offering potential therapeutic targets and candidate agents for radiation-induced heart disease (RIHD).
Keywords
- tectorigenin
- irradiation
- PINK1/Parkin
- mitophagy
- gene regulation
Radiotherapy for malignant tumor patients, particularly those with thoracic malignancies, effectively alleviates symptoms and prolongs survival. However, it inevitably induces harmful effects on the vascular system, thereby increasing the risk of cardiovascular diseases [1, 2, 3]. Radiation-induced heart disease (RIHD) is a serious complication of radiotherapy; however, its pathogenesis remains poorly understood, and effective preventive and therapeutic strategies are severely lacking. Endothelial cells play a pivotal role in maintaining vascular homeostasis, and endothelial cell injury leading to vascular dysfunction is considered a primary mechanism underlying RIHD. Previous studies have demonstrated that radiation induces endothelial cell apoptosis and oxidative stress [4, 5, 6]. Irradiation also impairs mitochondria, with mitochondrial dysfunction and abnormal mitophagy being of particular interest [7, 8]. Mitophagy functions as a self-protective mechanism for cells under normal physiological conditions. However, in pathological contexts, its excessive activation induces the clearance of substantial healthy mitochondria, thereby exacerbating cellular energy metabolic derangements and promoting cell death [9, 10]. However, the specific mechanisms of mitophagy in irradiation-damaged Endothelial cells remain unclear. Tectorigenin (Tec), a plant-derived isoflavonoid, has gained increasing attention for its multifaceted biological activities. Emerging evidence demonstrates that Tec alleviates excessive accumulation of mitochondrial reactive oxygen species [11, 12, 13, 14]. Therefore, we hypothesized that Tec exerts protective effects against irradiation-induced endothelial cell injury. Using human umbilical vein endothelial cells (HUVECs) as an in vitro model, the present study aimed to investigate the radioprotective effects of Tec and elucidate the underlying mechanisms. These findings may provide novel insights into the prevention and treatment of irradiation-induced injury and establish a foundation for subsequent clinical investigations.
HUVECs were obtained from Procell (Wuhan, China). The cell line was authenticated by short tandem repeat (STR) profiling and tested negative for mycoplasma. The cells were seeded in culture dishes containing complete DMEM medium supplemented with 10% fetal bovine serum (FBS; Aoqing, Beijing, China). After thorough mixing, the dishes were placed in a cell culture incubator (Thermo, Waltham, MA, USA) maintained at 37 °C with 5% CO2. Upon reaching 80% confluence, the supernatant was discarded, and the cells were rinsed with PBS (NCM, Suzhou, China). Subsequently, 1.5 mL of trypsin (Gibco, Grand Island, NY, USA) was added to initiate digestion, which was terminated after 3 minutes. The cells were then resuspended and subcultured at a 1:4 split ratio.
HUVECs were irradiated using an X-ray irradiator (KUBTEC, Stratford, CT, USA) at doses of 0, 3, 6, 9, and 12 Gy, with a dose rate of 1 Gy/min. After irradiation, the HUVECs were cultured in an incubator for subsequent experiments.
Tec was dissolved in DMSO to prepare a stock solution at a concentration of 2 mg/mL (6.66 mM) and subsequently diluted to the desired working concentrations using basal DMEM medium. HUVECs were pretreated with Tec working solution for 24 h prior to irradiation exposure, and assays were performed 72 h post-irradiation.
MTK458 (MCE, South Brunswick, NJ, USA) and U0126 (MCE, USA) were dissolved in DMSO to prepare stock solutions and subsequently diluted with basal DMEM medium to working concentrations of 100 µM. HUVECs were treated with the working solutions for 48 h to induce PINK1 overexpression or inhibit mitophagy, respectively. Similarly, HUVECs were transfected with PINK1 siRNA (GenePharma, Suzhou, China) for 48 h prior to subsequent experimental procedures.
Cell viability was assessed using the CCK-8 assay (Beyotime, Shanghai, China).
Briefly, HUVECs were seeded into 96-well plates (Corning, New York, NY, USA) at a
density of 5
HUVECs were harvested and centrifuged at 1500 rpm for 3 min using a high-speed centrifuge (Sigma, Osterode, Lower Saxony, Germany). The supernatant was carefully aspirated, and the cell pellet was resuspended in 4% paraformaldehyde solution. Cells were fixed at room temperature in the dark for 2 h, followed by storage at 4 °C. Subsequently, the fixed cells were post-fixed with 1% osmium tetroxide at 4 °C for 2 h. Dehydration was performed using a graded ethanol series (50%, 70%, 80%, 90%, and 100%). After dehydration, samples were embedded in resin and polymerized at 60 °C for 48 h. Ultrathin sections (80 nm) were prepared, mounted on copper grids, and stained. Cellular ultrastructure was observed under a transmission electron microscope, with particular emphasis on analyzing mitochondrial morphological changes and autophagosome formation. For quantitative analysis, the independent experiments were examined. Mitochondria were classified as damaged if they exhibited swelling, cristae disruption, cristae loss, or vacuolization.
HUVECs were seeded into 6-well plates (Corning, USA) at a density of 1
HUVECs were seeded into confocal dishes (Corning, USA) at a density of 1
HUVECs were seeded into 6-well plates (Corning, USA) at a density of 1
HUVECs were seeded into confocal culture dishes at a density of 1
HUVECs were lysed in RIPA lysis buffer (Beyotime, China) supplemented with 1%
protease inhibitor (NCM, China). Following 30 min of lysis on ice, the lysates
were centrifuged at 14,000 rpm for 15 min at 4 °C using a high-speed
centrifuge. The supernatant was collected, and total protein concentration was
determined using the BCA method. Protein samples were mixed with loading buffer
(Servicebio, Wuhan, China) and heated at 95 °C for 10 min. Proteins were
separated by SDS-PAGE (Bio-Rad, Hercules, CA, USA) and transferred onto PVDF
membranes (Bio-Rad, USA). After blocking with 5% non-fat milk for 1 h at room
temperature, membranes were incubated overnight at 4 °C with primary
antibodies against PINK1 (Cat No.23274-1-AP, Proteintech, Wuhan, China; 1:1000),
Parkin (ab324566, Abcam, Cambridge, UK; 1:1000), and
HUVECs were seeded into confocal dishes at a density of 1
HUVECs were seeded into 6-well plates at a density of 1
HUVECs were seeded into 6-well plates at a density of 1
HUVECs were seeded into confocal dishes and cultured until reaching approximately 80% confluence. The culture medium was then aspirated, and cells were incubated with DHE working solution (5 µM prepared in serum-free medium) in the dark for 30 min at 37 °C. After incubation, unbound probes were removed by washing with PBS. Samples were then mounted using Antifade Mounting Medium with DAPI (Beyotime, China). Fluorescence was visualized under a fluorescence microscope (Leica, Germany).
Mitophagic activity was evaluated using a Mitophagy Detection Kit (DOJINDO,
Kumamoto Prefecture, Japan). HUVECs were seeded into confocal dishes at a density
of 1
HUVECs were seeded into 6-well plates at a density of 1
HUVECs were seeded into 6-well plates at a density of 1
All statistical analyses were conducted using GraphPad Prism 9.5 (GraphPad
Software, La Jolla, CA, USA). Data are presented as mean
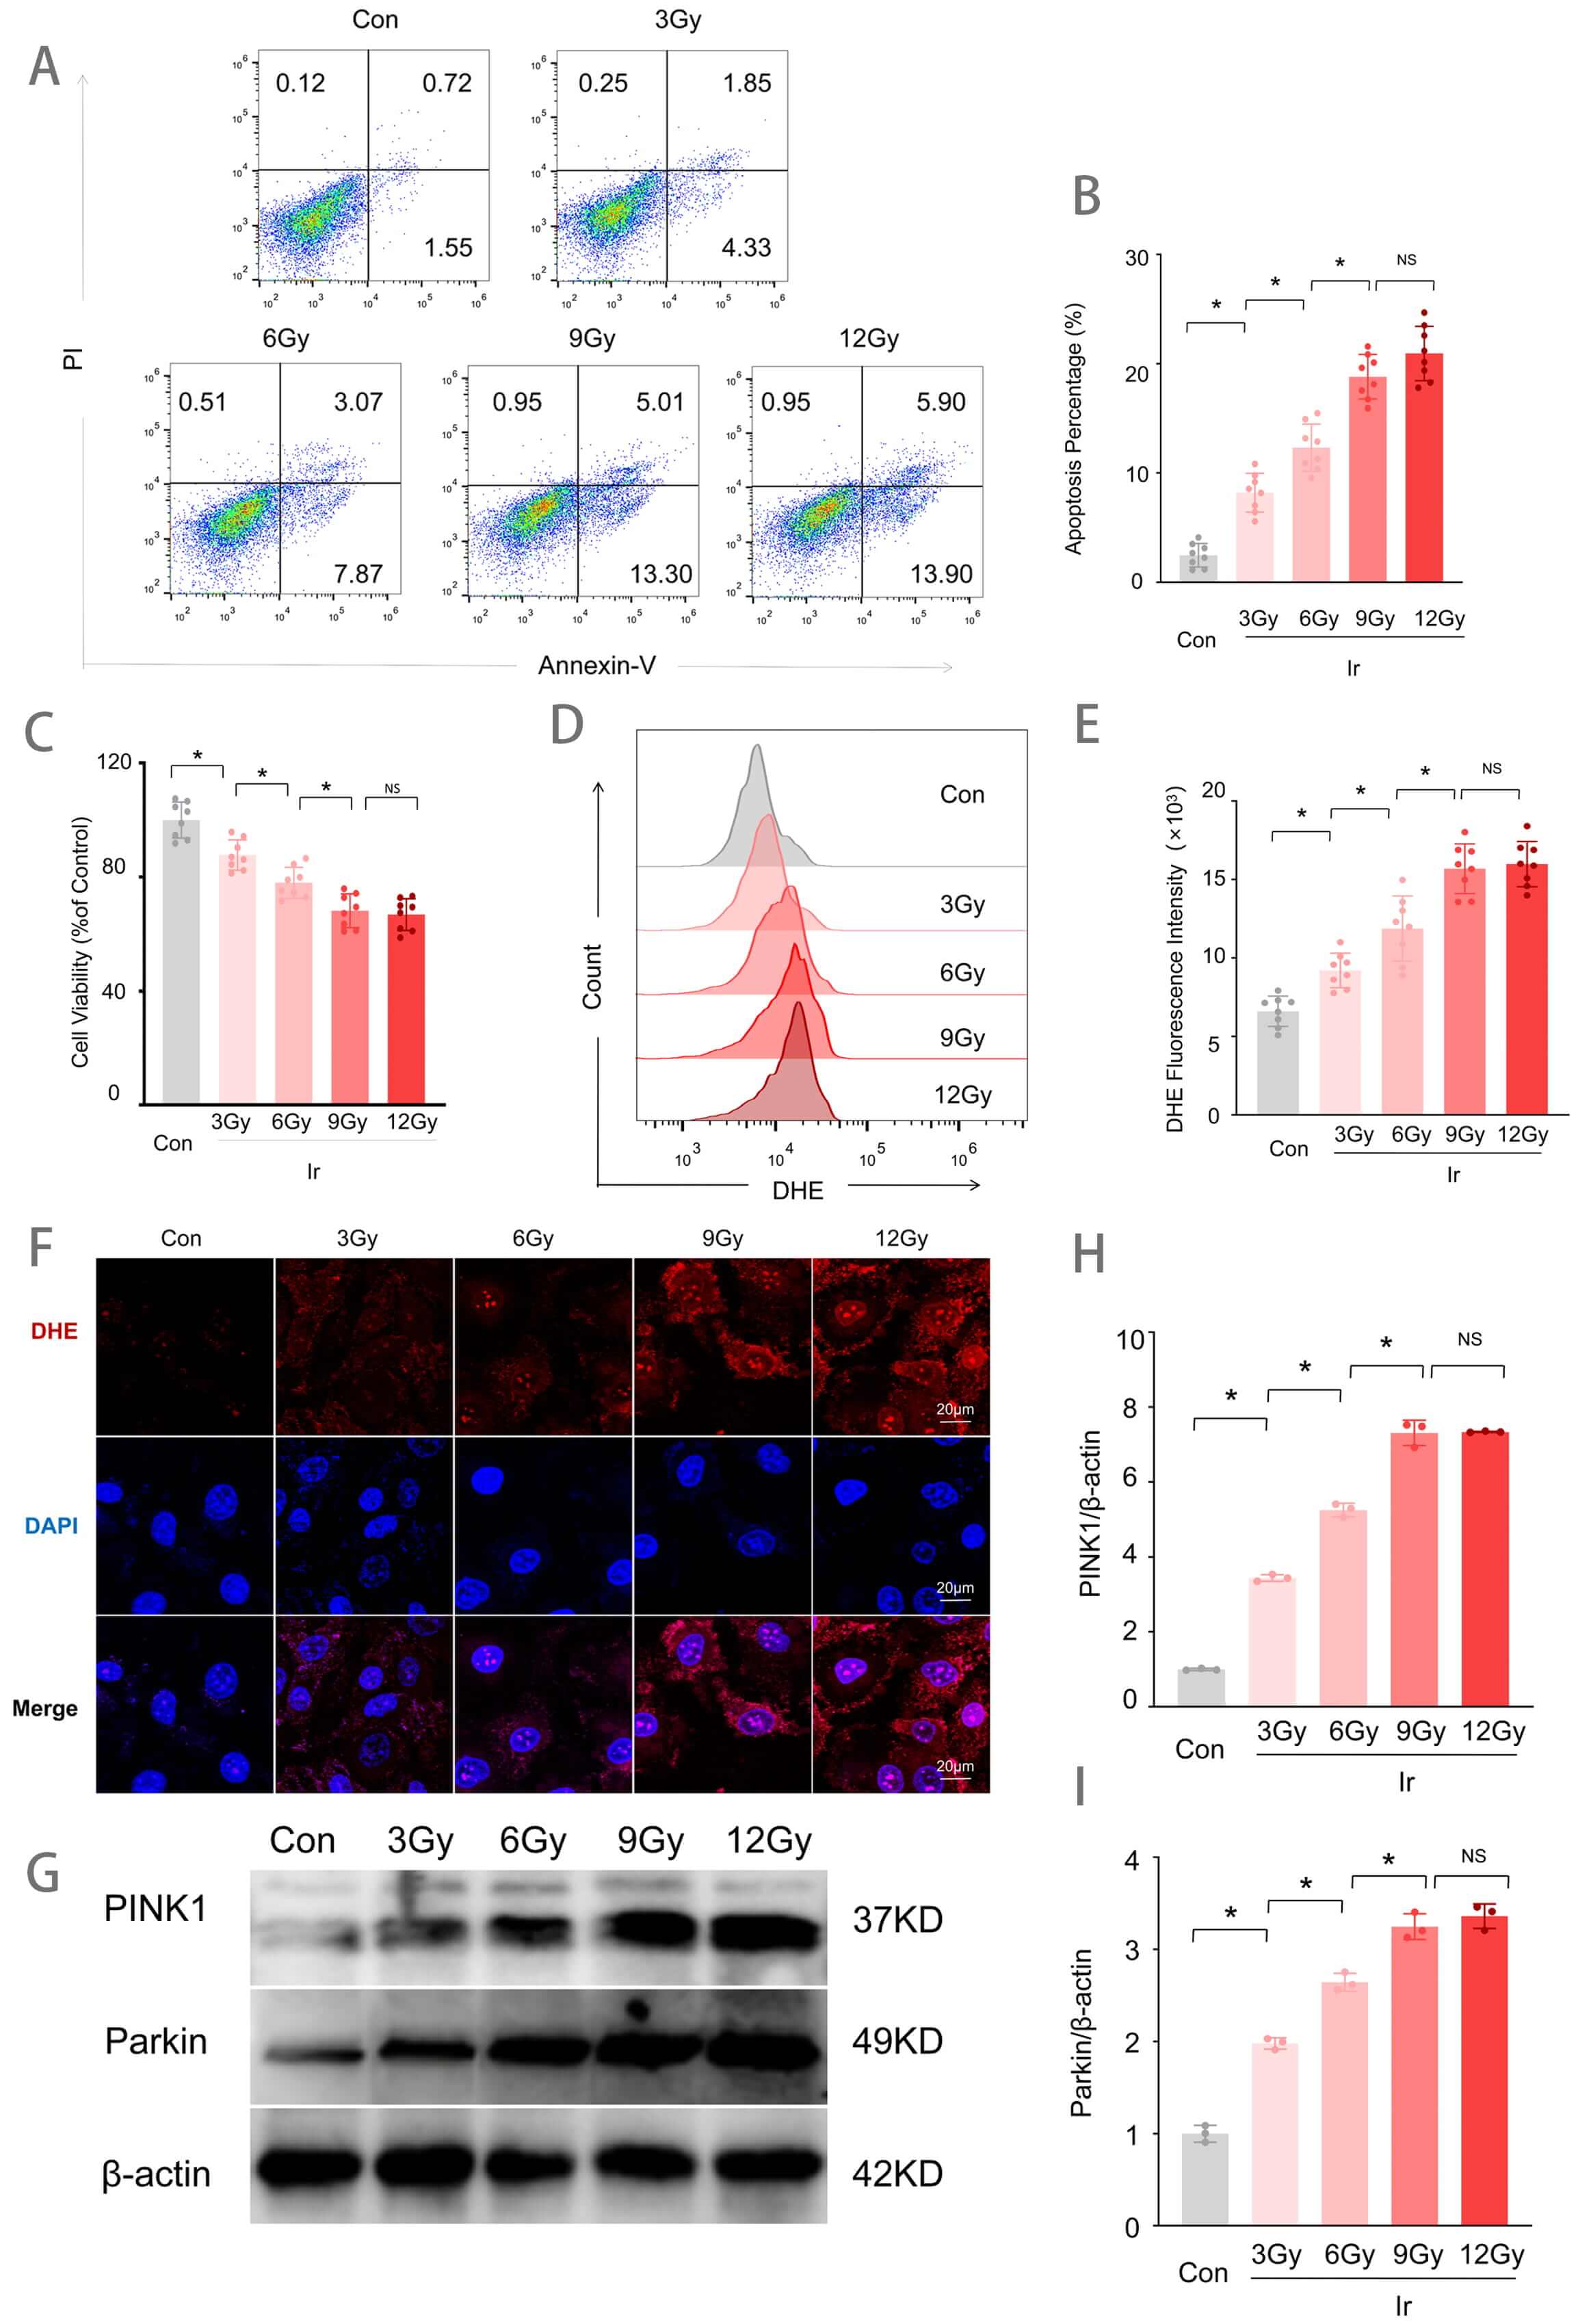
To establish an optimal irradiation dose for subsequent experiments, HUVECs were exposed to increasing doses of irradiation (3, 6, 9, and 12 Gy), and cellular injury was assessed. As shown in Fig. 1, irradiation induced dose-dependent increases in apoptotic rate, reactive oxygen species (ROS) production, and reductions in cell viability. Annexin V/PI double staining revealed that the apoptotic rate was significantly increased in the 3 Gy group compared to the control (Con) group, with further progressive increases observed at 6 Gy and 9/12 Gy (Fig. 1A,B). CCK-8 assays demonstrated that cell viability decreased progressively with increasing irradiation doses relative to the Con group (Fig. 1C). Flow cytometric analysis of DHE fluorescence intensity, an indicator of superoxide levels, showed a significant increase in the 3 Gy group compared to the Con group, with significantly higher levels in the 6 Gy group than in the 3 Gy group, and further elevation in the 9 Gy and 12 Gy groups compared to the 6 Gy group (Fig. 1D,E). DHE fluorescence staining further confirmed enhanced red fluorescence signals in all irradiated groups relative to the Con group (Fig. 1F). Western blot analysis revealed that protein expression levels of PINK1 and Parkin increased progressively with escalating irradiation doses (Fig. 1G–I). Notably, 9 Gy irradiation induced the most pronounced cellular injury, while increasing the dose to 12 Gy did not result in statistically significant exacerbation of damage compared to the 9 Gy group. Therefore, a radiation dose of 9 Gy was selected for all subsequent experiments.
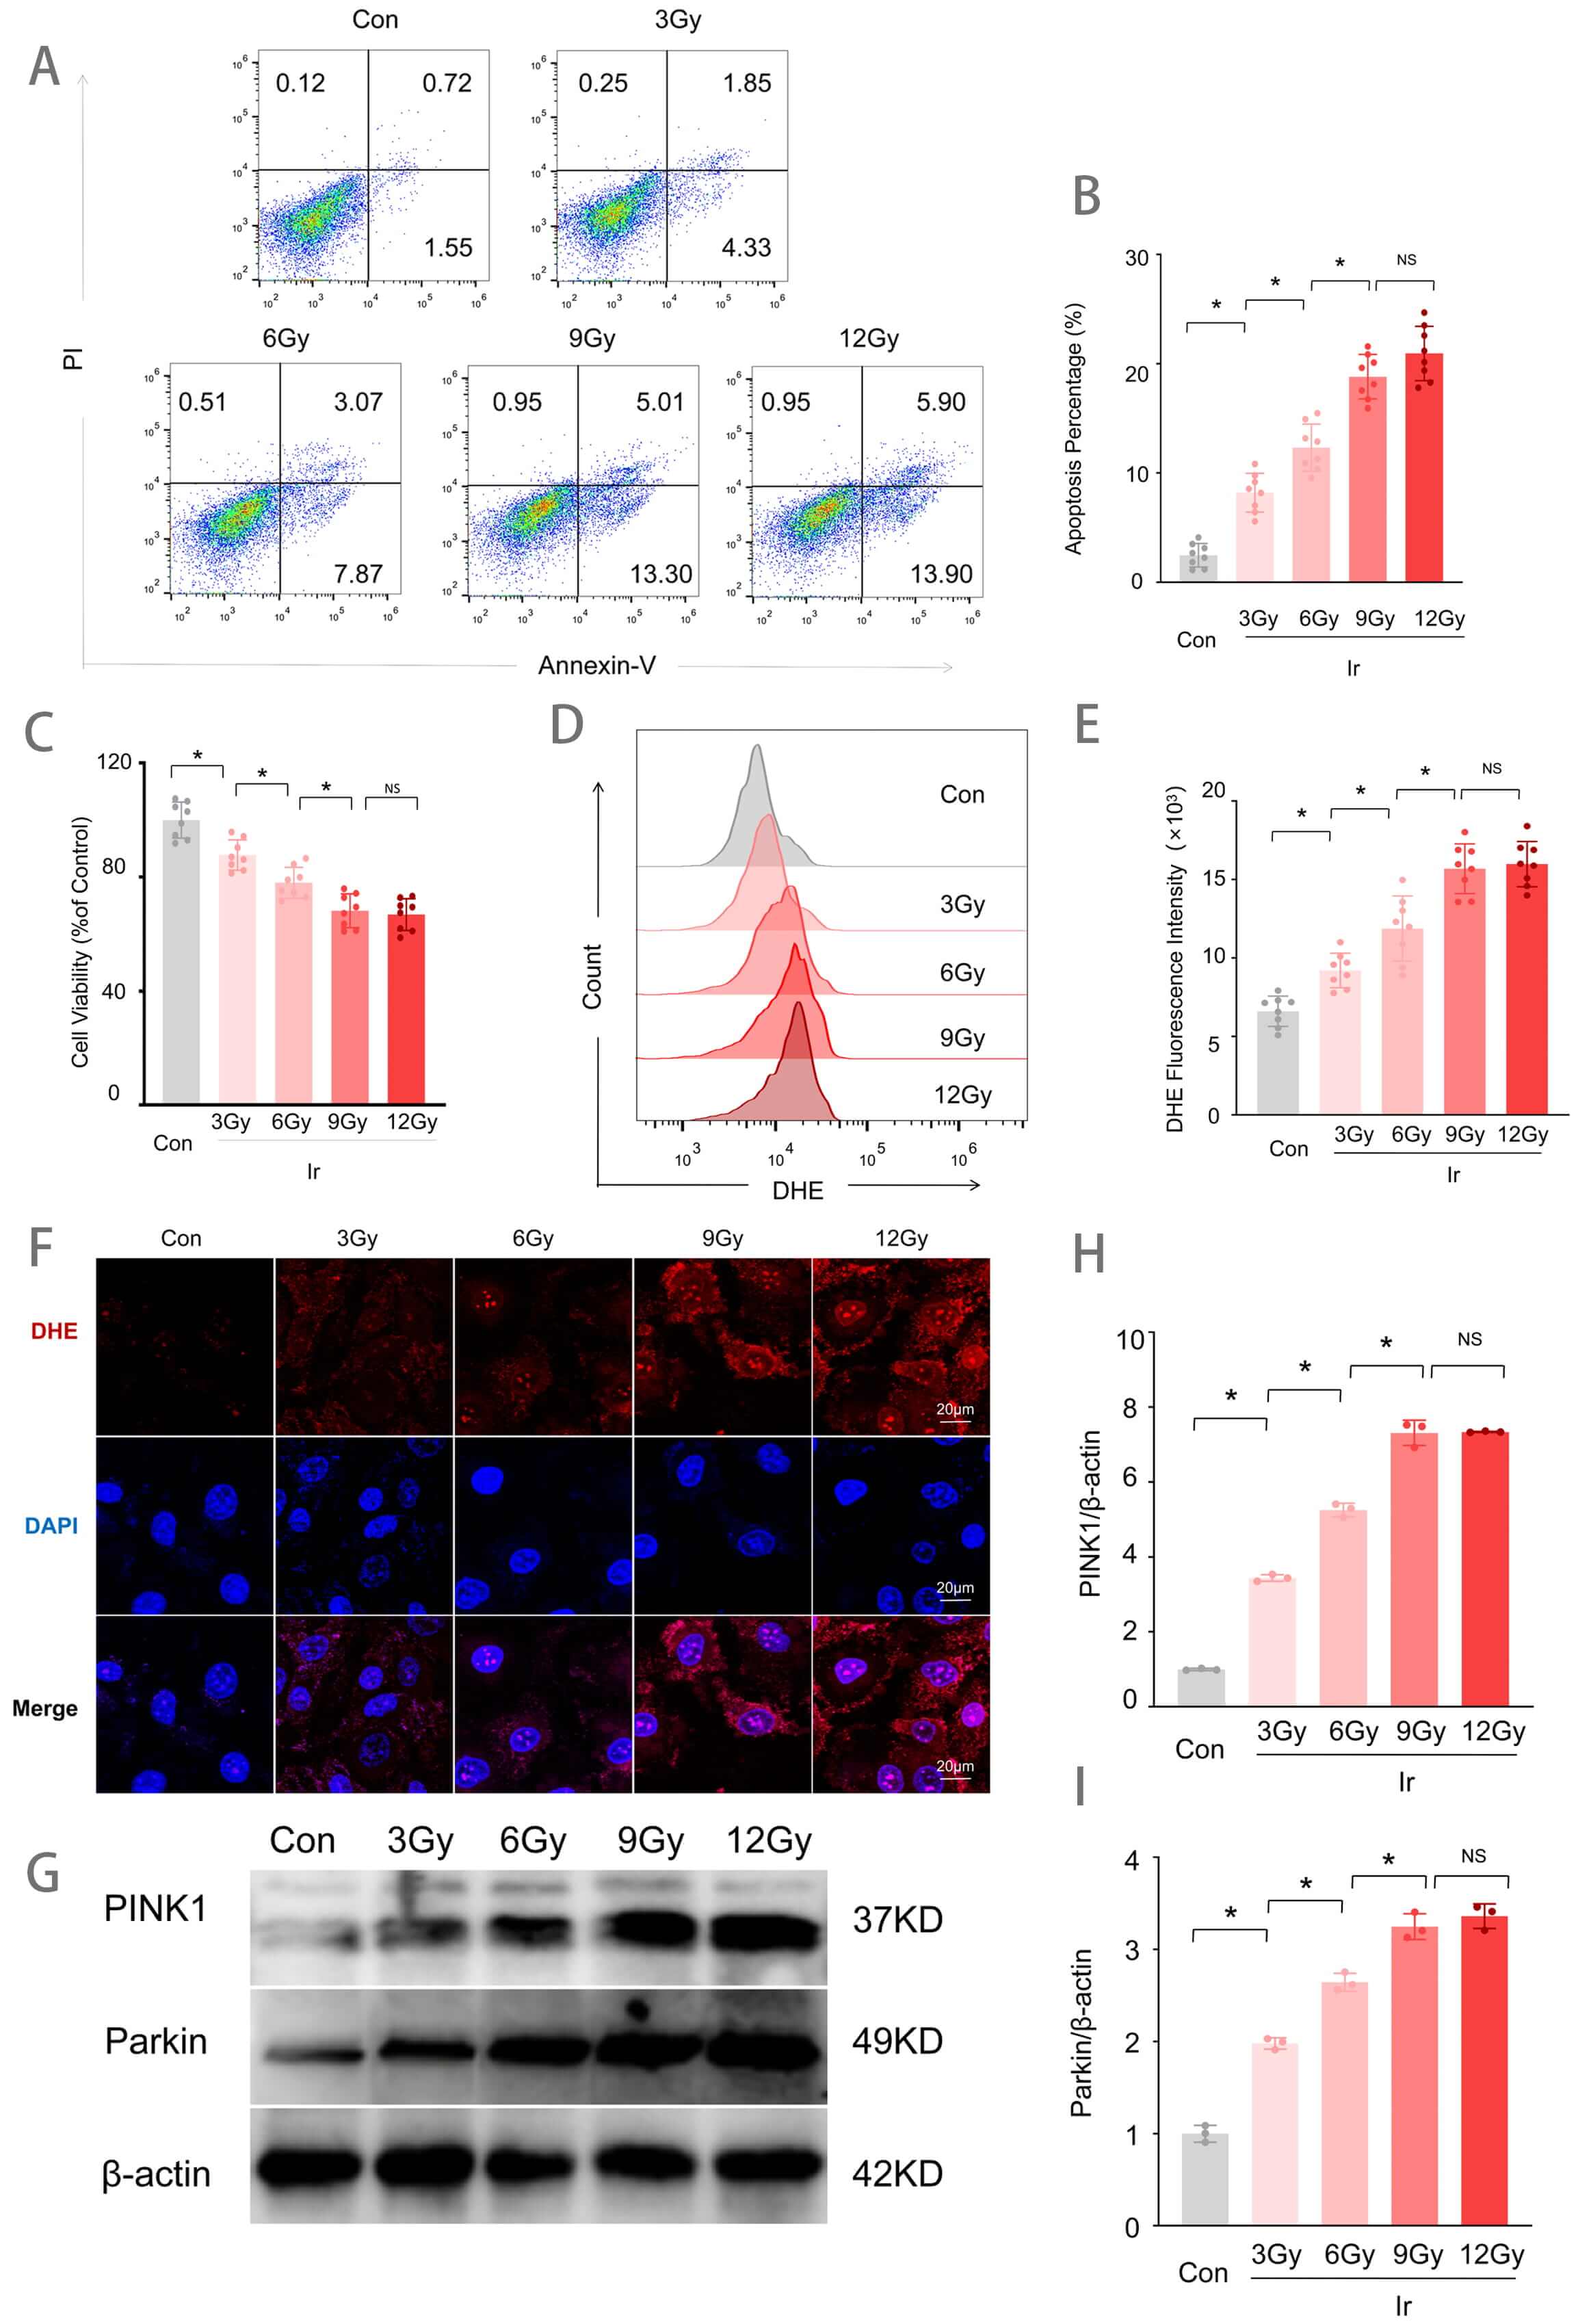 Fig. 1.
Irradiation-induced injury in HUVECs. (A) Representative flow
cytometry plots of Annexin V/PI staining for apoptosis detection. (B)
Quantitative analysis of apoptotic rates (n = 8). (C) Cell viability assessed by
CCK-8 assay (n = 8). (D) Representative flow cytometry histograms of DHE
fluorescence intensity. (E) Quantitative analysis of DHE fluorescence intensity
(n = 8). (F) Representative images of DHE fluorescence staining (red). Scale bar
= 20 µm. (G) Western blot analysis of PINK1 and Parkin protein expression.
(H) Quantitative analysis of PINK1 expression levels normalized to
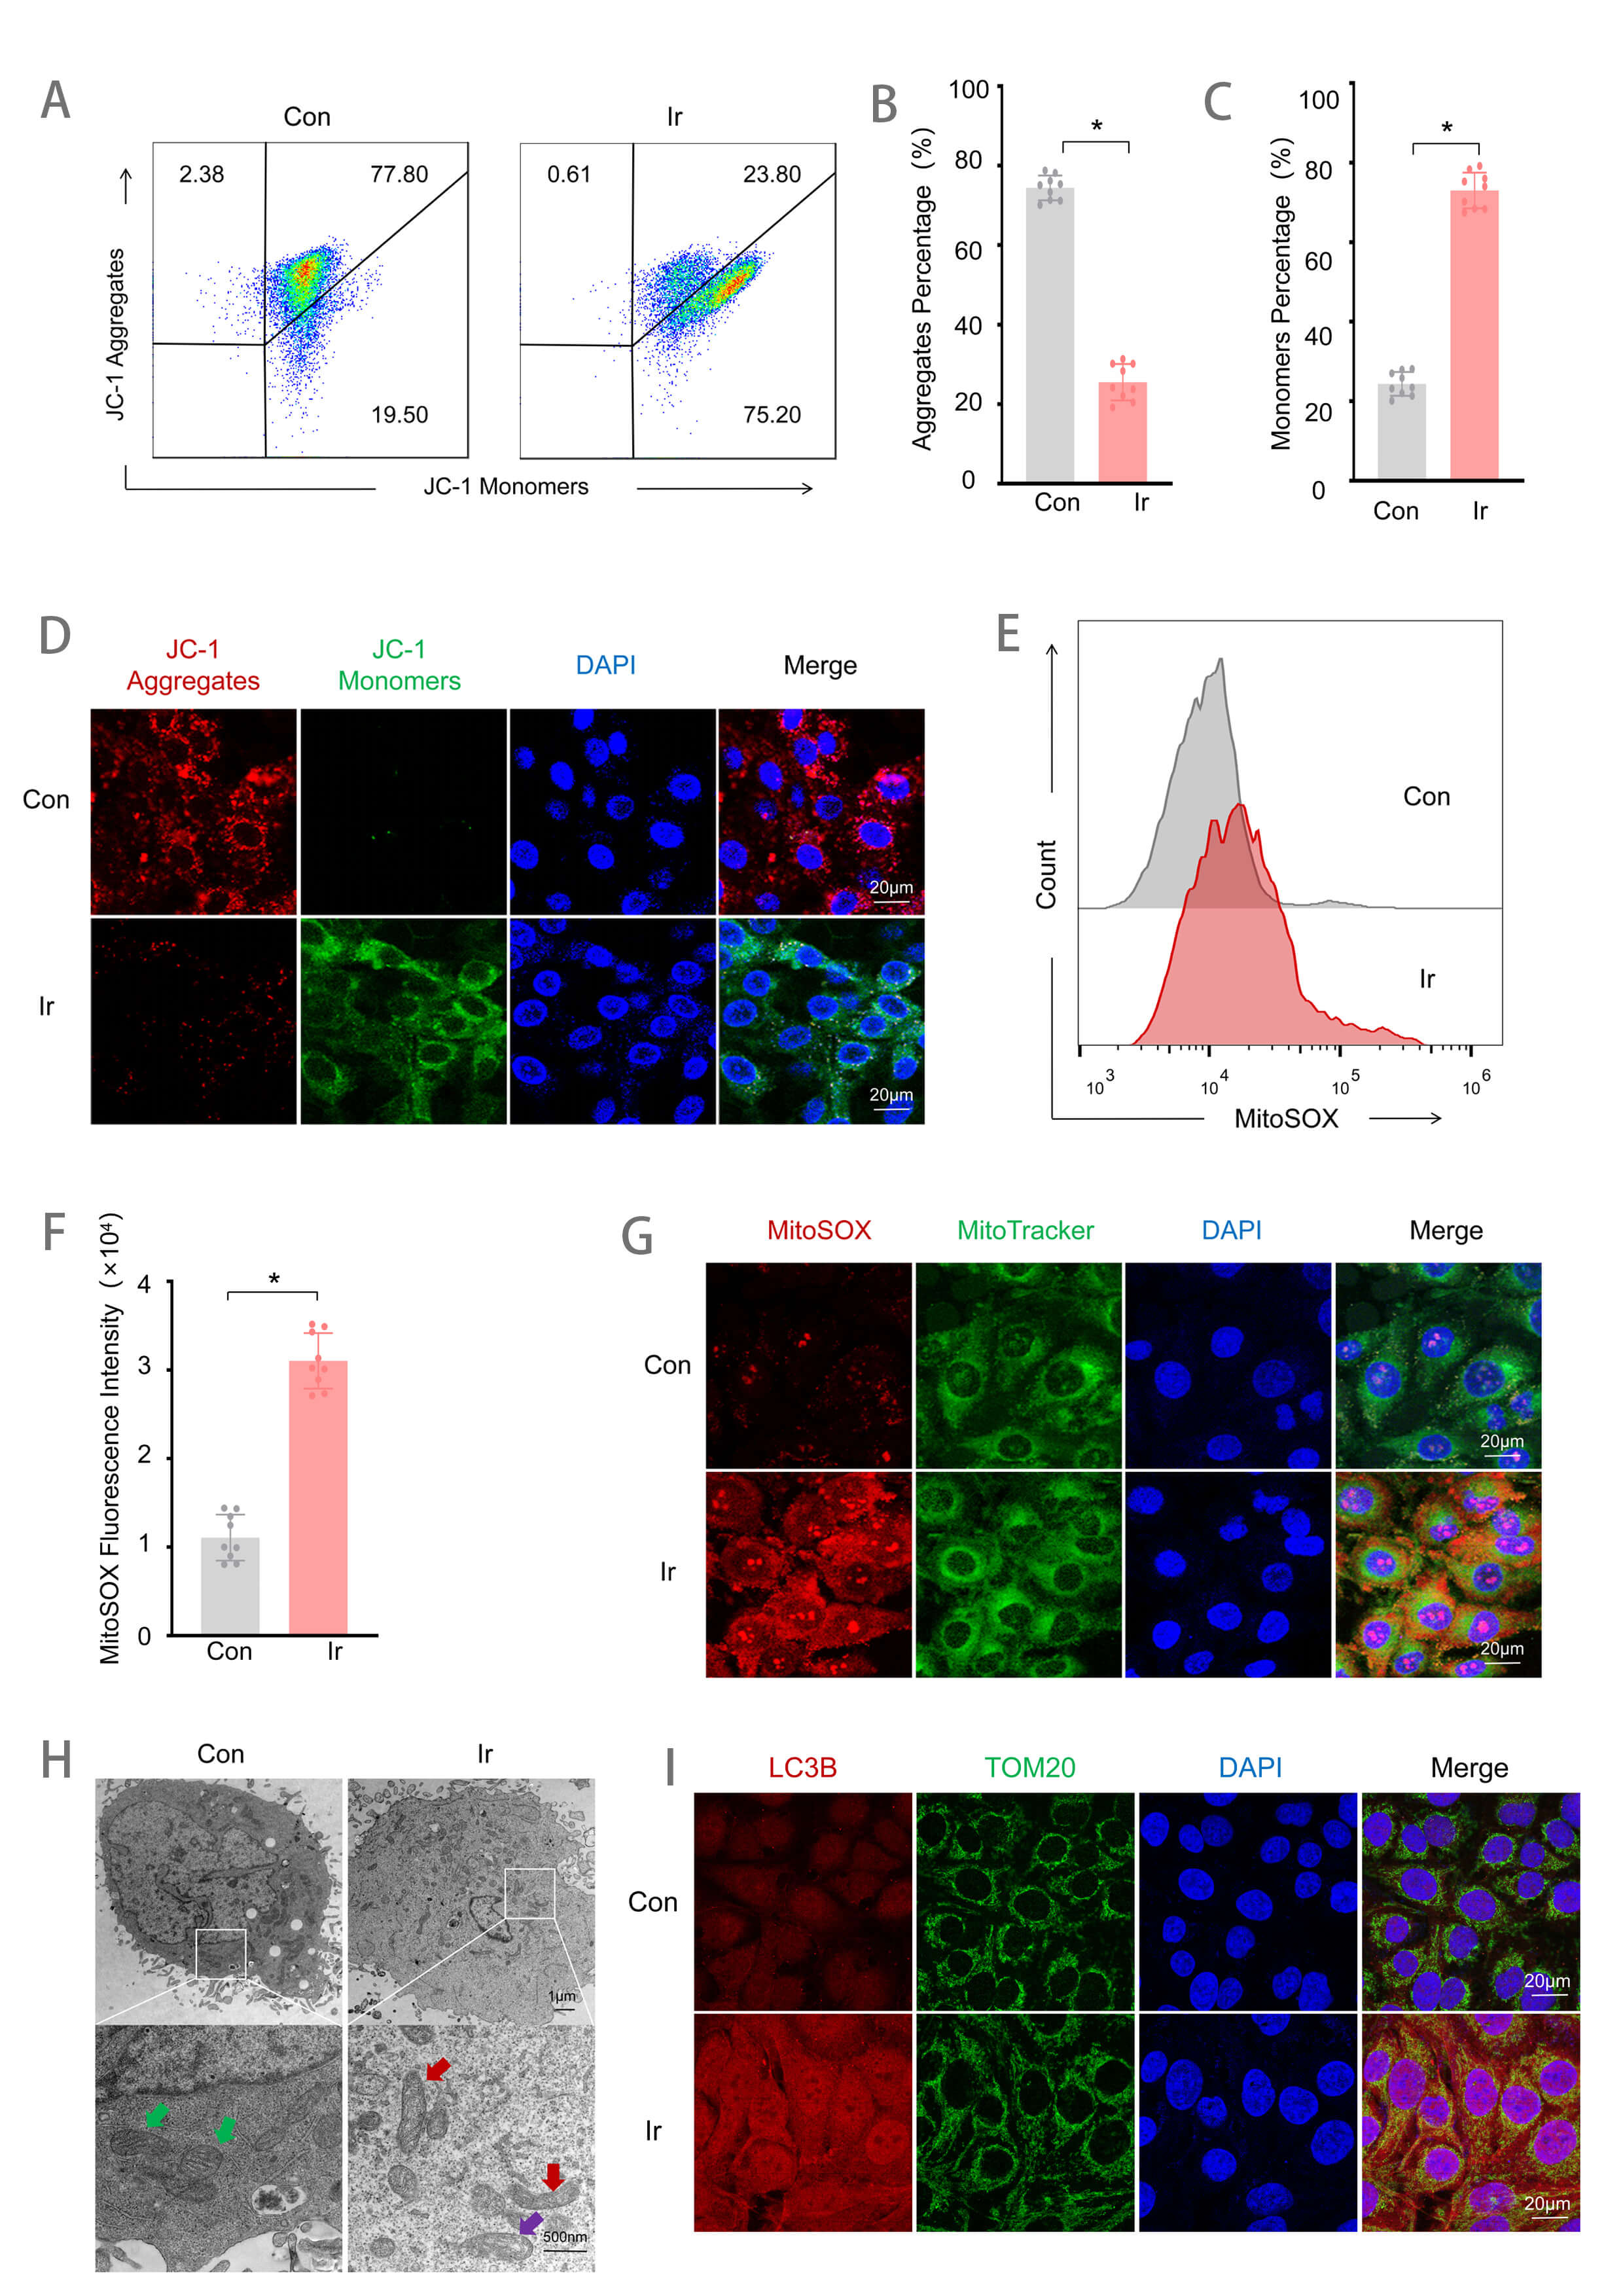
To further investigate the effects of 9 Gy irradiation on mitochondrial
function, both mitochondrial function and morphology were assessed. Flow
cytometry showed that irradiated cells exhibited a decrease in JC-1 aggregates
and an increase in JC-1 monomers, indicating mitochondrial membrane potential
(
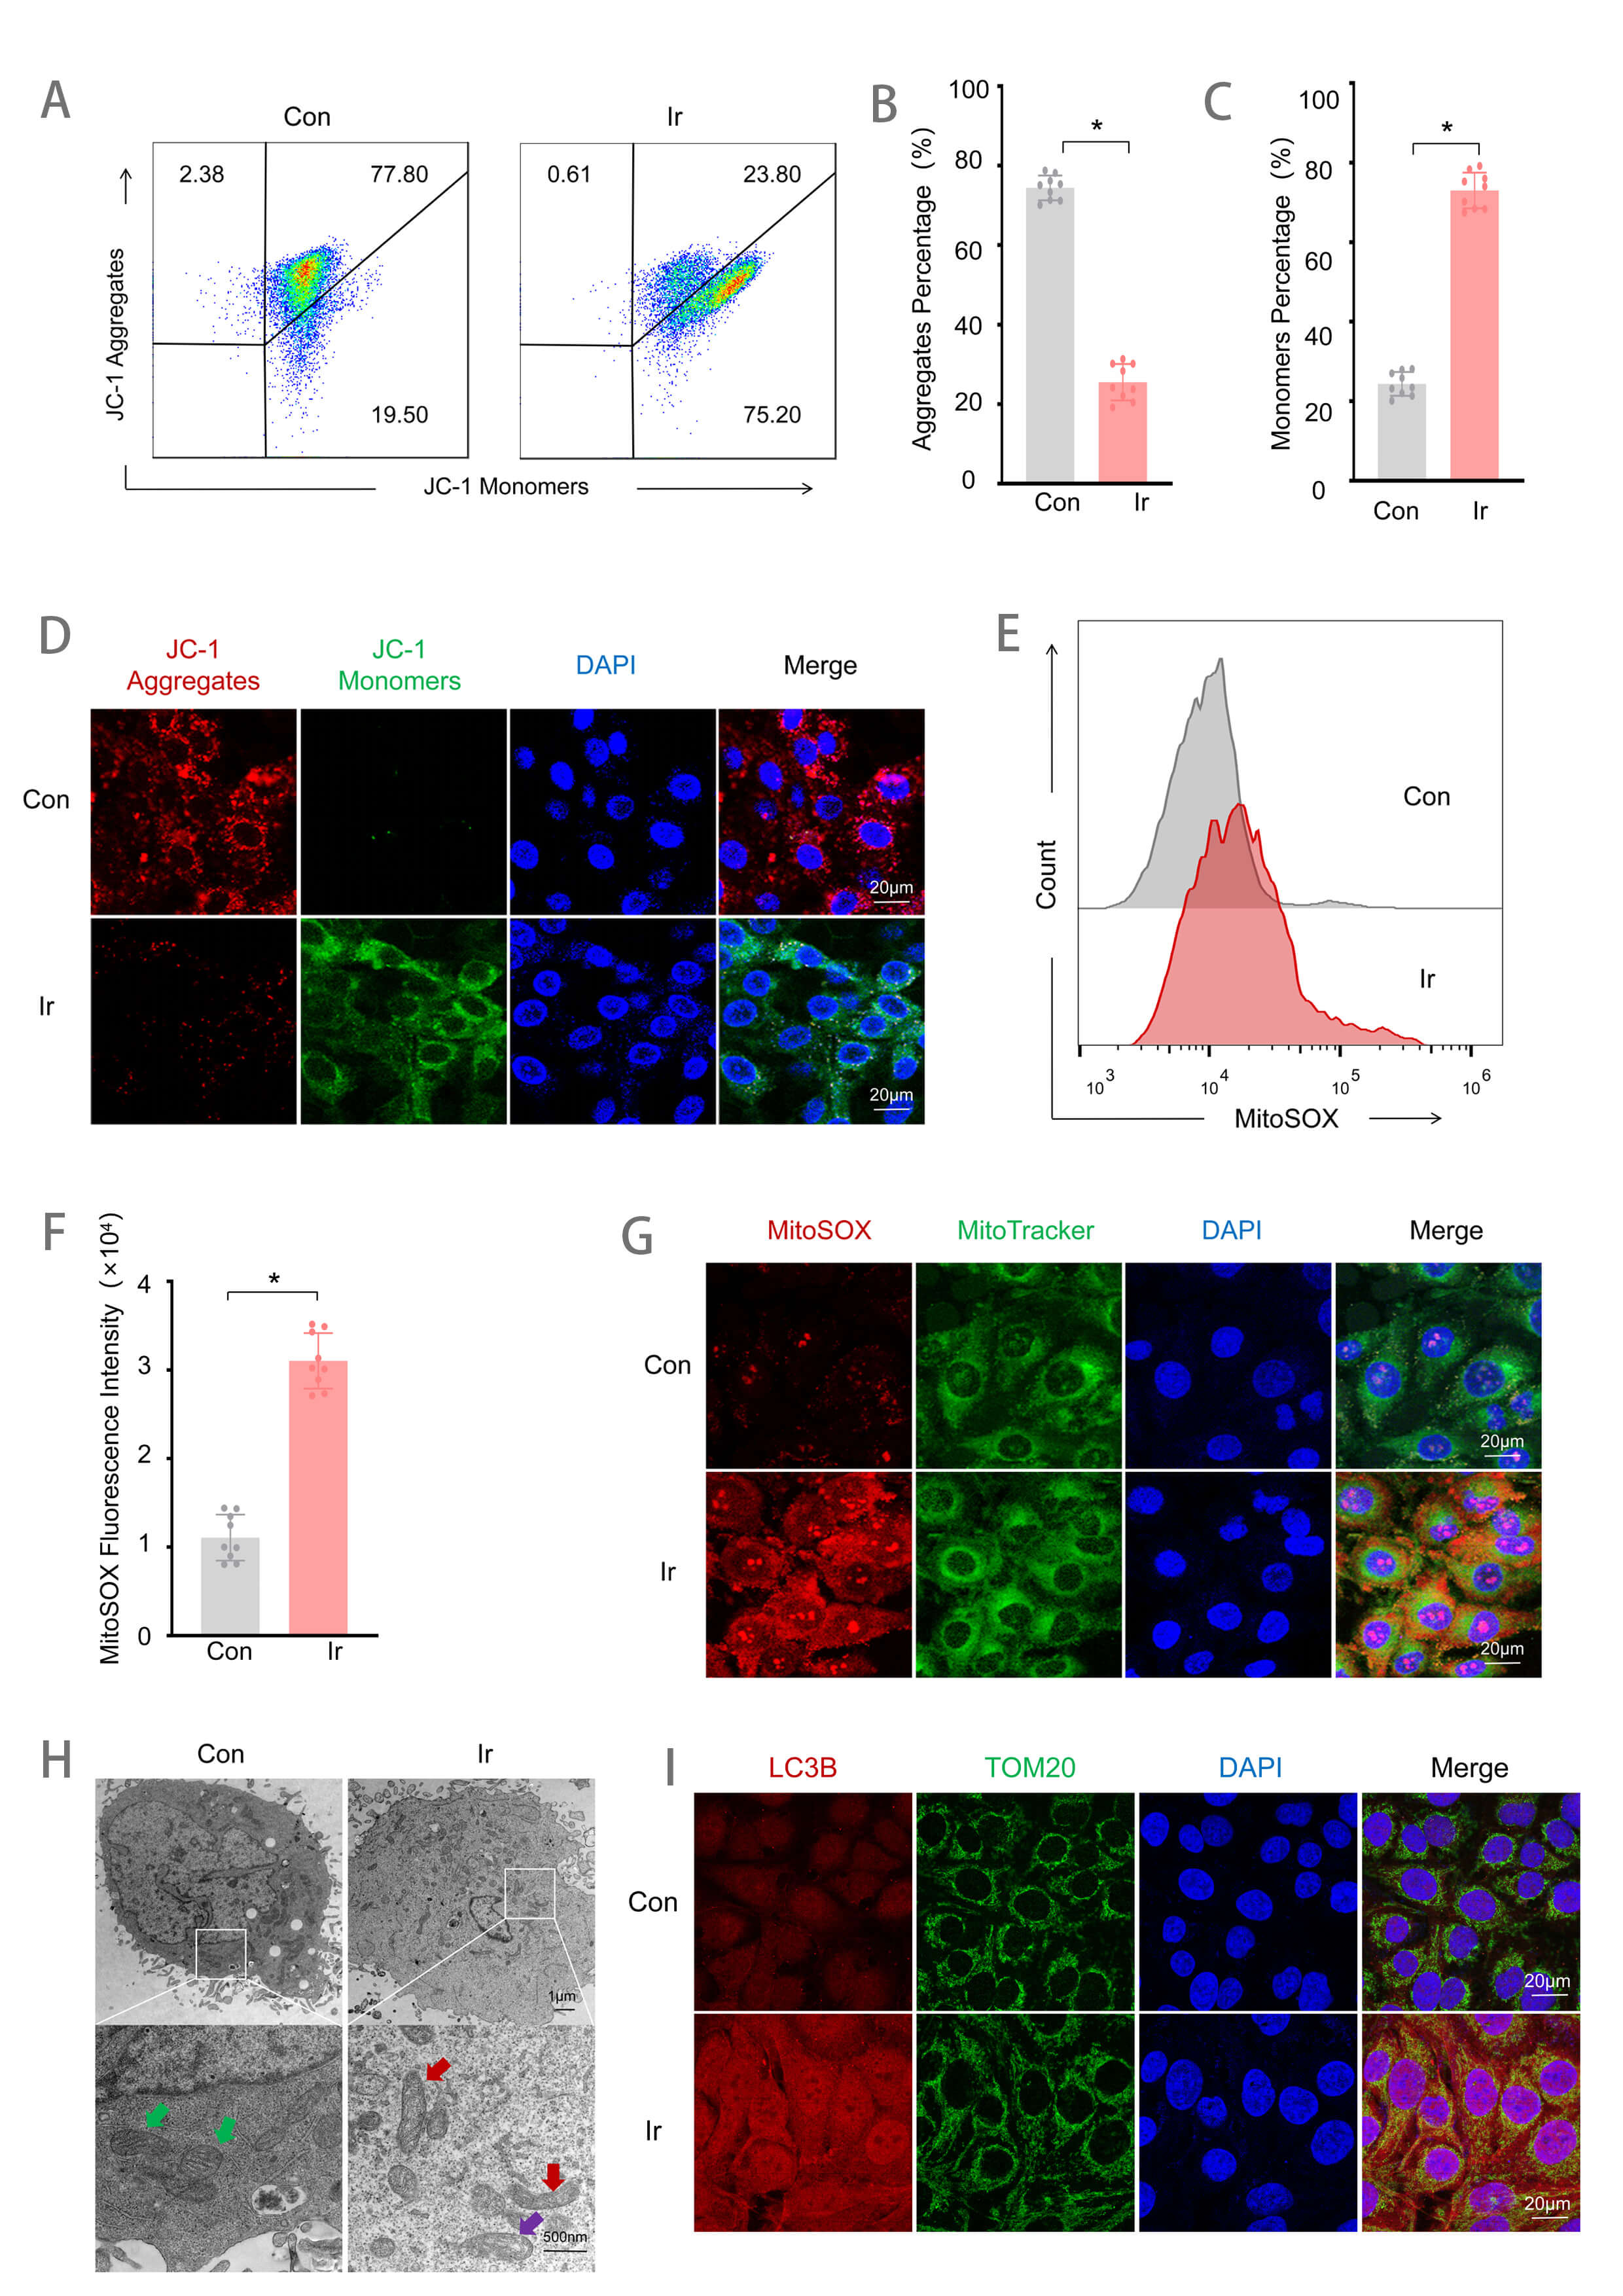 Fig. 2.
9 Gy irradiation induces mitochondrial injury at 72 h
post-exposure. (A) Flow cytometry detection of mitochondrial membrane potential.
(B) Quantitative analysis of the JC-1 aggregates proportion (n = 9). (C)
Quantitative analysis of the JC-1 monomers proportion (n = 9). (D) JC-1
fluorescence staining. Scale bar = 20 µm. (E) Flow cytometry detection of
MitoSOX fluorescence intensity. (F) Quantitative analysis of MitoSOX fluorescence
intensity (n = 9). (G) MitoSOX and MitoTracker co-localization fluorescence
staining. Scale bar = 20 µm. (H) Observation of cellular ultrastructure
under TEM, Green arrows: Normal mitochondria; Red arrows: Mitochondria with
disorganized, fragmented, or absent cristae; Purple arrows: Mitochondria with
swelling and vacuolization. Scale bar = 1 µm or 500 nm. (I) LC3B and TOM20
co-localization fluorescence imaging. Scale bar = 20 µm. Data are
represented as mean
To evaluate the protective effects of Tec against 9 Gy irradiation-induced
injury, HUVECs were divided into 5 experimental groups: the Con group, the Ir
group, and Ir groups treated with Tec at concentrations of 0.5, 1.0, and 2.0
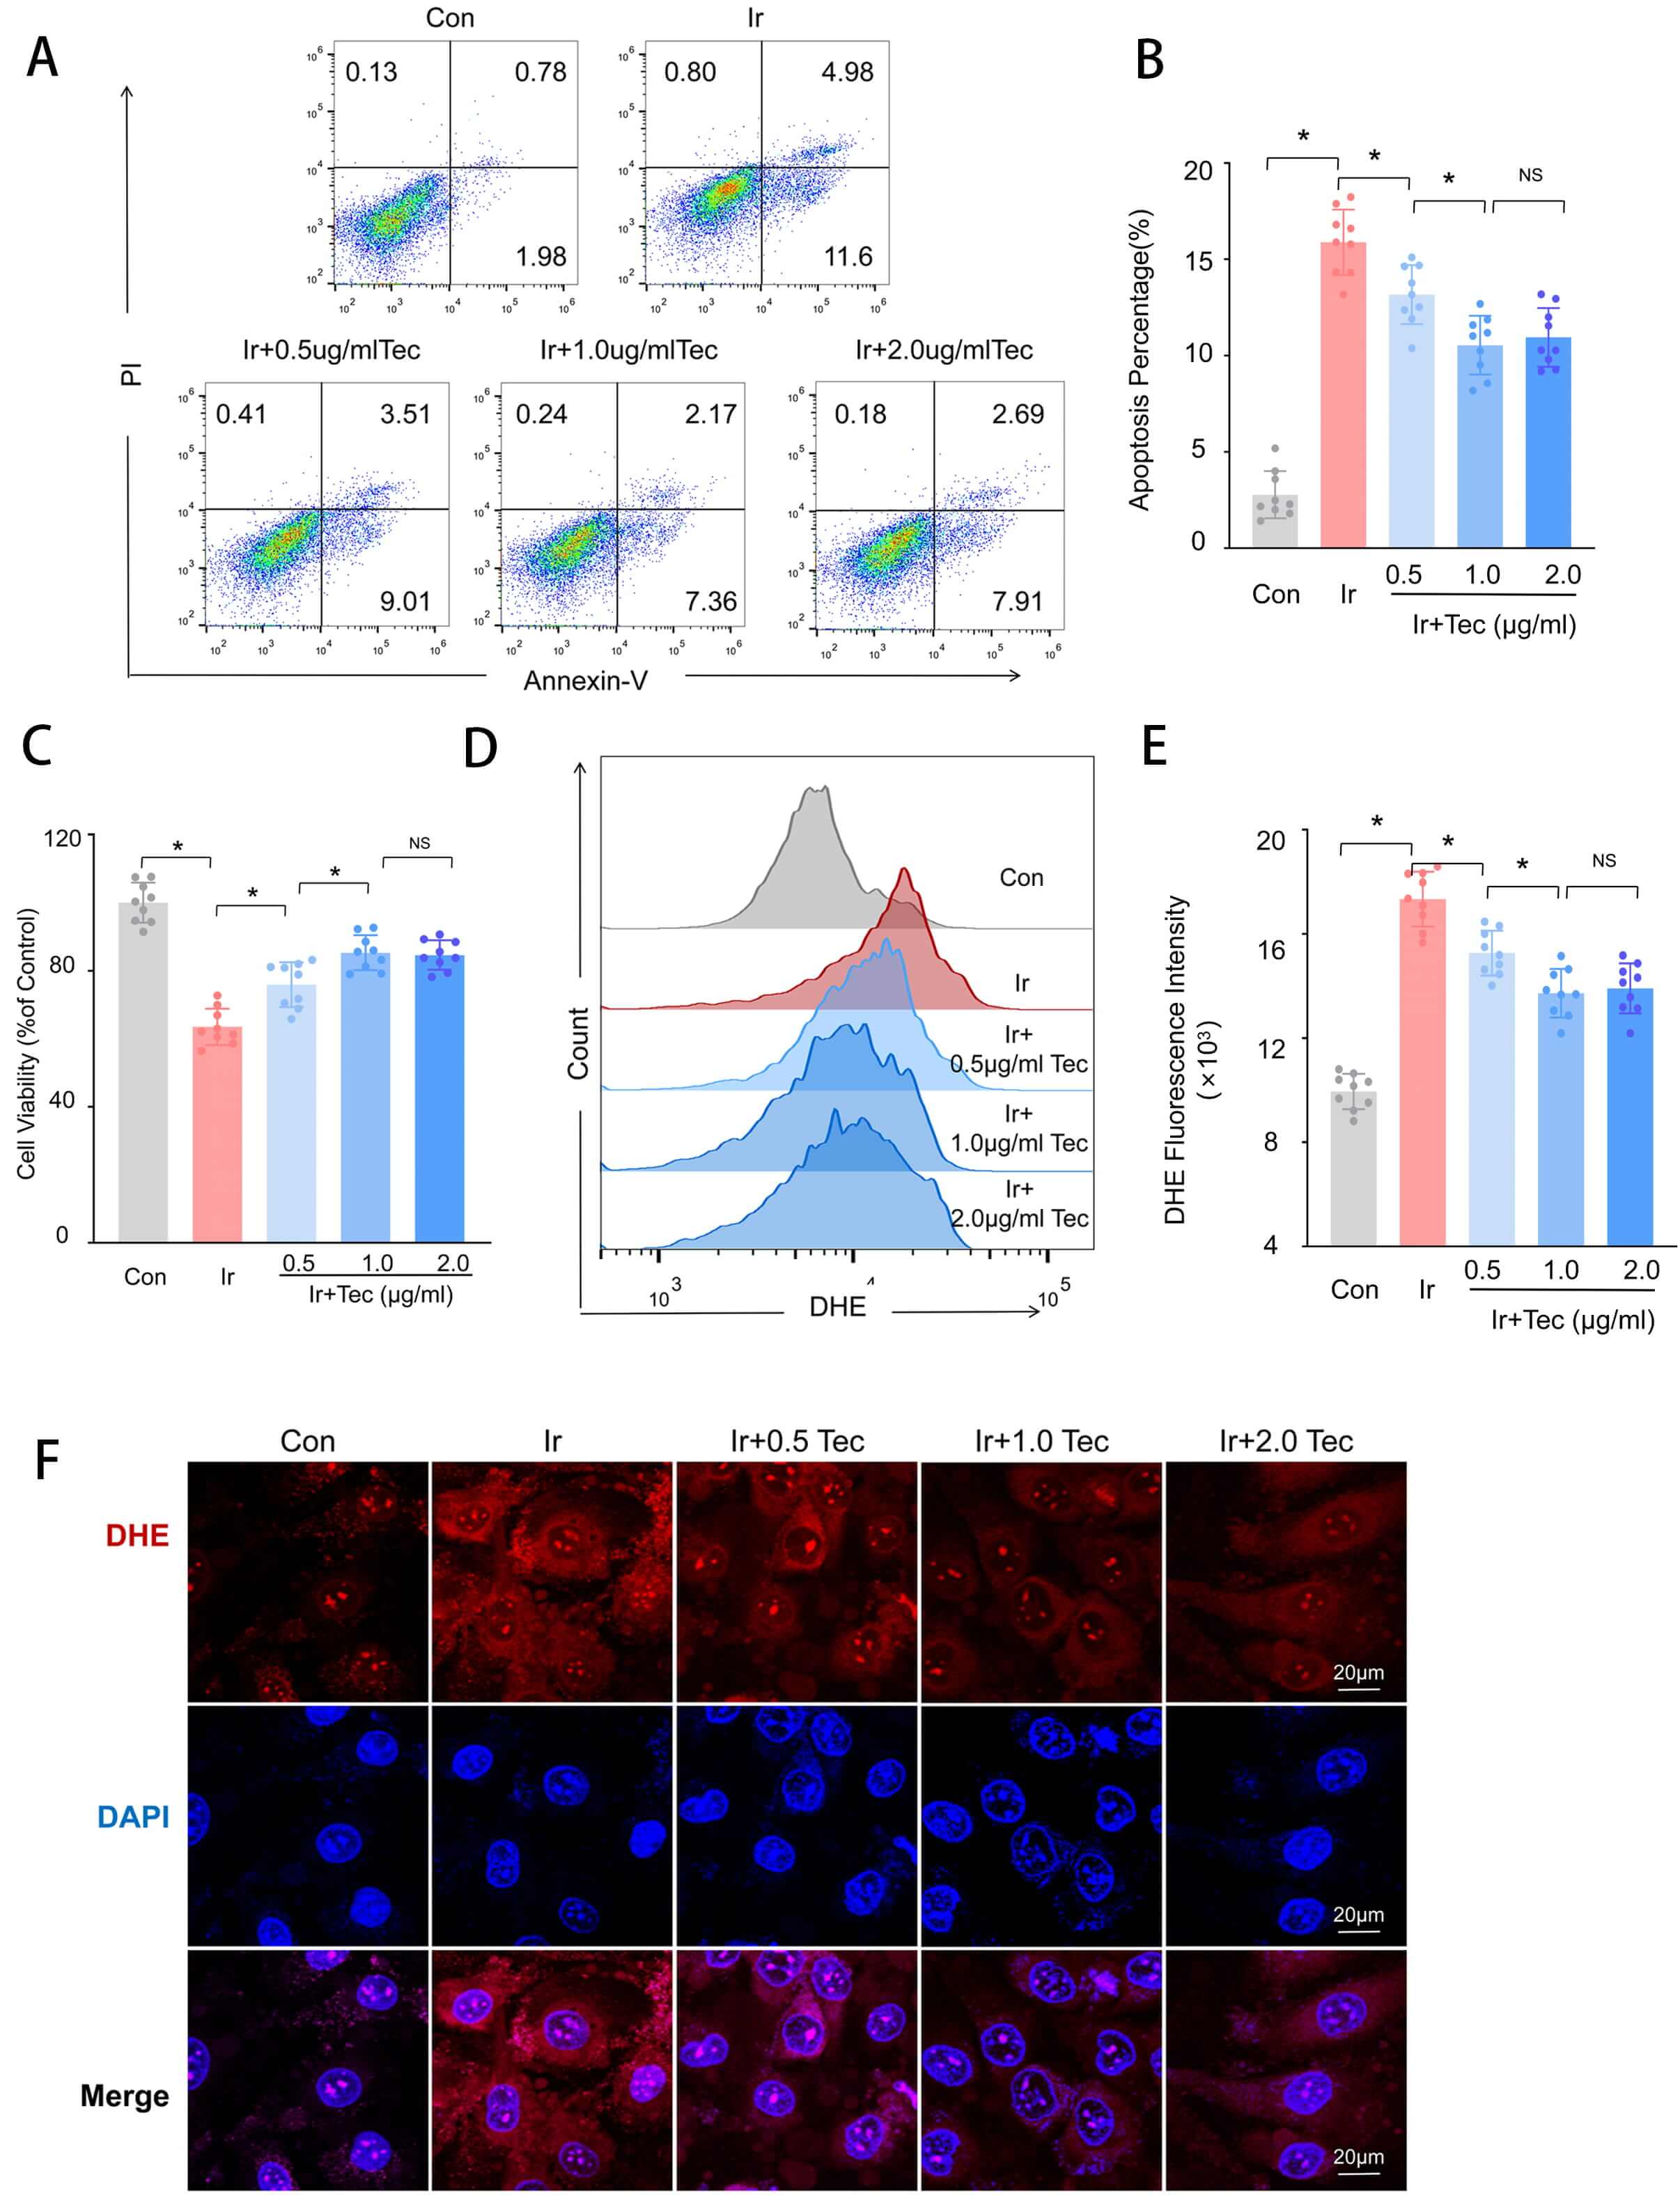
µg/mL (1.67, 3.33, and 6.66 µM). As shown in Fig. 3, Annexin V/PI
double staining revealed that the apoptotic rate was significantly increased in
the Ir group compared to the Con group (p
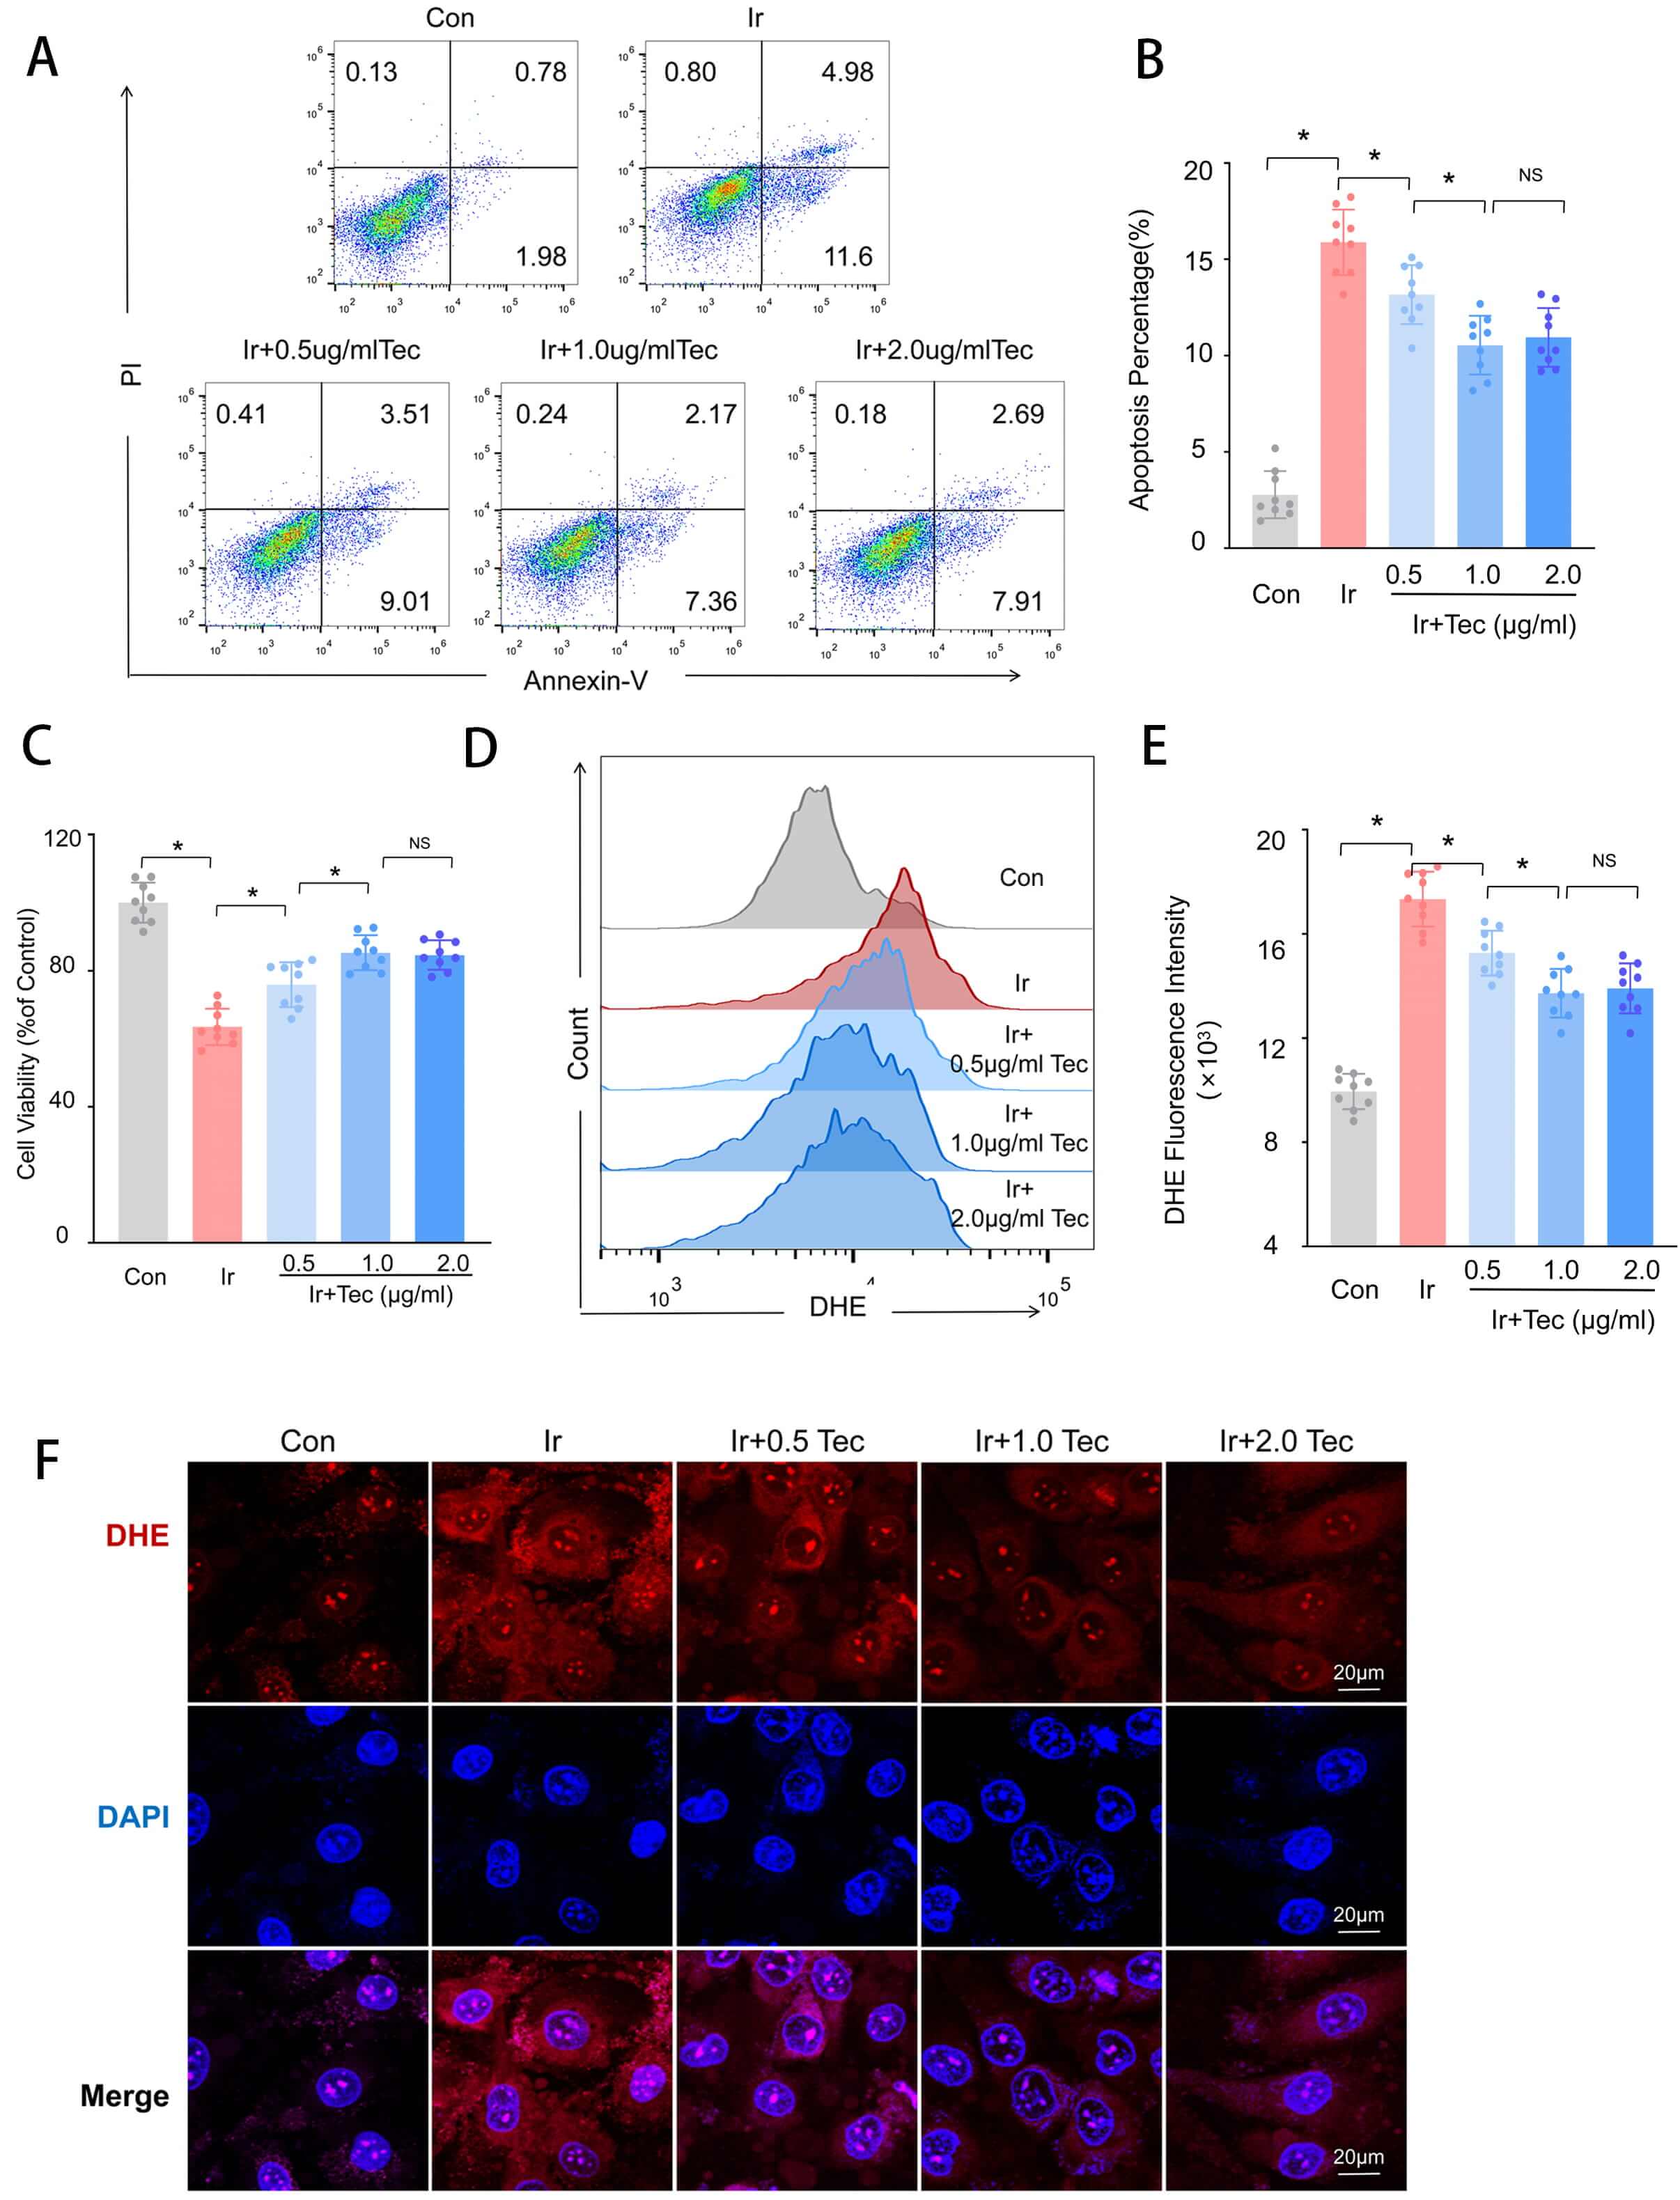 Fig. 3.
Tec attenuated 9 Gy irradiation-induced injury in HUVECs at 72 h
following irradiation exposure. (A) Cell apoptosis detected by Annexin V/PI
double staining. (B) Quantitative analysis of apoptotic rates (n = 9). (C) Cell
viability under treatment with different concentrations of Tec measured by the
CCK-8 assay (n = 9). (D) DHE fluorescence intensity analyzed by flow cytometry.
(E) Quantitative analysis of DHE fluorescence intensity (n = 9). (F) DHE
fluorescence staining. Scale bar = 20 µm. Data are represented as mean
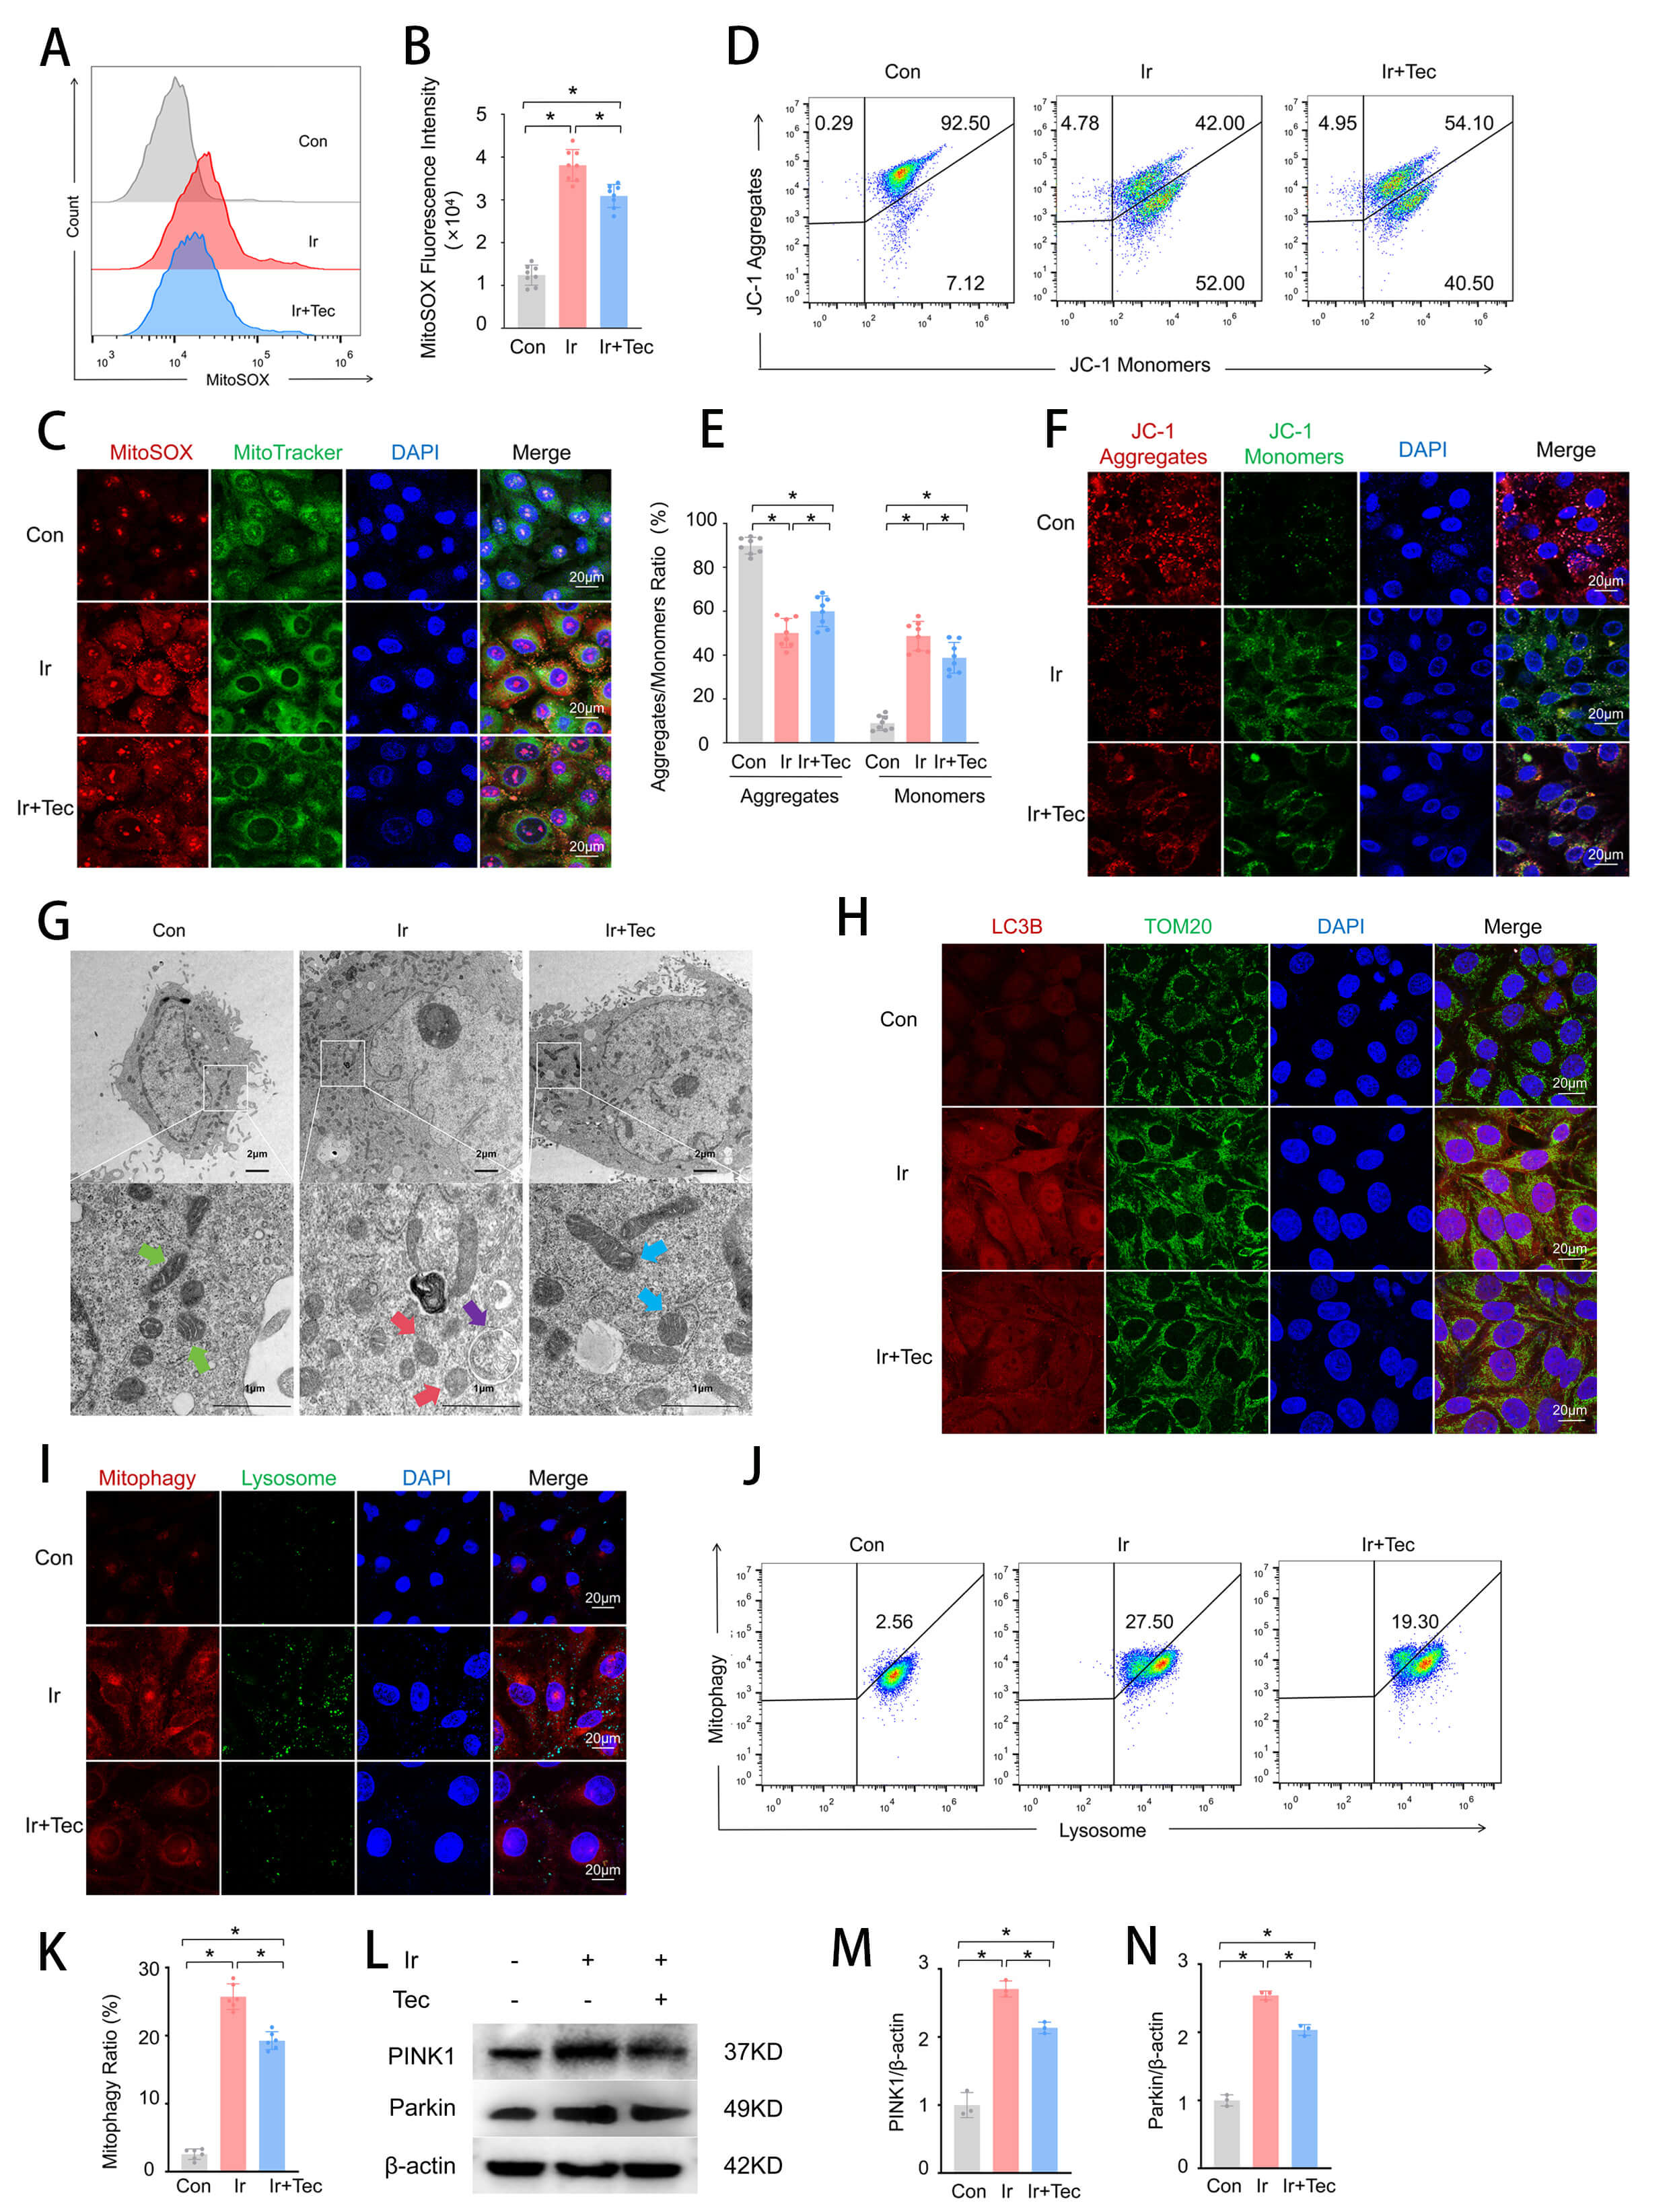
To further investigate the effect of Tec on mitochondrial function following 9 Gy irradiation, both mitochondrial function and morphology were assessed. Flow cytometric analysis of mitochondrial oxidative stress revealed that MitoSOX fluorescence intensity was significantly increased in the Ir group compared to the Con group, while Tec treatment markedly attenuated this elevation (Fig. 4A,B). Colocalization analysis of MitoSOX and MitoTracker further confirmed that red fluorescence (MitoSOX) was significantly enhanced in the Ir group relative to the Con group, accompanied by colocalization with green fluorescence (MitoTracker). In contrast, the Ir+Tec group exhibited markedly diminished red fluorescence and decreased colocalization with green fluorescence compared to the Ir group (Fig. 4C). Flow cytometric assessment of mitochondrial membrane potential demonstrated that irradiation induced depolarization, as evidenced by a significant reduction in the proportion of JC-1 aggregates in the Ir group relative to the Con group. Conversely, Tec treatment significantly increased the proportion of JC-1 aggregates compared to the Ir group (Fig. 4D,E). JC-1 staining further confirmed that red fluorescence (JC-1 aggregates) was markedly diminished in the Ir group compared to the Con group. Conversely, the Ir+Tec group exhibited significantly enhanced red fluorescence relative to the Ir group, while green fluorescence (JC-1 monomers) displayed an opposite trend (Fig. 4F). TEM revealed distinct ultrastructural alterations in mitochondria across experimental groups (Fig. 4G). In the Con group, mitochondria exhibited intact morphology with well-defined cristae structures (green arrows). In contrast, the Ir group displayed marked pathological changes, characterized by disorganized, fragmented, or absent cristae (red arrows). Notably, mitophagic vacuoles were observed in the Ir group (purple arrows), indicating irradiation-induced activation of mitophagy. Importantly, Tec treatment ameliorated these irradiation-induced mitochondrial injuries, partially restoring cristae integrity and promoting a more regular mitochondrial morphology (blue arrows) (Fig. 4G). Colocalization analysis of LC3B and TOM20 revealed that mitophagic activity was significantly enhanced in the Ir group compared to the Con group, as evidenced by markedly increased red fluorescence (LC3B) and its colocalization with green fluorescence (TOM20). In contrast, Tec treatment significantly attenuated red fluorescence relative to the Ir group (Fig. 4H). Dual staining of Mitophagy and Lysosomes was performed to assess mitophagic activity. Fluorescence staining revealed that red fluorescence (Mitophagy) was markedly increased in the Ir group compared to the Con group, accompanied by green fluorescence (Lysosomes), indicating enhanced mitophagic activity. In contrast, red fluorescence was significantly attenuated in the Ir+Tec group relative to the Ir group (Fig. 4I). Flow cytometric analysis of the mitophagy rate revealed that the proportion of mitophagy-positive cells was significantly increased in the Ir group compared to the Con group, while Tec treatment markedly attenuated this elevation (Fig. 4J,K). Western blot analysis revealed that protein expression levels of PINK1 and Parkin were significantly increased in the Ir group compared to the Con group, while Tec treatment attenuated this elevation (Fig. 4L–N).
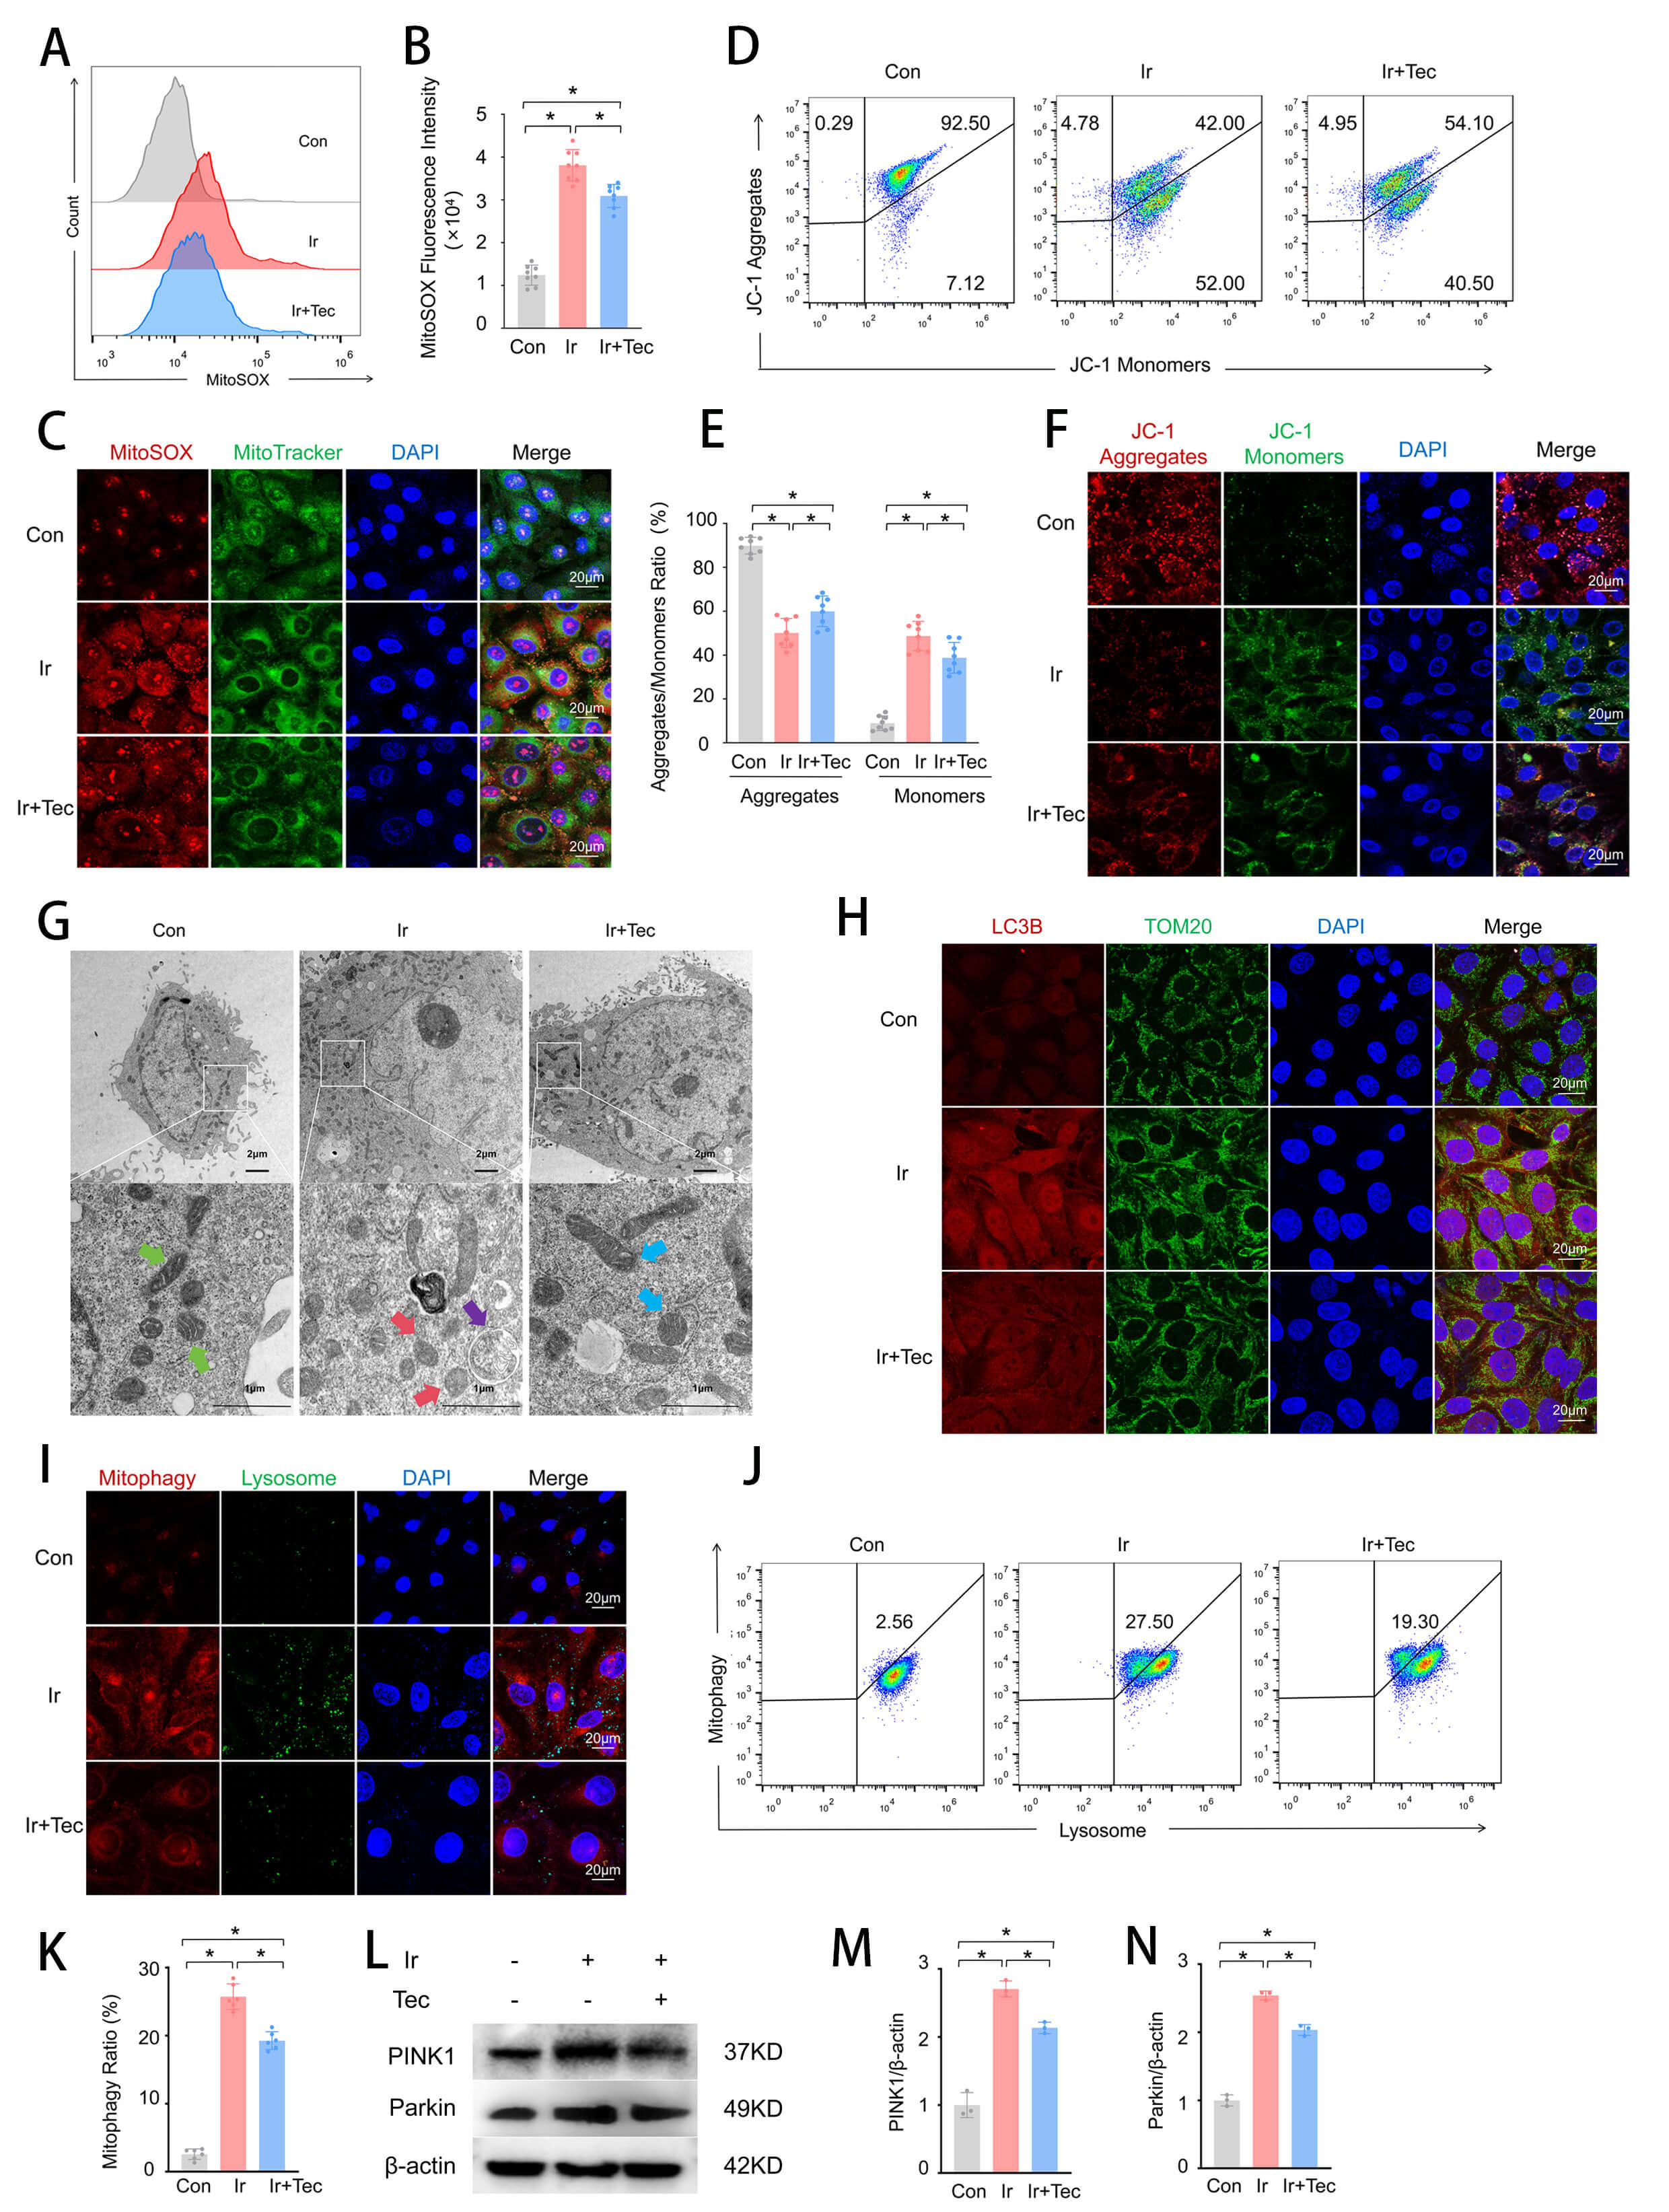 Fig. 4.
Tec protects mitochondria from injury induced by 9 Gy
irradiation at 72 h post-exposure. (A) Representative flow cytometry histograms
of MitoSOX fluorescence intensity for mitochondrial oxidative stress assessment.
(B) Quantitative analysis of MitoSOX fluorescence intensity (n = 8). (C)
Representative confocal images of MitoSOX (red) and MitoTracker (green)
colocalization. Scale bar = 20 µm. (D) Representative flow cytometry dot
plots of JC-1 staining for mitochondrial membrane potential. (E) Quantitative
analysis of the JC-1 aggregate/monomer ratio (n = 8). (F) Representative images
of JC-1 fluorescence staining (red: aggregates, green: monomers). Scale bar = 20
µm. (G) Representative TEM images of mitochondrial ultrastructure. Scale
bar = 2 µm or 1 µm. Green arrows, normal mitochondria; red arrows, pathologically altered mitochondria; purple arrows, mitophagic vacuoles; blue arrows, mitochondria with improved pathological changes. (H) Representative immunofluorescence images of
LC3B (red) and TOM20 (green) colocalization. Scale bar = 20 µm. (I)
Representative confocal images of dual staining for Mitophagy (red) and Lysosomes
(green). Scale bar = 20 µm. (J) Representative flow cytometry histograms of
mitophagy rate. (K) Quantitative analysis of mitophagy rate (n = 6). (L) Western
blot analysis of PINK1 and Parkin protein expression. (M) Quantitative analysis
of PINK1 expression levels normalized to
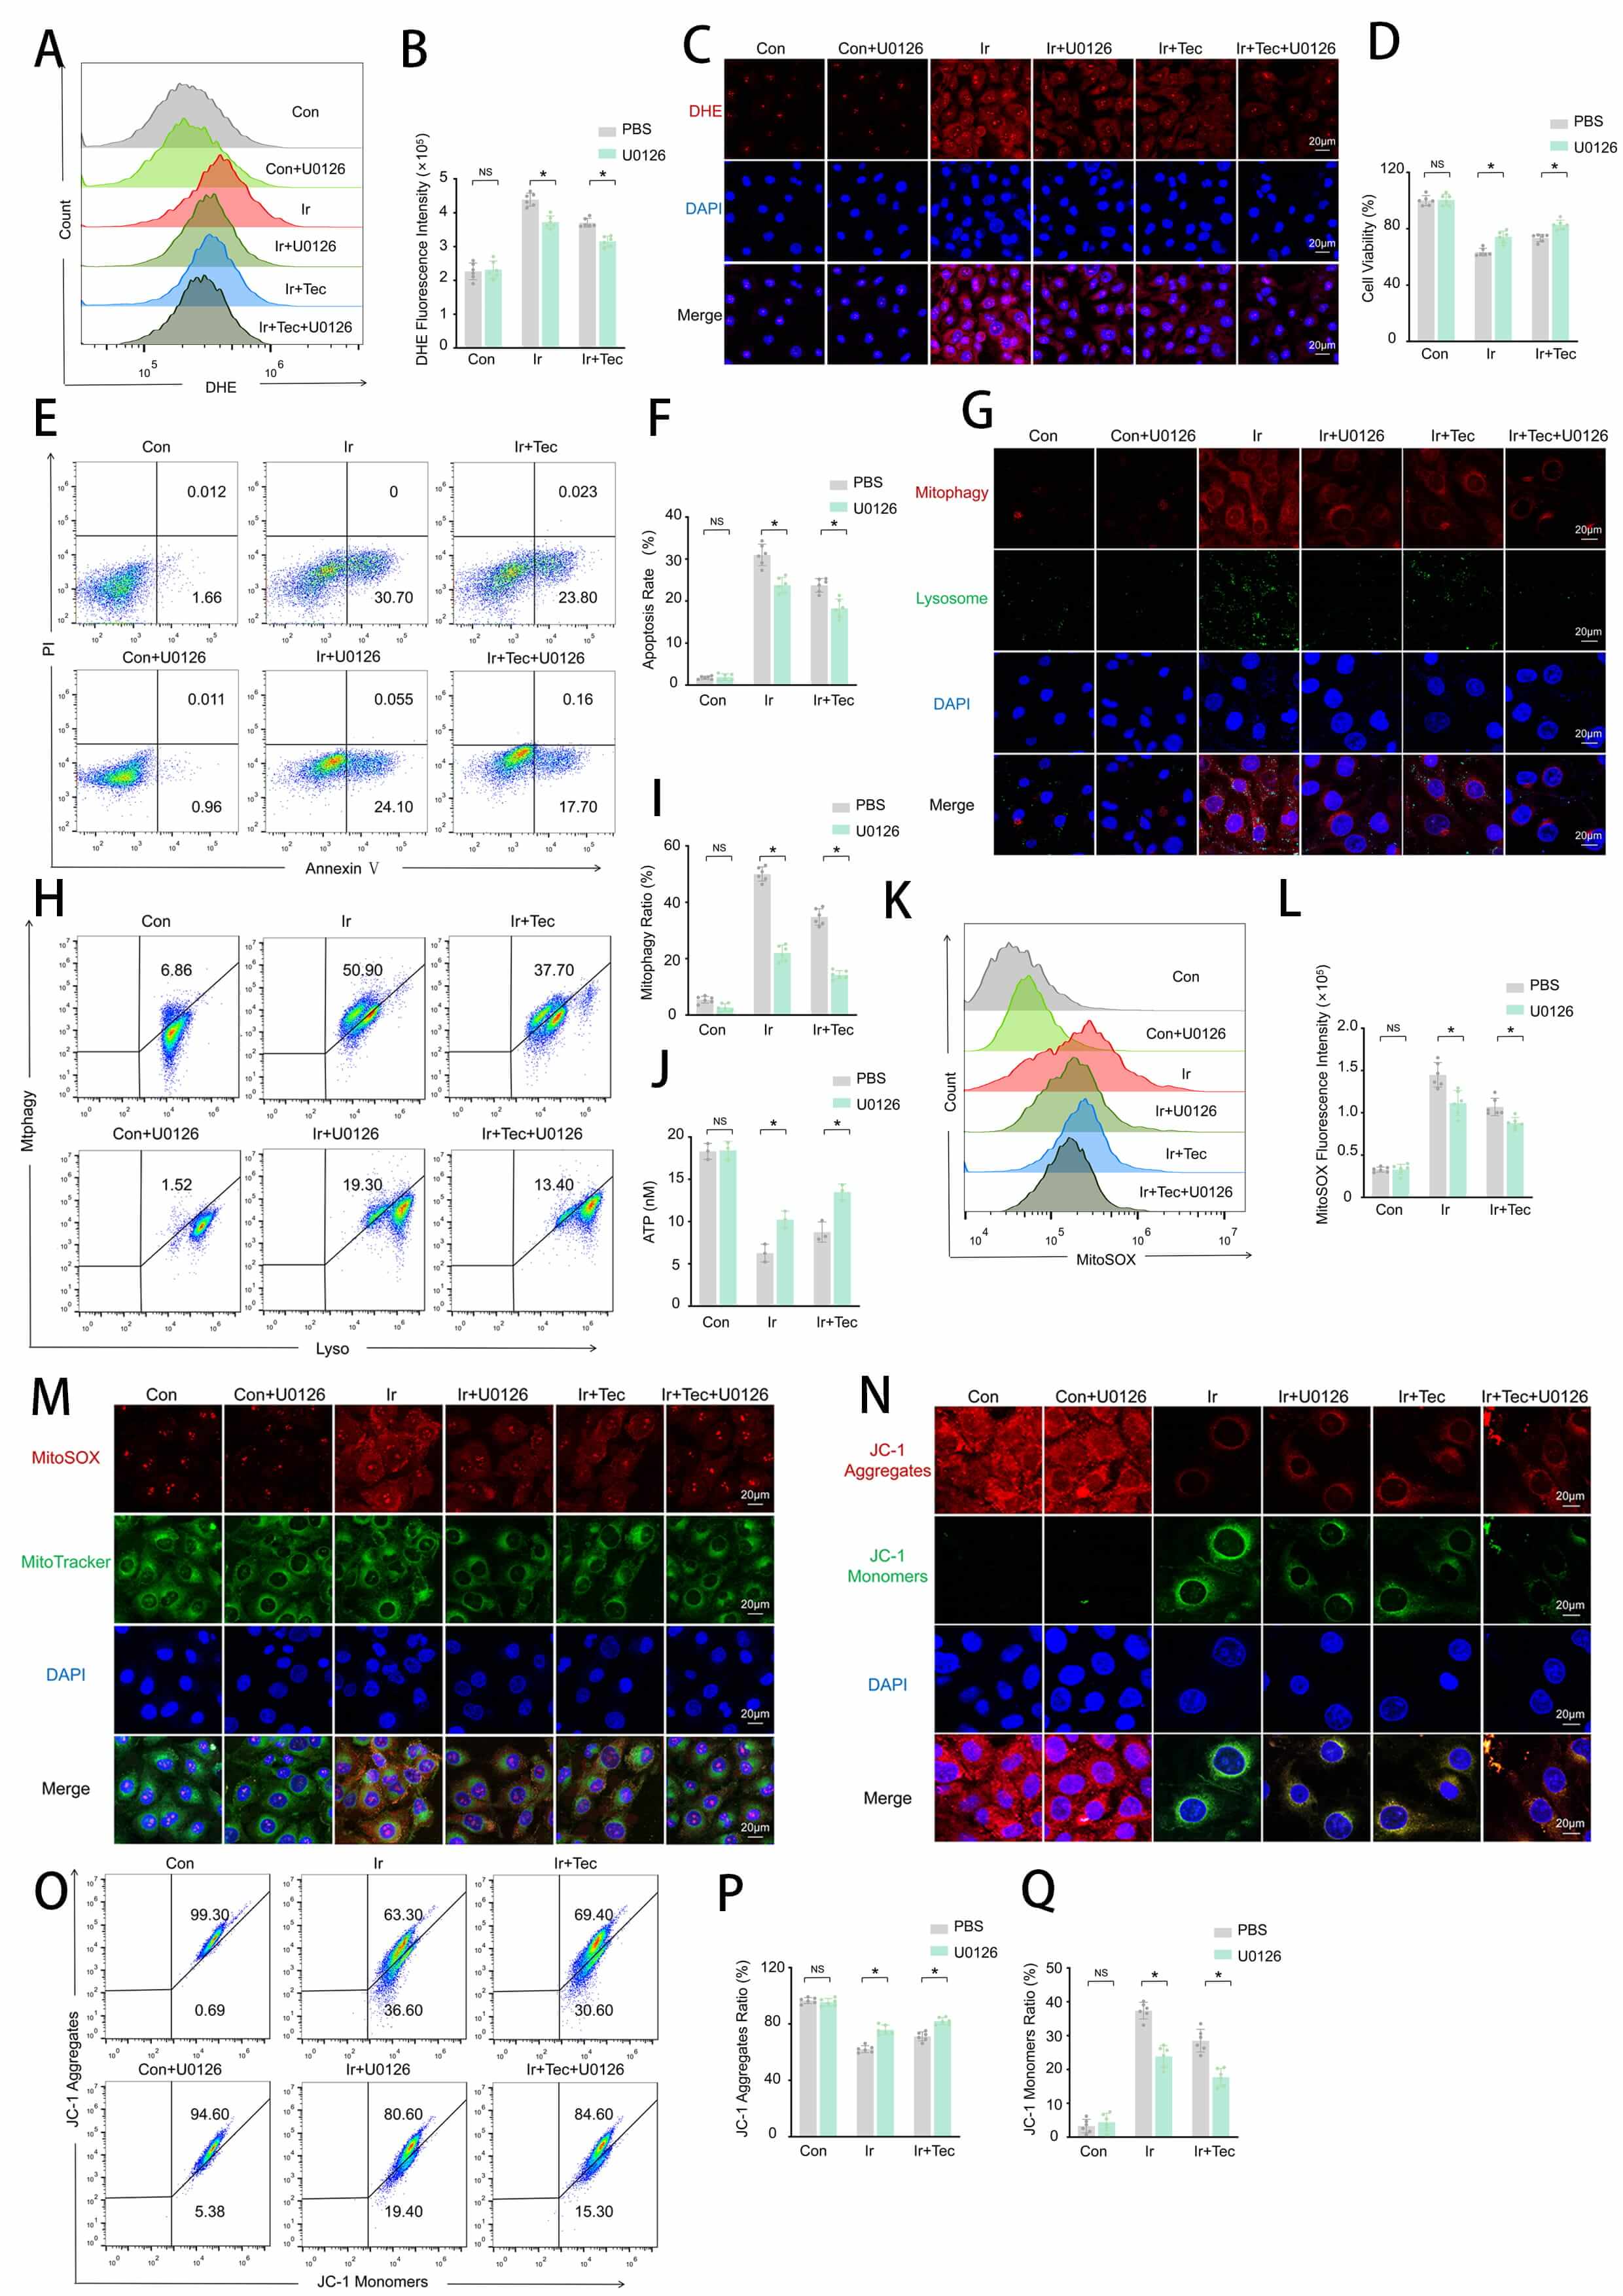
To investigate whether the radioprotective effect of Tec against 9 Gy irradiation is mediated through suppression of mitophagy activation. HUVECs were treated with the mitophagy inhibitor U0126 following irradiation exposure, and the results are shown in Fig. 5. Flow cytometric analysis revealed that irradiation significantly increased DHE fluorescence intensity, which was markedly attenuated by both Tec and U0126 treatment, with the combination of Tec and U0126 (Ir+Tec+U0126) exhibiting the lowest DHE fluorescence among irradiated groups (Fig. 5A,B). DHE fluorescence staining further confirmed that red fluorescence (DHE) was significantly attenuated by both Tec and U0126 treatment compared to the Ir group, with the Ir+Tec+U0126 group displaying the faintest red fluorescence among all irradiated groups (Fig. 5C). CCK-8 assays demonstrated that both Tec and U0126 significantly restored irradiation-induced reduction in cell viability, with the Ir+Tec+U0126 group exhibiting the highest cell viability among all irradiated groups (Fig. 5D). Flow cytometric analysis revealed that both Tec and U0126 treatment suppressed the irradiation-induced increase in apoptotic rate, with the Ir+Tec+U0126 group exhibiting the lowest apoptosis levels among all irradiated groups (Fig. 5E,F). Colocalization analysis of mitophagy (red) and lysosomes (green) revealed that the red fluorescence signal was significantly enhanced following irradiation, while both Tec and U0126 treatment attenuated this enhancement, with the most pronounced reduction observed in the Ir+Tec+U0126 group (Fig. 5G). Flow cytometric analysis further confirmed that both Tec and U0126 significantly reduced the proportion of mitophagy-positive cells compared to the Ir group, with the Ir+Tec+U0126 group exhibiting the lowest percentage among all irradiated groups (Fig. 5H,I). ATP assays showed that irradiation-induced ATP depletion was reversed by both Tec and U0126, with the combination treatment maintaining the highest ATP levels among all irradiated groups (Fig. 5J). MitoSOX fluorescence analysis revealed that irradiation significantly increased MitoSOX fluorescence intensity compared to the Con group, while both Tec and U0126 treatment attenuated this effect, with the Ir+Tec+U0126 group exhibiting the lowest levels among all irradiated groups (Fig. 5K,L). MitoSOX and MitoTracker colocalization further confirmed that both Tec and U0126 significantly reduced red fluorescence (MitoSOX) intensity compared to the Ir group, with the Ir+Tec+U0126 group exhibiting the faintest red fluorescence among all irradiated groups (Fig. 5M). JC-1 staining revealed that irradiation-induced loss of mitochondrial membrane potential, characterized by decreased red fluorescence (JC-1 aggregates) and increased green fluorescence (JC-1 monomers), was reversed by treatment with both Tec and U0126, with the combination group exhibiting the highest red fluorescence (Fig. 5N). Flow cytometric quantification confirmed that U0126, similar to Tec, significantly increased the proportion of JC-1 aggregates following irradiation, with the Ir+Tec+U0126 group exhibiting the highest JC-1 aggregate proportion among all irradiated groups (Fig. 5O–Q).
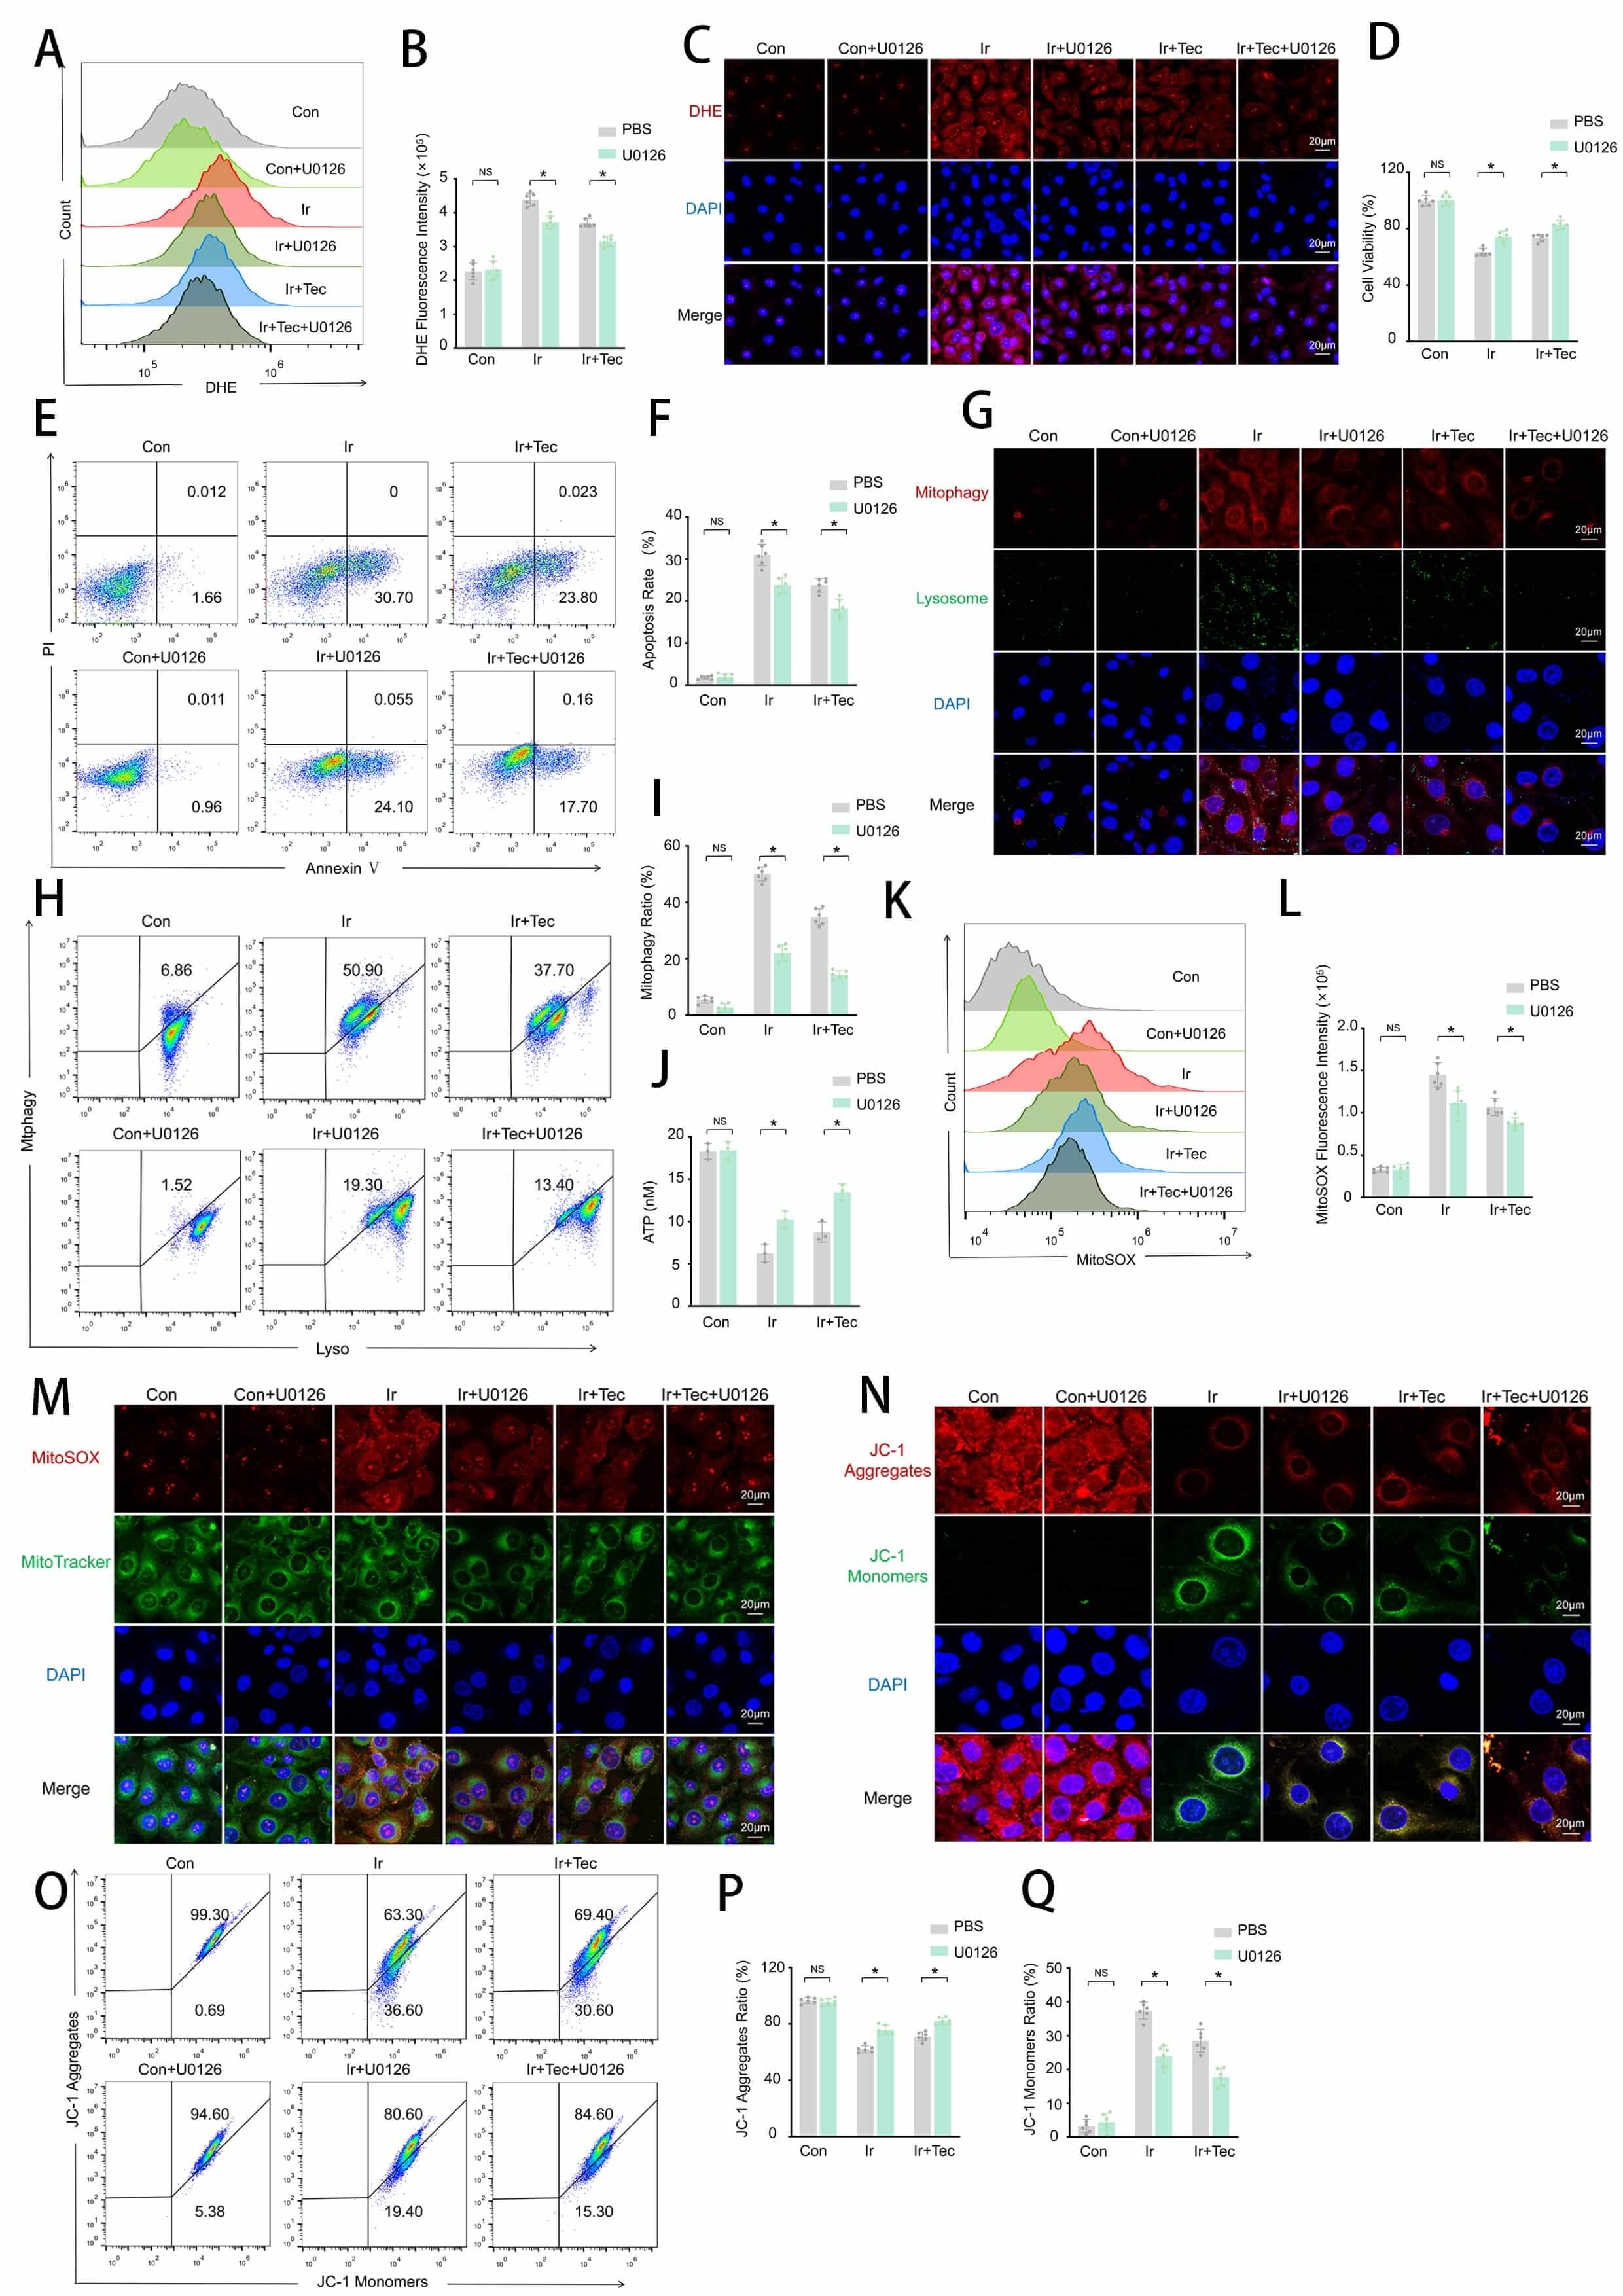 Fig. 5.
Tec protects HUVECs from 9 Gy irradiation-induced injury at 72 h
post-exposure by inhibiting mitophagy. (A) Representative flow cytometry
histograms of DHE fluorescence intensity. (B) Quantitative analysis of DHE
fluorescence intensity (n = 6). (C) Representative images of DHE fluorescence
staining (red). Scale bar = 20 µm. (D) Cell viability assessed by CCK-8
assay. (E) Representative flow cytometry plots of Annexin V/PI staining for
apoptosis detection. (F) Quantitative analysis of apoptotic rates (n = 6). (G)
Representative confocal images of dual staining for Mitophagy (red) and Lysosomes
(green). Scale bar = 20 µm. (H) Flow cytometric analysis of mitophagy rate. (I) Quantitative analysis of mitophagy rate (n = 6). (J) ATP
levels measured by ATP assay. (K) Representative flow cytometry histograms of
MitoSOX fluorescence intensity. (L) Quantitative analysis of MitoSOX fluorescence
intensity (n = 6). (M) Representative confocal images of MitoSOX (red) and
MitoTracker (green) colocalization. Scale bar = 20 µm. (N) Representative
images of JC-1 fluorescence staining (red: aggregates, green: monomers). Scale
bar = 20 µm. (O) Representative flow cytometry dot plots of JC-1 staining
for mitochondrial membrane potential. (P) Quantitative analysis of JC-1
aggregates proportion (n = 6). (Q) Quantitative analysis of JC-1 monomers
proportion (n = 6). Data are presented as mean
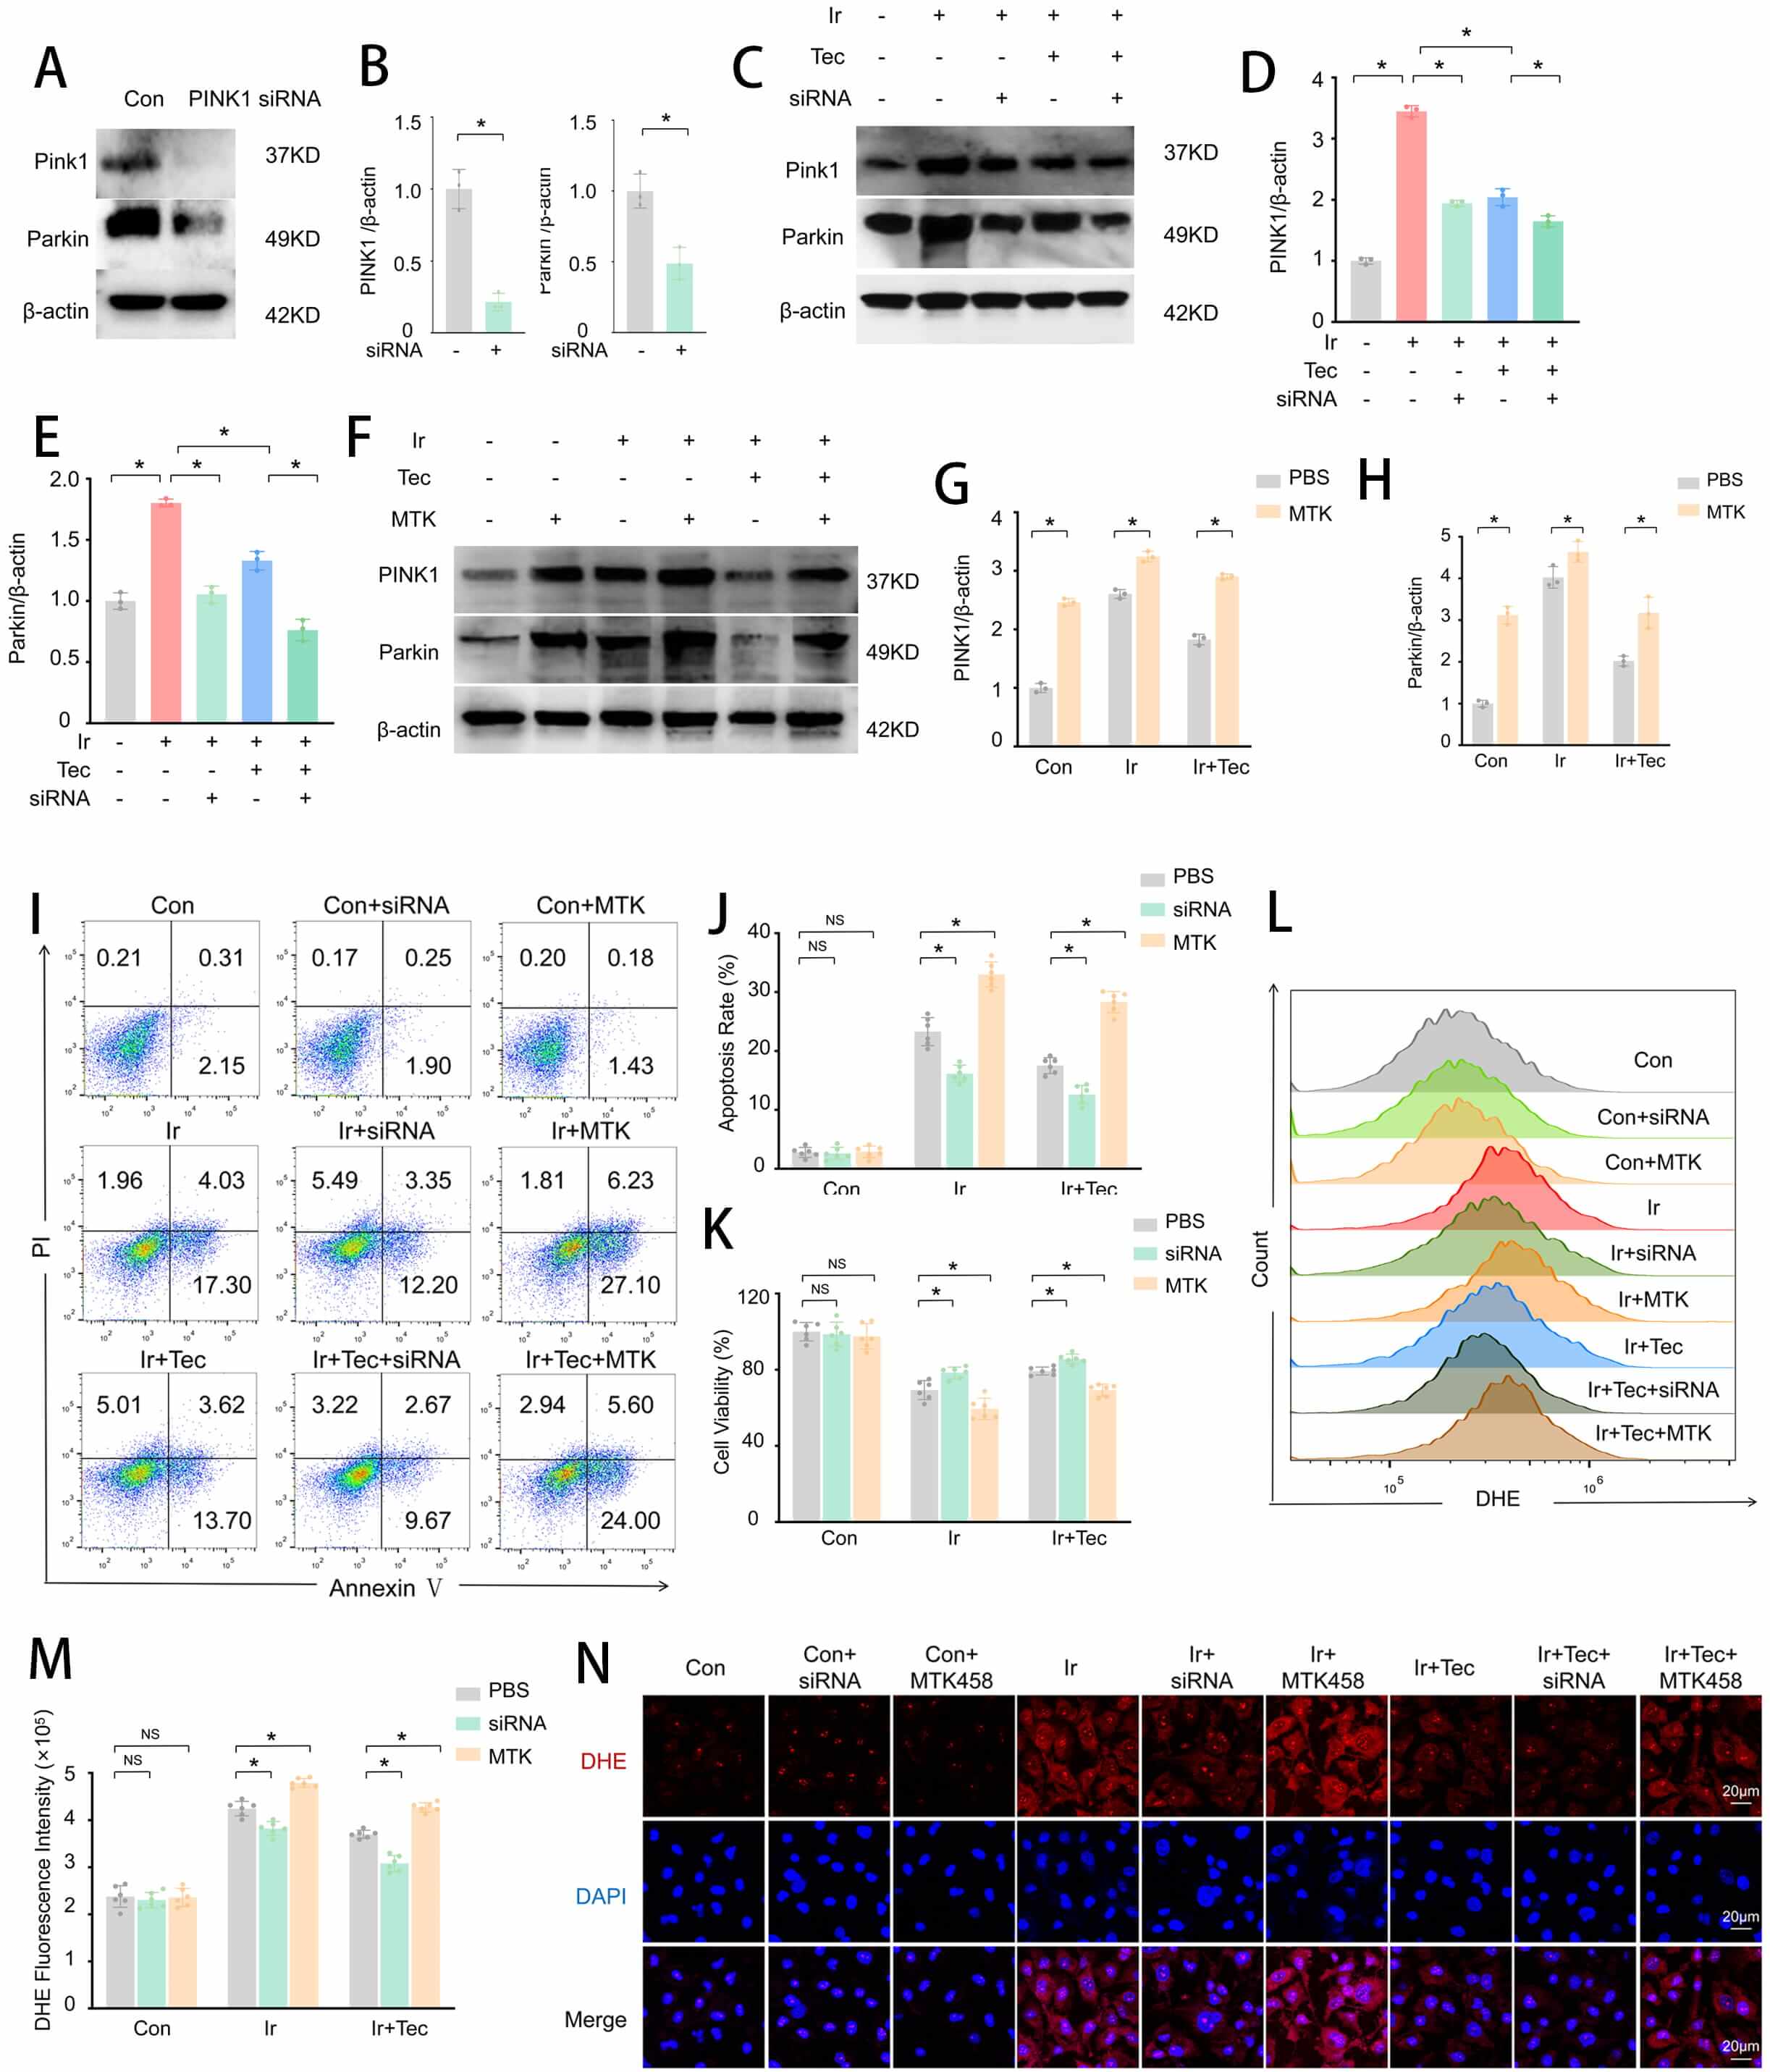
To further explore whether Tec protects HUVECs against 9 Gy irradiation-induced injury by regulating mitophagy, we examined protein expression levels by Western blotting, along with apoptosis and oxidative stress levels. Western blot analysis confirmed that PINK1 expression was suppressed by PINK1 siRNA (Fig. 6A–E), while MTK458 significantly upregulated PINK1 expression (Fig. 6F–H). Flow cytometric analysis of apoptosis revealed that the apoptotic rate was significantly increased in the Ir group compared to the Con group, whereas Tec treatment markedly reduced this elevation. Notably, inhibition of PINK1 expression (Ir+Tec+siRNA) further decreased the apoptotic rate relative to the Ir+Tec group, while overexpression of PINK1 (Ir+Tec+MTK) completely abolished the protective effect of Tec, resulting in a significantly increased apoptotic rate (Fig. 6I,J). CCK-8 assays demonstrated that Tec significantly enhanced cell viability following irradiation-induced injury, an effect further potentiated by PINK1 inhibition. Conversely, PINK1 overexpression abrogated the protective effect of Tec, as evidenced by a marked reduction in cell viability (Fig. 6K). Flow cytometric analysis of oxidative stress revealed that DHE fluorescence intensity was significantly increased in the Ir group compared to the Con group, while Tec treatment attenuated this increase. Relative to the Ir+Tec group, inhibition of PINK1 expression further reduced DHE fluorescence intensity, whereas PINK1 overexpression significantly exacerbated oxidative stress levels, as evidenced by enhanced DHE fluorescence (Fig. 6L,M). DHE fluorescence staining further confirmed that red fluorescence (DHE) was markedly diminished in the Ir+Tec group compared to the Ir group. Relative to the Ir+Tec group, inhibition of PINK1 expression further attenuated the red fluorescence signal, while PINK1 overexpression completely abolished the protective effect of Tec, resulting in enhanced red fluorescence (Fig. 6N). Collectively, these findings demonstrate that PINK1 plays a critical role in mediating the radioprotective effects of Tec in HUVECs.
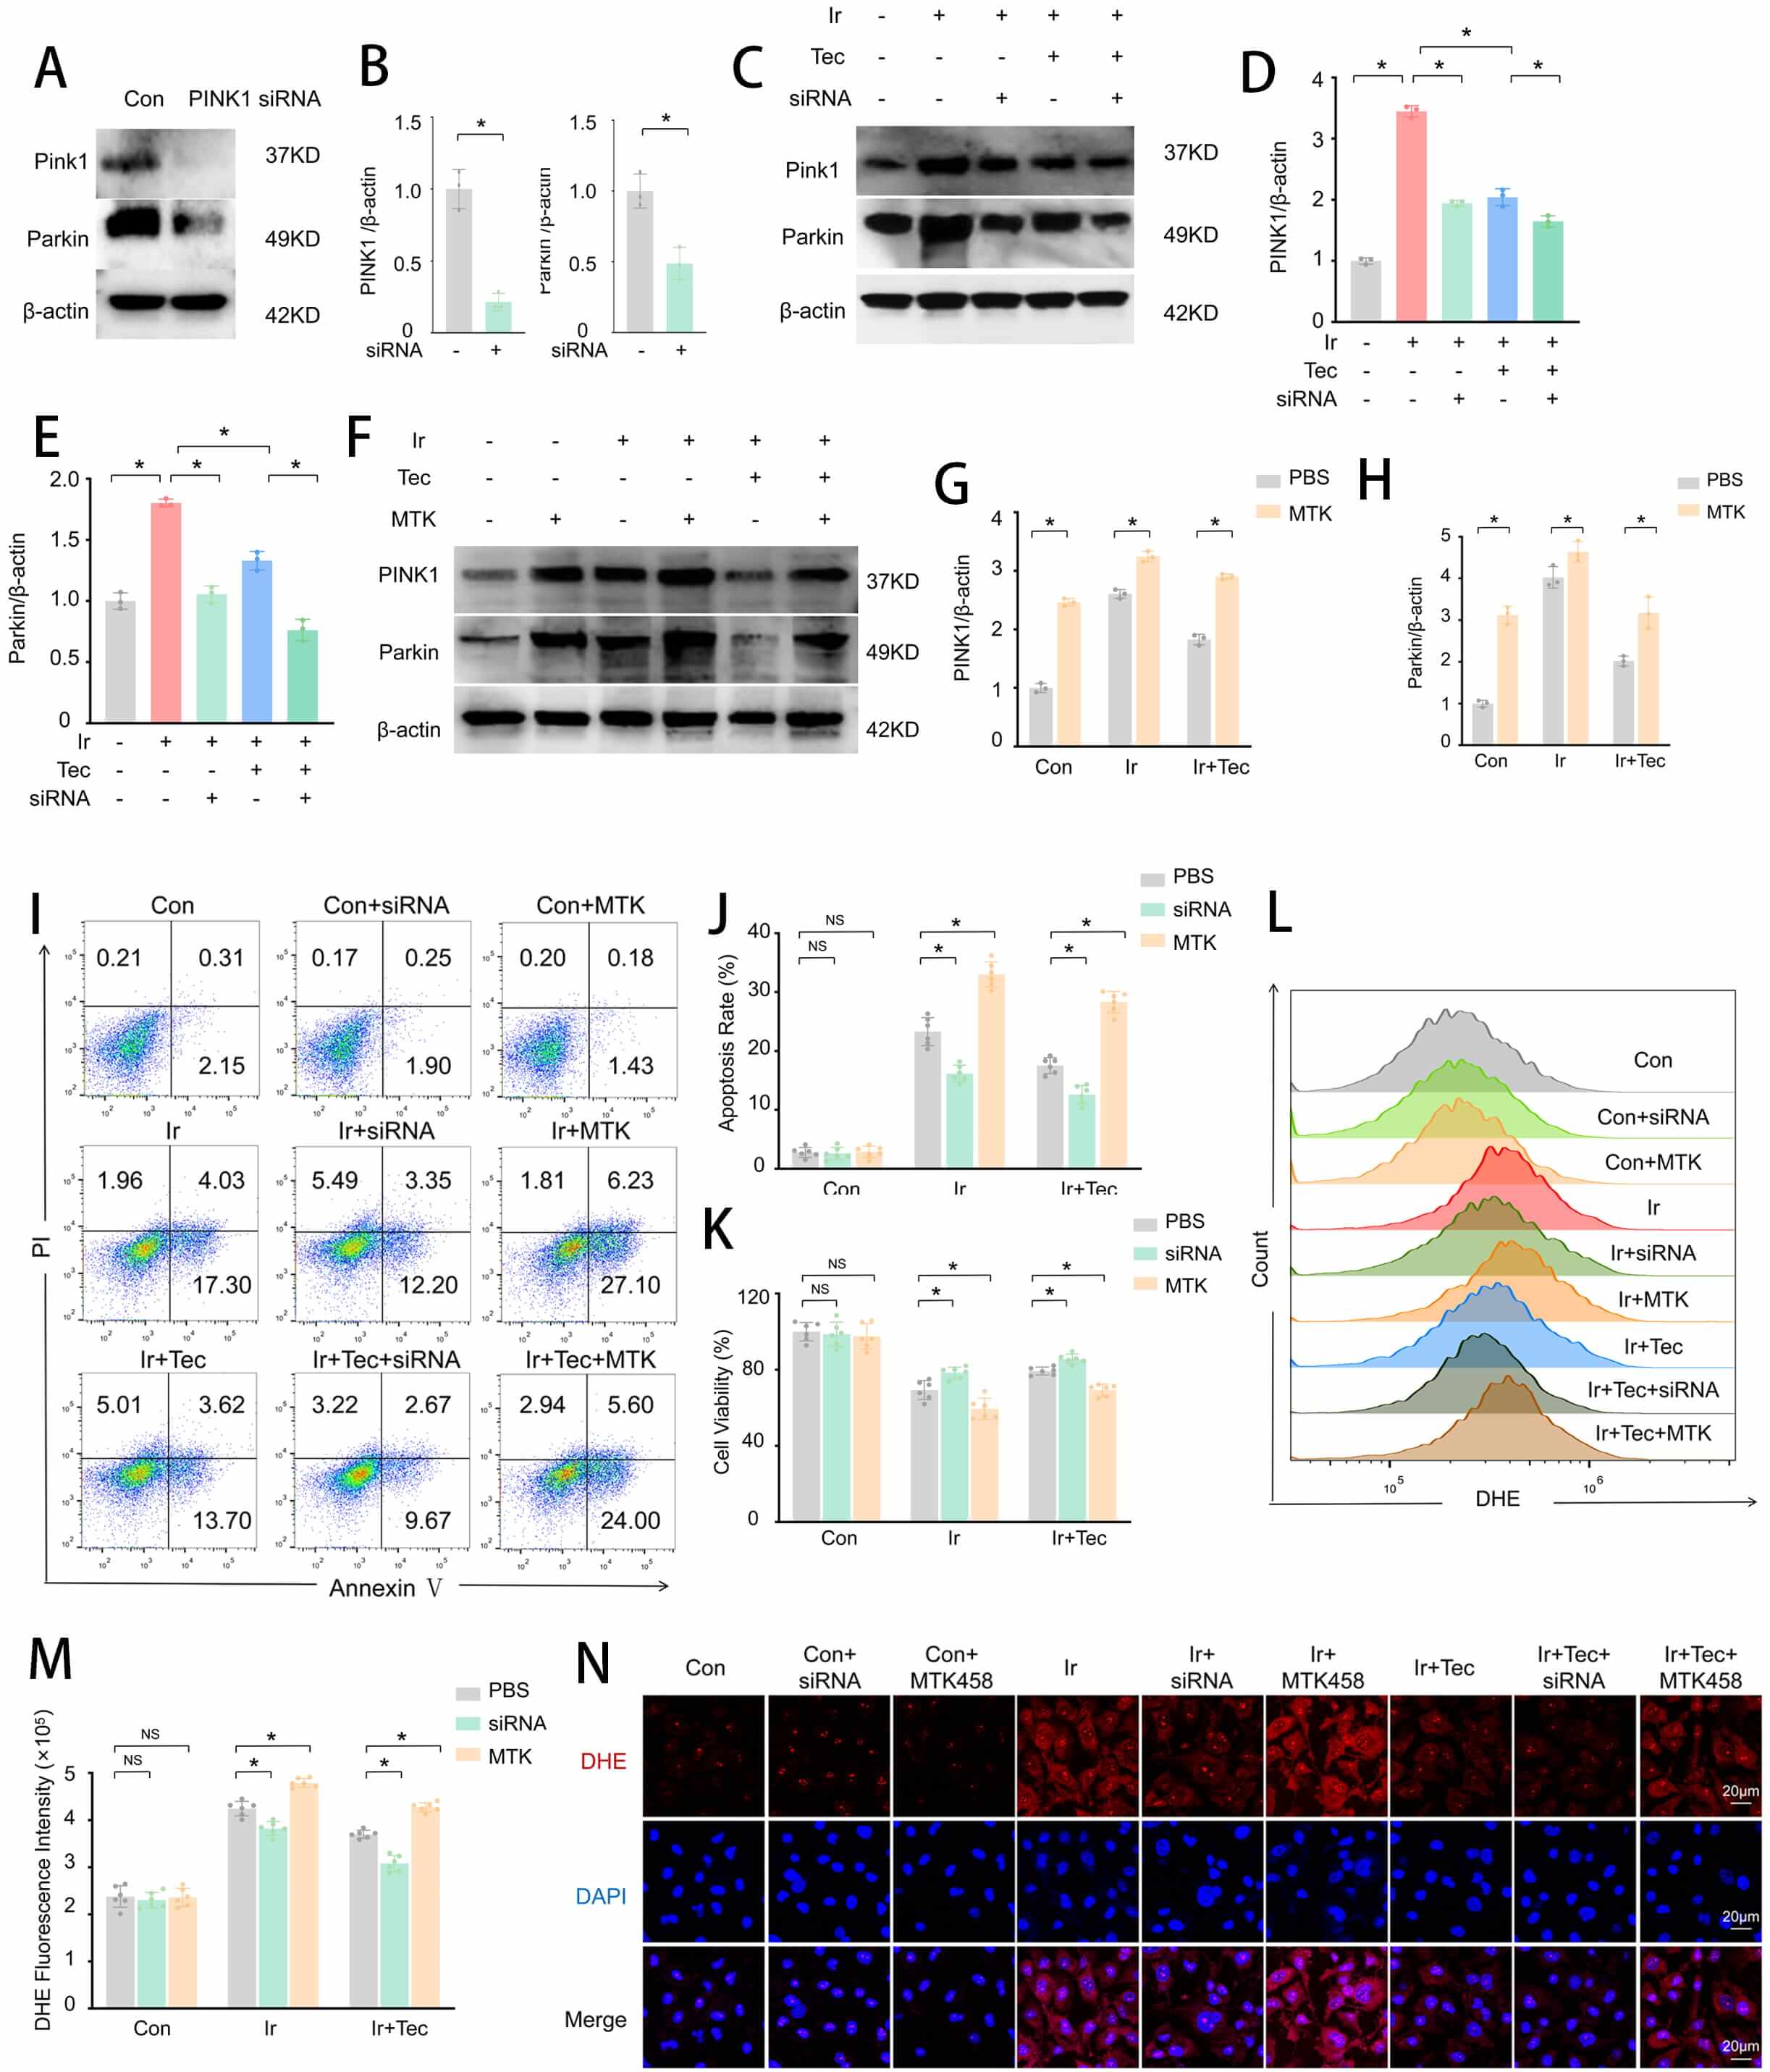 Fig. 6.
Tec protects HUVECs from 9 Gy irradiation-induced injury at 72 h
post-exposure by inhibiting PINK1. (A) Western blot analysis of PINK1 expression
following siRNA-mediated knockdown. (B) Quantitative analysis of PINK1 and Parkin
expression levels normalized to
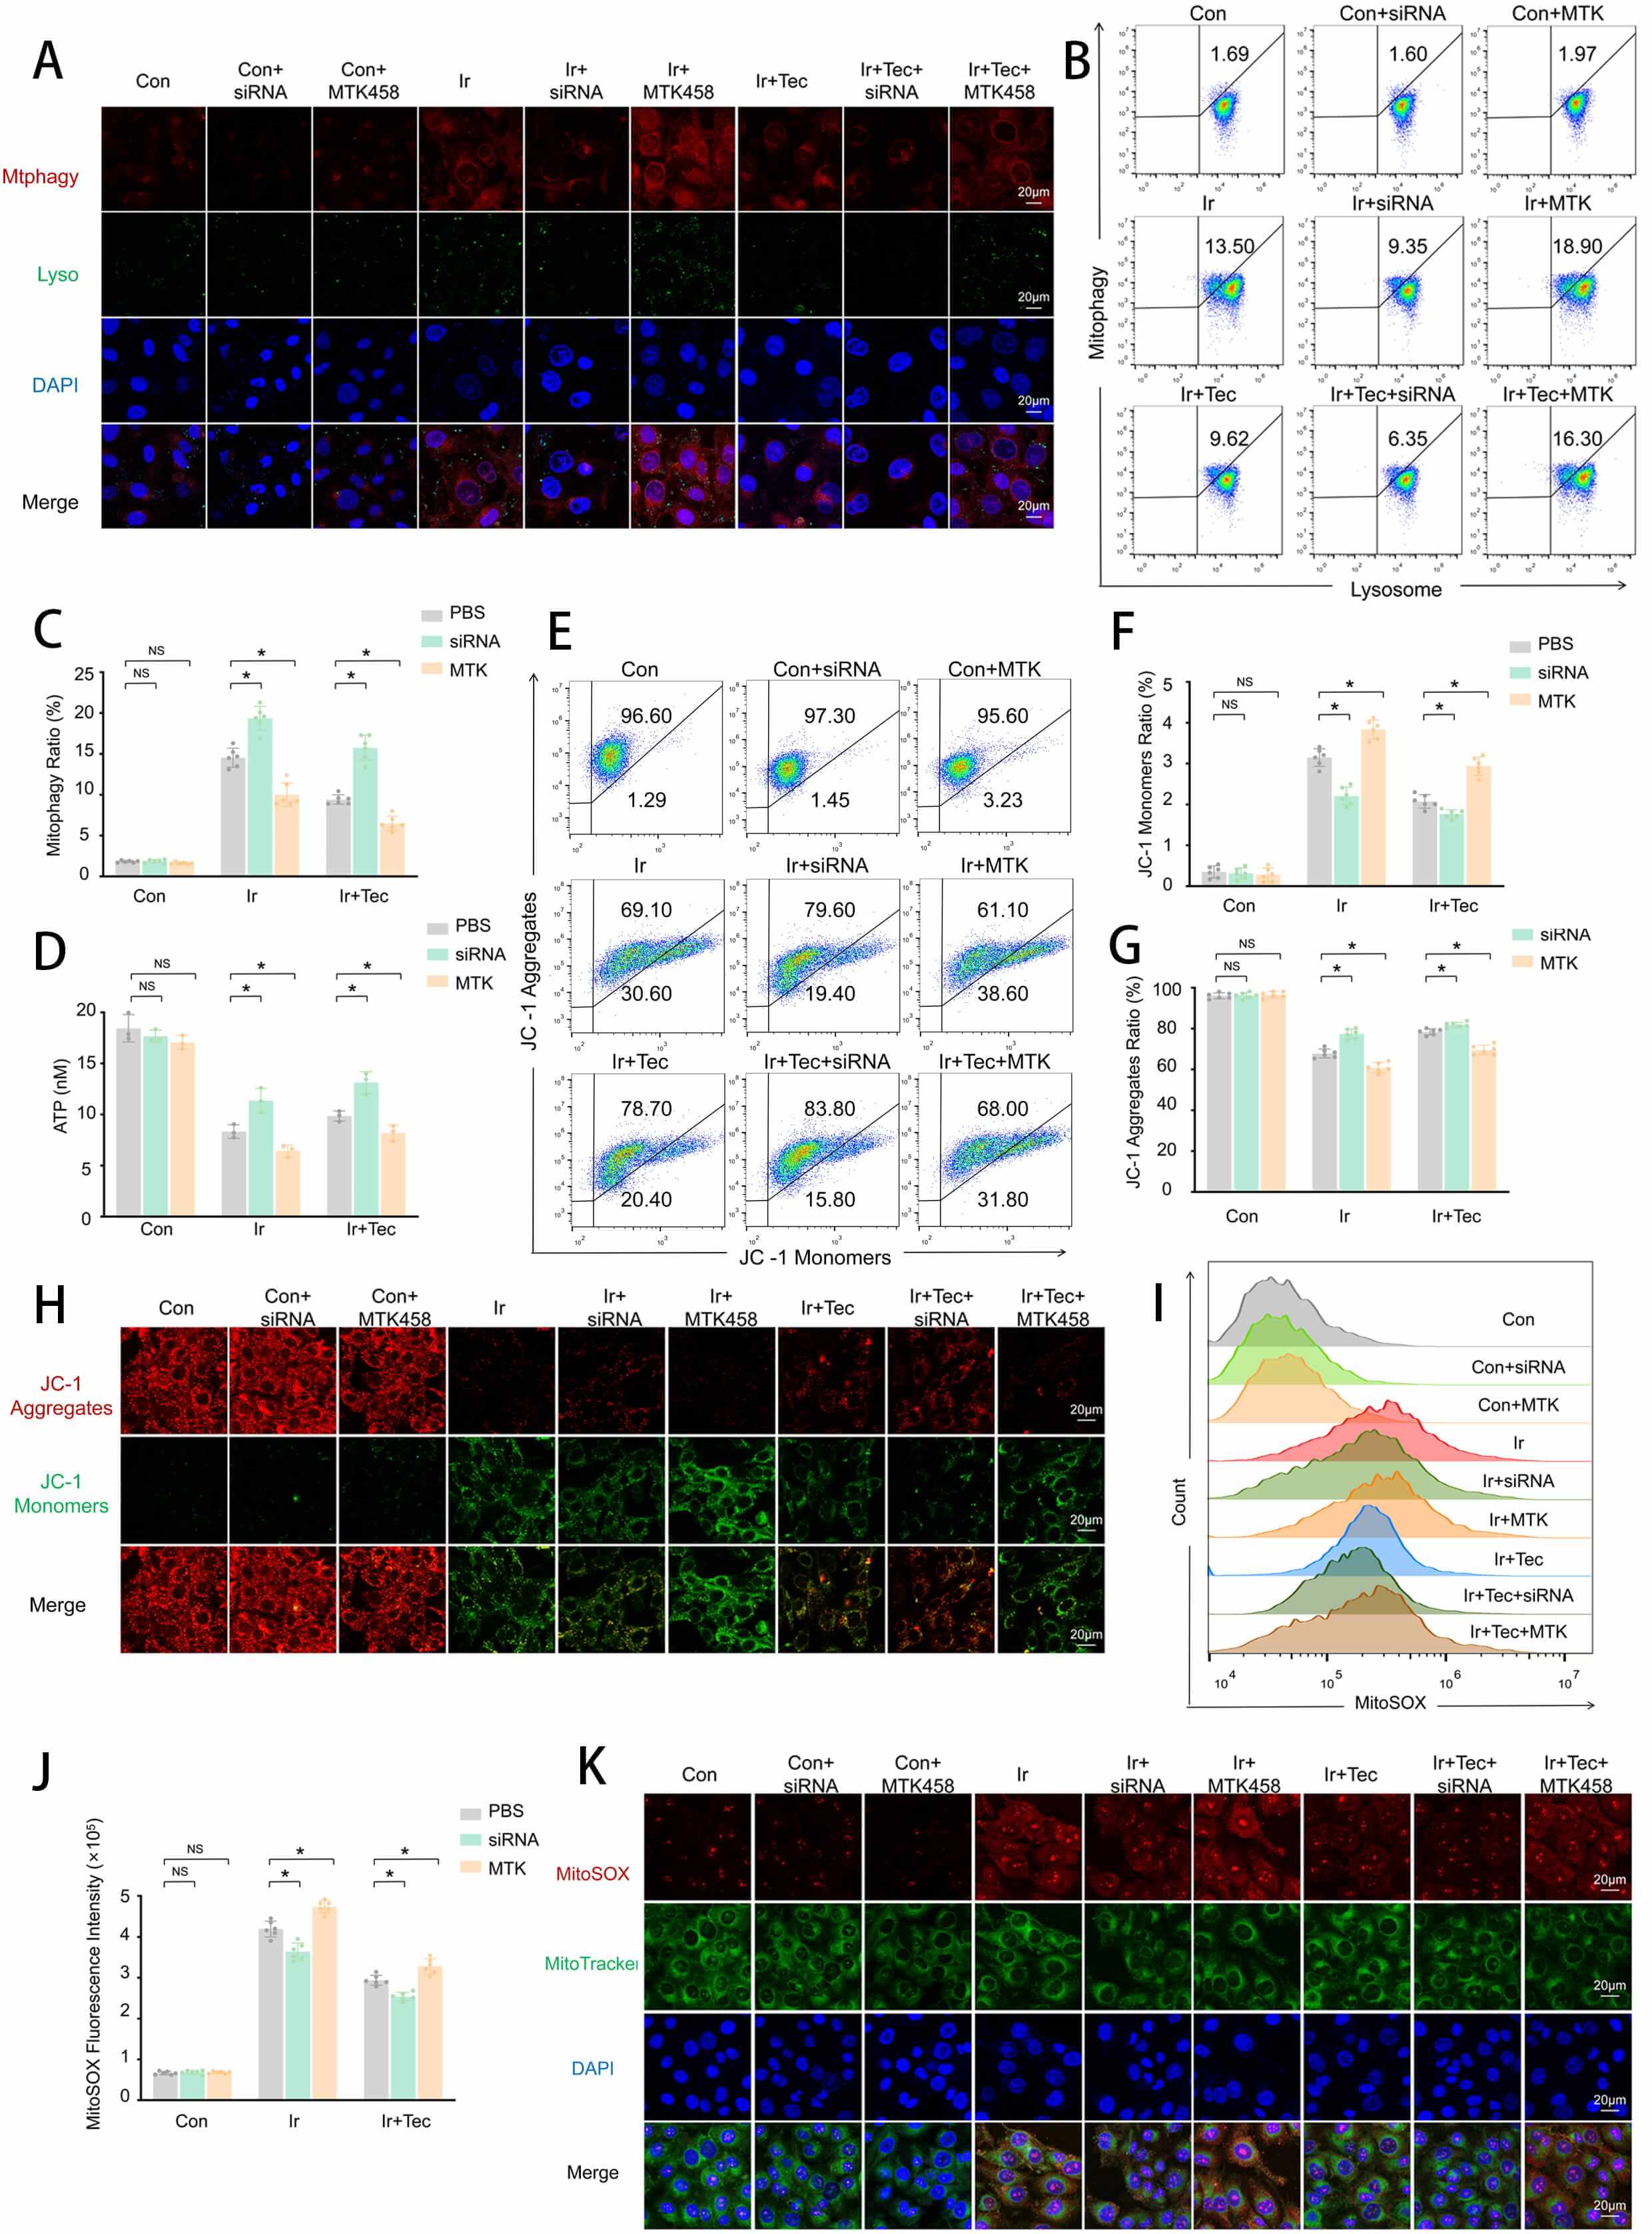
To further explore whether Tec regulates PINK1 to influence mitochondrial outcomes following 9 Gy irradiation-induced injury, mitochondrial function was assessed. To assess mitophagic activity, dual staining of mitophagy and lysosomes was performed. Confocal microscopy revealed that red fluorescence (mitophagy) was significantly enhanced in the Ir group compared to the Con group, accompanied by green fluorescence (lysosomes), while Tec treatment markedly attenuated this enhancement. Relative to the Ir+Tec group, inhibition of PINK1 expression further diminished the red fluorescence signal, whereas overexpression of PINK1 led to a pronounced increase in red fluorescence (Fig. 7A). Flow cytometric quantification of the mitophagy-positive cells further confirmed these findings. The proportion of mitophagy-positive cells was significantly increased in the Ir group compared to the Con group, while Tec treatment markedly reduced this proportion relative to the Ir group. Furthermore, inhibition of PINK1 expression in combination with Tec treatment further decreased the ratio of mitophagy-positive cells compared to the Ir+Tec group, whereas PINK1 overexpression significantly increased this proportion (Fig. 7B,C). ATP levels were significantly decreased in the Ir group compared to the control (Con) group. Conversely, Tec treatment significantly restored ATP levels relative to the Ir group. Relative to the Ir+Tec group, inhibition of PINK1 expression further elevated ATP levels, whereas overexpression of PINK1 abolished the protective effect of Tec, resulting in reduced ATP production (Fig. 7D). Flow cytometric analysis of mitochondrial membrane potential revealed that the proportion of JC-1 aggregates was significantly decreased in the Ir group compared to the Con group. Conversely, Tec treatment significantly increased the proportion of JC-1 aggregates relative to the Ir group. Relative to the Ir+Tec group, inhibition of PINK1 expression restored mitochondrial membrane potential, as evidenced by an increased proportion of JC-1 aggregates. In contrast, overexpression of PINK1 reversed the protective effect of Tec, resulting in a significant reduction in JC-1 aggregates. The proportion of JC-1 monomers exhibited an opposite trend (Fig. 7E–G). JC-1 staining further confirmed that Tec treatment significantly enhanced red fluorescence (JC-1 aggregates) compared to the Ir group. Furthermore, inhibition of PINK1 expression in combination with Tec treatment further restored mitochondrial membrane potential, as evidenced by a marked increase in red fluorescence. In contrast, overexpression of PINK1 reversed the protective effect of Tec, resulting in significantly diminished red fluorescence, indicating a loss of mitochondrial membrane potential (Fig. 7H). Flow cytometric analysis of mitochondrial oxidative stress levels revealed that MitoSOX fluorescence intensity was significantly increased in the Ir group compared to the Con group, while Tec treatment markedly attenuated this increase. Relative to the Ir+Tec group, inhibition of PINK1 expression further reduced mitochondrial oxidative stress, as evidenced by decreased MitoSOX fluorescence. In contrast, overexpression of PINK1 reversed the protective effect of Tec, resulting in significantly enhanced MitoSOX fluorescence (Fig. 7I,J). Colocalization analysis of MitoSOX and MitoTracker further confirmed that red fluorescence (MitoSOX) was markedly diminished in the Ir+Tec group compared to the Ir group, accompanied by decreased colocalization with green fluorescence (MitoTracker). Relative to the Ir+Tec group, inhibition of PINK1 expression further attenuated red fluorescence, indicating reduced mitochondrial oxidative stress levels. In contrast, overexpression of PINK1 reversed the protective effect of Tec, as evidenced by significantly enhanced red fluorescence and its colocalization with green fluorescence (Fig. 7K).
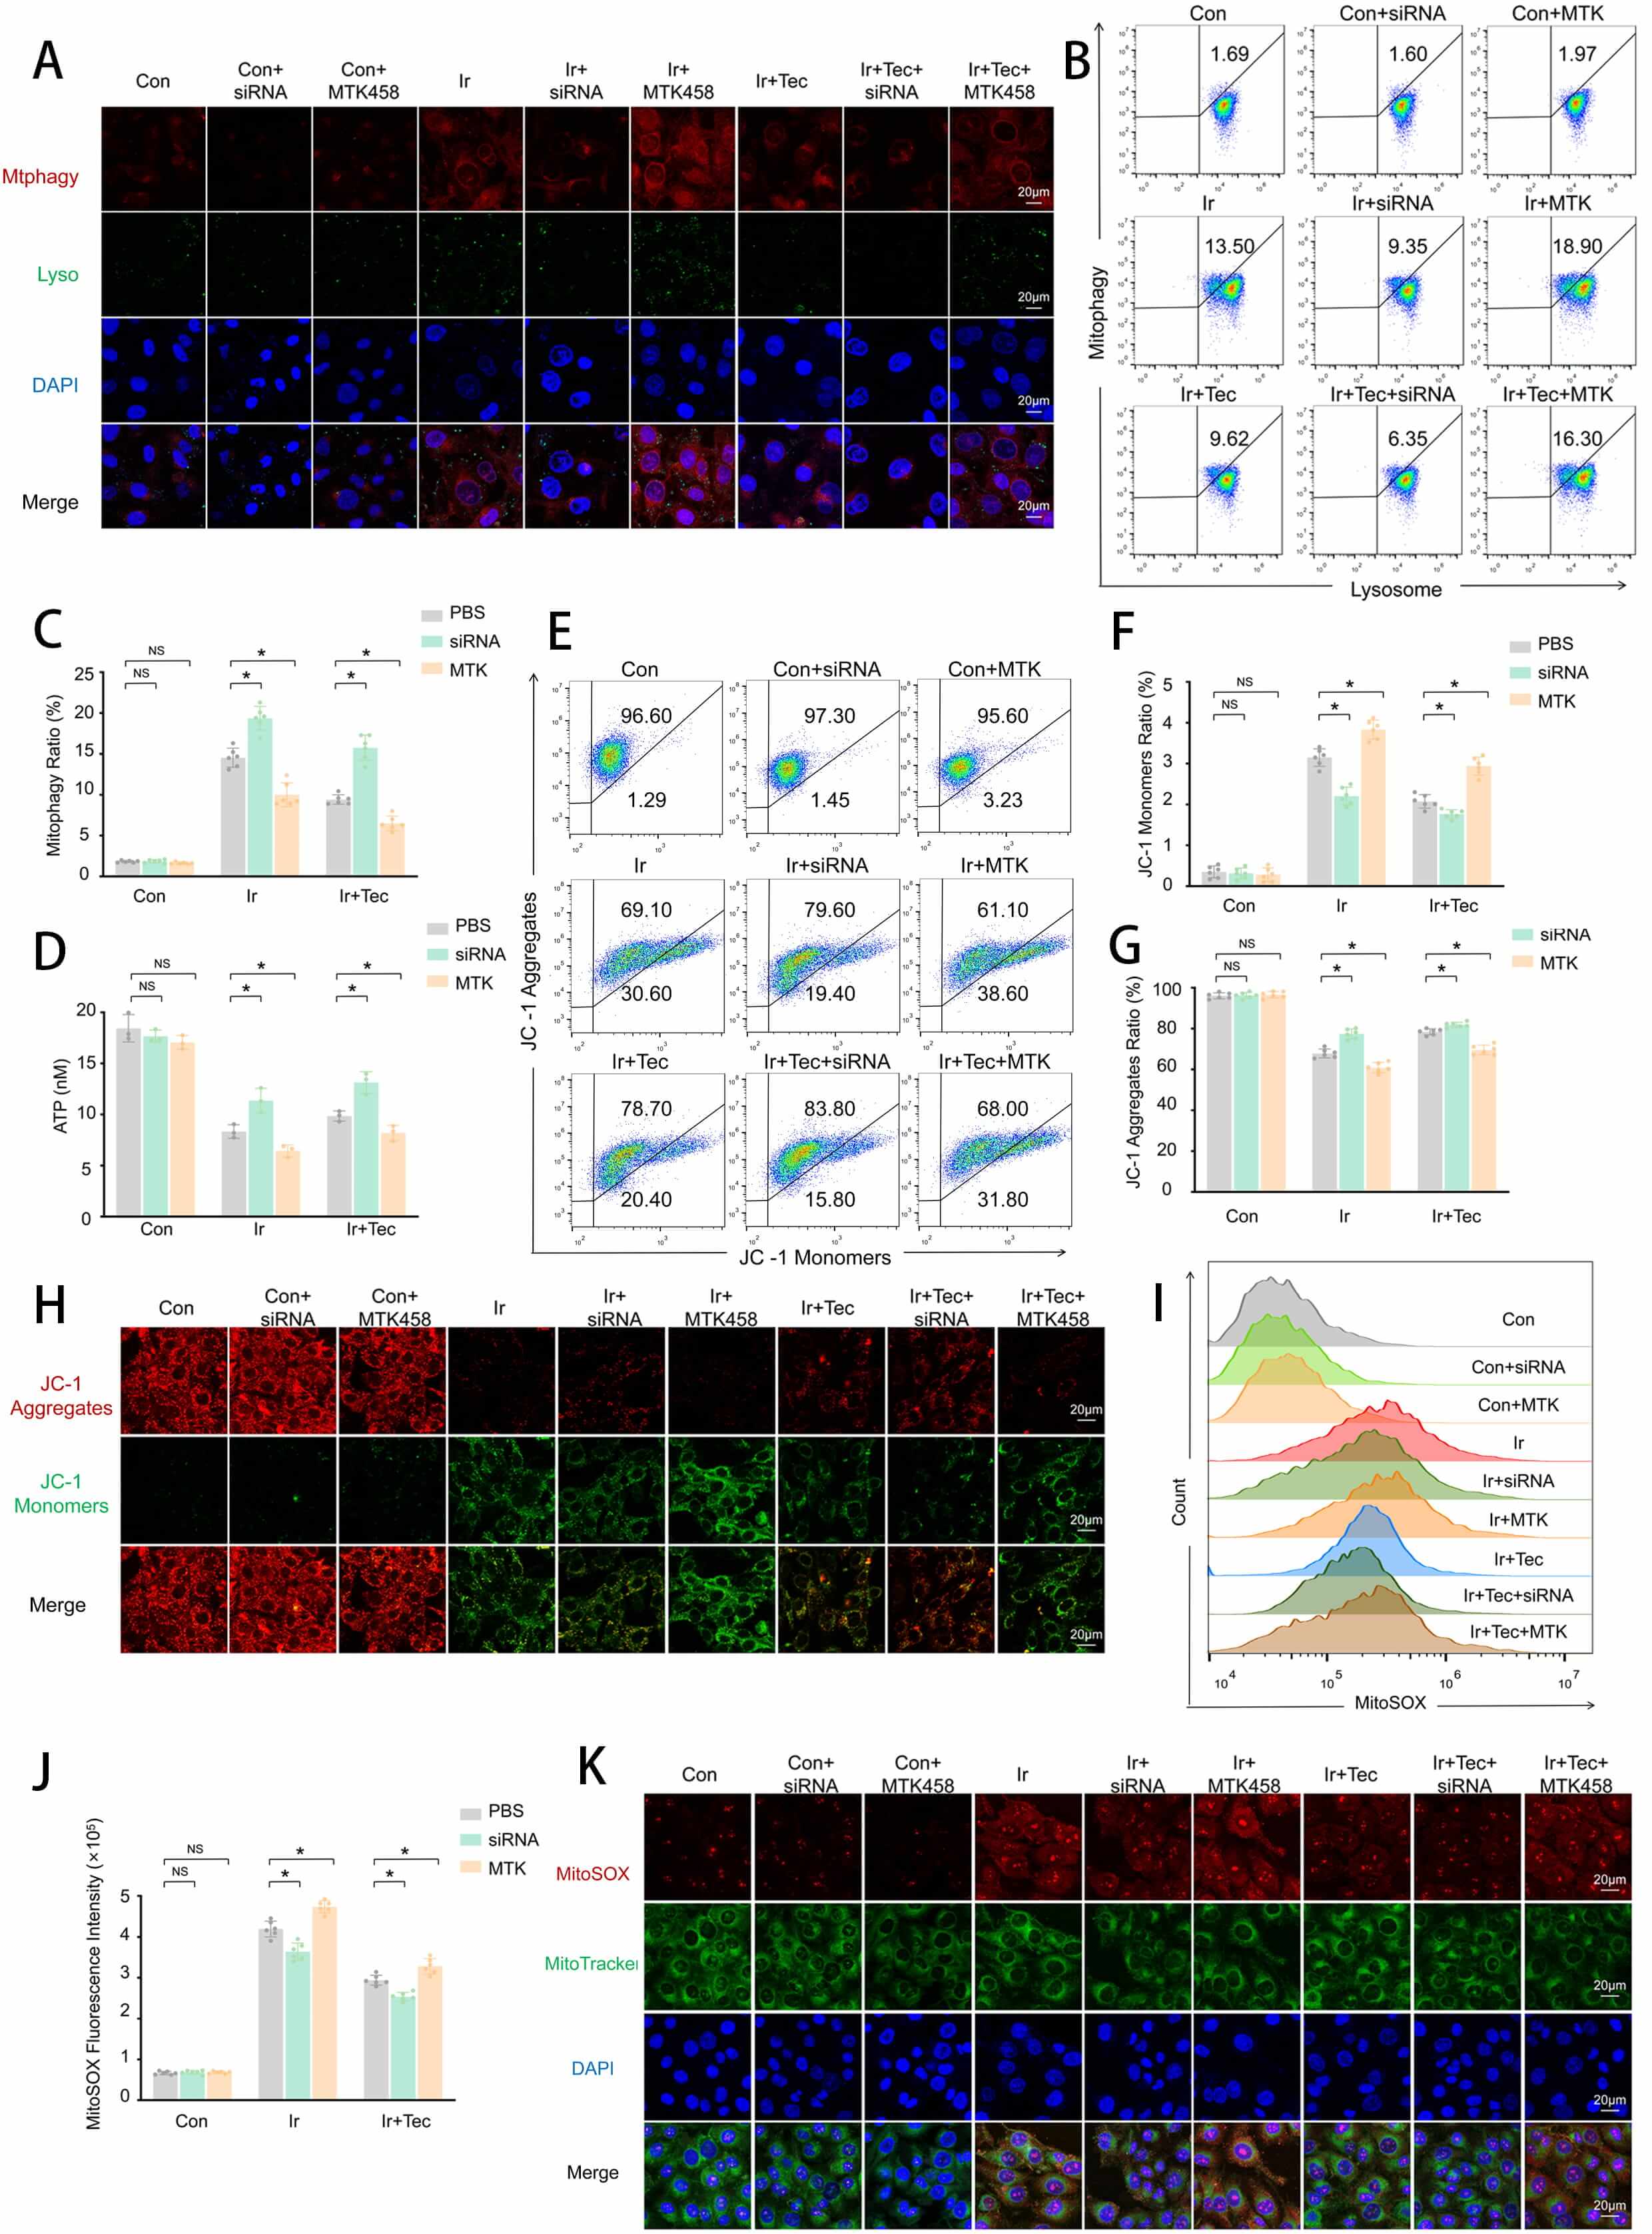 Fig. 7.
Tec preserves mitochondrial function against 9 Gy
irradiation-induced injury at 72 h post-exposure via PINK1 inhibition. (A)
Representative confocal images of dual staining for Mitophagy (red) and Lysosomes
(green). Scale bar = 20 µm. (B) Flow cytometric analysis of mitophagy rate. (C) Quantitative analysis of mitophagy rate (n = 6). (D) ATP
levels measured by ATP assay (n = 3). (E) Representative flow cytometry dot plots
of JC-1 staining for mitochondrial membrane potential. (F) Quantitative analysis
of JC-1 monomer proportion (n = 6). (G) Quantitative analysis of JC-1 aggregate
proportion (n = 6). (H) Representative images of JC-1 fluorescence staining (red:
aggregates, green: monomers). Scale bar = 20 µm. (I) Representative flow
cytometry histograms of MitoSOX fluorescence intensity. (J) Quantitative analysis
of MitoSOX fluorescence intensity (n = 6). (K) Representative confocal images of
MitoSOX (red) and MitoTracker (green) colocalization. Scale bar = 20 µm.
Data are presented as mean
During cancer radiotherapy, radiotherapy can ameliorate symptoms and prolong patient survival. However, it also exerts significant adverse effects on the vascular system [15, 16]. Emerging evidence from the literature underscores the profound impact of thoracic radiotherapy (RT) on the cardiovascular prognosis of long-term survivors of mediastinal Hodgkin lymphoma and breast cancer [17]. Therefore, a deep understanding of the underlying molecular and pathophysiological mechanisms, as well as the adoption of effective preventive and therapeutic measures, is of paramount importance.
The results demonstrate that radiation exposure induces significant cellular
injury, characterized by reduced viability along with increased apoptosis and
oxidative stress. This is consistent with prior literature reporting that
irradiation exposure markedly elevates intracellular ROS levels in HUVECs [18],
and
Tec, a plant-derived isoflavone isolated from the dried flowers of Pueraria thomsonii, has previously been reported to reduce ROS production [21]. Our findings demonstrate that Tec significantly attenuates irradiation-induced oxidative stress and apoptosis in HUVECs, as evidenced by DHE staining and Annexin V/PI double staining. These findings are in agreement with previous studies showing that Tec reduces ROS generation in UVB-irradiated HaCaT cells [22] and alleviates H₂O₂-induced oxidative stress and apoptosis [23]. Moreover, our results extend these observations by demonstrating that Tec preserves mitochondrial function following irradiation injury, as reflected by suppressed mitochondrial ROS generation, restored mitochondrial membrane potential. TEM demonstrated that Tec attenuated irradiation-induced mitochondrial damage, as evidenced by restored cristae integrity and improved morphology, indicating direct mitochondrial protection. Interestingly, dual staining of Mitophagy and Lysosomes revealed that irradiation-induced mitophagic activity was significantly attenuated by Tec treatment, suggesting that Tec may exert its radioprotective effects through inhibition of mitophagy. To further validate this mechanism, we employed U0126 as a positive control. U0126, a MEK inhibitor, has been previously reported to suppress mitophagy-related proteins, thereby exerting protective effects [24, 25]. Notably, Pandey et al. [26] demonstrated that U0126 attenuates excessively activated PINK1/Parkin-mediated mitophagy. In the present study, mitophagy assessment revealed that U0126 significantly reduced the mitophagy rate and attenuated the red fluorescence signal (Mitophagy) following 9 Gy irradiation, confirming its inhibitory effect on mitophagy. Notably, inhibition of mitophagy by U0126 recapitulated the protective effects of Tec, suppressing irradiation-induced apoptosis and oxidative stress while preserving mitochondrial function and ATP production. These results collectively demonstrate that Tec protects HUVECs from radiation-induced injury by suppressing irradiation-induced mitophagy activation. To delineate the molecular mechanism, PINK1 expression was manipulated using siRNA-mediated knockdown and MTK458-mediated overexpression. Notably, PINK1 knockdown potentiated the protective effects of Tec, further reducing apoptosis and oxidative stress, preserving mitochondrial function, and increasing ATP production. Conversely, PINK1 overexpression abrogated Tec-mediated protection. Collectively, these findings demonstrate that Tec exerts its radioprotective effects by attenuating the activation of PINK1-mediated mitophagy.
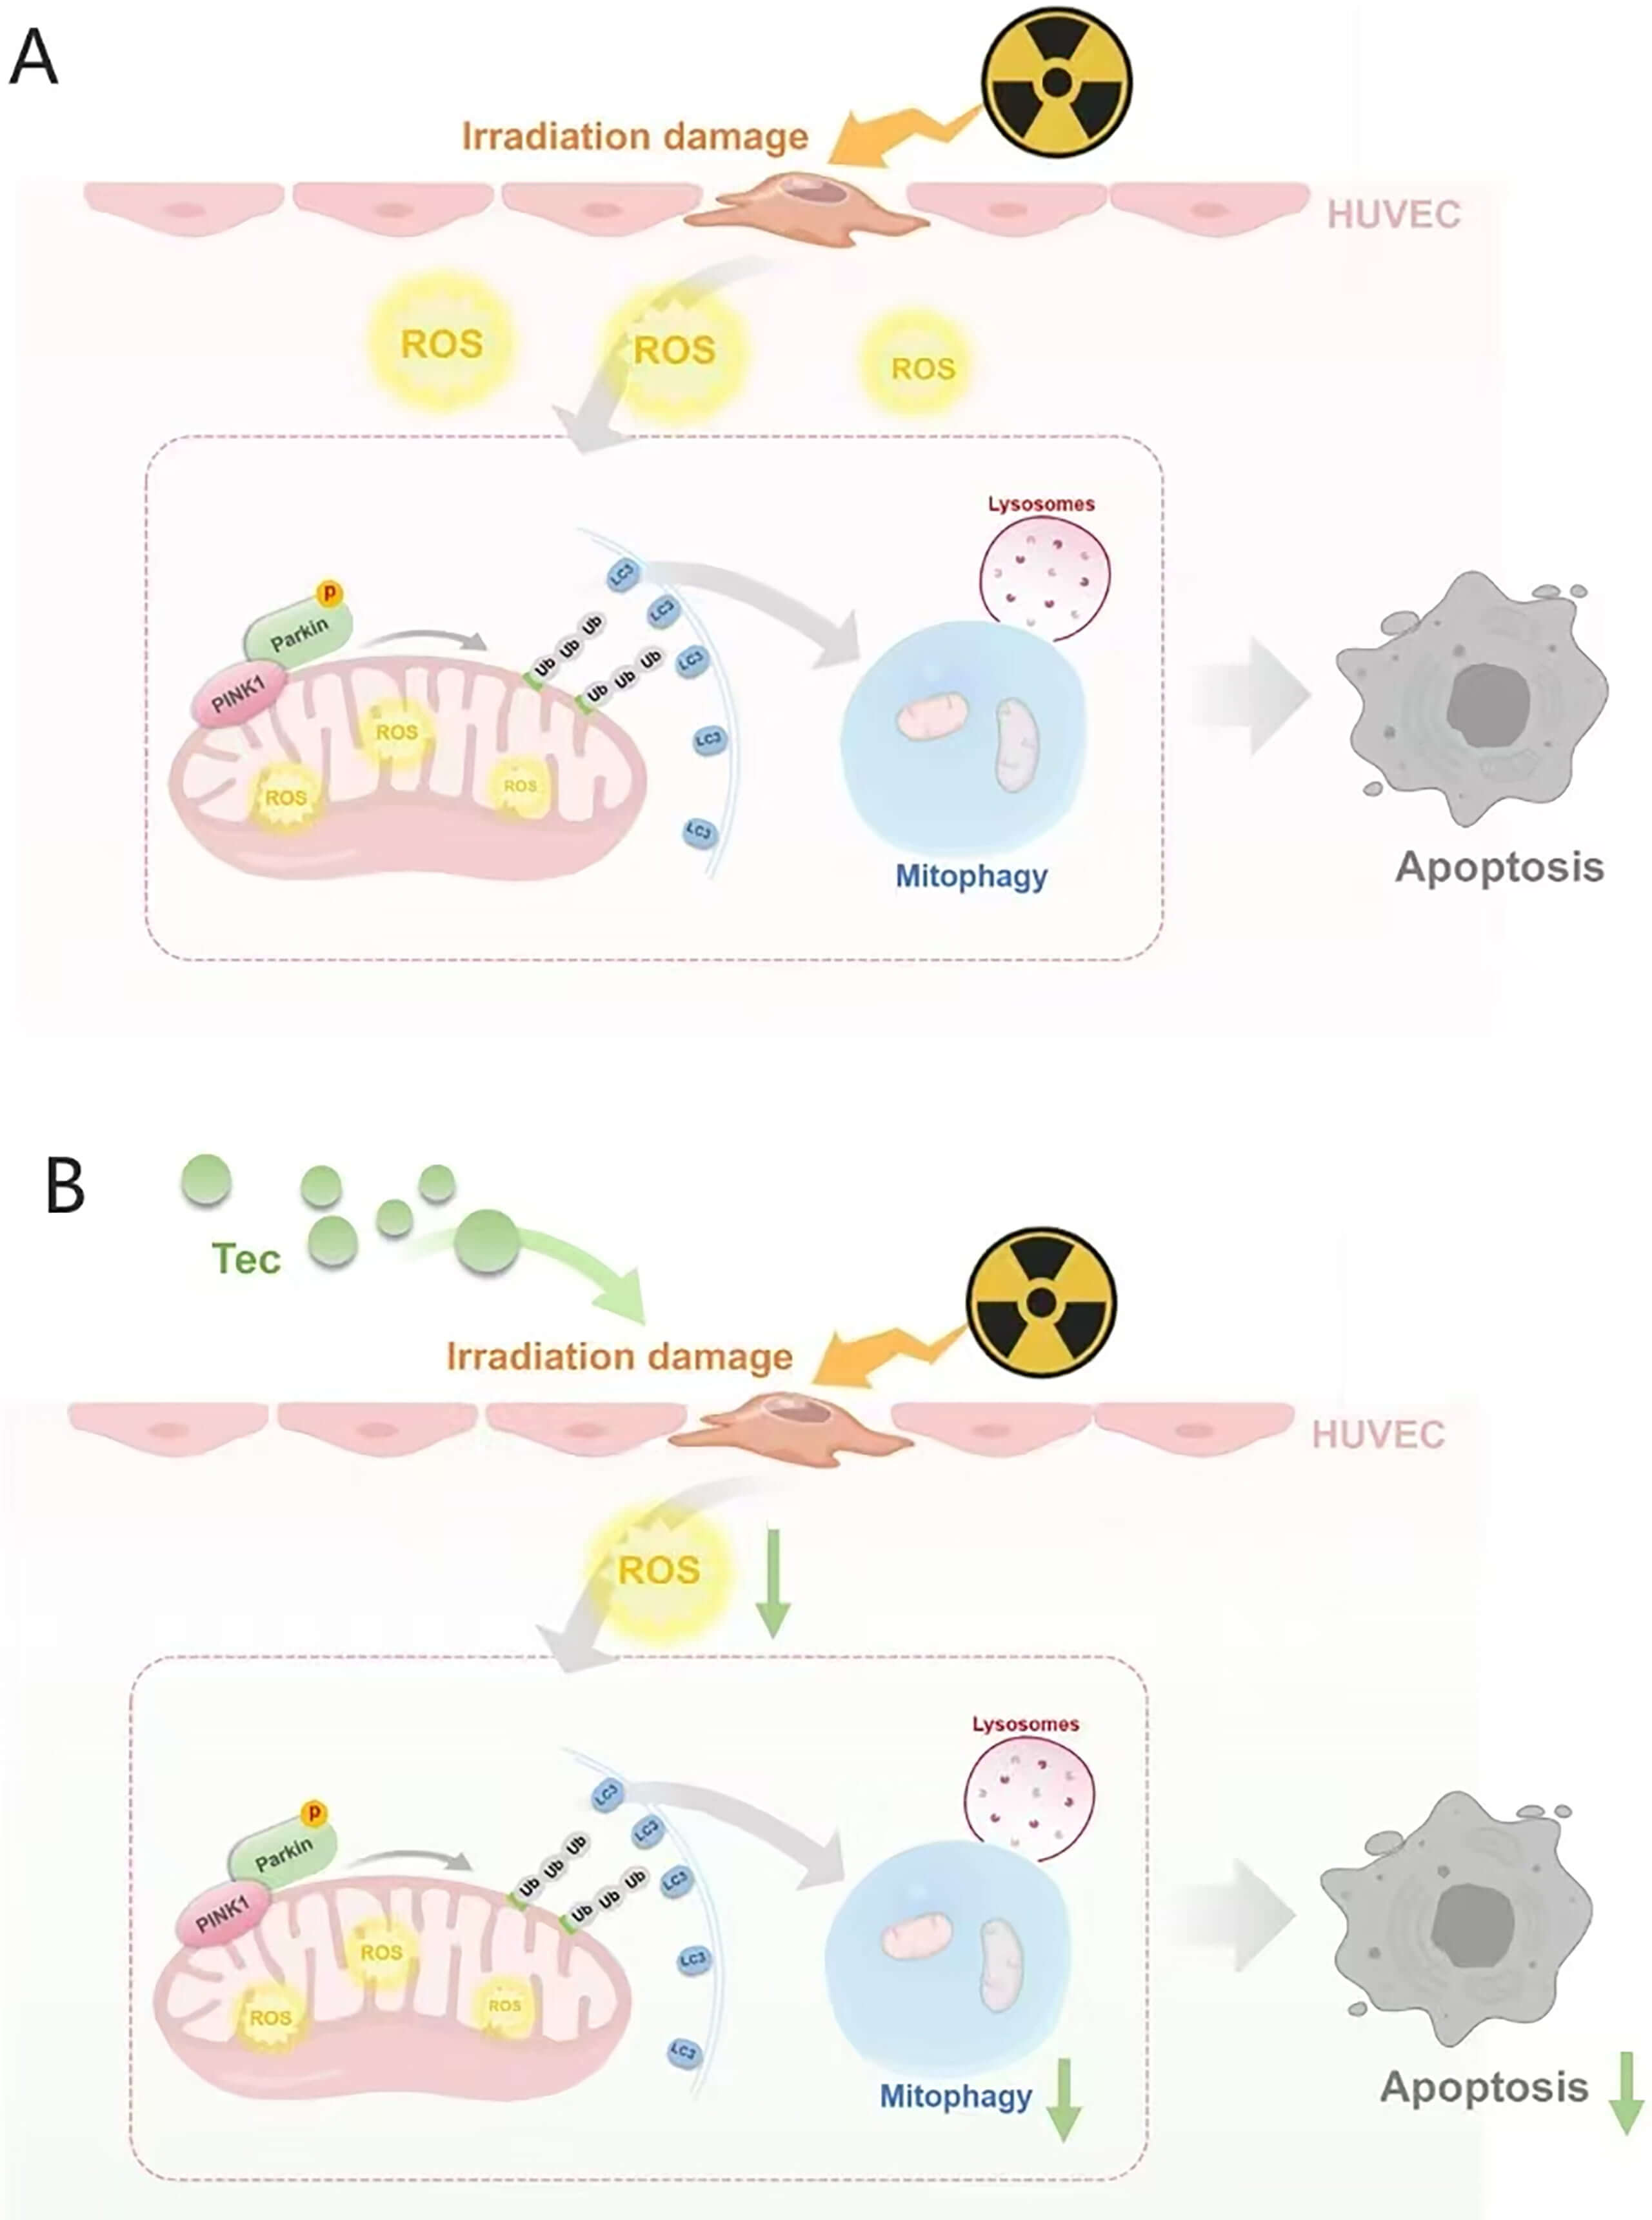
Mitochondria serve as the central hubs of cellular energy metabolism, generating ATP through oxidative phosphorylation to fuel diverse cellular activities. Beyond energy production, mitochondria play pivotal roles in ROS metabolism, intracellular calcium homeostasis, and apoptosis signaling [27]. Exposure to exogenous stressors, such as ionizing irradiation, can impair mitochondrial integrity, leading to metabolic dysfunction, oxidative stress imbalance, and ultimately, apoptosis and pathophysiological alterations. Studies indicate that ionizing radiation disrupts the electron transport chain (ETC), resulting in excessive generation and accumulation of superoxide within the mitochondrial matrix [28, 29], while directly damaging the lipid and protein components of the inner mitochondrial membrane [30], and promoting aberrant opening of the mitochondrial permeability transition pore (mPTP) [31]. Sustained mPTP opening dissipates the proton gradient and causes mitochondrial membrane depolarization, a key signal that triggers the accumulation of PINK1 on the outer mitochondrial membrane, thereby initiating the mitophagy cascade [32]. Upon depolarization, PINK1 stabilizes and recruits the E3 ubiquitin ligase Parkin to impaired mitochondria. Parkin amplifies the damage signal and facilitates recruitment of auxiliary proteins, thereby activating the ubiquitin-dependent selective autophagy receptor pathway to drive mitophagy [33, 34, 35]. Notably, mitophagy is a double-edged sword, capable of exerting both cytoprotective and cytotoxic effects [36]. Under physiological conditions, mitophagy serves as an essential quality-control mechanism that selectively clears damaged mitochondria to protect against stress-induced injury. Under pathological stress, however, excessive mitophagy can promote cell death [37, 38, 39]. For instance, Wu et al. [40] demonstrated that melatonin protects H9C2 cells from hypoxia-reoxygenation injury by suppressing hyperactivated mitophagy. Prior studies suggest that radiation exposure causes mitochondrial damage, pathologically exacerbating mitophagy and promoting cell death [41, 42]. Consistent with these findings, our results confirm that irradiation induces mitochondrial oxidative stress in HUVECs, leading to depolarization, PINK1/Parkin activation, and excessive mitophagy, which exacerbates cellular injury. Conversely, Tec confers mitochondrial protection by alleviating mitochondrial oxidative stress, restoring membrane potential, and inhibiting PINK1/Parkin-driven mitophagy, thereby preserving endothelial integrity (Fig. 8).
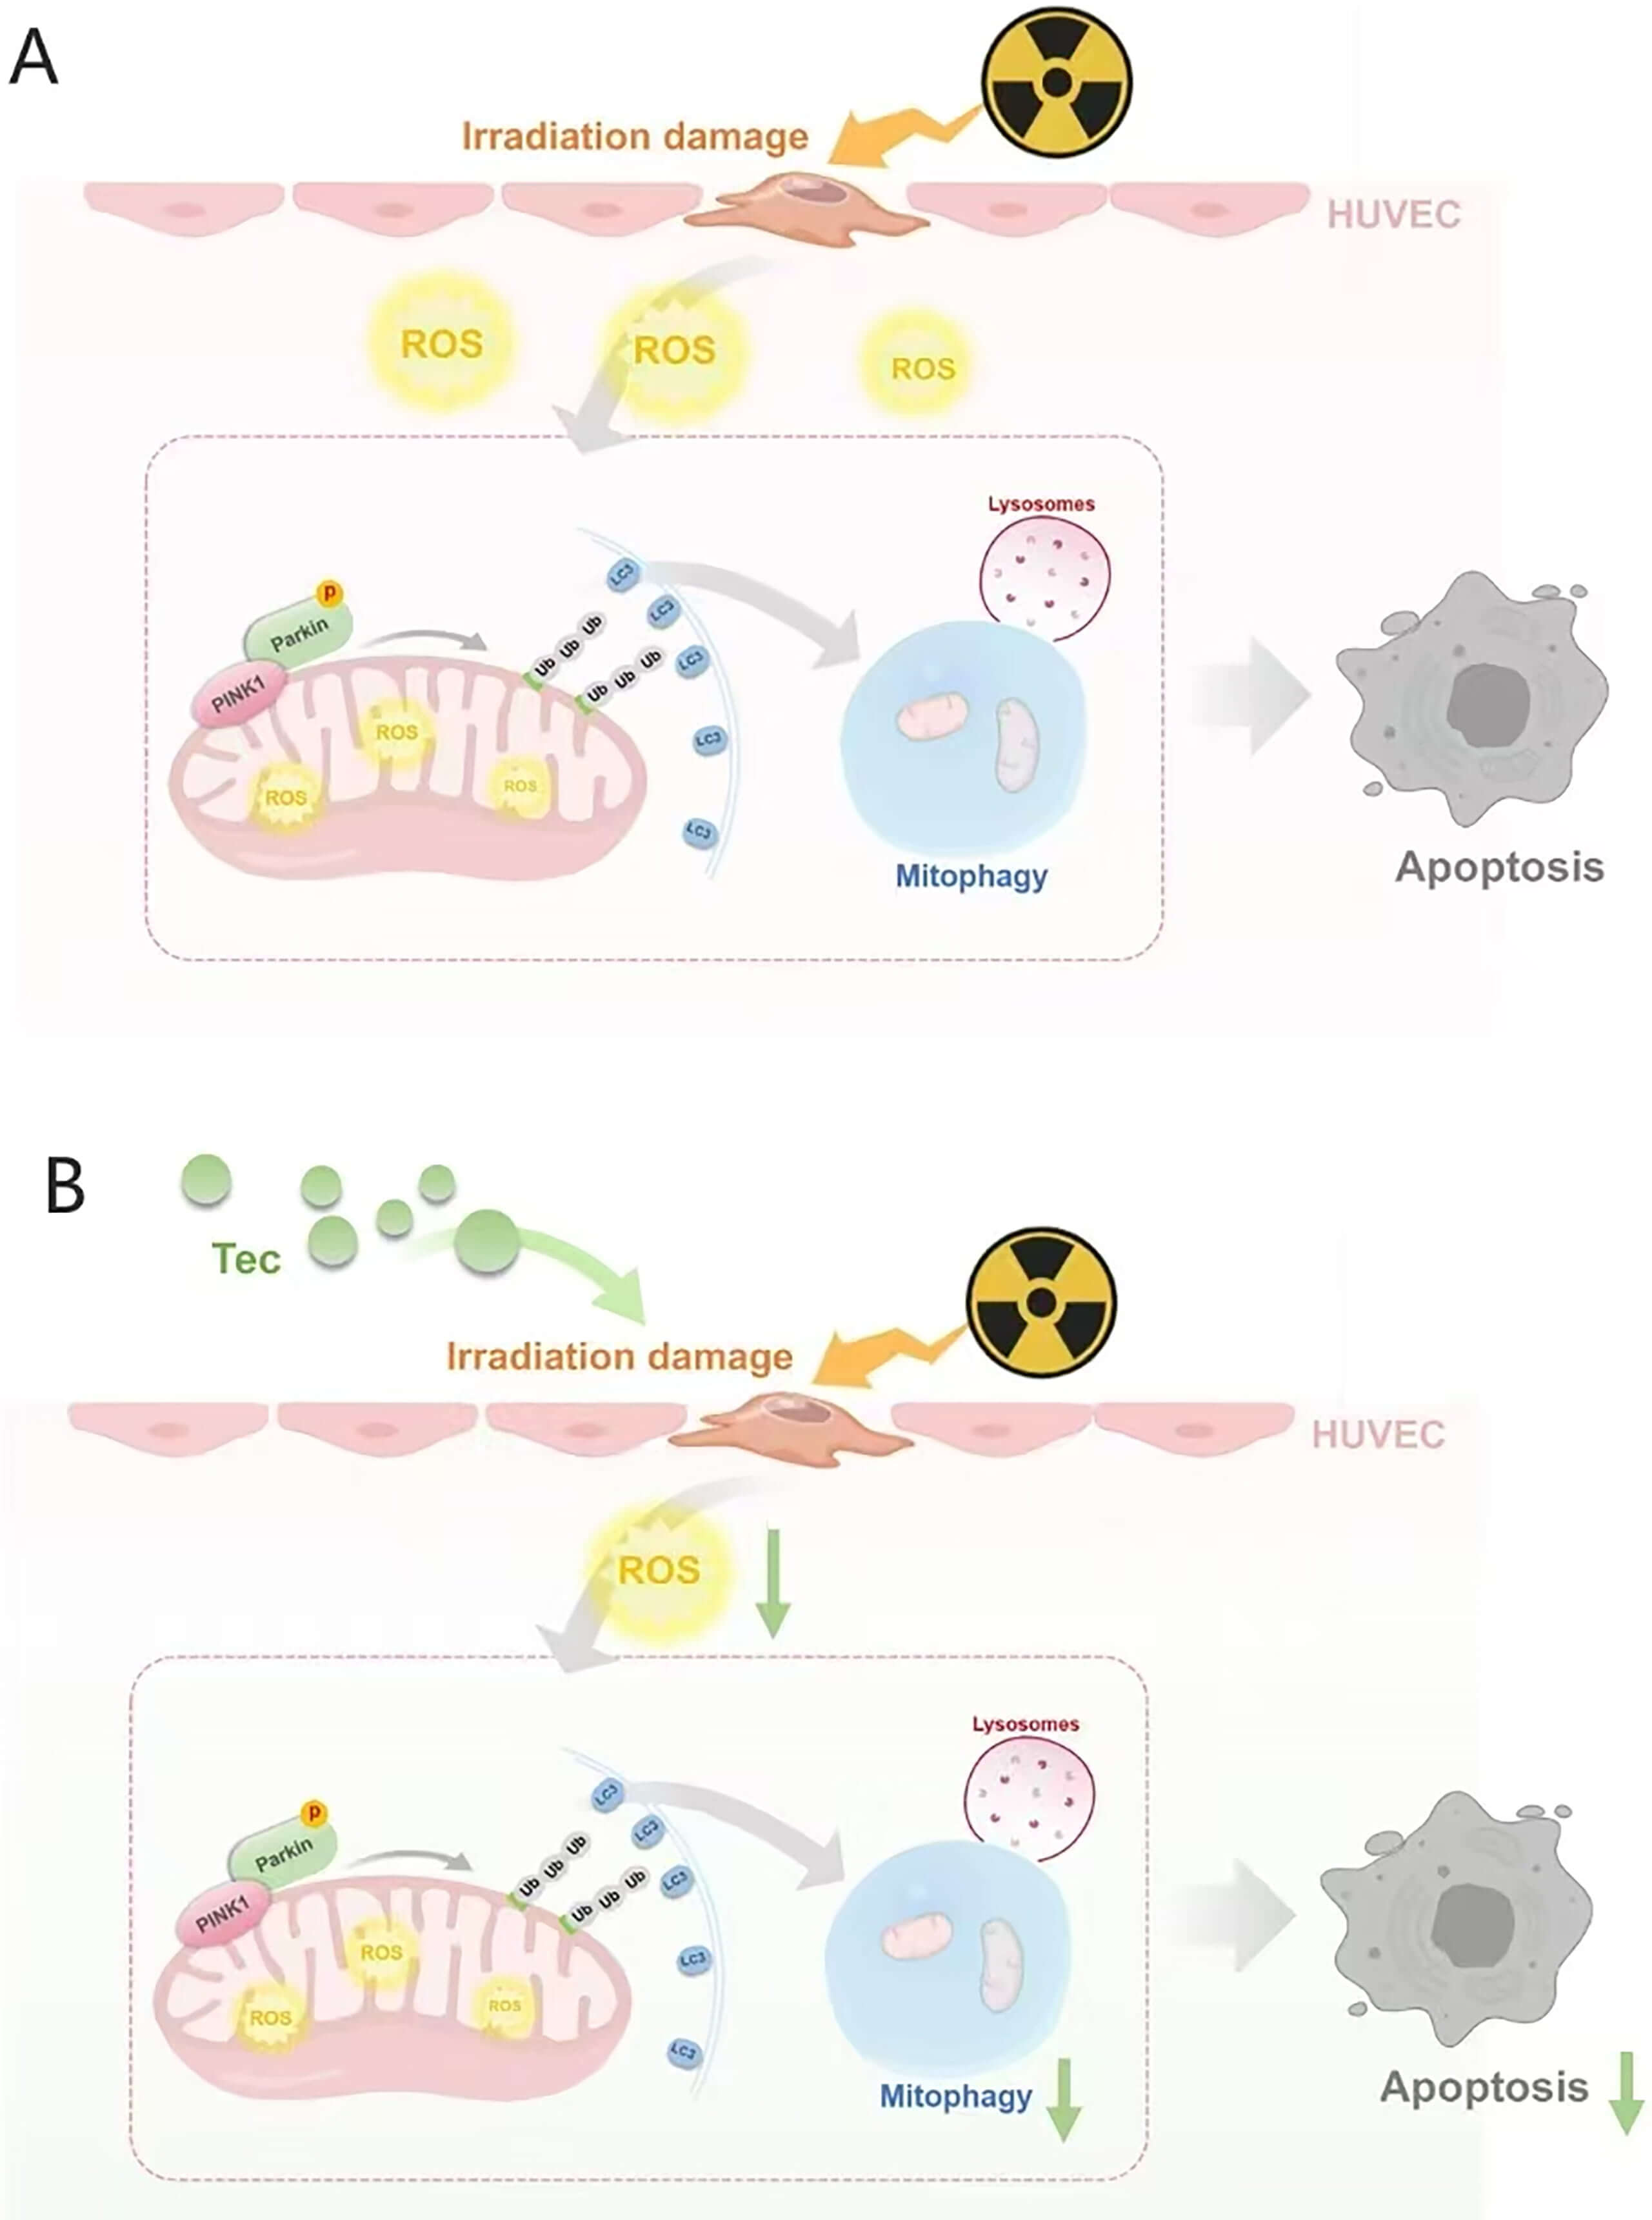 Fig. 8.
Mechanism diagram. (A) Mechanism of radiation-induced injury to HUVECs. (B) Therapeutic mechanism of tectorigenin targeting the irradiation-induced injury pathway. The figure was created using Medpeer software.
This study has several limitations. First, it primarily employed in vitro cell models, lacking validation in animal models of irradiation-induced injury. Second, mitophagy was evaluated using static markers rather than direct flux measurements; additional studies employing lysosomal inhibitors would be necessary to conclusively determine whether Tec directly inhibits mitophagic flux. Third, although our genetic experiments indicate that PINK1 is required for Tec-mediated protection, it remains unclear whether Tec acts directly on mitophagy or exerts its effects upstream by alleviating mitochondrial oxidative stress and membrane depolarization, with the observed suppression of mitophagy occurring as a downstream consequence. Future work should establish relevant animal models to further evaluate the protective effects of Tec and integrate pathway modulators with genetic approaches to delineate the broader signaling network.
The present study demonstrates that mitochondria serve as critical targets of radiation-induced injury, with mitophagy playing a key pathogenic role in this process. Tec attenuates such injury by suppressing the activation of the PINK1/Parkin-mediated mitophagy pathway, thereby effectively preserving mitochondrial function, a mechanism further validated by PINK1 overexpression experiments. These findings reveal the protective potential of Tec and propose a novel strategy for optimizing cardiovascular protection during radiotherapy.
RIHD, Radiation-induced heart disease; Ir, Irradiation; Tec, Tectorigenin; HUVECs, Human Umbilical Vein Endothelial Cells; FBS, Fetal Bovine Serum.
Data are available from the corresponding author on reasonable request.
CL: Methodology; Visualization, Software; Writing-Original Draft; FL: Resources, Formal analysis; WW: Formal analysis; MQ: Resources, Conceptualization; CY: Resources, Investigation; ZJ: Data Curation, Visualization; JX: Software; XL: Validation; ZZ: Methodology; Conceptualization, Funding acquisition, Project administration; Resources, Supervision, Writing-Review & Editing. All authors contributed to editorial changes in the manuscript. All authors read and approved the final manuscript. All authors have participated sufficiently in the work and agreed to be accountable for all aspects of the work.
Not applicable.
We would like to express our sincere gratitude to all the participants in this study and those who have contributed to the global medical cause. Additionally, we are deeply appreciative of the anonymous reviewers for their meticulous reading of our work and the valuable comments they provided.
This work was supported by the Natural Science Foundation of Beijing Municipality (7222229).
The authors declare no conflicts of interest.
During manuscript preparation, DeepSeek was employed for linguistic refinement. The authors subsequently reviewed, edited, and assume full responsibility for the final content.
References
Publisher’s Note: IMR Press stays neutral with regard to jurisdictional claims in published maps and institutional affiliations.