


 , Chong Zhang 1,*
1 Department of General Surgery, The First Affiliated Hospital of Anhui Medical University, 230022 Hefei, Anhui, China
2 Department of General Surgery, Anqing First People’s Hospital of Anhui Medical University, 246008 Anqing, Anhui, China
3 Clinical Pathology Center, The First Affiliated Hospital of Anhui Medical University, 230022 Hefei, Anhui, China
Abstract
The interplay between regulated cell death processes, especially disulfidptosis, and the immune microenvironment in hepatocellular carcinoma (HCC) remains poorly understood. Therefore, this study aimed to elucidate these relationships systematically at single-cell resolution.
Multi-omics data from TCGA (n = 315) were integrated with single-cell RNA sequencing (scRNA-seq) data from 21 HCC samples. Disulfidptosis-related subtypes were identified using non-negative matrix factorization (NMF) clustering of co-expressed long non-coding RNAs (lncRNAs). At the single-cell level, tumor cells were stratified into high- and low-disulfidptosis groups based on a 14-gene signature that included SLC7A11 and G6PD. Metabolic reprogramming, immune infiltration, and intercellular communication between high-disulfidptosis tumor cells and M2 macrophages were analyzed. Gene signatures were employed to quantify ferroptosis, and correlations with disulfidptosis were assessed. Key molecular axes, such as GPX4-RAC1, were validated by multiplex immunofluorescence.
Three molecular subtypes with distinct prognoses were identified. The disulfidptosis-enriched subtype (subtype 1) demonstrated superior survival and specific metabolic features, including glucose/glutamine enrichment. Single-cell analysis revealed that high-disulfidptosis tumor cells exhibited a paradoxical metabolic state: upregulation of disulfidptosis-associated genes (SLC7A11, RAC1), accompanied by downregulation of traditional energy pathways. These cells actively recruited and engaged M2 macrophages through a bidirectional communication network dominated by the macrophage migration inhibitory factor (MIF) pathway from tumor cells to M2 macrophages, and the GALECTIN/CypA pathways from M2 macrophages to tumor cells. Notably, a significant positive correlation was observed between disulfidptosis and ferroptosis scores, with the strongest association the M2 macrophage population and centered on the core regulatory stage (Stage 2). This correlation was molecularly anchored by a significant co-expression of GPX4 and RAC1 in M2 macrophages, a finding corroborated by spatial protein co-localization.
This study delineates a disulfidptosis-associated HCC subtype with a unique metabolic–immune niche. These findings reveal an active, M2 macrophage-involved adaptive network and propose a novel mechanistic link between disulfidptosis and ferroptosis via the GPX4–RAC1 axis within the tumor microenvironment.
Keywords
- disulfidptosis
- M2 macrophage
- hepatocellular carcinoma
- biomarkers
Despite advances in specific areas of hepatocellular carcinoma (HCC) diagnosis and treatment, immunotherapeutic strategies have yet to significantly enhance overall patient survival or cure rates [1, 2]. Given the pronounced heterogeneity of HCC and its substantial clinical burden, extensive research has concentrated on tumor metabolic reprogramming and immune evasion mechanisms, both recognized as key drivers of HCC progression and therapeutic resistance [3, 4, 5]. The high metabolic activity of HCC closely associates its pathogenesis with dysregulated glucose metabolism [6, 7]. Cancer cells consistently exhibit the “Warburg effect” [8, 9], leading to competitive glucose depletion within the tumor microenvironment (TME), along with oxidative stress and increased metabolic pressure [10]. Recently, disulfidptosis has garnered significant attention as a novel form of cell death mechanistically linked to metabolic dysregulation [9]. In HCC, disulfidptosis is characterized by the abnormal accumulation of disulfide bonds, particularly under conditions of glucose deprivation or depletion of redox buffering systems, such as glutathione. The accumulation of disulfide bonds occurs when SLC7A11 is overexpressed. The overexpression of SLC7A11 leads to the accumulation of disulfide bonds, resulting in protein misfolding, including that of cytoskeletal proteins. This misfolding exacerbates endoplasmic reticulum (ER) stress and ultimately initiates programmed cell death [11, 12, 13]. Importantly, the intrinsic metabolic vulnerability of HCC to glucose dysregulation may render it particularly susceptible to disulfidptosis, thereby offering a promising avenue for the development of novel, targeted metabolic therapies.
Imbalance of disulfide uptake and metabolism is commonly observed in both HCC parenchymal cells and TME stromal cells (e.g., cancer-associated fibroblasts, immune cells) [12]. By triggering this imbalance across both cell types, disulfidptosis exhibits trans-cellular regulatory capacity—positioning itself as a central hub that connects metabolic reprogramming with remodeling of the immune microenvironment [13, 14, 15]. The role of disulfidptosis in mediating metabolic-immune crosstalk implies significant potential for developing targeted strategies that combine metabolic and immune interventions. However, this disulfidptosis-mediated, metabolic-immune crosstalk mechanism has not yet been systematically leveraged to predict immunotherapy responses or to reverse drug resistance in HCC. Nevertheless, understanding disulfidptosis-mediated regulation of HCC metabolite-immune crosstalk is crucial for overcoming current therapeutic bottlenecks, advancing novel combination therapies, and developing prognostic models. A number of recent studies have used long non-coding RNAs (lncRNAs) to identify tumor subtypes. These lncRNA-based molecular subtypes were effective at predicting clinical trends, with specific subtypes showing differential response to drugs such as sorafenib and paclitaxel [15, 16]. From an immune perspective, some subtypes may identify patient subgroups that could benefit from immune checkpoint inhibitor therapy [17]. Importantly, some core lncRNAs, such as AC131009.1 and HDAC2-AS2, have themselves been found to be key molecules driving tumor progression. Tumor classification based on lncRNA can involve several key clinical factors, such as prognosis, interpretation of mechanisms, and treatment prediction.
Within the HCC microenvironment, macrophage [18] polarization states and immune
functionality are strongly regulated by metabolic pathways under
glucose-restricted conditions [19]. Metabolic adaptation of tumor-associated
macrophages (TAMs) to glucose-depleted microenvironments involves dynamic
reprogramming. Sustained glucose deprivation induces pro-inflammatory M1
macrophages to upregulate glycolytic enzymes (e.g., GLUT1, HK2) and
secrete pro-inflammatory cytokines (e.g., TNF-
Key mechanistic and translational questions remain concerning the link between disulfidptosis and the HCC immune landscape. Specifically, the functional crosstalk between tumor cells exhibiting high susceptibility to disulfidptosis and immune cells (particularly macrophages) within the TME, and potential interactions between disulfidptosis and other regulated cell death pathways such as ferroptosis are still poorly understood. To address these gaps, we integrated multi-omics data from multiple HCC cohorts. We combined the gene sets encompassing disulfidptosis-related genes. Significantly co-expressed lncRNAs screened by this analysis were used to classify molecular subtypes through non-negative matrix factorization (NMF). Distinct disulfidptosis-associated subtypes were thus identified. We then applied single-cell scoring algorithms to single-cell RNA sequencing (scRNA-seq) data to quantify disulfidptosis and ferroptosis phenotypes at single-cell resolution. We also employed systematic cell-cell communication analysis to map the signaling network between high-risk tumor cells and immune components, particularly M2 macrophages. This comprehensive framework aims to delineate the unique immunometabolic niche orchestrated by disulfidptosis and to elucidate its intricate interplay with ferroptosis, establishing a foundational understanding of their collective role in driving tumor progression and shaping therapeutic responses.
RNA sequencing data and corresponding clinical information were obtained from
TCGA-LIHC (n = 315). scRNA-seq data for [20] samples were obtained from GSE189903
and GSE242889. Samples lacking survival information or with a survival duration
of
Disulfidptosis-related gene set compiled from the literatures were integrated
and defined as disulfidptosis feature genes (DFGs) and part of the gene set
participating in cellular uptake and regulation of the actin cytoskeleton. The
RNA-seq expression matrix was subsequently divided into mRNA and lncRNA
expression matrices. LncRNAs co-expressed with DFGs were selected based on
Pearson correlation coefficients (
Unsupervised clustering of TCGA-LIHC samples was performed with the non-negative matrix factorization (NMF) algorithm through the DFG-associated lncRNA expression matrix. NMF is a clustering method widely used for cancer molecular subtyping using gene expression data. This study uses the NMF algorithm to distinctly categorize disulfide death subtypes and analyzes their biological traits. Some categories prominently display disulfide death characteristics, while others are compared to the core subgroup from various perspectives. Kaplan-Meier survival curves were generated to assess the prognostic significance of identified subtypes.
A disulfidptosis score (Dis-score) was constructed via PCA utilizing DFGs. To
verify the stability of NMF clustering results under data sampling variation,
Bootstrap resampling combined with a multi-dimensional stability index was used
for quantitative analysis. Based on the pre-processed lncRNA expression matrix
(no missing values, all positive, filtered low expression features) and the
optimal clustering rank (rank = 3, corresponding to C1, C2, and C3 subtypes),
1000-fold re-sampling was performed, with a subset of samples consistent with the
original sample size extracted each time. For each resampling subset, the Brunet
algorithm was used to perform NMF clustering (each clustering was repeated three
times to avoid a local optimal solution), and the sample clustering label and
consensus matrix were recorded. The core stability index was further calculated:
Adjusted Rand Index (ARI) between iterations was used to quantify the similarity
of any two resampled clustering structures (range –1~1, ARI
Gene Set Variation Analysis (GSVA) was employed to identify pathway disparities across subtypes. Metabolic activity scores were predicted for each sample with the “METAFlux” R package, as described previously. After downloading the HALLMARK_HYPOXIA gene set, the hypoxia score was calculated using ssGSEA.
The immune microenvironment was assessed through multiple approaches. The proportions of 18 T-cell subsets and six additional immune cell types (B cells, NK cells, monocytes, macrophages, neutrophils, dendritic cells) were estimated using the ImmuneCellAI algorithm. The meta-server TIP (Tracking Tumor Immunophenotype) integrates “ssGSEA” and “CIBERSORT” algorithms. It was used to analyze and evaluate the anti-cancer immune status in the three HCC subtypes, as well as the proportion of tumor-infiltrating immune cells in the seven-step cancer immune cycle.
In the two-stream death subtype, the phenotypic matrix composed of “OS Status”, “OS Time”, “B Cell”, “Dis-score”, “Tregs”, and “Macrophages” was combined with DFGs with significantly expressed lncRNAs to construct an expression matrix for weighted gene co-expression network analysis (WGCNA). This was used to detect co-expression relationships between multiple nodes.
Based on transcriptome data from TCGA-LIHC, we collected clinical information and multiple immune index data from different samples, including: (1) immune cell infiltration level (B cell, M1/M2 macrophages, neutrophils, and NK cell abundance as estimated by the QUANTISEQ method); (2) expression of immune checkpoint molecules (e.g., ICB-CD274, ICB-CTLA4); (3) immune-escape related score (TIDE, Dysfunction, Exclusion). Missing values in continuous variables were filled by medians, and samples with missing categorical variables were excluded. Spearman’s rank correlation analysis was used to evaluate the correlation strength between Dis-score and immune indexes, and the correlation coefficient (r) and significance (p-value) were calculated.
Three datasets of scRNA-seq raw data obtained from the GEO database were processed using the Seurat package (v4.3.0). The details for data preprocessing, including quality control (QC), normalization, selection of highly variable genes, and annotation are as follows:
(1) Raw Data Quality Control: To exclude low-quality cells, empty droplets, and
cell aggregates, cells were filtered based on the number of detected genes per
cell between 200 and 6000, and mitochondrial gene proportion
(2) Normalization, Data integration, and Dimensionality Reduction: SCTransform was applied for variance stabilization transformation, and simultaneous batch effect removal. To further eliminate technical variation across multiple samples, data integration was performed using the Harmony algorithm (v0.1.1). Following preprocessing, PCA was conducted based on highly variable genes.
(3) Cell Clustering: The first 16 principal components were used to construct a shared nearest neighbor (SNN) graph. Cell clustering was performed using the Louvain algorithm with a resolution parameter set to 0.4. Non-linear dimensionality reduction was achieved via Uniform Manifold Approximation and Projection (UMAP) for the visualization of clustering results.
(4) Cell Annotation: Cell type annotation was performed according to the expression patterns of canonical marker genes: epithelial cells (EPCAM, KRT19) [21], T cells (CD3D, CD3E), B cells (CD79A, MS4A1), myeloid cells (CD68, CD163), endothelial cells (PECAM1, VWF), and fibroblasts (COL1A1, ACTA2) [21, 22, 23].
To quantify the potential disulfidptosis status of tumor cells in HCC at the single-cell level, we constructed a scoring model based on gene characterization. First, we selected 15 genes explicitly associated with the core process of disulfidptosis based on published literature. These covered several key aspects, such as cystine uptake, cytoskeletal rearrangement, and metabolic adaptation (Table 1). The standard procedure for the R package “Seurat” was used to extract all annotated tumor cells (2238 in total) from the integrated single-cell data for subsequent analysis. For each tumor cell, the average Z-score for the expression of these 15-disulfidptosis-related genes was calculated at the cellular level. This was defined as the raw disulfidptosis death score of the cell. Prior to the calculation, all genes were normalized for overall expression levels within the tumor cell population.
| Biological processes | Gene symbol | Mechanism | Diff-expression |
| Disulfidptosis directly related genes | SLC7A11 | Cystime transport related. | Up |
| Disulfidptosis directly related genes | SLC3A2 | Cystime transport related. | Up |
| Disulfidptosis directly related genes | SLC2A1 (GLUT1) | Glucose metabolism is associated with NADPH depletion. | Up |
| Disulfidptosis directly related genes | G6PD | Glucose metabolism is associated with NADPH depletion. | Up |
| Disulfidptosis directly related genes | GLUD1 | Glucose metabolism is associated with NADPH depletion. | Down |
| Disulfidptosis directly related genes | ACTB | Disulfide bond formation and actin skeleton regulation. | Up |
| Disulfidptosis directly related genes | FLNA (Filamim A) | Disulfide bond formation and actin skeleton regulation. | Up |
| Disulfidptosis directly related genes | NCKAP1 | Disulfide bond formation and actin skeleton regulation. | Up |
| Disulfidptosis directly related genes | WASF2 (WAVE2) | Disulfide bond formation and actin skeleton regulation. | Up |
| Disulfidptosis directly related genes | RACi | Disulfide bond formation and actin skeleton regulation. | Up |
| Disulfidptosis directly related genes | TXNRD1 | Process regulation and signalingpathways. | Up |
| Disulfidptosis directly related genes | ATF4/CHOP | Process regulation and signalingpathways. | Up |
| Disulfidptosis directly related genes | NFATC1 | Process regulation and signalingpathways. | / |
| Disulfidptosis directly related genes | NDUFA11 | Affect NADH metabolism. | Up |
| Disulfidptosis directly related genes | NDUFSI | Affect NADH metabolism. | / |
| Disulfidptosis directly related genes | RPN1 | Involved im endoplasmic reticulum protein processing. | Up |
| Actim and cytoskeleton protein regulation | FLNA | Actim core component and skeleton cross-limked protein. | Up |
| Actim and cytoskeleton protein regulation | MYH9 | Actim core component and skeleton cross-limked protein. | Up |
| Actim and cytoskeleton protein regulation | ACTN1/ACTN4 | Actim core component and skeleton cross-limked protein. | Up |
| Actin proteim regulation | WASF2 | Actim polymerization and branch regulation. | Up |
| Actin proteim regulation | ARPC2/ARPC3/ARPC1A | Actim polymerization and branch regulation. | Up |
| Actin proteim regulation | DIAPH1 | Actim polymerization and branch regulation. | Up |
| Actin proteim regulation | RHOA/CDC42 | Rho GTPase pathway. | Up |
| Actin proteim regulation | ROCK1/PAK1 | Rho GTPase pathway. | Up |
| Actin proteim regulation | CFL1 | Actin dynamic regulatory protein. | Up |
| Actin proteim regulation | GSN | Actin dynamic regulatory protein. | Up |
| Actin proteim regulation | PFN1 | Actin dynamic regulatory protein. | Up |
| Actin proteim regulation | CAPZB | Actin dynamic regulatory protein. | Up |
| Aytoskeleton proteim regulation | VCL | Membrane-skeleton junction and adhesion proteins. | Up |
| Aytoskeleton proteim regulation | EZRRDXMSN | Membrane-skeleton junction and adhesion proteins. | Up |
| Aytoskeleton proteim regulation | ITGB1/ITGA5 | Membrane-skeleton junction and adhesion proteins. | Up |
| Other | IM1 | Other key regulatory factors. | Up |
| Other | MSB4X (Thymosim |
Other key regulatory factors. | Up |
| Other | CYFIP1 | Other key regulatory factors. | Up |
| Other | FMNL1 | Other key regulatory factors. | Up |
| Other | DOCK1 | Other key regulatory factors. | Up |
| Other | IQGAP1 | Other key regulatory factors. | Up |
Using the disulfidptosis phenotype of HCC tumor cells as the primary grouping criterion, we systematically characterized the metabolic reprogramming features of high/low-disulfidptosis score tumor cells across energy metabolism, biosynthesis, and antioxidant regulation. We constructed nine key metabolic pathway gene sets spanning three functional modules: energy metabolism (glycolysis, oxidative phosphorylation, tricarboxylic acid cycle), biosynthesis (pentose phosphate pathway, fatty acid metabolism, amino acid metabolism), and redox balance (glutamine metabolism, antioxidant system, disulfidptosis-related metabolism). The average expression of each metabolic pathway gene set was calculated and normalized, and Z-scores were applied to derive normalized metabolic pathway scores. Student’s t-test was used to compare pathway scores and compute fold changes between high- and low-risk groups, while the Wilcoxon rank-sum test was used to determine statistical significance. Heatmap visualization, cluster analysis, and functional grouping were integrated to comprehensively examine the significantly altered metabolic pathways.
Macrophage subsets were extracted from the total cell population for secondary clustering analysis. Three core subsets were defined based on the expression of characteristic markers: M1 macrophages (high expression of NOS2, CD80, CD86), M2 macrophages (high expression of CD163, MRC1, MS4A4A), and monocytes (high expression of CD14, FCGR3A).
Single-cell differentiation trajectories were constructed using the Monocle3 package (v1.3.4) with the following workflow: Seurat objects were converted to CellDataSet objects, followed by preprocessing and dimensionality reduction based on highly variable genes; UMAP was then used for non-linear dimensionality reduction, and cell states were identified via Louvain clustering; finally, monocytes were selected as the trajectory starting point, and pseudotime values were calculated using the order_cells function. Pearson correlation analysis was performed to evaluate the dynamic expression of disulfidptosis-related genes along pseudotime, and the statistical significance of correlation coefficients was tested.
To decipher cellular crosstalk between “High-Disulf tumor cells and M2
macrophages” in the HCC TME, we employed the CellChat package integrated with
the human CellChatDB database to reconstruct communication networks. We
specifically focused on interaction networks between tumor cells with high
disulfidptosis risk and M2 macrophages. To systematically characterize
directional interactions, five core functional communication axes and their
corresponding ligand–receptor pair databases were predefined, encompassing
recruitment and polarization, survival support, stress regulation, metabolic
crosstalk, and promotion of invasion. Using communication probability (prob) as
the core metric, interaction pairs within each axis were ranked in descending
order of probability. The average probability, maximum probability, and number of
interactions per axis were computed. One-way ANOVA was applied to assess
differences in communication strength across axes, with a significance threshold
of p
A ferroptosis score was constructed based on a functionally validated 10-gene signature derived from previous studies. This encompassed core antioxidant regulators (GPX4, SLC7A11, FSP1, NRF2), iron metabolism-related genes (TFRC, FTH1), a lipid metabolism regulator (ACSL4), an inflammation-associated gene (PTGS2), and signaling mediators (STAT3, CD44). All genes were stably detected in the current dataset. The ssGSEA algorithm and parameters identical to those used for disulfidptosis scoring (implemented via the GSVA package) were applied to compute ferroptosis scores at the cell level, with normalized enrichment score (NES) values serving as the final quantitative metric, ensuring comparability between the two scoring systems.
Pearson correlation analysis was conducted to assess the linear relationship between disulfidptosis and ferroptosis scores in the tumor cell population. Within the M2 macrophage subpopulation—a core functional subset—the disulfidptosis score was further decomposed into three phases: Stage1 (DiSulfide_Stress), Stage2 (Core_Regulation), and Stage3 (Downstream_Execution). Pearson correlation analysis and correlation strength difference tests (Z-test) were subsequently performed between each phase-specific score and the ferroptosis score. One-way ANOVA was used to compare the overall distribution of ferroptosis scores across four groups: tumor cells, M1 macrophages, M2 macrophages, and monocytes.
To elucidate the significant positive correlation observed between the two scores in M2 macrophages, we introduced key intersection genes involved in both ferroptosis and disulfidptosis: RAC1, GPX4, NRF2, and SLC7A11. Among these, NRF2 and SLC7A11 were considered potential upstream regulators in a ternary correlation analysis. Pairwise correlation coefficients were computed for all gene pairs, and partial correlation analysis was performed using the ppcor package (v1.1).
For experimental verification of the co-expression axis, samples of tissue sections from 49 patients with primary HCC were collected at the First Affiliated Hospital of Anhui Medical University from 2023 to 2025. Multiplex immunofluorescence staining was performed to validate enhanced GPX4-RAC1 co-localization in M2 macrophages (CD68+, CD163+) versus other subsets, supporting their co-regulatory function.
Samples from the TCGA database with complete survival data (overall survival time and status) and GPX4/RAC1 expression values were included in the analysis. GPX4 and RAC1 expression levels were quantified using normalized transcriptomic data. The co-expression score was calculated using PCA. The first principal component (PC1) derived from GPX4 and RAC1 expression values was used as an alternative co-expression metric. Kaplan-Meier survival curves were generated to compare overall survival (OS) between high and low co-expression groups, with the log-rank test employed to assess statistical significance. Univariate and multivariate Cox proportional hazards models were constructed to evaluate the prognostic value of GPX4–RAC1 co-expression. The multivariate model was adjusted for established clinical prognostic factors, including pTNM stage and tumor grade. Hazard ratios (HRs) with 95% confidence intervals (CIs) were reported. SCT-standardized GPX4 and RAC1 gene expression data at the single cell level were extracted for the identified M2 macrophage subsets. Pearson and Spearman correlation analyses were performed to assess the correlation strength and significance of gene expression. Scatter plots and linear fitting were used to visualize the correlation results and verify the robustness of the correlation.
All statistical analyses were performed using R software (v4.4.2). Wilcoxon
rank-sum test, or analysis of variance was selected for intergroup comparisons
based on data distribution characteristics and the homogeneity of variance test
results. Pearson or Spearman methods were used for correlation analysis. False
discovery rate (FDR) control was applied to correct for multiple comparisons.
Data visualization was performed using the ggplot2 package (v3.4.2), and network
visualization was achieved using the igraph package (v1.4.2). Statistical
significance was defined as p
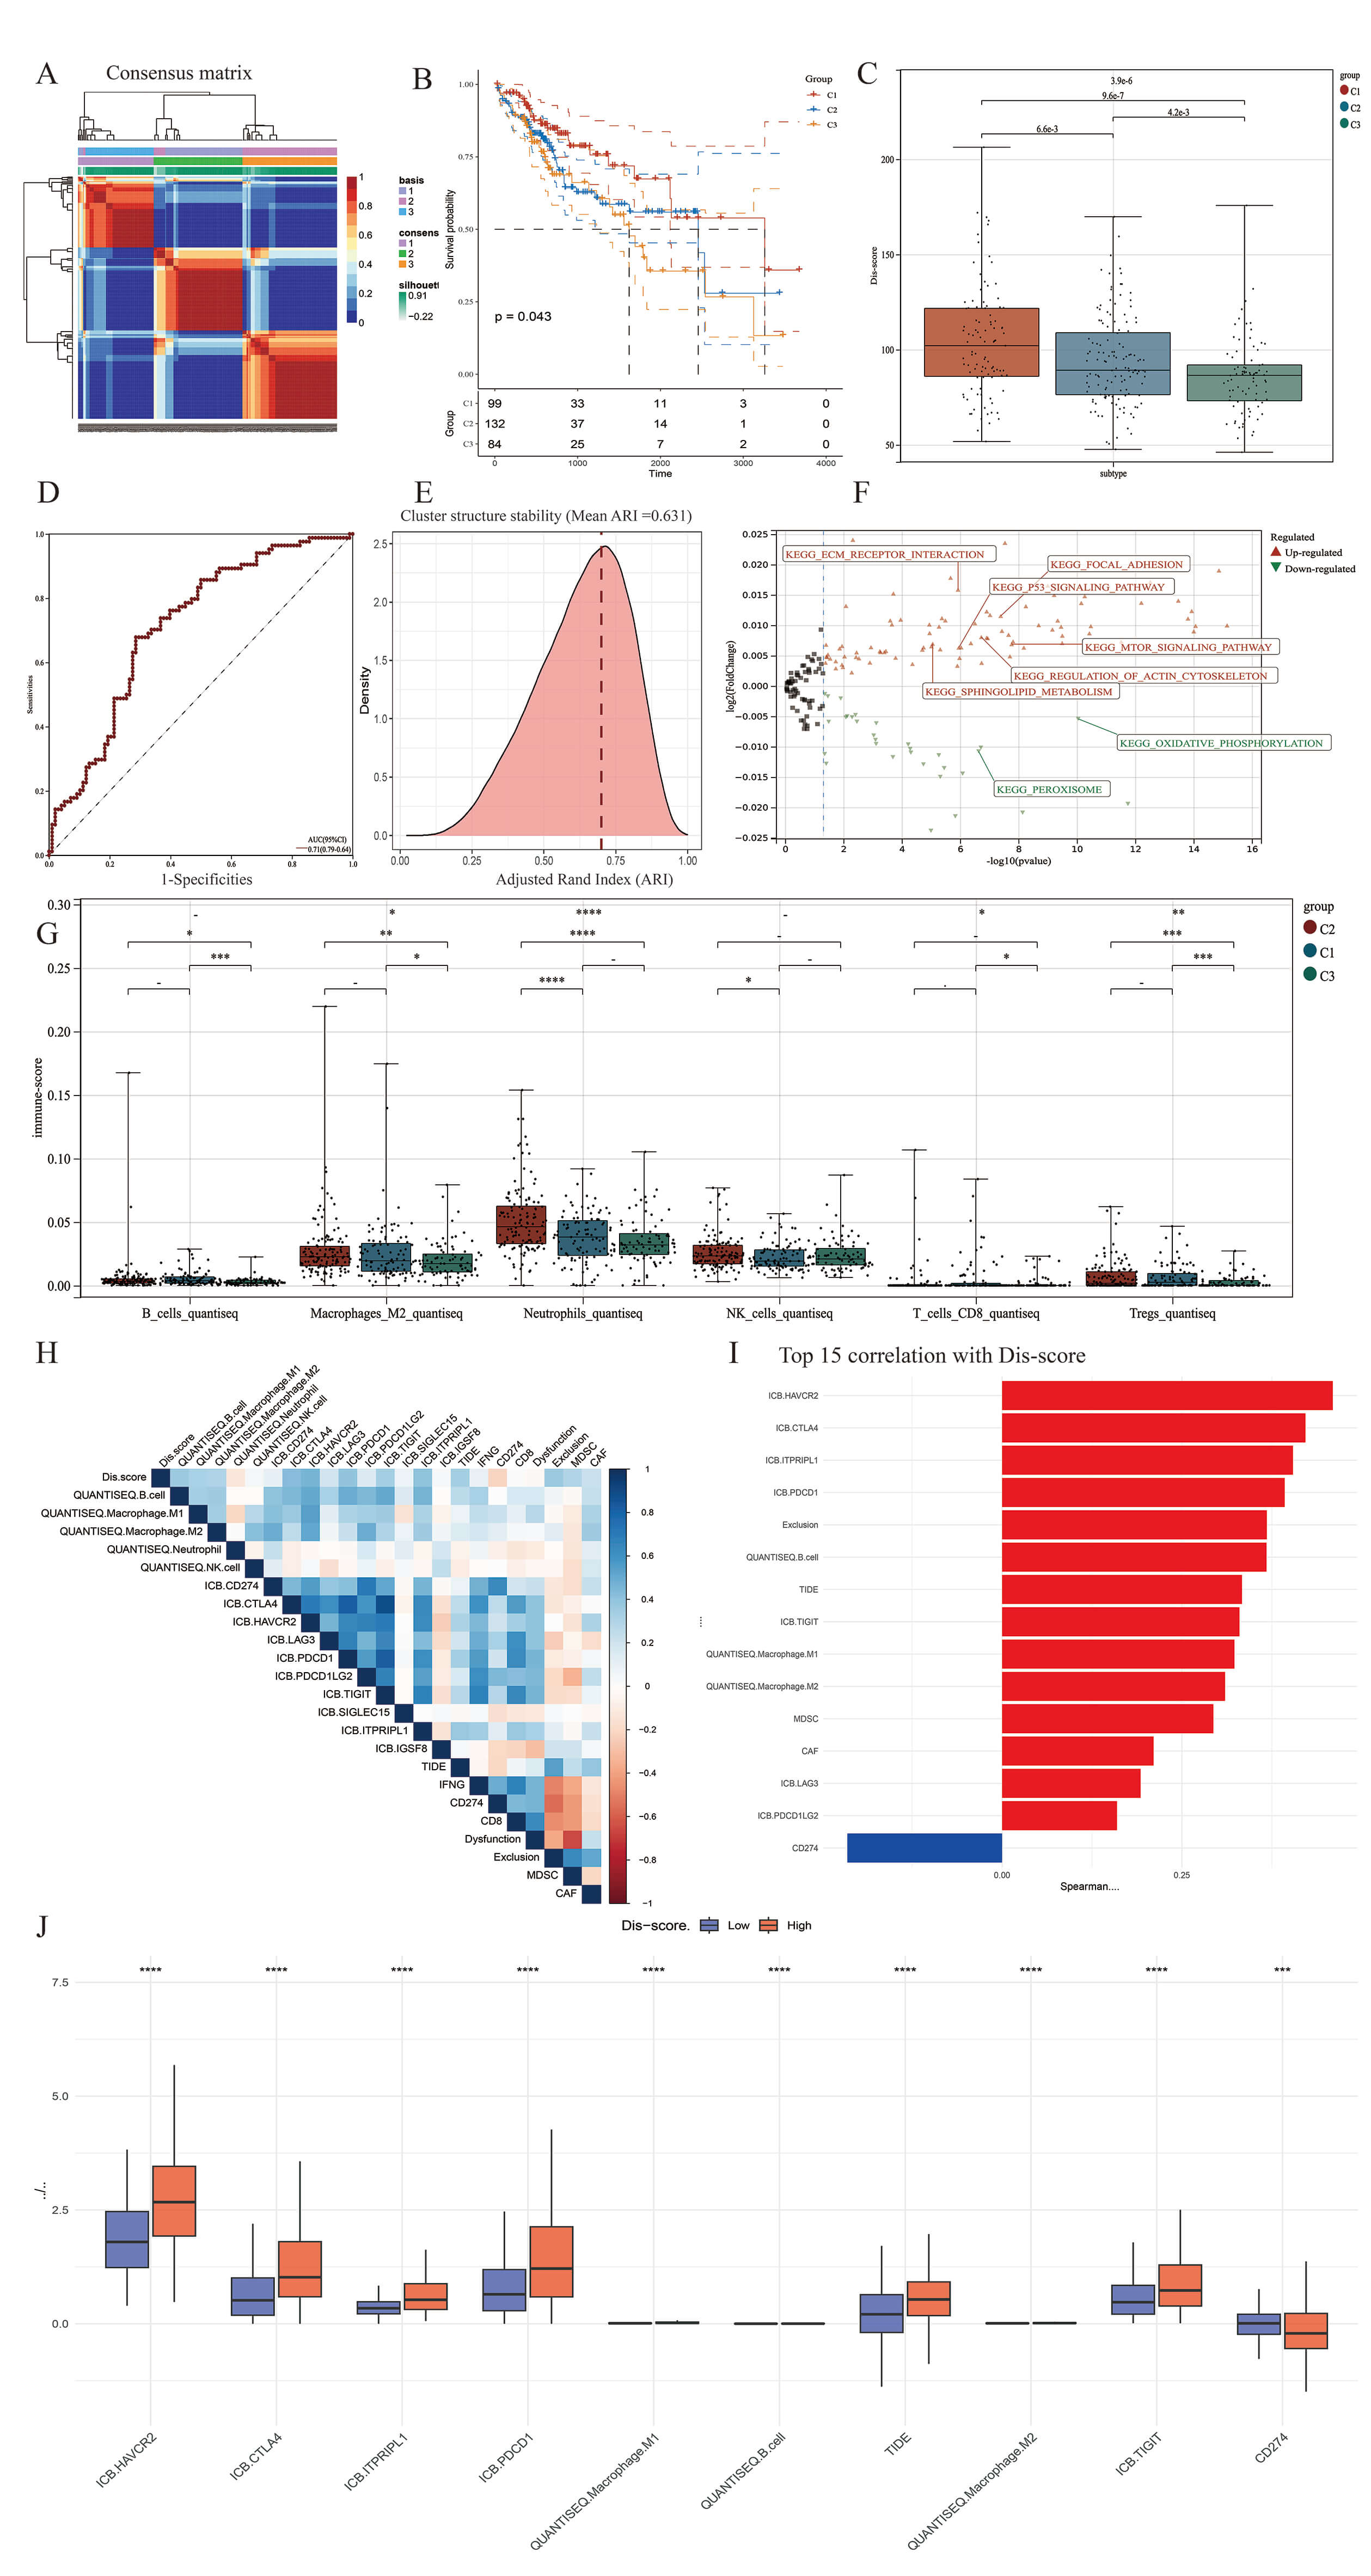
Through the integration of TCGA-LIHC transcriptomic data with an established set of DFGs (Table 1), 12 significantly correlated lncRNAs were identified using Pearson correlation coefficients (Supplementary Fig. 1). NMF clustering stratified patients into three subgroups: Subtype 1 (n = 99), Subtype 2 (n = 132), and Subtype 3 (n = 84) (Fig. 1A and Supplementary Fig. 1B). Subtype 1 exhibited significantly superior OS compared to Subtype 3 (p = 0.04), while Subtype 2 (intermediate) demonstrated intermediate prognosis (Fig. 1B). Analysis of the immune infiltration score revealed significant differences in the infiltration of myeloid cells (macrophages and neutrophils), B cells and T cells (CD8+ T cells and Tregs) between the three subtypes (Fig. 2E). With 1000 Bootstrap re-samplings performed, subset consistent with the original sample size were extracted each time. The ARI index shows the distribution characteristics of the similarity of cluster structures between any two resampling iterations, with an ARI range of –1 to 1. The closer to 1, the more consistent the clustering structure is indicated (the red dotted line in the figure represents the stability threshold of 0.7). The stability results of our classification show that the average ARI between iterations is 0.631 (Fig. 1E).
 Fig. 1.
Identification of HCC molecular subtypes based on DR-LncRNAs and
the construction of Dis-score. (A) Identification of three HCC subtypes based on
expression profiles of 12 DR-LncRNAs. Cophenetic correlation coefficient for k =
2–7 for the cohort. (B) Survival differences (OS) of three subtypes from TCGA
cohort. (C,D) Dis-score was constructed based on PCA algorithm. Dis-score in the
box plot was compared using the Wilcoxon test. And the area under curve (AUC) can
evaluate the model discrimination degree. AUC
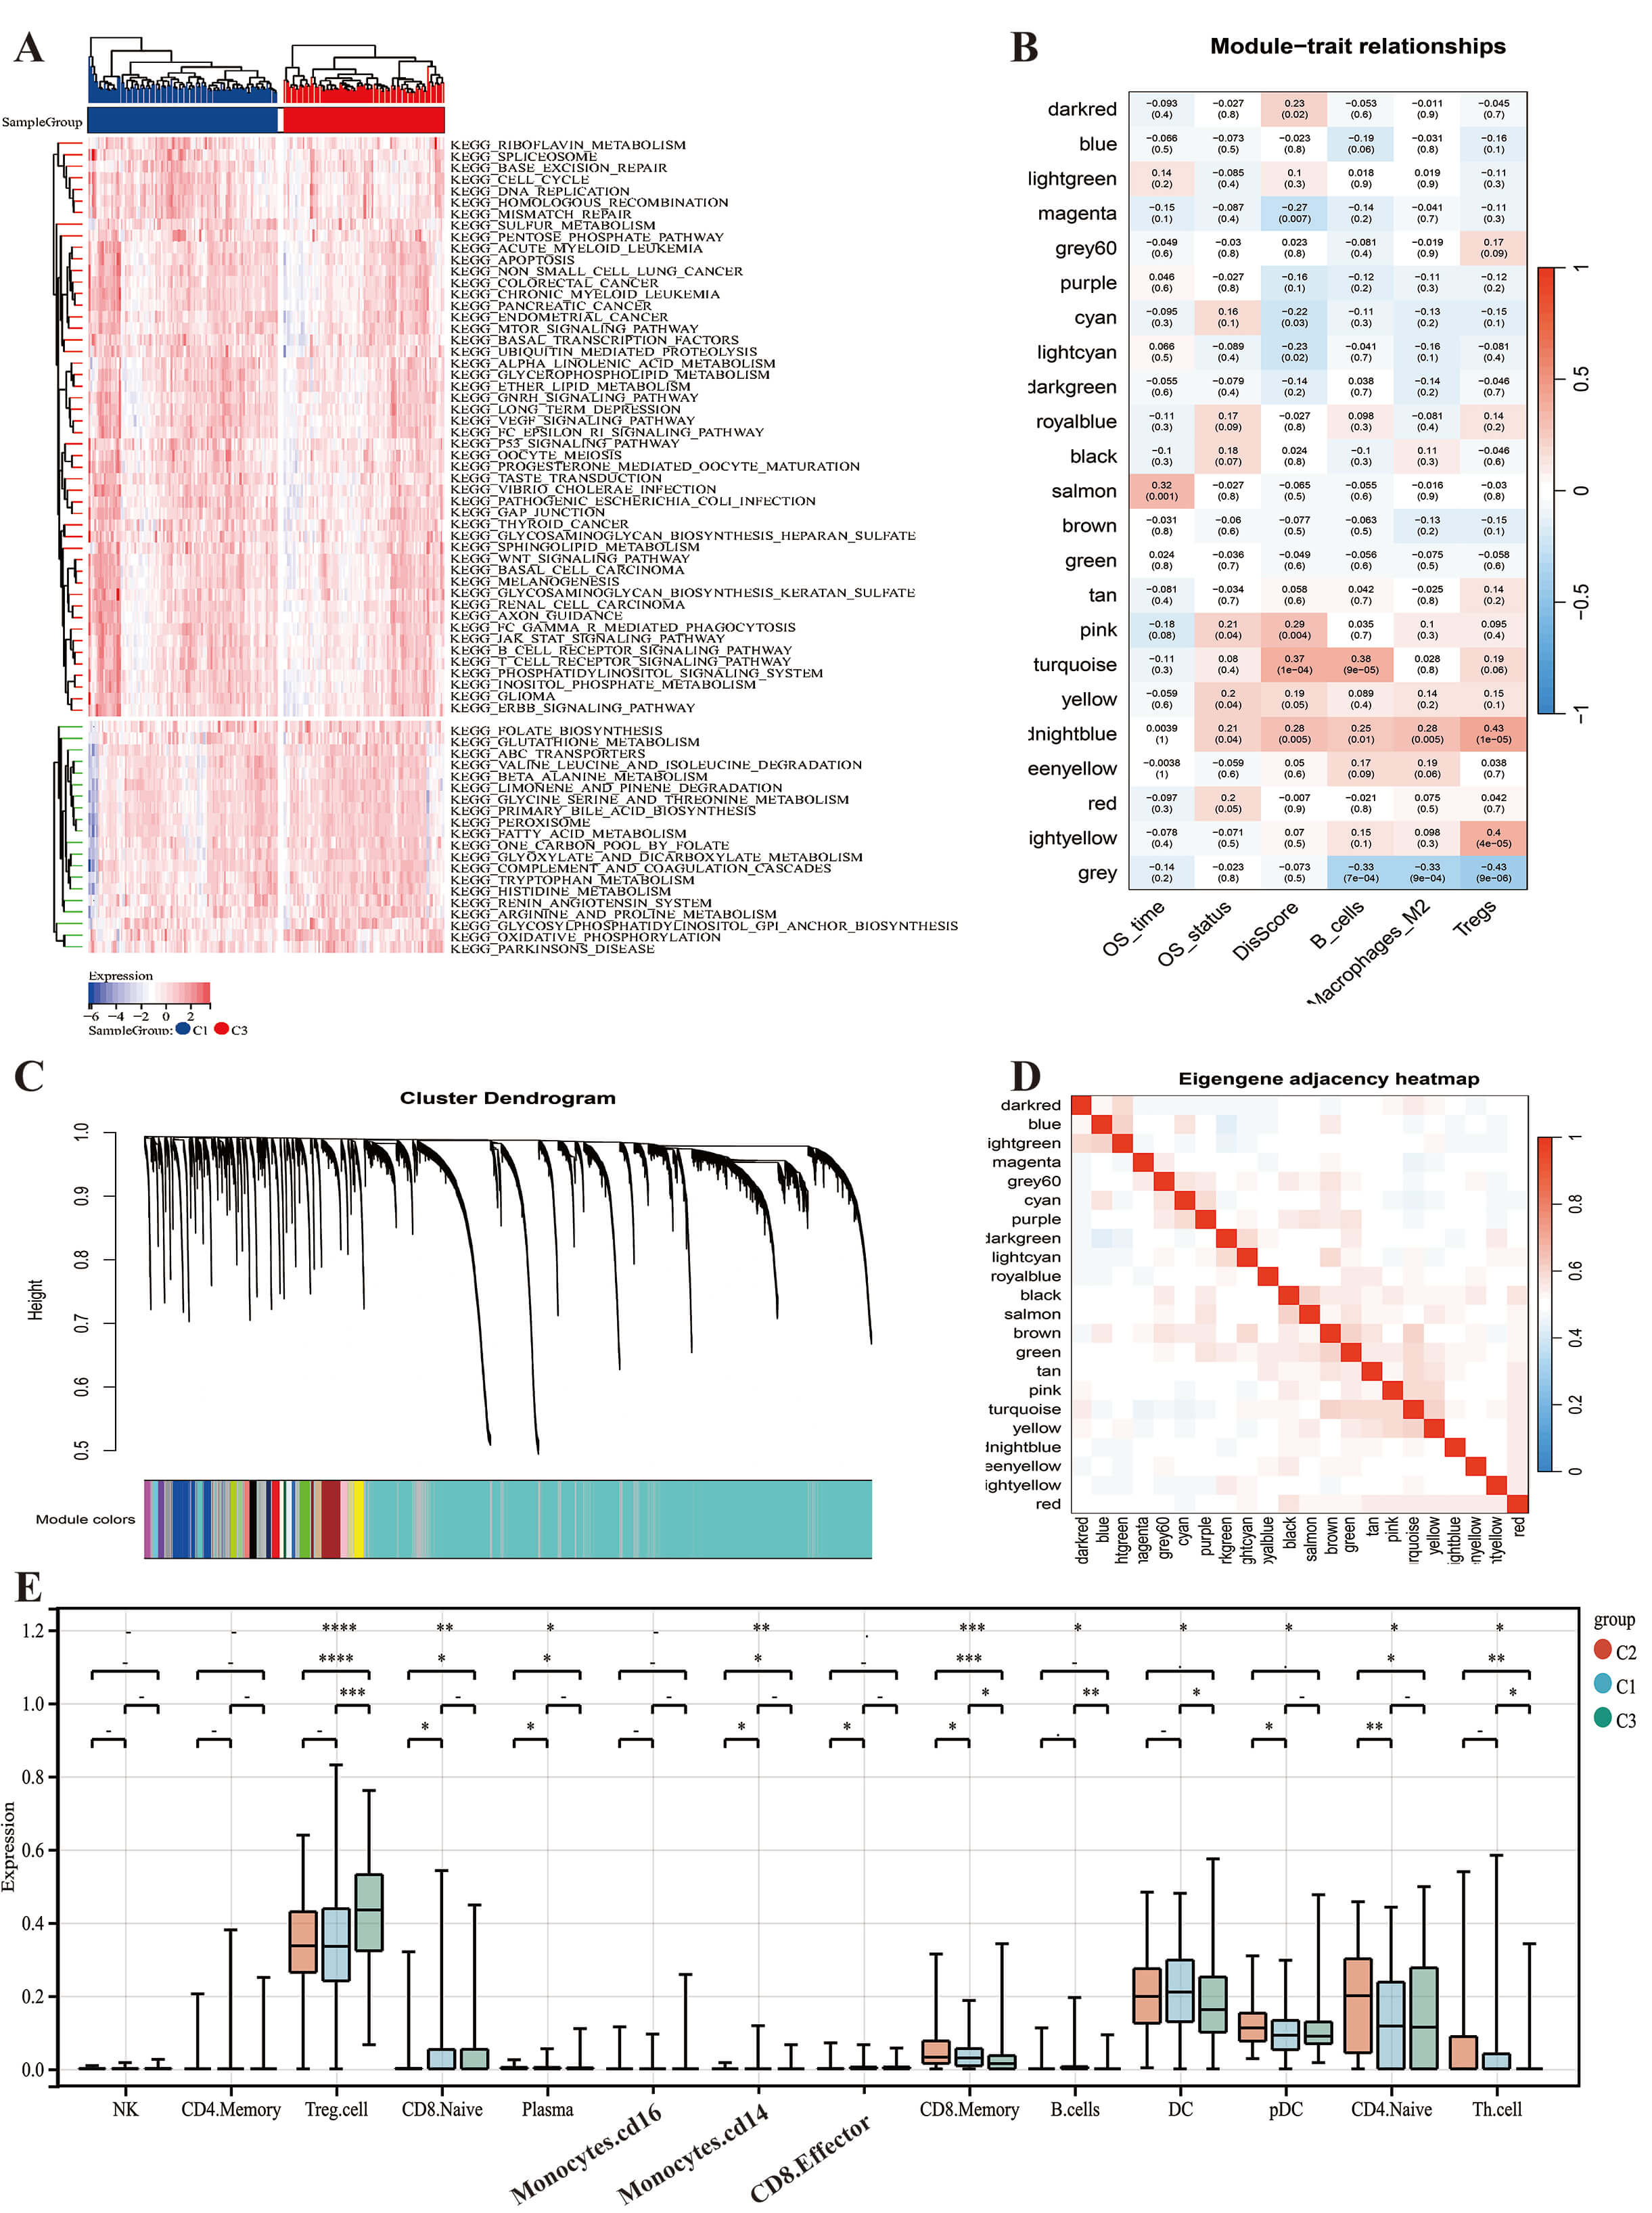 Fig. 2.
Differences in biological characteristics between disulfide-dead
subtype and disulfide-stable subtype. (A) Differentially expressed biological
pathways in disulfidptosis subtypes (KEGG database). (B–D) WGCNA analysis in the
disulfidptosis subtype. WGCNA co-expression network identified key modules based
on lncRNAs and disulfidptosis related genes. The clustered modules of WGCNA,
related to Dis-score, OS and macrophage M2. (B) Cluster trees corresponding to
Pearson-based WGCNA. (C) The hierarch clustering on the clinical features. (D)
Cell infiltration and all WGCNA modules. (E) Based on the Tip algorithm, the box
plot shows the expression differences of different immunotherapy response targets
between the three subtypes. *p
A composite scoring system (Dis-score) was derived via PCA of DFGs, with
principal component 1 (PC1) accounting for 68% of variance. The Dis-score was
significantly higher in Subtype 1 versus Subtype 3 (p-value = 9.6
Metabolomic validation revealed that Subtype 1 was enriched in glucose (log2FC = 3.1), glutamine (log2FC = 2.8), and Fe3+ (log2FC = 4.5), whereas Subtype 3 accumulated pyruvate (log2FC = –2.3) and acetate (log2FC = –1.9). This pattern reflects the reliance of Subtype 1 on the glycolysis-glutaminase axis to support NADPH regeneration (Supplementary Fig. 1E). KEGG pathway enrichment analysis revealed significant differences in pathway activities between Subtype 1 (Disulfidptosis subtype) and Subtype 3 (Stabilization subtype) (Fig. 2A). Subtype 1 showed marked enrichment in pathways related to extracellular matrix (ECM)-receptor interaction, focal adhesion, the p53 and mTOR signaling pathways, and regulation of the actin cytoskeleton. In contrast, Subtype 3 was characterized by significant enrichment in oxidative phosphorylation and peroxisome pathways. This indicates a shift toward efficient energy metabolism and redox homeostasis, which may contribute to stability and cell survival. The above findings highlight distinct molecular mechanisms underlying the two subtypes, with Subtype 1 favoring disulfidptosis through ECM and stress signaling activation, while Subtype 3 promotes cellular stability via metabolic conservation and antioxidant responses.
We next analyzed the co-expression relationship between DFGs and lncRNAs in HCC, as revealed by WGCNA (Fig. 2B–D). The turquoise module was found to contain most of the genes related to disulfidptosis, and showed a high correlation with the Dis-score (Fig. 2B). The midnight blue module contained 64 lncRNAs and showed significant positive correlations with the Dis-score, M2 macrophage infiltration, B cell infiltration, Treg cell infiltration, and survival status. Furthermore, there was little intersection between the midnight blue and turquoise modules (Fig. 2E).
scRNA-seq of tumor and adjacent non-tumor tissues from 21 HCC patients identified 58,842 cells (Fig. 3A–C) clustered into 9 major cell types (Fig. 3D,E). Standardized analysis was conducted using the Seurat package. Low-quality cells were eliminated through QC to ensure data reliability (Supplementary Fig. 2), and samples were successfully de-batched and merged based on harmony. Based on the results of PCA (Fig. 3A–C and Supplementary Fig. 3), the first 15 principal components were selected to construct a shared nearest neighbor (SNN) map between cells. The Louvain algorithm was used for cell clustering, with the resolution parameter set to 0.4 (Fig. 3D, Supplementary Fig. 4A,B). Finally, 9 cell types with a clear boundary and uniform internal structure were obtained by clustering and annotation (Fig. 3E, Supplementary Fig. 4C,D). Markers used in the annotation process showed significant expression distribution (Supplementary Fig. 5).
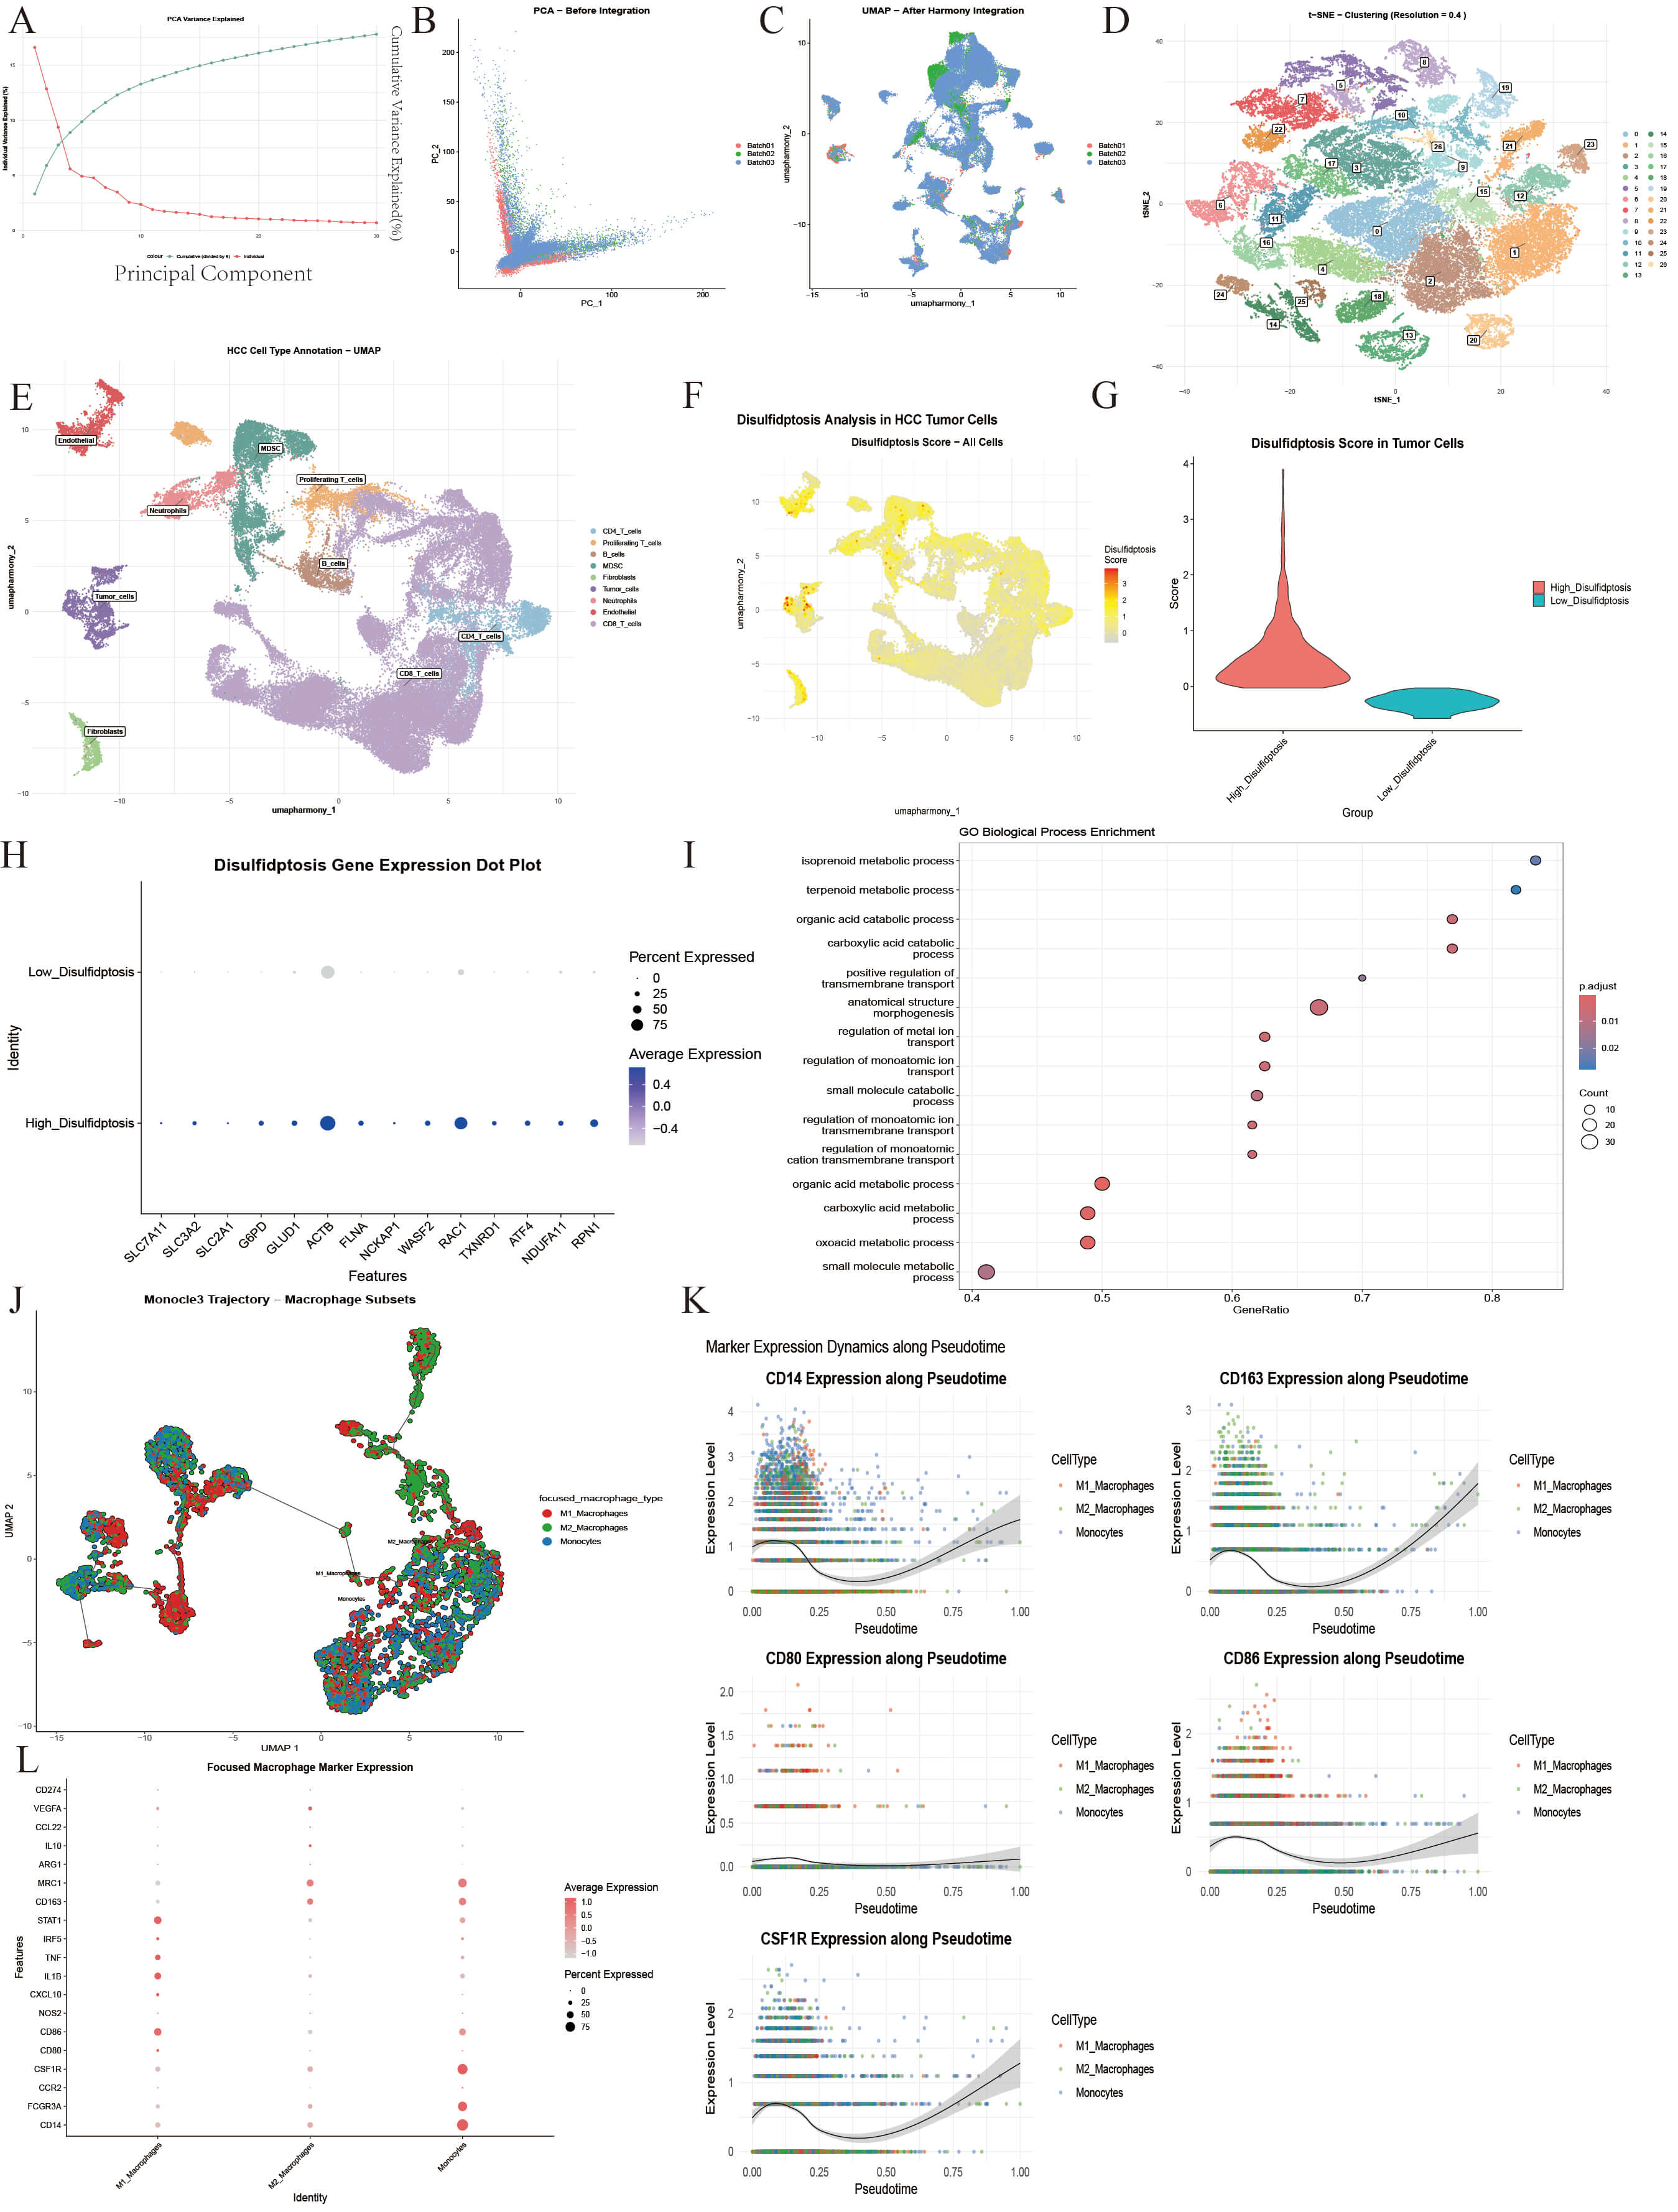 Fig. 3.
Identification of cell clusters and analysis of cell population characteristics. (A–C) The PCA algorithm is used to reduce the dimension of the data, and then the harmony algorithm is used to remove the batch effect. (D,E) UMAP dimensionality reduction clustering was performed on 21 amples from GEO database, and 9 kinds of cell subsets were obtained. (F) The UMAP showed the intensity of disulfidptosis scores in cell levels in HCC tissues. (G) The violin plot showed the difference in the distribution of disulfidptosis scores after tumor cell grouping. (H) The bubble diagram representeed the difference in the expression of core genes between different tumor cell populations in tumor tissues. (I) The enrichment analysis result of differential genes obtained between high and low score groups. (J) Subpopulation and monocle analysis of MDCSs. (K) Monocle analysis of the top 5 significantly differentially expressed genes in pseudo-time. (L) The distribution of marker expression between different cell subsets. PCA, principal component analysis; UMAP, Uniform Manifold Approximation and Projection.
Using tumor-specific markers (high EPCAM expression and exclusion of
normal epithelial traits), 2238 pure tumor cells were analyzed for disulfide
death correlation. Of 15 related genes, 14 were detectable, except CHOP
(Fig. 3H and Supplementary Fig. 6A). Disulfide death scores were calculated using
ssGSEA, with the median (–0.03) dividing cells into high (1119 cells) and low
(1119 cells) score groups (Fig. 3G). Enrichment analysis of the differentially expressed genes revealed changes in metabolism and transmembrane transport (Fig. 3I). UMAP visualization showed these groups were
spatially scattered and interwoven, indicating that disulfide death heterogeneity
is not directly linked to cell clustering but may reflect tumor cell adaptation
to the microenvironment (Fig. 3F). Differential expression analysis was conducted
on these groups (FDR
To further analyze the differentiation potential and functional heterogeneity of
macrophage subsets in myeloid cells, a focused analysis was performed based on
the bone marrow-derived suppressor cell (MDSC) population. In total, 5806 related
cells were included. Subgroup segmentation and in-depth characterization were
performed by combining marker gene integrity with the scoring model. With the
core marker gene set expression and function score, the macrophage-related cells
in the MDSC population were divided into three categories: M1 macrophages (n =
1980, 34.1%), M2 macrophages (n = 2237, 38.5%), and monocytes (n = 1589,
27.4%) (Fig. 3J–L). In the early stage of pseudo-time (Supplementary
Fig. 7A–D), the cells showed high expression of the monocyte marker
CD14. The middle stage showed enrichment with M1 macrophages (high
expression of CD86) and M2 macrophages (high expression of
CD163) (Fig. 3K and Supplementary Fig. 7H). Timing analysis of
core genes showed that the key ferroptosis gene GPX4 was synergistically
up-regulated with the disulfide death regulatory gene RAC1 (pseudo time
0.00
From the complete data set (58,842 cells), the core cell population was
subjected to directional filtering. This resulted in 1119 high-disulfide tumor
cells and 2237 M2 macrophages, giving rise to a total of 3356 cells for
communication analysis (Fig. 4A,B). Three groups of secretory signal
communication pairs with relative intensity differences were detected in the
M2
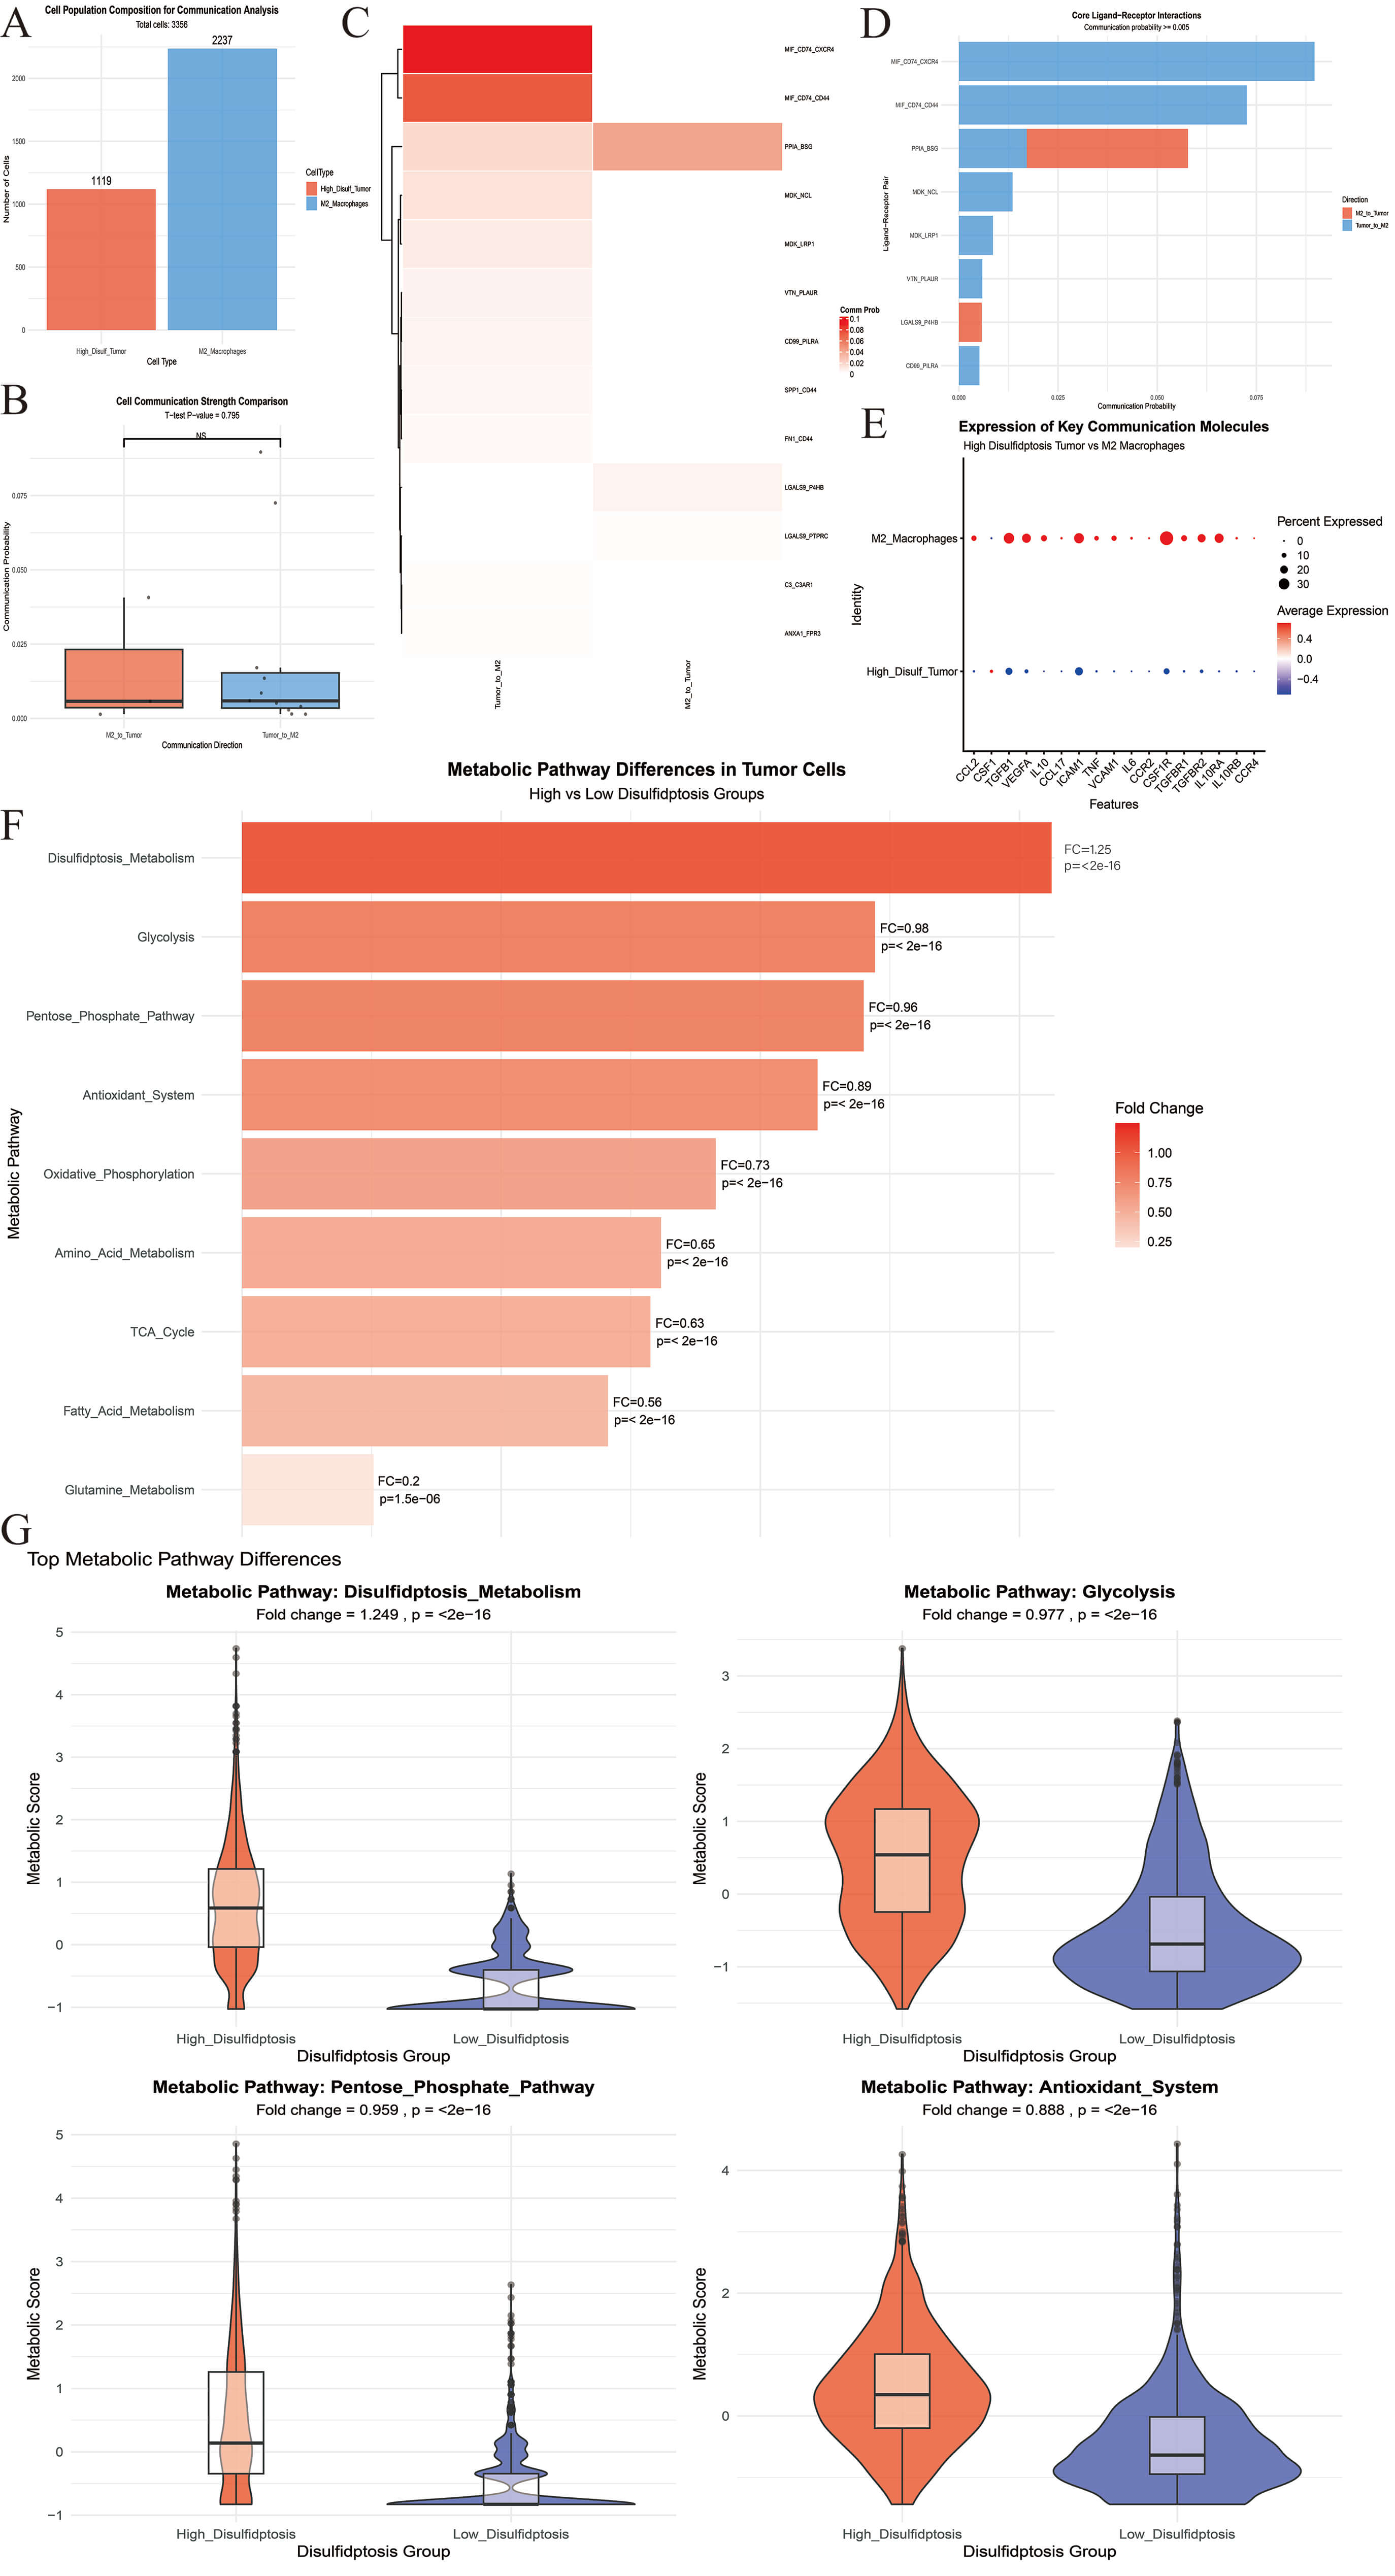 Fig. 4.
Multi-dimensional characteristics analysis between M2 macrophages and tumor cell subsets. (A) Tumor cells and M2 macrophages were included in the analysis. (B) The intensity of the bidirectional interaction between M2 macrophages and tumor cells was compared. (C) The heat map illustrated the interaction intensity between the two cell types in various directions. (D) The histogram indicated the top eight signaling axes in terms of the total interaction intensity between the two cell types. (E) The expression levels of key receptor and ligand genes across different cell populations were examined. (F) Differentially expressed metabolic-related biological processes were identified in tumor cell populations characterized by disulfide-induced cell death. (G) The top four differential metabolic processes were presented. NS, no significance.
We next analyzed the 2238 pure tumor cells (1119 High-Disulf group cells and
1119 Low-Disulf group cells) that had previously been rigorously filtered.
Focusing on the core dimensions of “energy metabolism-biosynthesis-antioxidant
regulation”, feature gene sets were constructed for 9 classical metabolic
pathways (Table 2 and Fig. 4F). Each of these pathways showed significant
differences between High- and Low-Disulf tumor cells (all pathways p
| Metabolism related processes | Related genes | Fold change (high-low) | p |
| Disulfidptosis_metabolism | SLC7A11, SLC3A2, GLUD1, G6PD, RAC1 | 1.25 | |
| Glycolysis | HK2, PFKP, ALDOA, GAPDH, PKM, LDHA | 0.98 | |
| Pentose_phosphate_pathway | G6PD, PGD, TKT, TALDO1 | 0.96 | |
| Antioxidant_system | GPX4, GPX1, CAT, SOD1, TXNRD1 | 0.89 | |
| Oxidative_phosphorylation | ATP5A1, COX5A, NDUFB8, SDHA | 0.73 | |
| Amino_acid_metabolism | SLC1A5, SLC7A5, SLC7A11, ASCT2 | 0.65 | |
| TCA_cycle | CS, ACO2, IDH1, OGDH, SDHA | 0.63 | |
| Fatty_acid_metabolism | ACSL1, ACSL4, FASN, CPT1A | 0.56 | |
| Glutamine_metabolism | GLS, GLUD1, GLUL, ASNS | 0.20 | 1.50 × 10⁻⁶ |
Specifically, all five core genes in the Disulfidptosis_Metabolism pathway (SLC7A11, SLC3A2, GLUD1, G6PD, RAC1) were highly expressed in the High-Disulf group, with SLC7A11, G6PD, and RAC1 showing the most pronounced upregulation. The remaining 8 pathways were downregulated to varying degrees, with glutamine metabolism showing the most significant downregulation. Although the Antioxidant System pathway was downregulated overall (FC = 0.89), core antioxidant genes GPX4 and TXNRD1 were highly expressed in the High-Disulf group (Fig. 4G and Supplementary Files).
The ferroptosis score exhibited a significant heterogeneous distribution across
different cell populations (Fig. 5G). The median ferroptosis score in the
High-Disulf group cells was significantly higher than in the Low-Disulf group
cells. Within other compartments, myeloid cells had the highest ferroptosis
score, followed by M1 macrophages (Fig. 5A–E). The disulfidptosis score was
divided into three stages and subsequently correlated with the ferroptosis score
(Fig. 5F). All three stages showed significant positive correlations (all
p
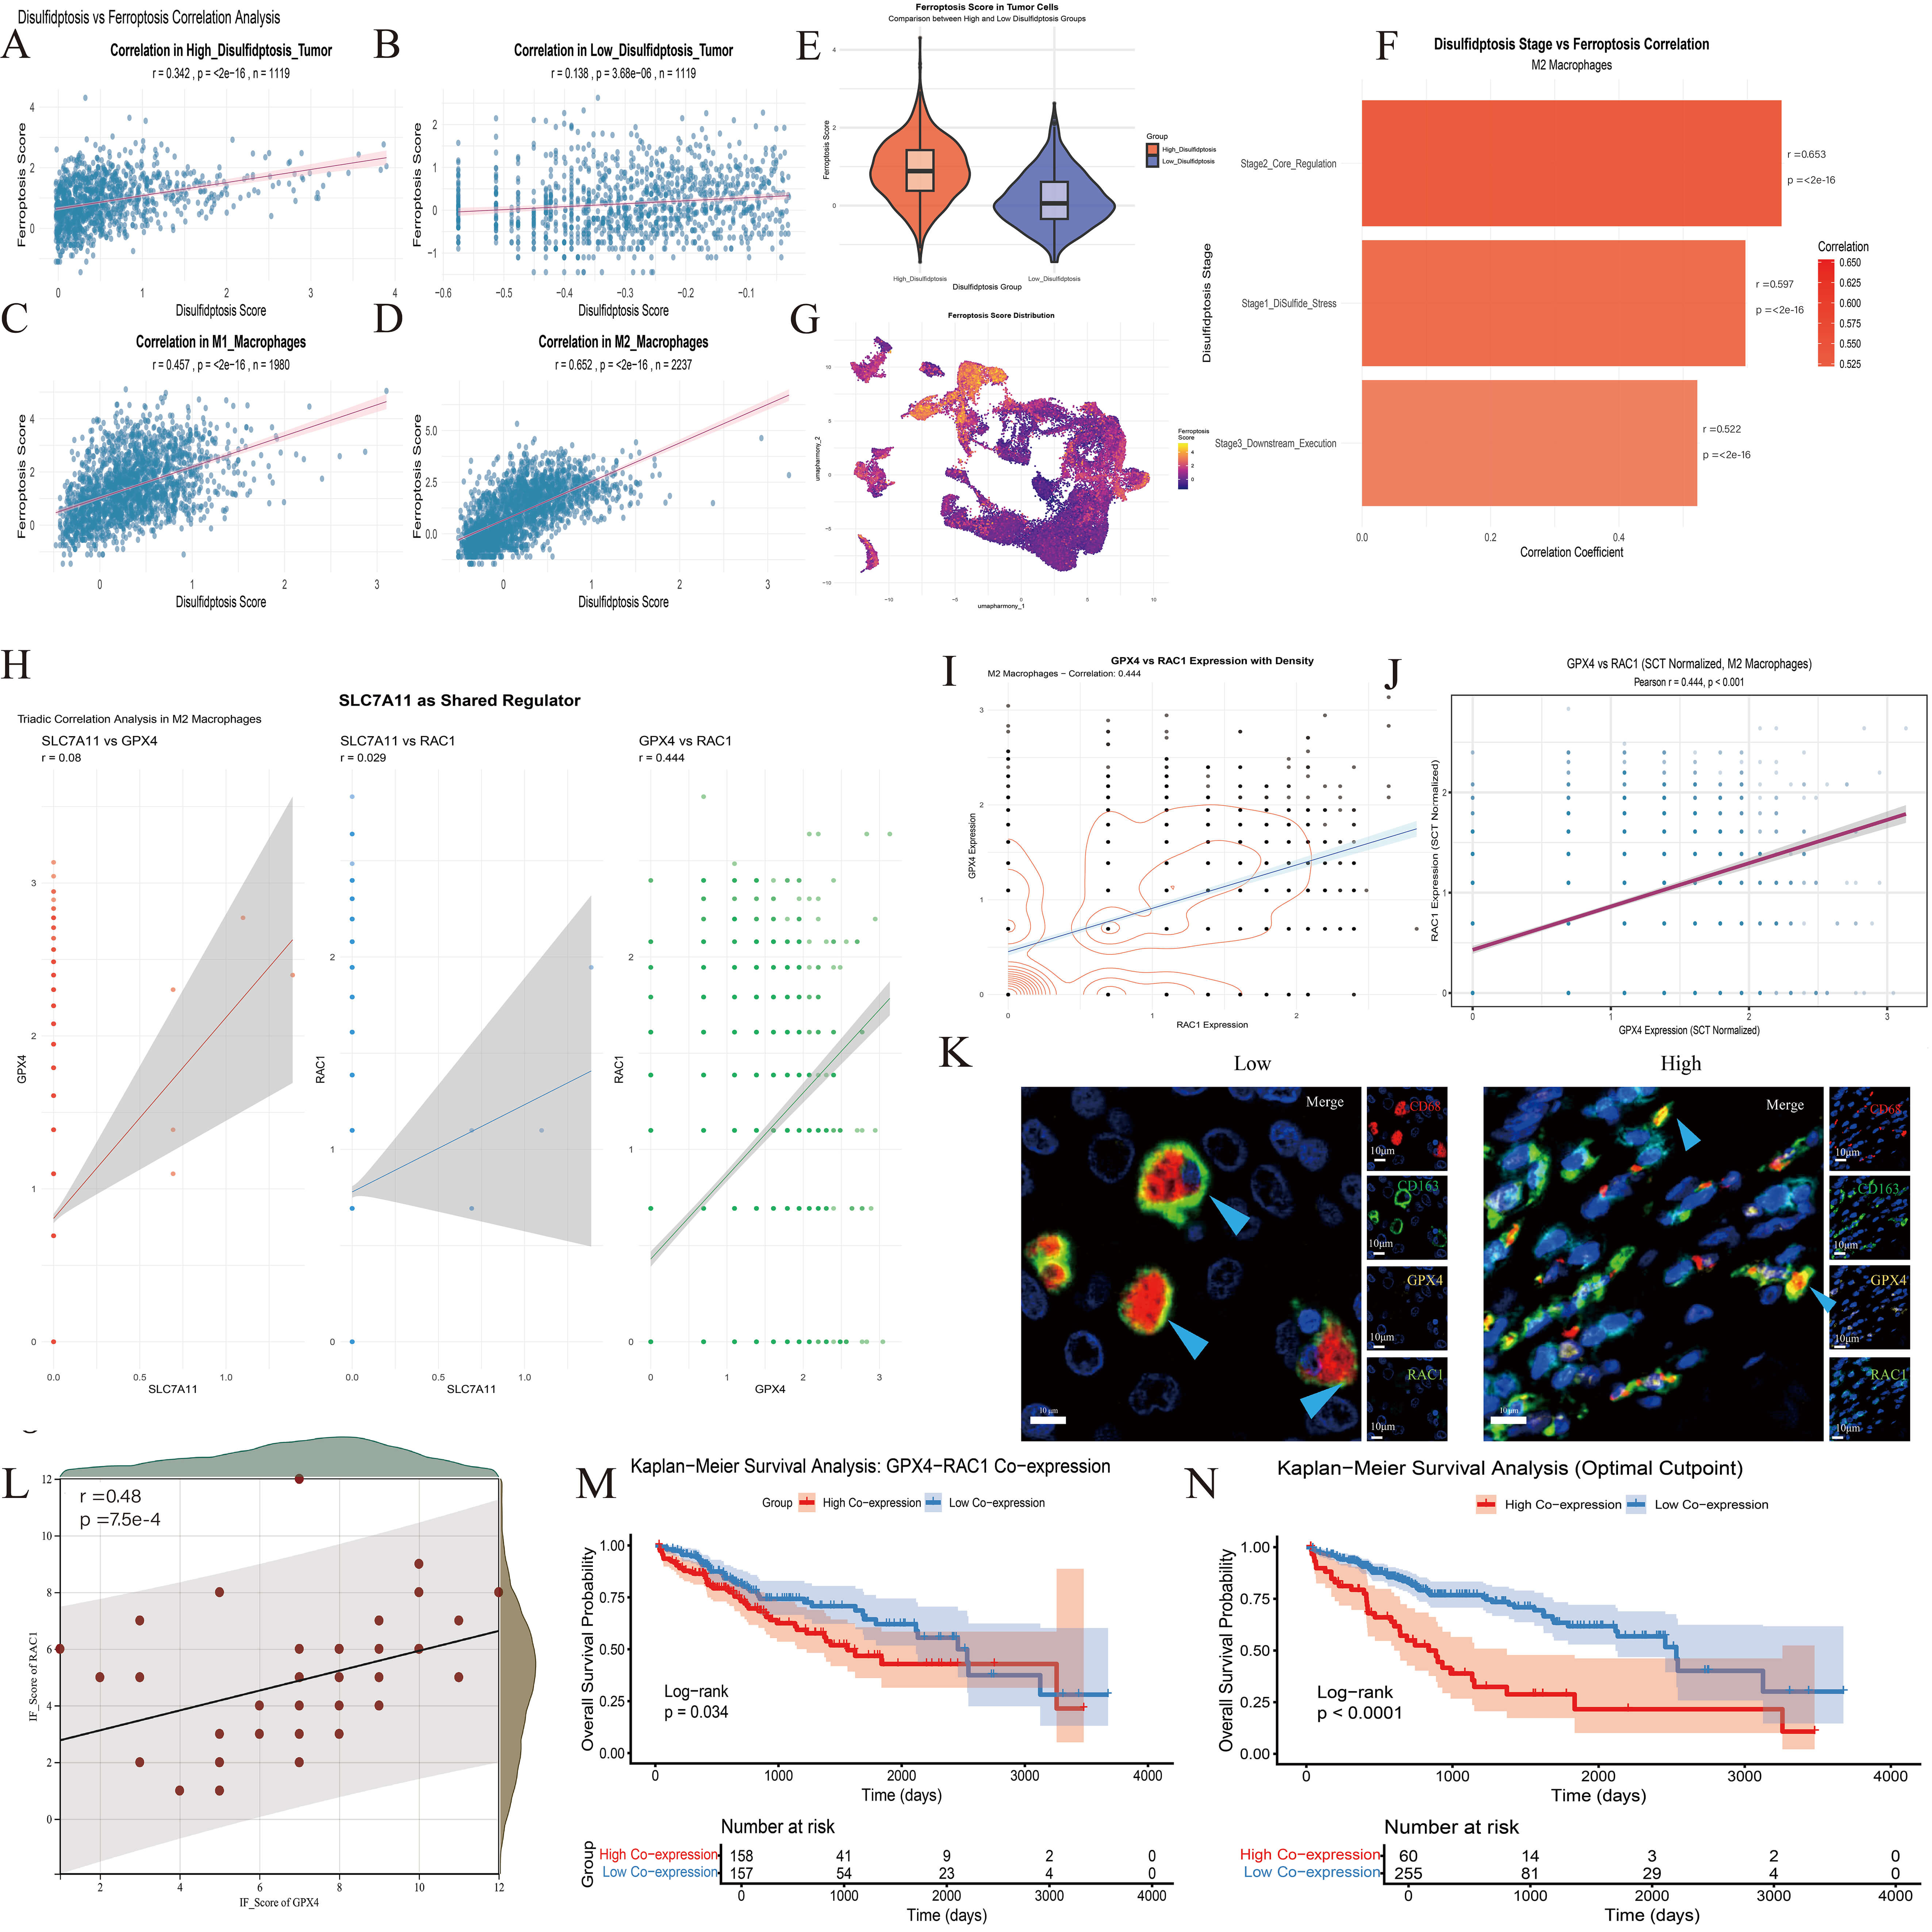 Fig. 5.
The results of correlation analysis between disulfide death and ferroptosis in multiple stages of HCC. (A–D) Correlation analysis of disulfide death score and ferroptosis score in different cells. (E) The distribution of ferroptosis scores in tumor cells with high and low disulfide death scores was different. (F) The correlation between the corresponding scores of the three stages of disulfide death and the ferroptosis score was demonstrated. (G) The UMAP map showed the distribution trend of the ferroptosis score in all cell populations. (H,I) Correlation analysis and strength comparison between SLC7A11, RAC1 and GPX4. (J) The correlation result was drawn from SCT-standardized data. (K) Immunofluorescence results in macrophages. Scale bar = 10 µm. CD68 red immunofluorescence, CD163 green immunofluorescence, GPX4 yellow immunofluorescence, RAC1 blue immunofluorescence. (L) Correlation analysis of GPX4-RAC1 expression based on fluorescence scores of 46 patients. (M,N) KM curve analysis of Dis-score in clinical features. (M) divided by the median core, (N) divided by the best cutoff values.
Based on the strong correlation (r = 0.653) between the core regulatory stage
(Stage2) of disulfidptosis and ferroptosis in M2 macrophages identified
previously (Fig. 5F), we further analyzed the core effector molecules of each
cell death mode. Direct association analysis of the key ferroptosis suppression
gene GPX4 and the core disulfidptosis regulatory gene RAC1 was
performed to clarify inter-molecular regulatory relationships. Pearson
correlation analysis of SCT-normalized expression data from 2237 M2 macrophages
revealed a significant, moderate positive correlation between GPX4 and
RAC1 expression (r = 0.444, p
Immunofluorescence staining of M2 macrophages using CD163 and CD68 as markers revealed significant co-expression of GPX4 and RAC1 within this cell population, further validating the results of pseudo-time trajectory analysis (Fig. 5K,L).
This study aimed to delineate the cellular and molecular features of a tumor cell subpopulation within the HCC microenvironment that is characterized by a high risk of disulfidptosis [24, 25]. Utilizing scRNA-seq data, our analytical workflow incorporated rigorous QC, data integration [26], and cell clustering to define major cellular constituents. We subsequently identified a distinct subpopulation cell clustering to define major cellular constituents. We subsequently identified a distinct subpopulation of tumor cells exhibiting elevated disulfidptosis scores. Further analysis focused on characterizing the metabolic reprogramming of these cells and deciphering their specific communication networks with M2 macrophages, a key immunosuppressive component. Beyond cell-cell communication, we investigated the potential interplay between disulfidptosis and ferroptosis, another regulated cell death pathway, across different cell types. This integrated approach revealed the existence of a unique immunometabolic niche in HCC, wherein a metabolic vulnerability in tumor cells was closely associated with specific immune cell interactions. Furthermore, our results suggest a potential link between the disulfidptosis and ferroptosis pathways, possibly centered on molecules such as GPX4 and RAC1. Overall, these findings contribute to a more refined understanding of the microenvironmental complexity of HCC.
Our metabolic pathway analysis revealed a paradoxical state in tumor cells with high-disulfidptosis risk, characterized by a general downregulation of traditional energy metabolism pathways alongside specific upregulation of disulfidptosis-associated genes [27]. This observation is consistent with the recognized function of SLC7A11, a critical subunit of the cystine/glutamate antiporter. SLC7A11 is often upregulated in cancer cells experiencing oxidative stress, thereby promoting glutathione synthesis and enhancing antioxidant defense mechanisms.[27, 28]. However, excessive cystine uptake through SLC7A11, particularly under glucose-deficient conditions that limit NADPH production [29, 30], can predispose cells to disulfidptosis. Our data are consistent with this model, showing coordinated high expression of SLC7A11, G6PD (a NADPH-producing enzyme), and the disulfidptosis effector RAC1 in the high-risk group. This metabolic configuration suggests the cells might be navigating a delicate balance of trying to mitigate oxidative stress via cystine import and the pentose phosphate pathway, while at the same time elevating their susceptibility to disulfidptosis due to the resultant disulfide stress [31]. The identity of this tumor subpopulation may be defined by its distinctive metabolic profile, which also highlights its unique metabolic vulnerability.
Our analysis revealed a notable convergence of the disulfidptosis and ferroptosis pathways in the M2 macrophage population. A statistically significant positive correlation was consistently observed between the disulfidptosis score and the ferroptosis score in these cells [28]. Stratification of the disulfidptosis process into three functional stages (Stage1: DiSulfide Stress, Stage2: Core Regulation, Stage3: Downstream Execution) showed that all stages maintained significant positive correlations with the ferroptosis score, albeit with varying strengths. This stage-specific correlation pattern indicates the interplay between the disulfidptosis and ferroptosis pathways is not uniform but is particularly pronounced during the core regulatory phase of disulfidptosis [32]. In parallel, our study utilized pseudotime trajectory analysis to map the differentiation pathways of macrophages, demonstrating that macrophage phenotypes within TME are not static but rather exist in a state of dynamic equilibrium. This observation underscores the intrinsic plasticity of macrophages, which allows them to be reprogrammed in response to microenvironmental cues, such as glucose deprivation and tumor-derived factors. Specifically, the M1 phenotype exerts anti-tumor effects, whereas the M2 phenotype facilitates immunosuppression and tissue repair. Our research concentrated on M2 macrophages and identified their elevated expression of GPX4 and RAC1, which may confer a survival advantage under conditions of metabolic stress. Elucidating this mechanism of plasticity not only aids in understanding the complex role of disulfidptosis in immune regulation but also offers novel insights for developing strategies to target macrophage repolarization as a means to counteract immunosuppression.
Our investigation was subsequently focused on the GPX4-RAC1 axis, representing a critical juncture at which the two cell death pathways potentially intersect. GPX4 is a central regulator and key inhibitor of ferroptosis. It functions by neutralizing lipid hydroperoxides, thereby protecting cells from ferroptosis [33, 34]. The expression level of GPX4 is often indicative of a cell’s defensive effort against ferroptosis [35]. RAC1, a small GTPase36, has been identified as a core executor in the disulfidptosis pathway [25, 36]. The functional stability and activity of RAC1 are dependent on a reduced actin cytoskeleton network, which becomes a target of aberrant disulfide bonding under disulfidptosis-inducing conditions, leading to cytoskeletal collapse. In the present dataset, the expression levels of GPX4 and RAC1 showed a significant positive correlation in M2 macrophages. This co-expression pattern places the GPX4-RAC1 axis at the core of the observed correlation between the two death modalities [37, 38, 39]. The co-expression of GPX4 and RAC1 in M2 macrophages suggests a potential synergistic regulatory mechanism linking ferroptosis and disulfidptosis. This co-expression may confer dual survival advantages to M2 macrophages. GPX4 mitigates ferroptosis by inhibiting lipid peroxidation, while RAC1 preserves cytoskeletal homeostasis in response to disulfide stress, thereby enhancing the immunosuppressive function of these cells within the glucose-deprived tumor microenvironment. Future research should functionally validate the regulatory role of the GPX4-RAC1 axis in M2 polarization and immune evasion through the use of conditional knockout animal models and macrophage-tumor co-culture systems. From a translational standpoint, this co-expression signature could serve as a biomarker for predicting responses to immunotherapy and provide a theoretical framework for the development of dual inhibitors targeting both ferroptosis and disulfidptosis.
In contrast to the clear association between GPX4 and RAC1, the analysis of SLC7A11 revealed a distinct context. While SLC7A11 serves as the cystine transporter implicated in both glutathione synthesis (anti-ferroptosis) and the initiation of disulfidptosis stress, its mRNA expression showed only minimal and statistically weak correlations with both GPX4 and RAC1. This dissociation suggests the role of SLC7A11 in these interconnected networks may be regulated at levels beyond the abundance of transcript. The consistent co-upregulation of a ferroptosis defense gene (GPX4) [40, 41] and the disulfidptosis execution gene (RAC1) [42, 43, 44], coupled with the strong correlation between the two cell death scores, highlights a previously under-appreciated link between these pathways in the TME. Our findings position the GPX4-RAC1 axis as a focal point of molecular integration between disulfidptosis and ferroptosis within the specific context of M2 macrophages in HCC. The functional consequences of this co-expression and the precise mechanisms governing the relationship present a compelling avenue for further investigation. From a translational perspective, the simultaneous vulnerability of M2 macrophages to both cell death pathways, as indicated by our correlative findings, suggests that therapeutic strategies capable of co-inducing the two forms of cell death might offer a promising approach for targeting this pro-tumorigenic cell population. Despite promising computational inferences linking disulfidptosis to tumor, current studies remain largely bioinformatic, relying on public databases and correlation-based analyses. Functional validations are limited to a handful of genes (e.g., SLC7A11, RAC1, GPX4) in basic overexpression or knockdown systems, lacking in vivo models and mechanistic dissection. For future efforts prioritize, we will establish disulfidptosis-specific biomarkers via proteomic and metabolomic screening and conduct CRISPR-based functional screens to identify novel regulators.
However, there are still some limitations in this study. First, the proposed GPX4‑RAC1 axis and its functional relevance to disulfidptosis–ferroptosis crosstalk are based on correlative analyses, without other molecular evidence. And our cohort is limited to TCGA‑LIHC without external multi‑center validation, which may restrict generalizability.
In this study, a novel lncRNA-based molecular typing system was established to distinguish three different HCC subtypes with prognostic and metabolic-immune heterogeneity. Single-cell analysis showed that tumor cells with high disulfide bond activity were involved in specific metabolic reprogramming and formed immunosuppressive communication networks with M2 macrophages through the MIF pathway. More importantly, significant functional crosstalk was found between disulfidptosis and ferroptosis. This was anchored by the co-expression of GPX4 and RAC1 in M2 macrophages, and was associated with poor patient survival.
The RNA-sequencing data, clinical data and survival data generated in this study will be deposited in approved database with accession number at the time of publication from TCGA and GEO. Additional data related to this article will be shared upon reasonable request to the corresponding author.
ZC, WL, AY, ChongZ and ChaoZ contributed to the design of the study. ZC, WY and SX performed most of the experiments, analyzed the data and wrote the manuscript. ZC, SZ, AY and JC collected clinical samples. XJ, ZD and TS performed clinical data analysis and pathology analysis. ChongZ and ChaoZ reviewed and edited the manuscript. The authors read and approved the final manuscript. All authors contributed to editorial changes in the manuscript. All authors read and approved the final manuscript. All authors have participated sufficiently in the work and agreed to be accountable for all aspects of the work.
All study participants provided informed consent, and the study design was approved by the Institutional Ethics Committee of the First Affiliated Hospital of Anhui Medical University (PJ20250581). All authors consent to the publication of the manuscript.The study was carried out in accordance with the guidelines of the Declaration of Helsinki.
Not applicable.
This work was supported by the National Natural Science Foundation of China (Grant nos 82303475), the National Health Commission Capacity Building and Continuing Education Center (Grant nos GWJJMB202510022056), the Quality Enhancement Project for New Era Education of Education Department of Anhui Province (Grant nos 2024zyxwjxalk048) and the University Research Project of Anhui Province (Grant nos 2022AH040161).
The authors declare no conflict of interest.
Supplementary material associated with this article can be found, in the online version, at https://doi.org/10.31083/FBL48824.
References
Publisher’s Note: IMR Press stays neutral with regard to jurisdictional claims in published maps and institutional affiliations.