


 , Daidi Fu 2,*
 , Heng Zhang 2
1 Interventional Oncology Department, Central Hospital of Zibo, 255000 Zibo, Shandong, China
2 Oncology Department of West Hospital, Central Hospital of Zibo, 255000 Zibo, Shandong, China
Abstract
Colorectal cancer (CRC) progression is frequently driven by metabolic reprogramming and immune evasion. A crucial metabolic enzyme, argininosuccinate synthetase 1 (ASS1), is dysregulated in a number of malignancies; however, its role in CRC and its effects on the tumor immune microenvironment remain poorly understood. Carnitine palmitoyltransferase 1A (CPT1A)-mediated fatty acid oxidation and post-translational modifications, including succinylation, are emerging as important regulators of tumor behavior.
ASS1 expression was analyzed using The Cancer Genome Atlas (TCGA) database and further validated in 40 paired clinical CRC specimens and cell lines. Functional roles were assessed through knockdown and overexpression experiments in CRC cells, evaluating proliferation, colony formation, migration, and invasion. Mechanisms were explored via co-immunoprecipitation, succinylation assays, protein stability measurements, and co-culture systems with CD8+ T cells. Additionally, in vivo tumor growth and changes in the immune milieu were evaluated using a mouse CT26 transplantation model.
ASS1 was markedly upregulation in both cultured cell lines and CRC tissues. ASS1 knockdown decreased programmed cell death protein-1 (PD-1) expression and T cell fatigue while enhancing interferon-γ, tumor necrosis factor-α, perforin, and granzyme B secretion, which in turn increased CD8+ T cell cytotoxicity and inhibited malignant phenotypes in vitro. Mechanistically, ASS1 transcriptionally activated CPT1A, which promoted S100 calcium-binding protein A10 (S100A10) succinylation at lysine 47, thereby stabilizing S100A10 protein. Overexpression of either CPT1A or S100A10 reversed the tumor growth suppression and impaired immune activation resulting from ASS1 knockdown. In vivo, ASS1 knockdown inhibited tumor growth, downregulated CPT1A and S100A10 expression, and increased CD8+ T cell infiltration while reducing PD-1 levels.
ASS1 promotes CRC progression and immune escape by regulating the CPT1A-mediated succinylation and stabilization of S100A10. These findings highlight the ASS1/CPT1A/S100A10 axis as a potential therapeutic target for CRC.
Keywords
- colorectal cancer
- argininosuccinate synthetase
- Carnitine O-Palmitoyltransferase
- S100 proteins
- succinylation
Because of its high incidence and mortality rates, colorectal cancer (CRC) continues to be a major global health concern, placing a significant financial and health burden on society [1, 2]. The prognosis for advanced or metastatic CRC is still poor despite tremendous advancements in treatments such as surgery, chemotherapy, radiation, targeted therapy, and immunotherapy [3, 4]. Therefore, it is crucial to clarify the molecular mechanisms driving CRC progression and to identify novel diagnostic and therapeutic targets in order to improve clinical outcomes.
Argininosuccinate synthetase 1 (ASS1) is an essential enzyme in the urea cycle that primarily catalyzes arginine biosynthesis and maintains intracellular arginine homeostasis [5, 6]. Emerging evidence suggests that ASS1 is dysregulated in various malignancies and is vital for tumorigenesis [7]. For example, in hepatocellular carcinoma, the downregulation of ASS1 promotes tumor cell proliferation and survival through metabolic reprogramming, contributing to malignant progression and a poorer prognosis [8, 9, 10]. Conversely, ASS1 overexpression in lung cancer is associated with chemoresistance in tumor cells [11, 12]. However, ASS1 expression patterns, biological functions, and underlying mechanisms in CRC, particularly its involvement in immune evasion, remain insufficiently studied and warrant further investigation.
Lipid metabolic reprogramming is a key characteristic of CRC [13]. Carnitine
palmitoyltransferase 1A (CPT1A), the rate-limiting enzyme in mitochondrial fatty
acid
Our findings established that ASS1, which is upregulated in CRC, drives malignant progression by activating CPT1A transcription. Moreover, we revealed that ASS1 mediates immune evasion via the CPT1A/S100A10 axis, which impairs CD8+ T cell function and induces T cell exhaustion.
Transcriptome data from CRC and normal tissues were acquired from The Cancer Genome Atlas (TCGA) database via the GEPIA platform (http://gepia.cancer-pku.cn/). Differential mRNA expression analysis of the ASS1 gene was performed to characterize its expression profile in CRC.
Tumor and matched para-carcinoma samples were collected from patients with colorectal cancer patients undergoing surgical resection at the Central Hospital of Zibo. All samples were promptly snap-frozen in liquid nitrogen and maintained at –80 °C until analysis. The study protocol was approved by the Ethics Committee of the Central Hospital of Zibo (Approval No. IRB-ZBCH-2024-078A). Every participant provided written informed consent in accordance with the Declaration of Helsinki. For analysis, tissues were cut into 4 µm slices after being paraffin-embedded. For IHC, the following primary antibodies were used: anti-ASS1 (1:50, Cat. No. 16210-1-AP, Proteintech, Chicago, IL, USA), anti-CPT1A (1:500, Cat. No. 15184-1-AP, Proteintech, Chicago, IL, USA), and anti-S100A10 (1:100, Cat. No. 11250-1-AP, Proteintech, Chicago, IL, USA). Representative fields were captured using an Olympus BX-51 TF microscope (Olympus Corporation, Tokyo, Japan). IHC scoring was conducted according to the proportion of positive cells and staining intensity. Protein expression was assessed based on staining intensity (scored 0–3: negative, weak, moderate, strong) and the proportion of positive cells (scored 0–4: 0%, 1–25%, 26–50%, 51–75%, 76–100%). Multiplying the staining intensity by the proportion score of positive cells yielded the final IHC score, which ranged from 0 to 12. Two seasoned pathologists conducted the assessments separately and blindly with regard to clinical data.
CRC cell lines SW480 (Cat. No. CBP60019), HCT116 (Cat. No. CBP60028), HT29 (Cat. No. CBP60011), and CT26 (Cat. No. CBP30258L) were all bought from Nanjing Kebai Biotechnology Co., Ltd (Nanjing, Jiangsu, China). The NCM460 cell line, derived from normal human colonic epithelium (Catalog Number CD0408), was procured from Shanghai QiDa Biotechnology Co., Ltd (Shanghai, China). All cell lines were cultured at 37 °C in a humidified incubator. Specifically, SW480 cells were maintained in Leibovitz’s L-15 medium supplemented with 10% fetal bovine serum (FBS) and 1% penicillin-streptomycin, and incubated without CO2 supplementation. The other cell lines were cultured in a 5% CO2 atmosphere: HCT116 and HT29 cell lines were propagated in McCoy’s 5A medium supplemented with 10% FBS and 1% penicillin-streptomycin. For the cultivation of CT26 and NCM460 cells, RPMI-1640 medium was employed, also enriched with 10% FBS and 1% penicillin-streptomycin. All reagents and materials for cell culture were sourced from Procell System (Wuhan, Hubei, China). Authentication of each cell line was performed using short tandem repeat (STR) profiling, and all tested negative for mycoplasma contamination.
Short hairpin RNAs (shRNAs) that target human ASS1 or a non-targeting control shRNA were cloned into the pLKO.1 vector (Cat. No. 8453, Addgene, Watertown, MA, USA) in order to reduce the expression of ASS1. The following were the ASS1 targeting sequences: shASS1-#1: 5′-GAAAACAGATTCCAGACGCCG-3′; shASS1-#2: 5′-TTGATTTTGCGCACTTCCCG-3′. For overexpression, full-length coding sequences of human ASS1, CPT1A, and S100A10 were individually ligated into the pLVX vector (Cat. No. 631253, Takara Bio, Kusatsu, Shiga, Japan). Lentiviruses were packaged and produced by GenePharma (Shanghai, China). To create stable cell lines, CRC cells were infected with the relevant lentiviruses and then selected using puromycin (Cat. No. P8833, Sigma-Aldrich, St. Louis, MO, USA) at a concentration of 2 µg/mL. Prior to conducting functional experiments, the efficiency of gene knockdown and overexpression was confirmed through quantitative reverse transcription polymerase chain reaction (qRT-PCR) and Western blot analysis.
After seeding in 96-well plates, CRC cells were cultured for specified durations. The plates were incubated at 37 °C for three hours after 10 µL of CCK-8 solution (Cat. No. C0037, Beyotime, Shanghai, China) was added to each well. A microplate reader was used to measure absorbance at 490 nm in order to determine viability. To evaluate colony-forming ability, a clonogenic assay was performed. Cells were seeded into 6-well plates, cultured for one week, then fixed and stained with crystal violet (Cat. No. C0775, Sigma-Aldrich, St. Louis, MO, USA). The resulting colonies were manually counted for analysis.
Cell migration and invasion capabilities of CRC cells were evaluated using
Transwell chambers (8 µm pore size; Cat. No. PCEP06H48, MilliporeSigma,
Burlington, MA, USA). For the invasion assay, the interior of the inserts was
pre-coated with a 0.2% Matrigel layer (Cat. No. 356234, Corning, Corning, NY,
USA). Subsequently, 2
RNA was extracted from both cellular and tissue samples with TRIzol reagent (Cat. No. 15596026CN, Invitrogen, Waltham, MA, USA). Subsequent quantitative reverse transcription PCR (qRT-PCR) was performed using SYBR Green master mix (Cat. No. 4309155, Applied Biosystems, Foster City, CA, USA). The relative expression levels of target genes were calculated via the 2-ΔΔCT method, with glyceraldehyde-3-phosphate dehydrogenase (GAPDH) serving as the internal reference. All primer sequences are listed in Table 1.
| Gene | Primer |
| ASS1 | Forward: 5′-GCTTATAACCTGGGATGGGCA-3′ |
| Reverse: 5′-ATGGGAATCCCGTGTTGCTT-3′ | |
| CPT1A | Forward: 5′-CATACGAGGCCTCCATGACC-3′ |
| Reverse: 5′-GCTTTTCTTTCCAGCCCAGC-3′ | |
| S100A10 | Forward: 5′-GTGGGCTTCCAGAGCTTCTT-3′ |
| Reverse: 5′-GGAGGAGCGAACTGCTCATT-3′ | |
| GAPDH | Forward: 5′-TGTGGGCATCAATGGATTTGG-3′ |
| Reverse: 5′-ACACCATGTATTCCGGGTCAAT-3′ |
qRT-PCR, quantitative reverse transcription polymerase chain reaction; ASS1, argininosuccinate synthetase 1; CPT1A, Carnitine palmitoyltransferase 1A; S100A10, S100 calcium binding protein A10; GAPDH, glyceraldehyde-3-phosphate dehydrogenase.
Protein samples were obtained from tissue specimens or cultured cells using RIPA buffer (Cat. No. P0013B, Beyotime, Shanghai, China). Subsequently, the proteins were resolved by sodium dodecyl sulfate-polyacrylamide gel electrophoresis (SDS-PAGE) and then electrophoretically transferred onto PVDF membranes (Cat. No. IPVH00010, Millipore, Burlington, MA, USA). Following a 2-hour blocking step with 5% skimmed milk at room temperature, the membranes were incubated overnight at 4 °C with the specified primary antibodies. The specific primary antibodies utilized were: Anti-ASS1 (1:5000, 16210-1-AP, Proteintech, Chicago, IL, USA), anti-CPT1A (1:5000, 15184-1-AP, Proteintech, Chicago, IL, USA), anti-S100A10 (1:5000, 81017-1-RR, Proteintech, Chicago, IL, USA), anti-FLAG® M2 antibody (1:2000, F1804, Sigma-Aldrich, St. Louis, MO, USA), anti-HA antibody (1:1000, H6908, Sigma-Aldrich, St. Louis, MO, USA), anti-succinyl lysine (1:1000, PTM-401, PTM Bio, Chicago, IL, USA), and anti-GAPDH (1:20,000, 10494-1-AP, Proteintech, Chicago, IL, USA). After washing, the membranes were subjected to a 2-hour incubation at room temperature with the appropriate HRP-linked secondary antibodies. These included goat anti-rabbit immunoglobulin G (IgG) (H+L) conjugated with HRP (1:1000, A0208, Beyotime, Shanghai, China) and goat anti-mouse IgG (H+L) conjugated with HRP (1:1000, A0216, Beyotime, Shanghai, China). An improved chemiluminescence detection technique was used to observe protein bands.
CD8+ T cells were isolated using an immunomagnetic bead sorting kit (EasySep Human CD8+ T Cell Isolation Kit, Cat. No. 17953, STEMCELL Technologies, Vancouver, BC, Canada). Briefly, following the manufacturer’s protocol, biotinylated anti-human CD8 antibody was added to peripheral blood mononuclear cells (PBMCs, obtained from Shanghai Jinyuan Biotechnology Co., Ltd., Shanghai, China ) resuspended in sorting buffer, and the mixture was incubated at room temperature for 15 minutes. After centrifugation and supernatant removal, the cell pellet was resuspended in fresh sorting buffer. Streptavidin-conjugated magnetic beads were then introduced, followed by another 15-minute incubation at room temperature. Subsequently, the tube was placed on a magnetic stand for five minutes to allow the bead-bound CD8+ T cells to adhere to the tube wall. The unbound cells in the supernatant were carefully aspirated and discarded. Finally, to obtain the purified CD8+ T cells, 1 mL of complete medium was added to resuspend the isolated cells.
A CD8+ T Cell Isolation Kit was used to separate human CD8+ T cells
from PBMCs. Before the test, the cells were kept in RPMI-1640 medium supplemented
with 10% FBS and 100 U/mL IL-2 (Cat. No. 200-02, PeproTech, Cranbury, NJ, USA)
for 72 hours after being stimulated with anti-CD3/CD28 beads (Cat. No. 11131D,
Thermo Fisher Scientific, Waltham, MA, USA). During the logarithmic growth phase,
HCT116 or HT-29 CRC cells were collected. Then, 100 µL of CRC cells (target
cells, T) were co-cultured with 100 µL of activated CD8+ T cells
(effector cells, E) at an E:T ratio of 5:1 in a 96-well round-bottom cell culture
plate. Wells containing target cells alone served as a negative control. Maximum
release wells were treated with 100 µL of 1% NP-40. The following formula
was used to determine the percentage of LDH release following a 48-hour
co-culture at 37 °C with 5% CO2: LDH release = [(OD experimental
group – OD natural release) / (OD maximum release group – OD natural release)]
Commercial sandwich ELISA kits were used to measure the amounts of interferon
(IFN)-
Following co-culture, cells were extracted and stained for flow cytometry to assess the CD8+ T cell that expressed Ki-67 and PD-1. An anti-CD8 antibody (Human: 1:50, Cat. No. 557834; Mouse: 1:50, Cat. No. 553035; BD Biosciences, San Jose, CA, USA) was used for surface staining following viability staining to rule out dead cells. A fluorescently conjugated antibody was used to detect PD-1 (Human: 1:100, Cat. No. 561272; Mouse: 1:100, Cat. No. 570654; BD Biosciences, San Jose, CA, USA) or TIM-3 (Human: 1:100, Cat. No. 571403; Mouse: 1:100, Cat. No. 569935; BD Biosciences, San Jose, CA, USA). Following fixation and permeabilization, the cells were intracellularly labeled using an anti-Ki-67 antibody (1:50, Cat. No. 556026, BD Biosciences, San Jose, CA, USA). Appropriate fluorescence-minus-one (FMO) controls and isotype controls were included in each experiment to establish positive gates and confirm staining specificity. The percentages of Ki-67+ and PD-1+ subsets were calculated by gating CD8+ T cells using data collected on a flow cytometer and analyzed using FlowJo software (v10, BD Biosciences, San Jose, CA, USA).
Protease inhibitor-supplemented RIPA buffer was used to extract the total
protein, which was then incubated for 30 minutes and centrifuged for 15 min at
12,000
Succinylation mutants of S100A10, in which Lysine 47 was substituted with arginine (K47R), were generated by Cenepharma (Shanghai, China). All mutant expression plasmids were generated by Sangon Biotech (Shanghai, China). For the overexpression of Flag-CPT1A, HA-S100A10, and its mutant HA-S100A10-K47R, the respective constructs were transfected into HEK293T cells using Lipofectamine 3000 (Cat. No. L3000015, Invitrogen, Waltham, MA, USA), following the manufacturer’s protocol. Anti-Flag M2 or anti-HA antibodies coupled to magnetic beads were used to immunoprecipitate proteins, which were then eluted with the appropriate Flag or HA peptides. The immunoprecipitated samples (Flag-CPT1A, HA-S100A10, and HA-S100A10-K47R) were incubated in reaction buffer at 37 °C for 1 h, followed by protein immunoblotting analysis.
In accordance with the experimental groups, HCT116 or HT29 cells were plated in 6-well plates and transfected. Fresh media containing 50 µg/mL cycloheximide (CHX, Cat. No. C7698, Sigma-Aldrich, St. Louis, MO, USA) was added after 48 hours of culture to allow target gene expression. At 2, 4, 6, and 8 hours after CHX treatment, cells were taken. Then, protein lysates were prepared, quantified, and subjected to Western blotting to evaluate S100A10 degradation kinetics.
C57BL/6 mice (6–8 weeks, 20–22 g) were acquired from Changzhou Cavins
Laboratory Animal Co., Ltd (Changzhou, Jiangsu, China). This research received
ethical approval from the Ethics Committee of the Central Hospital of Zibo
(Protocol No. IACUC-ZBCH-2024-110B). Twelve C57BL/6 mice were randomly divided
into 2 groups, with 6 mice per group. Then, 5
Collagenase IV (1 mg/mL, Cat. No. 17104019, Gibco, Waltham, MA, USA) and DNase I (0.1 mg/mL, Cat. No. 18047019, Gibco, Waltham, MA, USA) were used to mechanically and enzymatically break down tumor tissue in RPMI-1640 media for 30 minutes at 37 °C in order to produce single-cell suspensions. After passing through a 70 µm strainer, the cells were cleaned. Antibodies against CD3 and CD8 were used to stain the cells in order to analyze CD8 T cell invasion. The fraction of CD8+ T/CD3+ cells in the live leukocytes was calculated after fixation. Using a commercial isolation kit, isolated tumor-infiltrating leukocytes were selected for CD8+ T cells for PD-1 expression. Antibodies against PD-1 and CD8 were used to stain the cells. There were also isotype controls. PD-1 expression in gated CD8+ T lymphocytes was measured, and samples were examined using flow cytometry.
All statistical analyses were conducted with GraphPad Prism (v9.5, GraphPad
Software, Inc., San Diego, CA, USA). Results are expressed as mean
To assess ASS1 expression in CRC, we first performed a bioinformatics analysis of TCGA data, which exhibited significant ASS1 mRNA upregulation in tumor tissues compared to normal samples (Fig. 1A). To validate this finding, we collected 40 pairs of tumor and matched para-carcinoma tissues from patients with CRC. qRT-PCR results confirmed that ASS1 mRNA expression was significantly elevated in tumor tissues relative to matched paracancerous tissues (Fig. 1B). Similarly, Western blotting of five representative paired samples revealed increased ASS1 protein expression in tumor tissues (Fig. 1C,D). IHC staining further supported these results, exhibiting weak ASS1 staining in para-carcinoma tissues but strong staining in CRC specimens (Fig. 1E,F). Moreover, in cellular models, CRC cell lines (HCT116, SW480, HT29, and CT26) exhibited considerably higher levels of ASS1 mRNA and protein expression than NCM460 (Fig. 1G–I). Collectively, these data demonstrate elevated expression of ASS1 in both CRC tissues and cellular models, suggesting its potential role as an oncogenic driver in colorectal carcinogenesis.
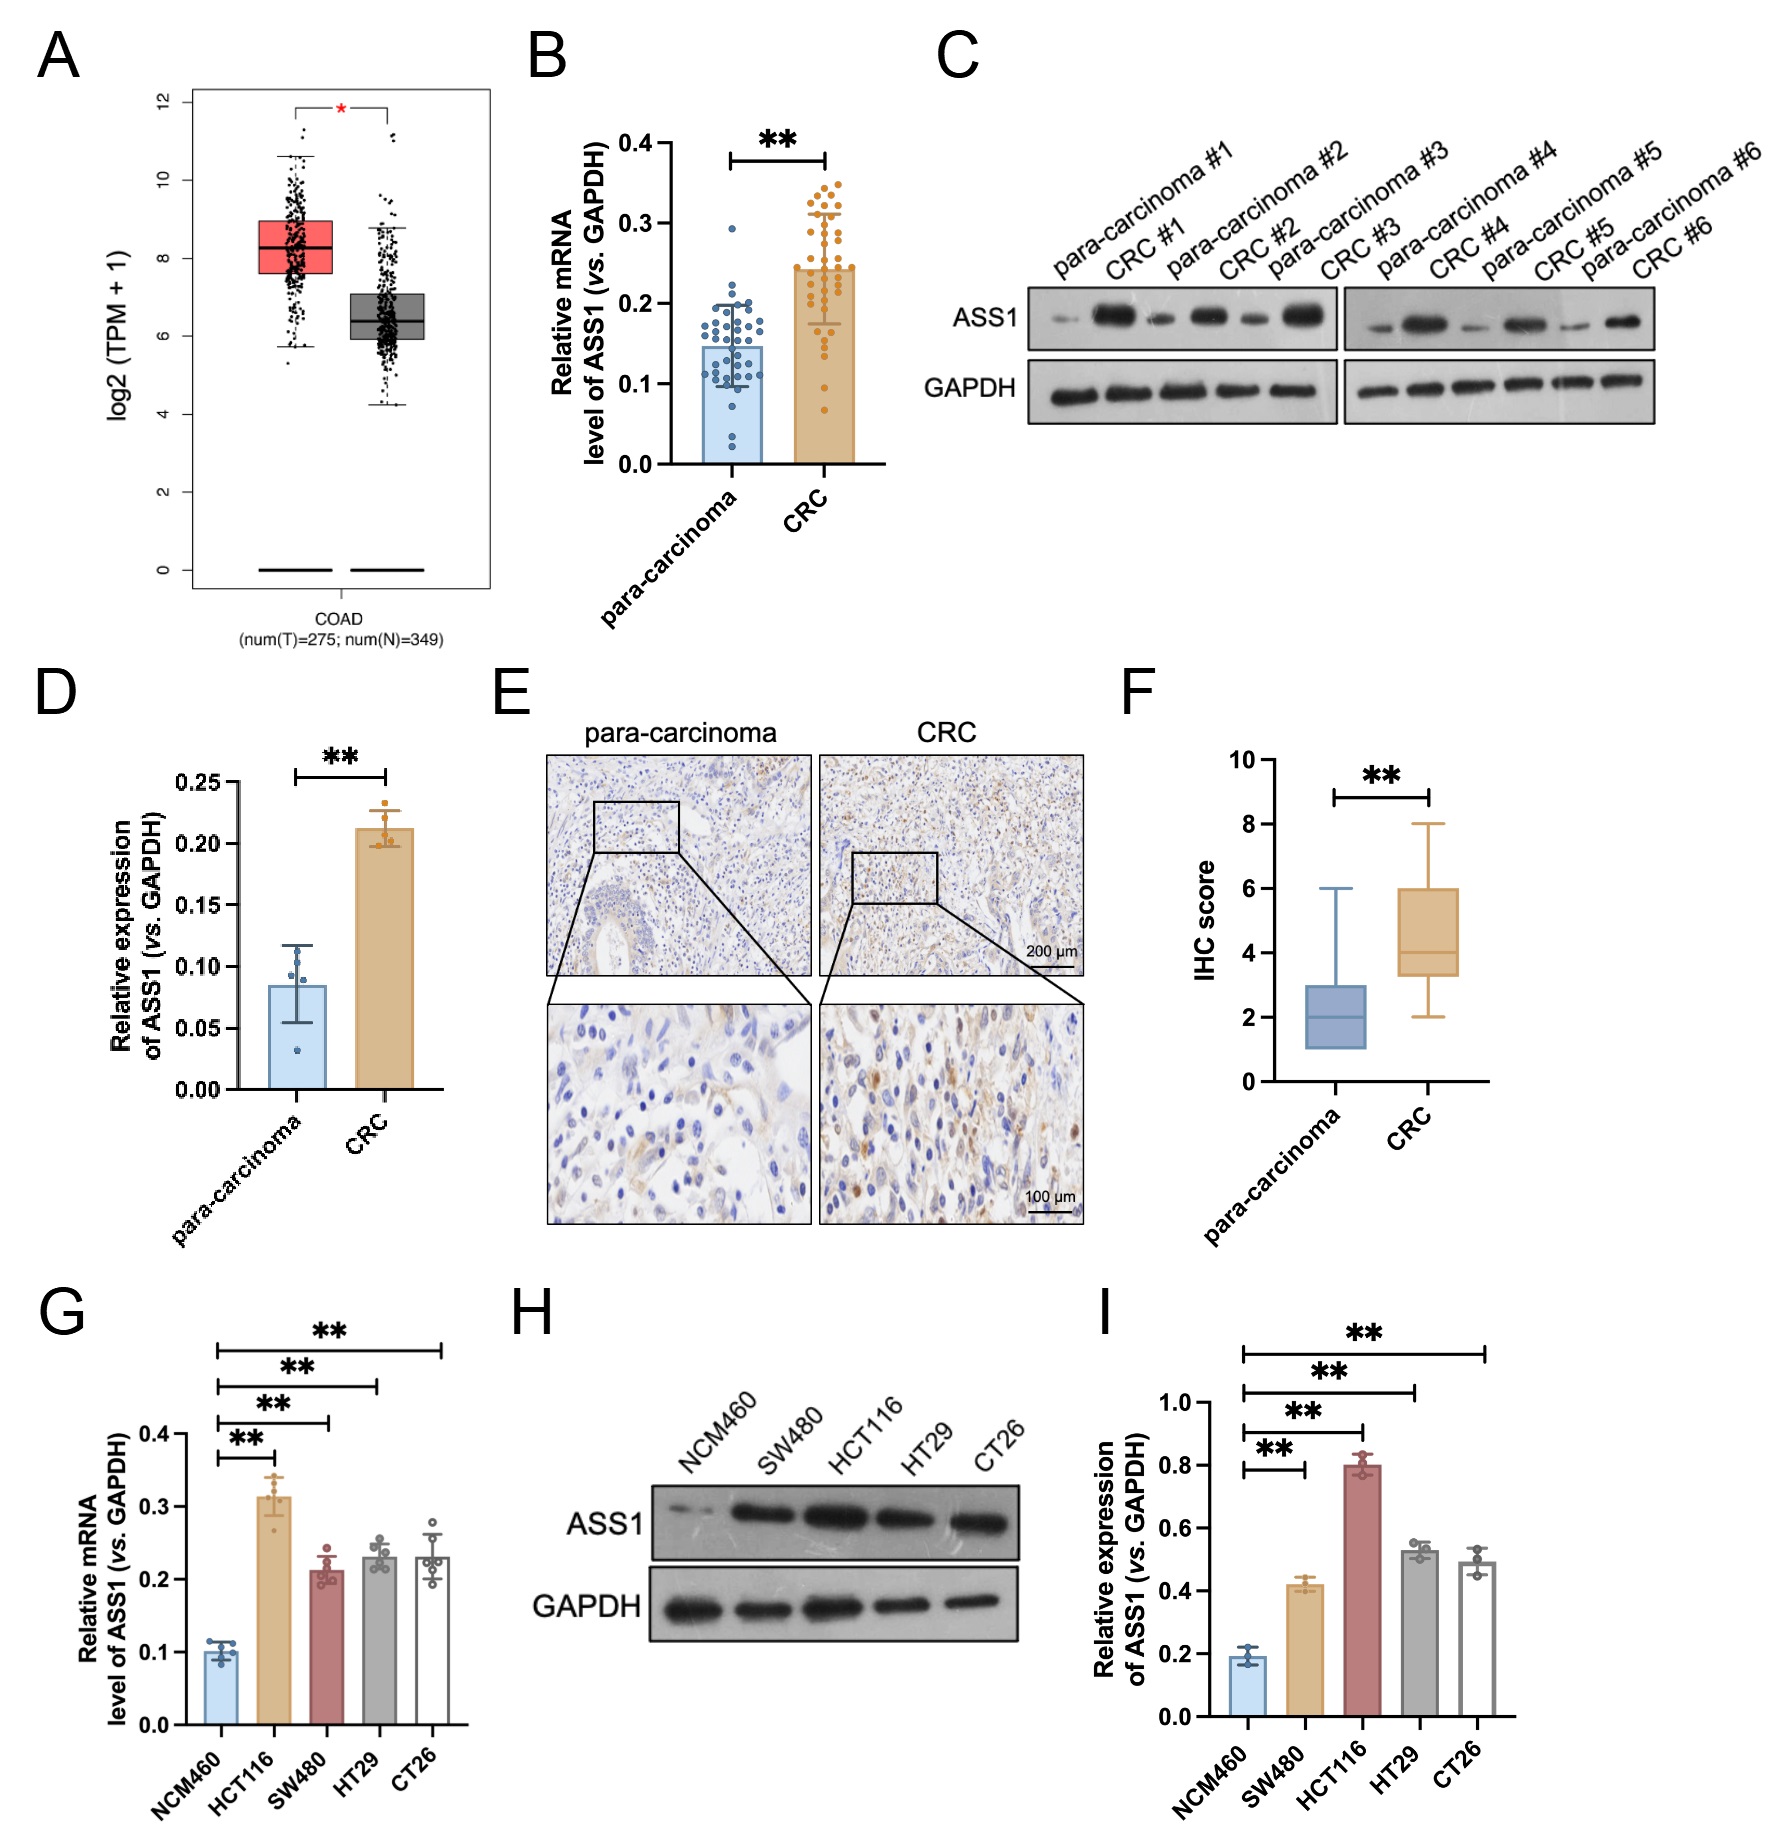 Fig. 1.
ASS1 is highly expressed in colorectal cancer (CRC) tissues and
cell lines. (A) ASS1 mRNA expression levels in CRC and normal tissues from the
The Cancer Genome Atlas (TCGA) database (n = 349). *p
To study the biological functions of ASS1 in CRC, we generated stable overexpression (ASS1-OE) and knockdown (sh-ASS1 #1 and sh-ASS1 #2) models in SW480, HCT116, and HT29 cell lines. We utilized Western blotting and qRT-PCR in parallel to verify ASS1 expression (Fig. 2A,B). ASS1 knockdown reduced cell proliferation, colony formation, migration, and invasion in comparison to the control group, according to functional assays. Conversely, ASS1 overexpression notably enhanced cell proliferation and clonogenicity (Fig. 2C–F). Together, these results show that ASS1 deletion reduces important malignant behaviors in CRC cells, such as invasion, migration, colony formation, and proliferation, indicating that ASS1 functions as an oncogenic driver supporting CRC progression.
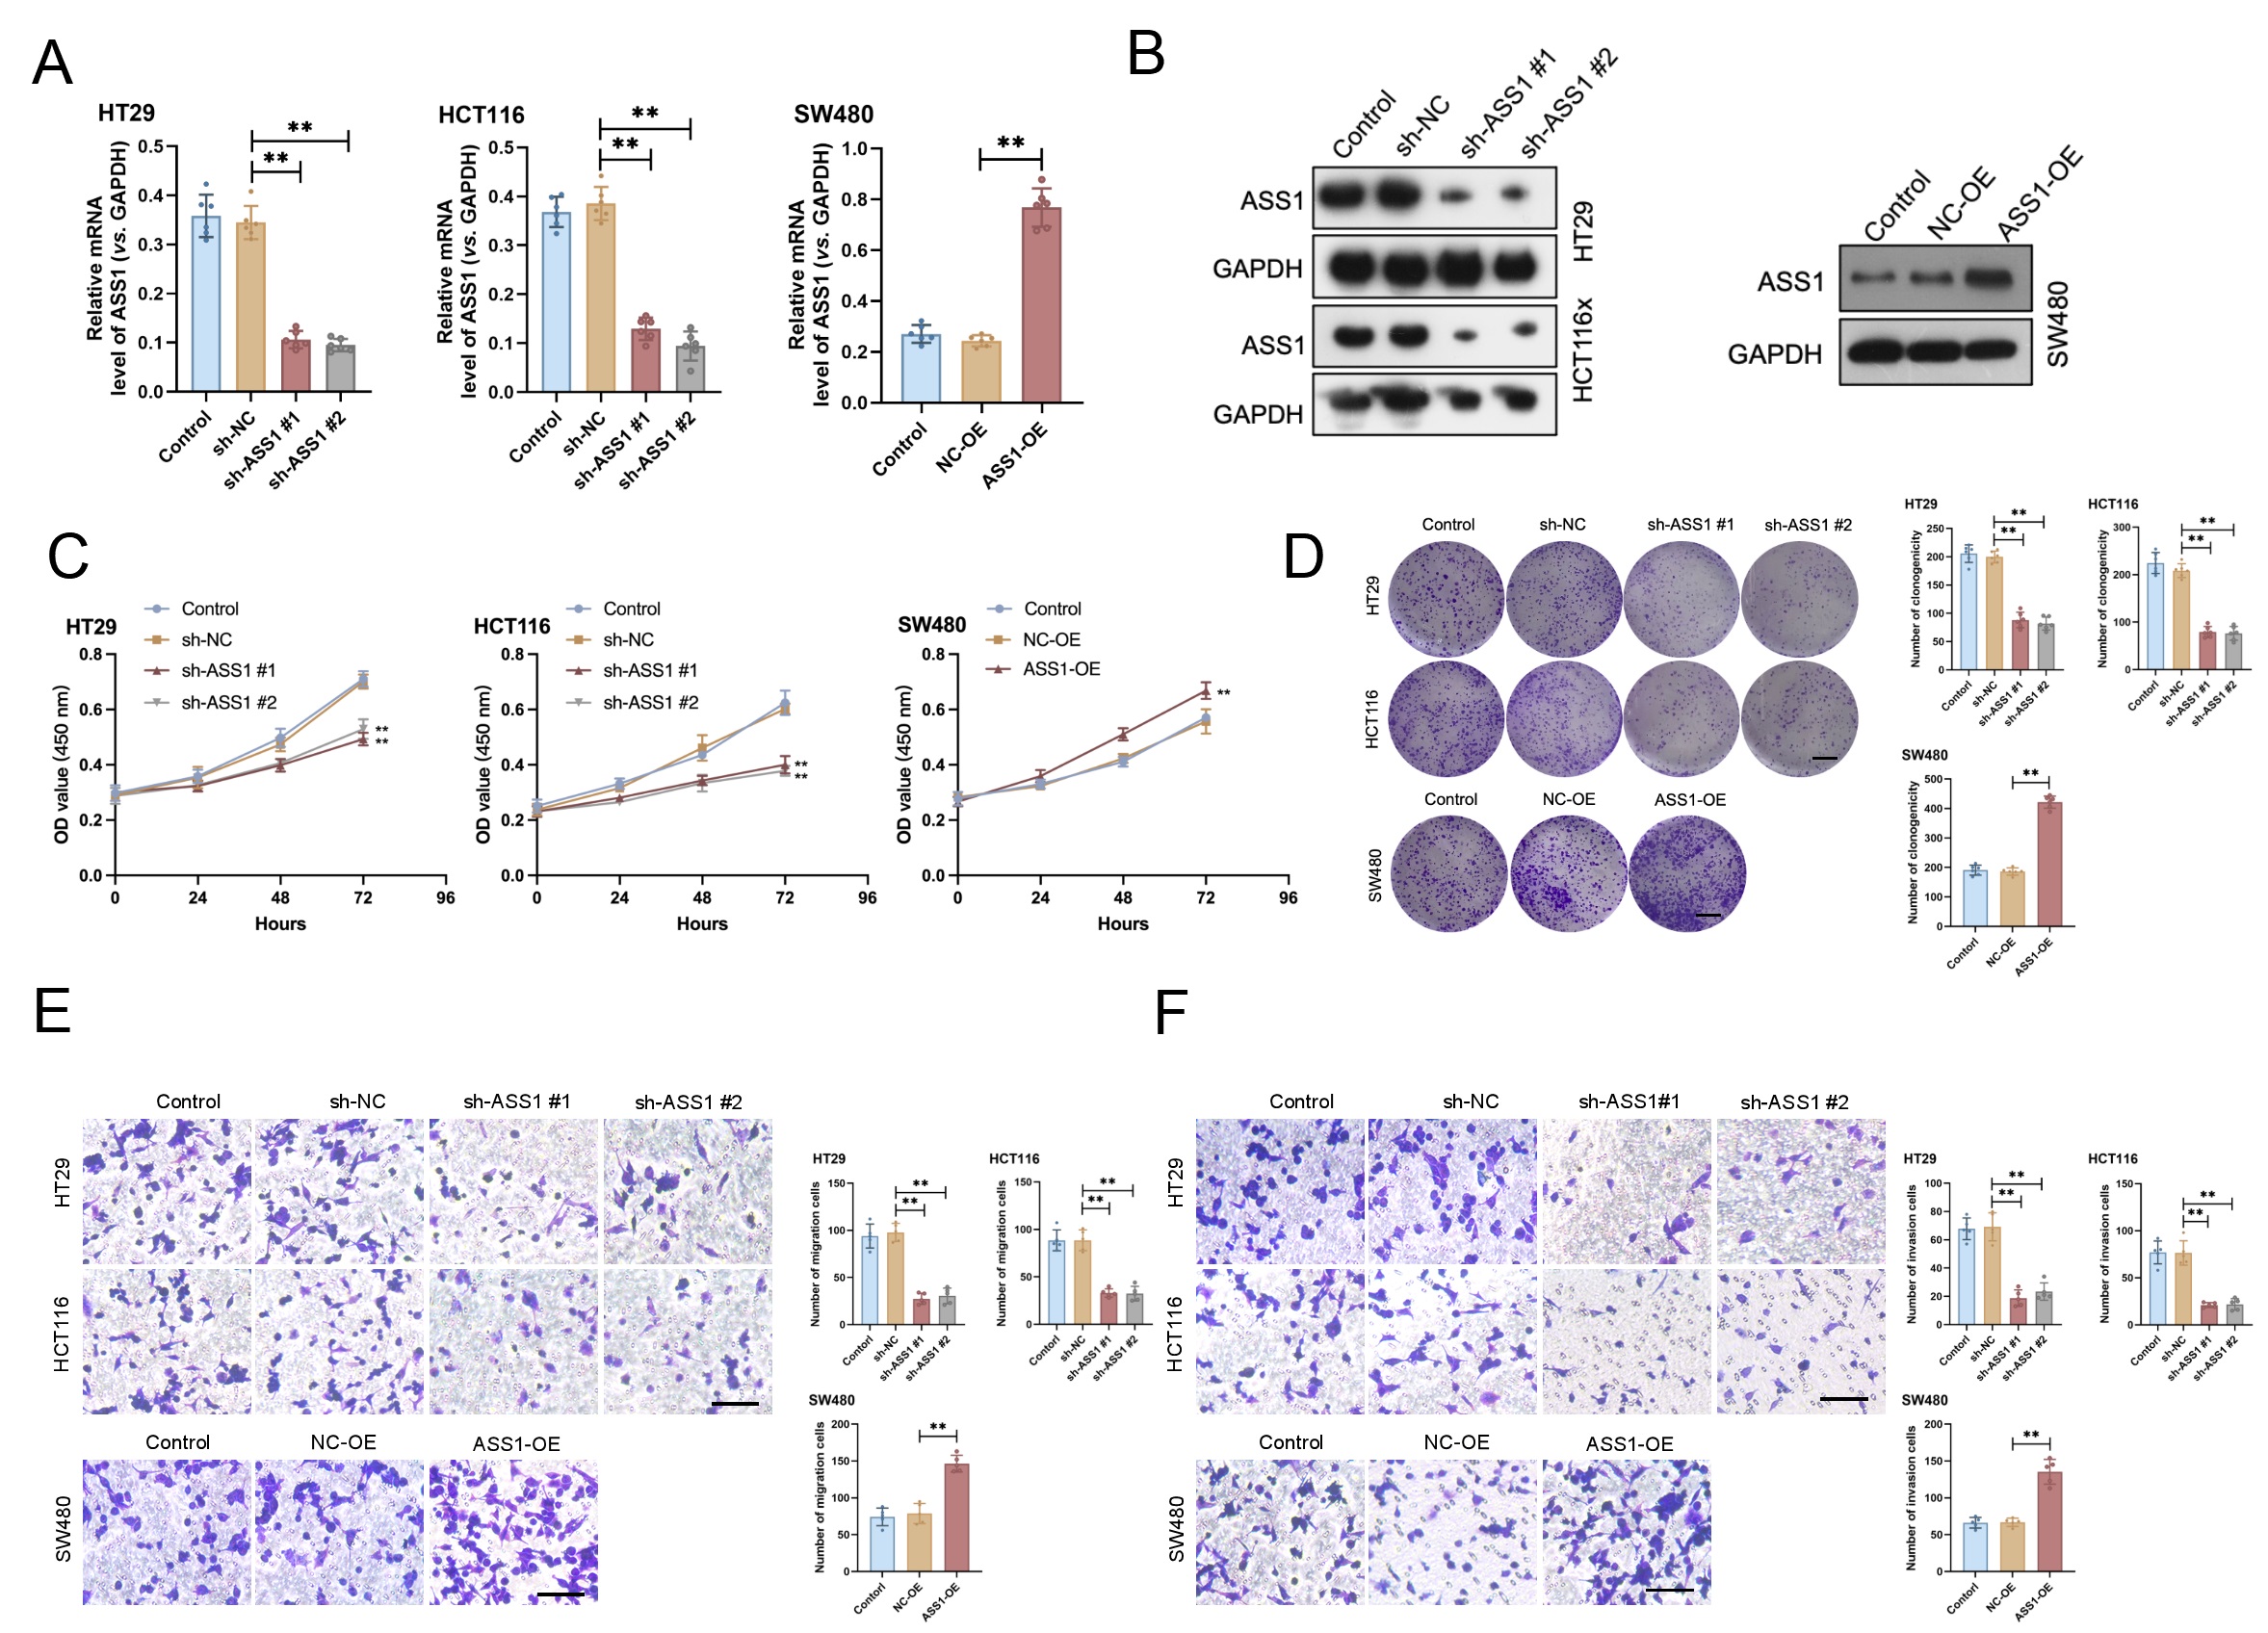 Fig. 2.
ASS1 promotes the malignant phenotypes of CRC cells in
vitro. (A,B) Efficiency of ASS1 overexpression (ASS1-OE) and knockdown (sh-ASS1
#1 and #2) in SW480, HCT116, and HT29 cells was confirmed by qRT-PCR (n = 6)
and Western blotting (n = 3). (C–F) Functional assays revealed that ASS1
knockdown significantly inhibited cell proliferation (C, n = 6), colony formation
(D, n = 6, scale bar: 10 mm), migration (E, n = 5, scale bar: 100 µm), and
invasion (F, n = 5, scale bar: 100 µm), whereas ASS1 overexpression
enhanced proliferative and colony-forming capabilities compared to the controls.
**p
CD8+ T cells were purified to a purity exceeding 95%, as confirmed by flow
cytometric analysis (Fig. 3A and Supplementary Fig. 1A). In comparison
to those co-cultured with sh-NC control cells, CD8+ T cells stimulated with
ASS1-knockdown HCT116 cells (sh-ASS1) showed noticeably higher release of
cytotoxic mediators, such as IFN-
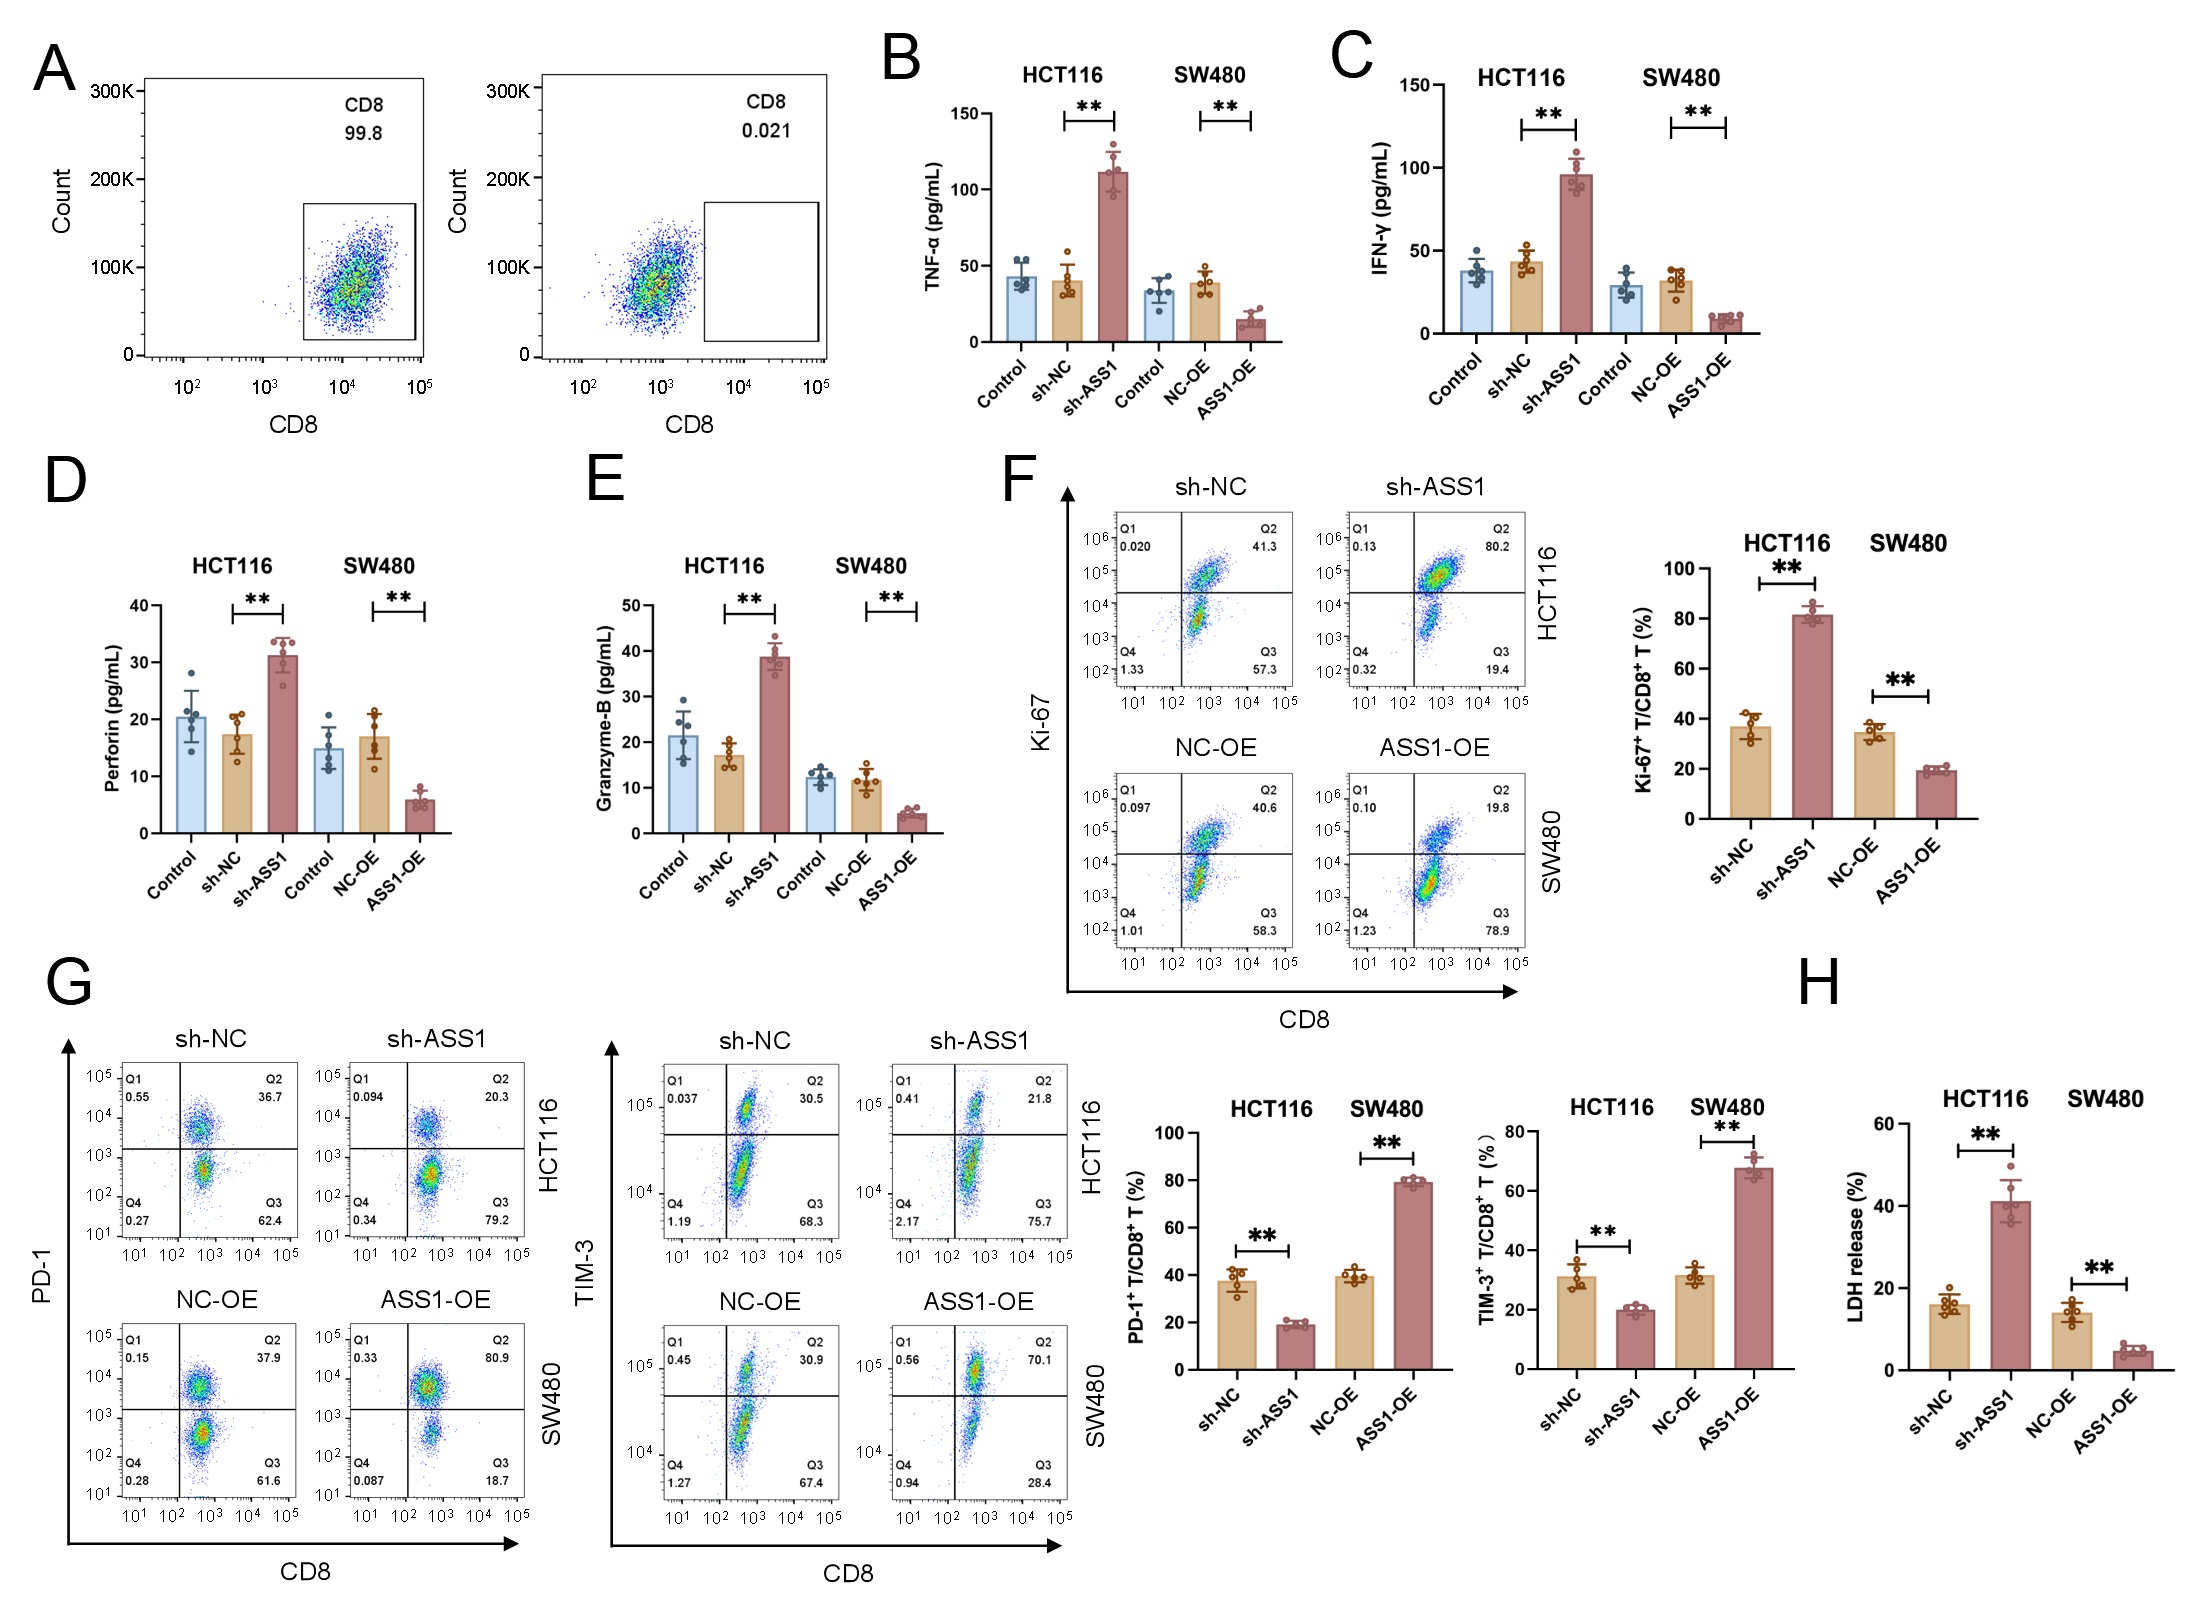 Fig. 3.
ASS1 expression modulates CD8+ T cell function against CRC
cells. (A) Purity analysis of isolated human CD8+ T cells. (B–E) Secretion
of cytotoxic mediators by CD8+ T cells after co-culture with sh-ASS1 or
sh-NC CRC cells (n = 6). (F,G) Proliferation (Ki67) and exhaustion markers (PD-1,
TIM-3) on CD8+ T cells were analyzed using flow cytometry (n = 5). (H)
Functional assessment of CD8+ T cell-mediated killing via LDH release assays
(n = 6). **p
Analysis of 40 clinical CRC samples revealed significantly elevated mRNA and protein levels of CPT1A in tumor tissues compared to matched para-carcinoma tissues (Fig. 4A,B). IHC analysis further supported these observations, exhibiting faint CPT1A immunoreactivity in paracancerous regions; however, strong positive staining was observed in CRC tissues (Fig. 4C). Correlation analysis revealed a significant positive association between ASS1 and CPT1A protein expression levels (Fig. 4D). We transfected ASS1-targeting shRNA into HCT116 cells to examine the regulatory mechanisms underlying this relationship. Downregulation of CPT1A expression was observed following ASS1 knockdown, with a notable decline at both the protein and mRNA levels. Conversely, ASS1 overexpression in SW480 cells substantially increased CPT1A protein levels (Fig. 4E,F). To investigate how ASS1 regulates CPT1A, we focused on its role in arginine synthesis. First, we determined that ASS1 knockdown significantly reduced intracellular arginine levels (Fig. 4G). We next asked whether this arginine reduction mediated the downregulation of CPT1A. Exogenous arginine supplementation in ASS1-deficient cells completely rescued the downregulation of CPT1A mRNA and protein levels (Fig. 4H,I). Conversely, supplementation with a control amino acid (glycine) was ineffective. These results demonstrate that ASS1 controls CPT1A transcription by maintaining intracellular arginine levels through its enzymatic activity.
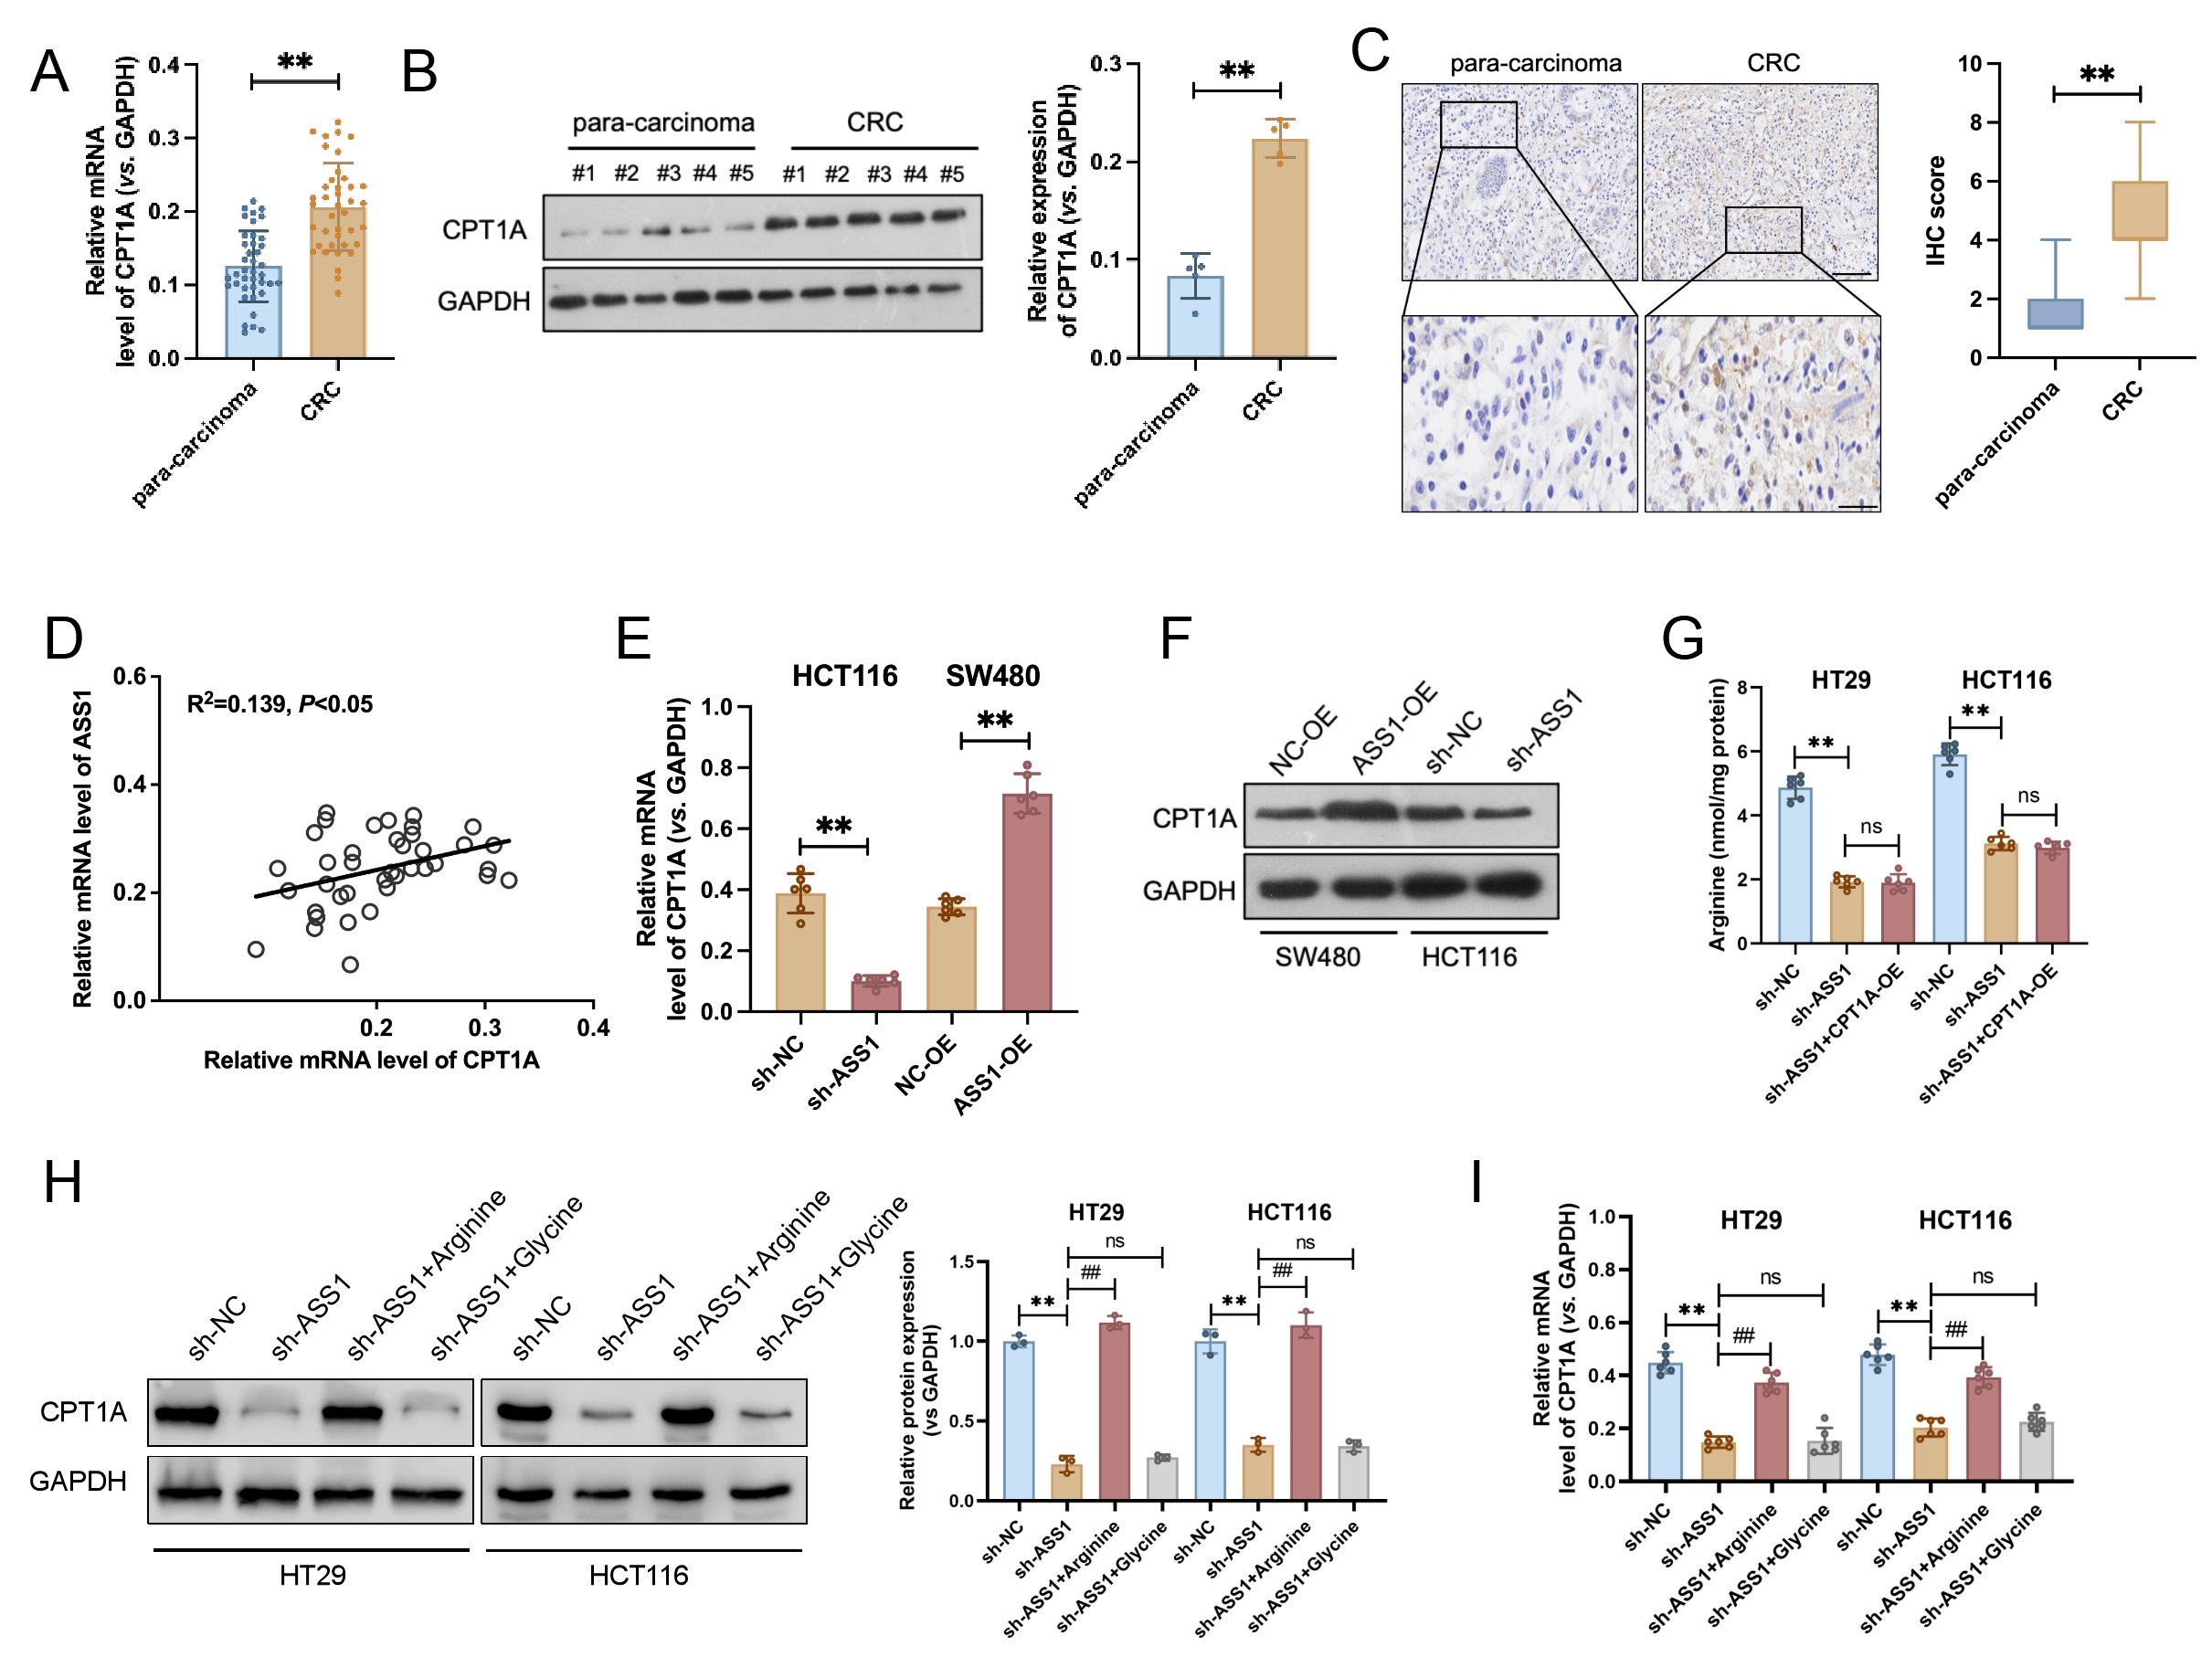 Fig. 4.
ASS1 positively regulates CPT1A expression in CRC. (A,B) mRNA
(n = 40) and protein (n = 5) levels of CPT1A were significantly upregulated in
tumor tissues compared to matched para-carcinoma tissues from 40 patients with
CRC. (C) Representative IHC images exhibited weak CPT1A staining in
para-carcinoma tissues and strong staining in CRC tissues (n = 40, normal, 200
µm; enlarged, 100 µm). **p
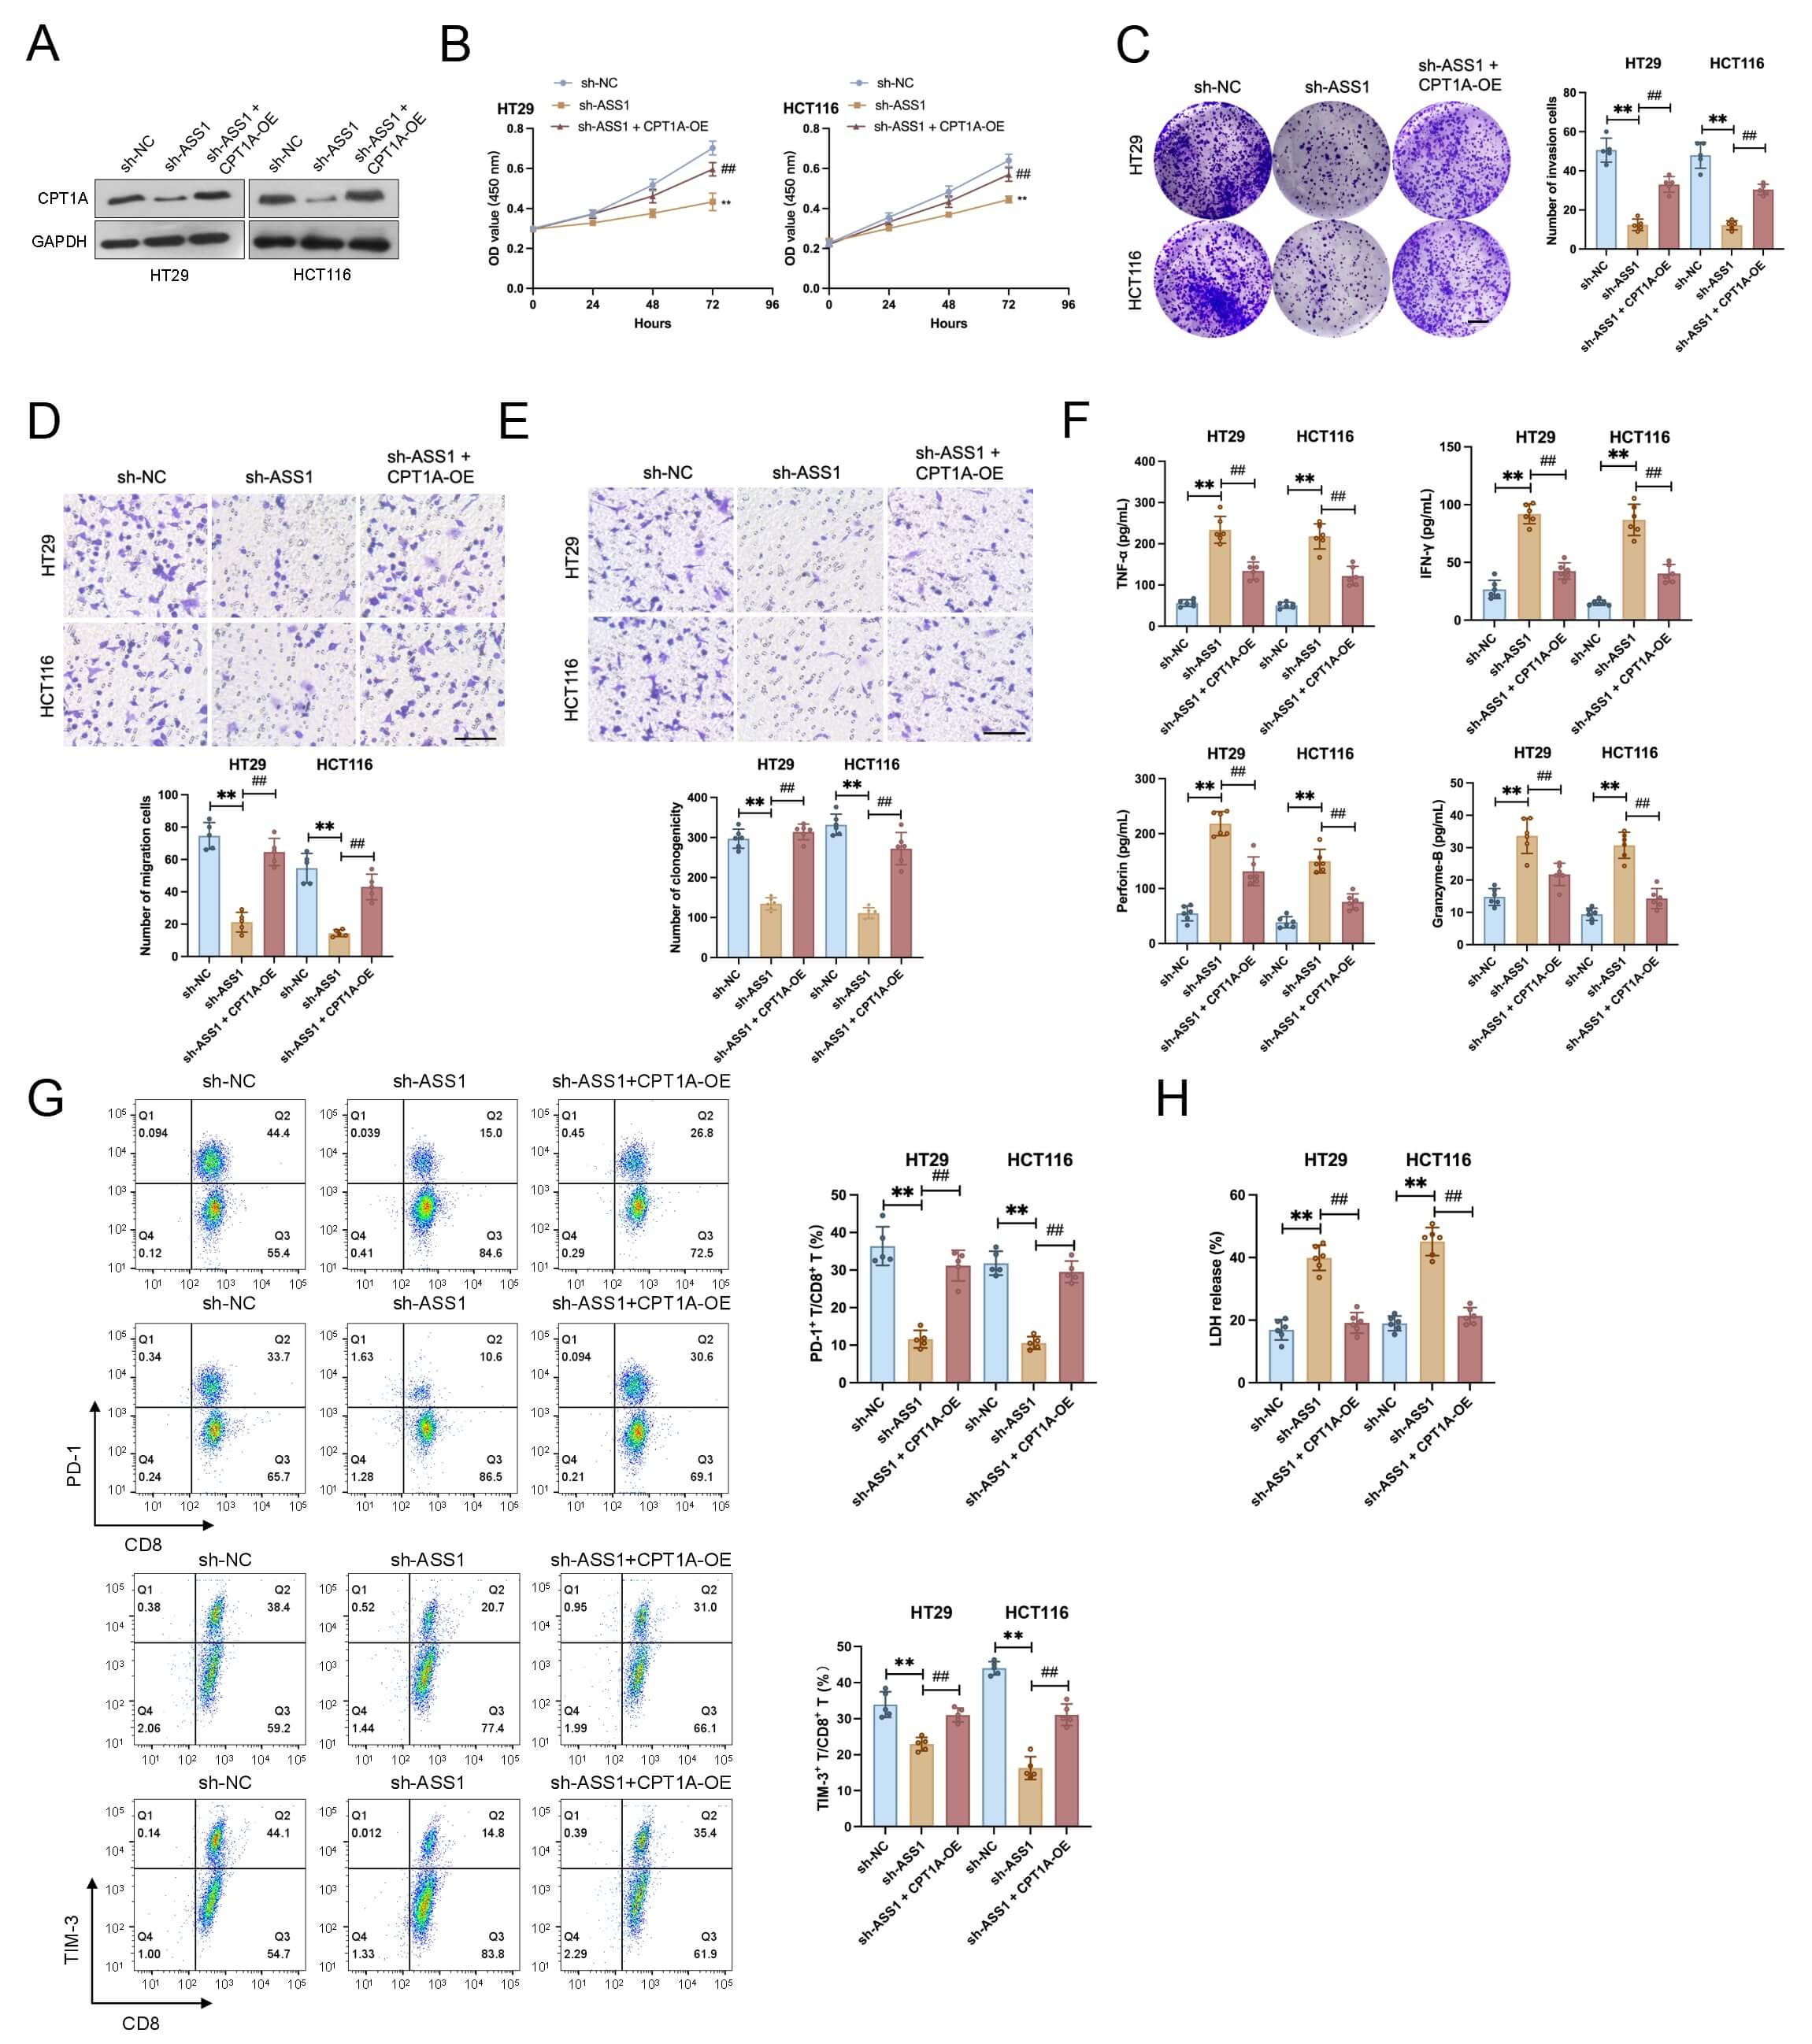
To evaluate functional rescue, we established CPT1A-overexpressing HCT116 and
HT29 cell lines (Fig. 5A). ASS1 knockdown dramatically reduced cell
proliferation, clonogenicity, migration, and invasion in both cell lines,
according to functional experiments. These inhibitory effects were effectively
reversed by CPT1A overexpression (Fig. 5B–E). In co-culture assays, ASS1
knockdown potentiated the anti-tumor function of CD8+ T cells in co-culture,
as demonstrated by two key findings: elevated secretion of effector molecules
(IFN-
 Fig. 5.
CPT1A overexpression rescues the tumor-suppressive and
immunostimulatory effects of ASS1 knockdown in CRC cells. (A) Establishment of
CPT1A-overexpressing HCT116 and HT29 cell lines (n = 3). (B–E) Functional assays
exhibited that ASS1 knockdown inhibited proliferation (B, n = 6), colony
formation (C, n = 5, Scale bar: 10 mm), migration (D, n = 5, Scale bar: 100
µm), and invasion (E, n = 5, Scale bar: 100 µm) in CRC cells, which
were reversed by CPT1A overexpression. (F) Increased secretion of CD8+ T
cell effector molecules (interferon [IFN]-
We further studied S100A10 expression in CRC clinical samples. Elevated S100A10 mRNA levels in tumors versus paracancerous tissues were detected by qRT-PCR (Fig. 6A). Consistent with the mRNA data, Western blotting confirmed that S100A10 protein was also markedly upregulated in tumor samples (Fig. 6B, and Supplementary Fig. 3A). IHC analysis corroborated these results, demonstrating weak S100A10 staining in paracancerous areas but intense positive staining in CRC tissues (Fig. 6C). Strong significant correlations between S100A10 expression and CPT1A and ASS1 expression were found by correlation analysis (Fig. 6D). Importantly, elevated expression of each gene (ASS1, CPT1A, or S100A10) correlated with advanced tumor stage (Stage III/IV) (Supplementary Fig. 4A–F). Furthermore, Kaplan-Meier analysis revealed that high expression of these genes was individually associated with significantly shorter overall survival in CRC patients (Supplementary Fig. 4G–I). In HT29 and HCT116 cells, co-IP studies verified a direct connection between CPT1A and S100A10 (Fig. 6E). Immunoprecipitation using an anti-CPT1A antibody efficiently enriched the S100A10. When Flag-CPT1A and HA-S100A10 were co-overexpressed in HEK293T cells, strong S100A10 succinylation was observed. Conversely, the K47R mutant exhibited a significantly reduced succinylation (Fig. 6F). Similarly, CPT1A overexpression in CRC cell lines HT29 and HCT116 markedly enhanced S100A10 succinylation, while the K47R mutant revealed substantially less succinylation (Fig. 6G). CHX-chase assays indicated that CPT1A overexpression delayed the S100A10 protein degradation, suggesting that CPT1A stabilizes S100A10 via promoting its succinylation (Fig. 6H,I, and Supplementary Fig. 3B,C). Even under CPT1A overexpression, the K47R mutant was rapidly degraded, implying that succinylation at lysine 47 is essential for maintaining S100A10 protein stability. Additional experiments suggested that ASS1 regulates S100A10 expression through CPT1A. Specifically, ASS1 knockdown significantly reduced S100A10 protein levels, and this reduction was reversed by CPT1A overexpression (Fig. 6J,K, and Supplementary Fig. 3D,E). Together, these findings demonstrate that CPT1A promotes succinylation of S100A10 at K47, thereby stabilizing the protein and upregulating its expression in CRC cells.
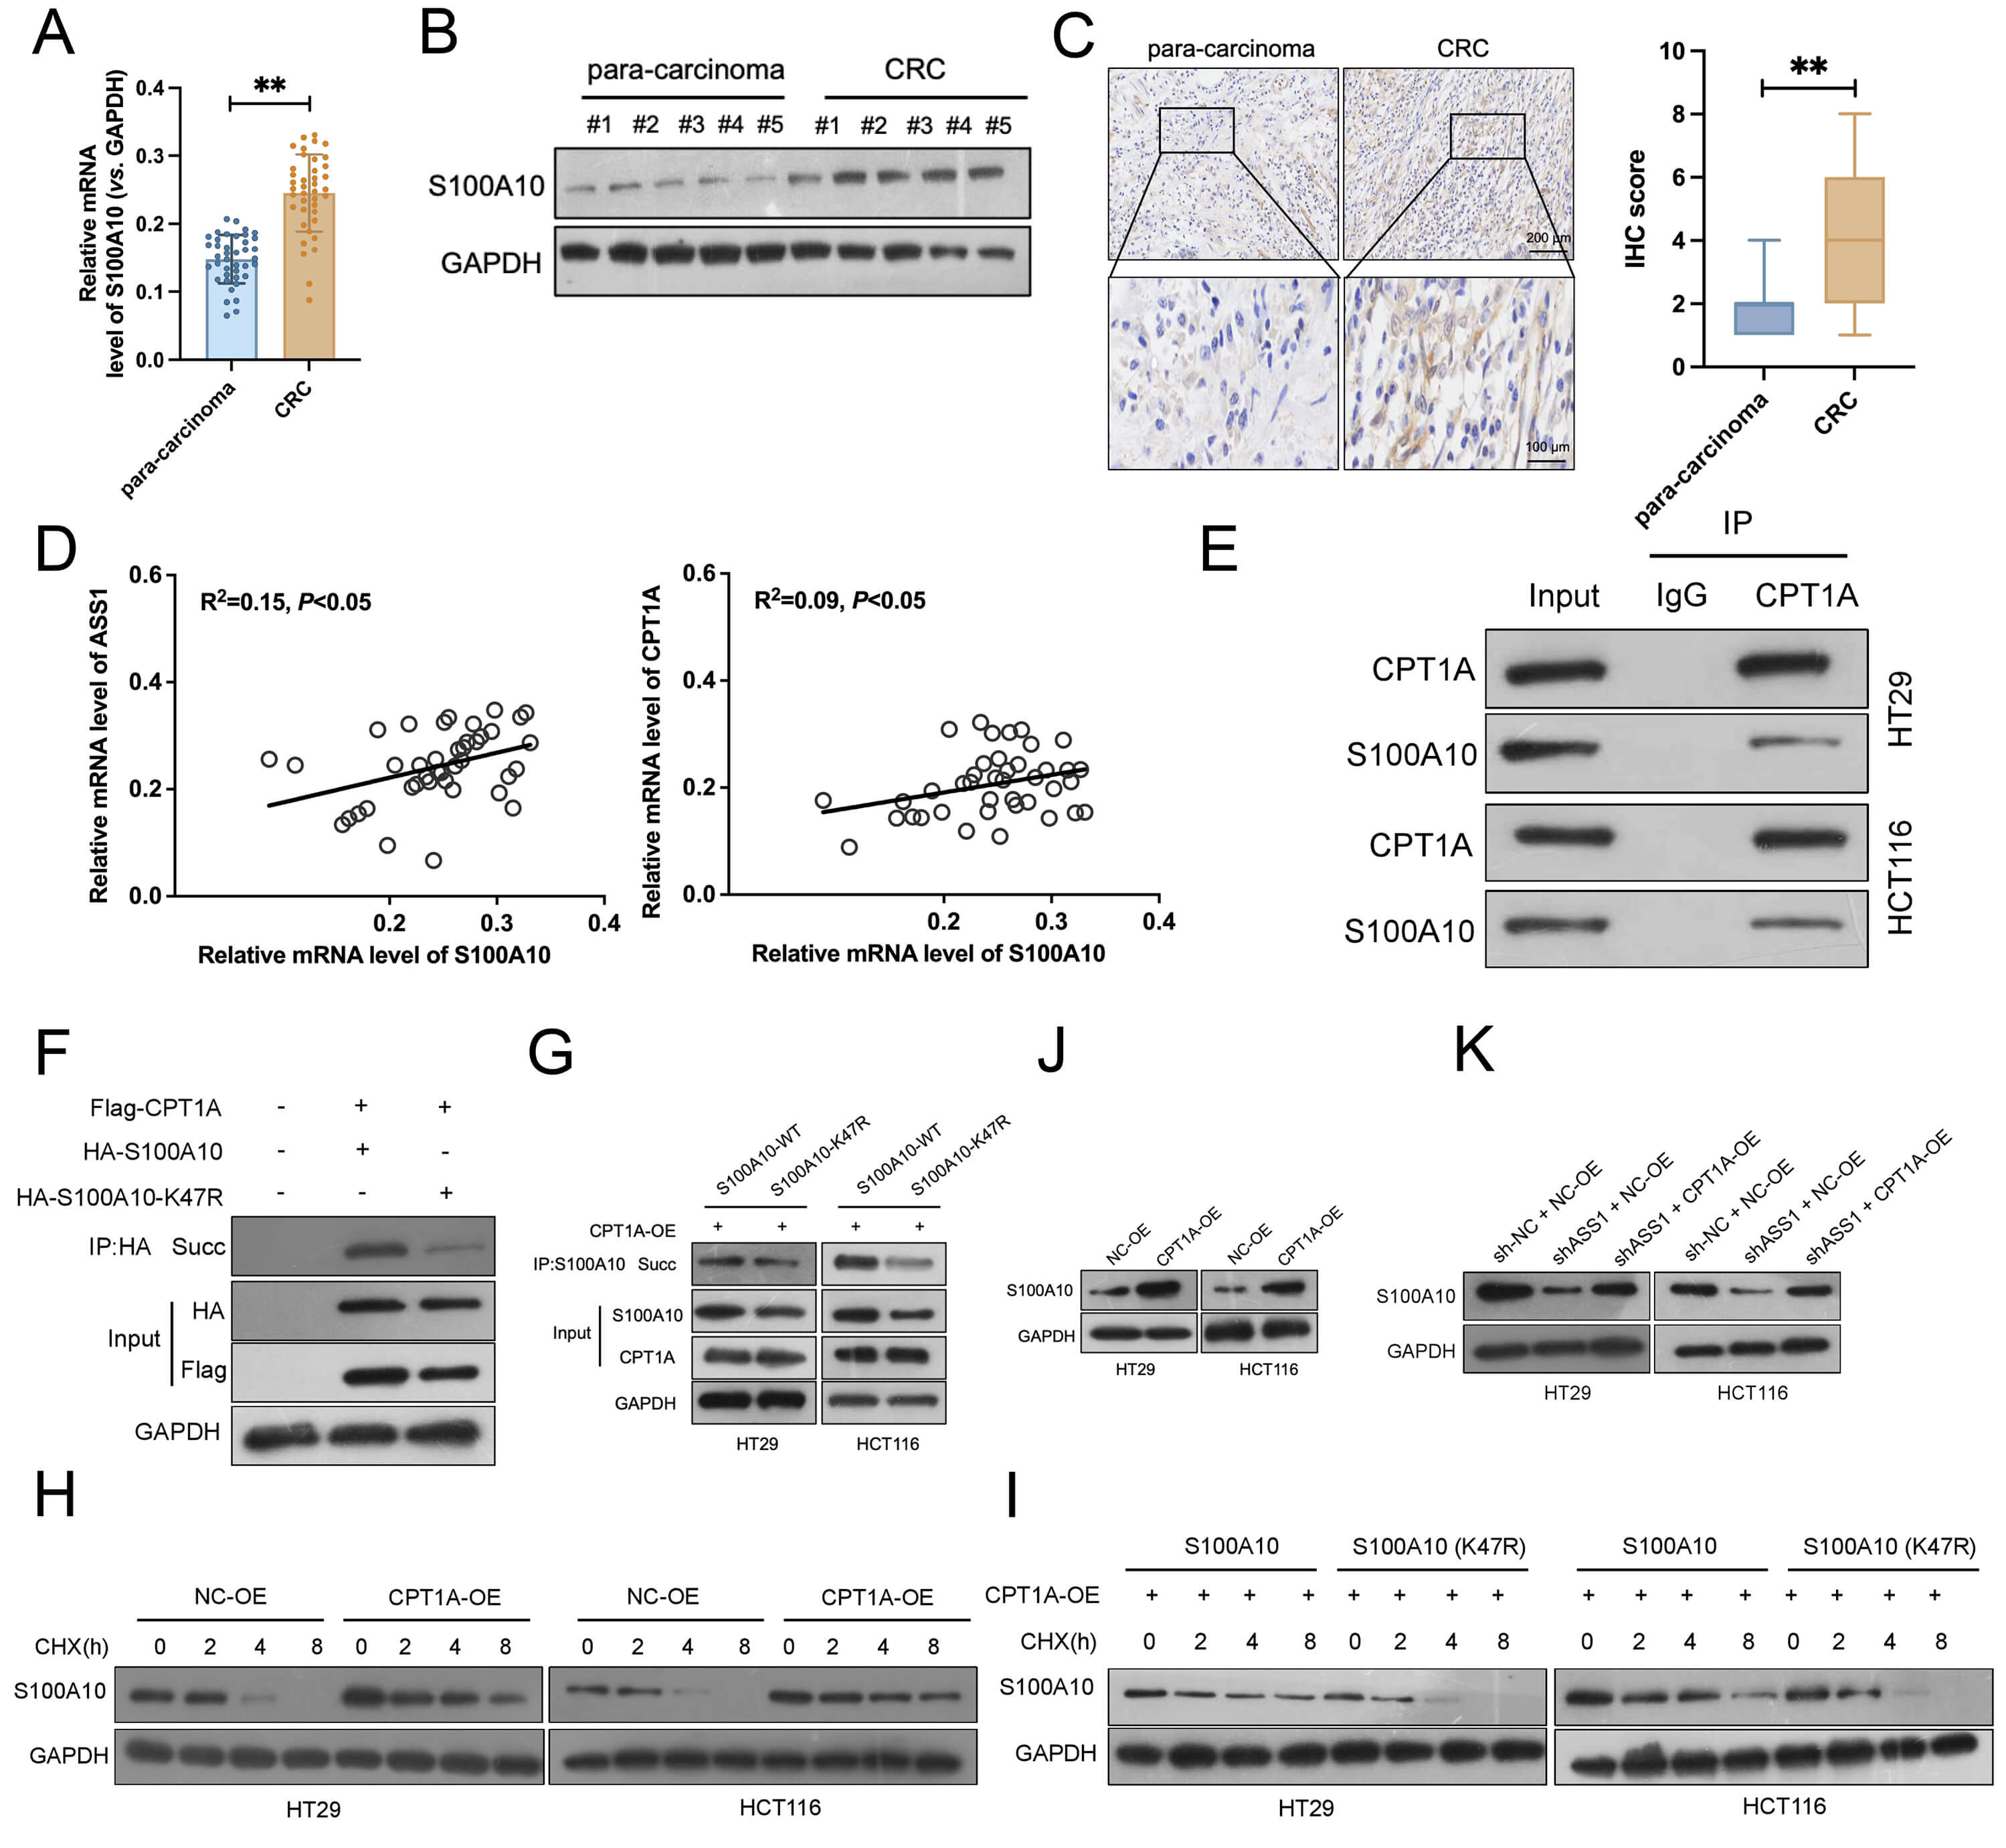 Fig. 6.
CPT1A-mediated succinylation stabilizes S100A10 and promotes its
expression in CRC cells. (A) qRT-PCR analysis of S100A10 mRNA expression in CRC
tumors and matched paracancerous tissues (n = 40). (B) Western blotting of
S100A10 protein levels in clinical CRC samples and paracancerous tissues (n = 5).
(C) Representative IHC images exhibited S100A10 expression in CRC and
paracancerous tissues (n = 40, normal, 200 µm; enlarged, 100 µm). (D)
Correlation analysis between S100A10 expression and CPT1A or ASS1 levels in CRC
samples. (E) Co-immunoprecipitation (Co-IP) assays confirmed the direct
interaction between CPT1A and S100A10 in HT29 and HCT116 cells. (F) Succinylation
of S100A10 in HEK293T cells co-expressing Flag-CPT1A and HA-S100A10 wild-type
(WT) or K47R mutant. (G) Enhanced succinylation of S100A10 WT but not K47R mutant
after CPT1A overexpression in HT29 and HCT116 cells. (H,I) Cycloheximide (CHX)
chase assays exhibited the S100A10 protein degradation with or without CPT1A
overexpression (n = 3). (J,K) Western blotting revealed that ASS1 knockdown
reduced S100A10 protein levels, which could be rescued by CPT1A overexpression (n
= 3). **p
ASS1 knockdown dramatically reduced invasion, migration, colony formation, and cell proliferation. These inhibitory effects were markedly reversed by S100A10 overexpression (Fig. 7A–D). In a co-culture system with CD8+ T cells, ASS1 knockdown significantly enhanced CD8+ T cell cytotoxicity against HCT116 cells. This enhanced cytotoxicity was reversed by S100A10 overexpression, as indicated by the restoration of cytotoxic factor secretion to baseline levels and a significant increase in the PD-1+/CD8+ and TIM-3+/CD8+ T cell proportion (Fig. 7E,F). Consistent with these findings, ASS1-knockdown tumor cells revealed a significantly higher LDH release rate when co-cultured with CD8+ T cells, which was attenuated after S100A10 overexpression (Fig. 7G).
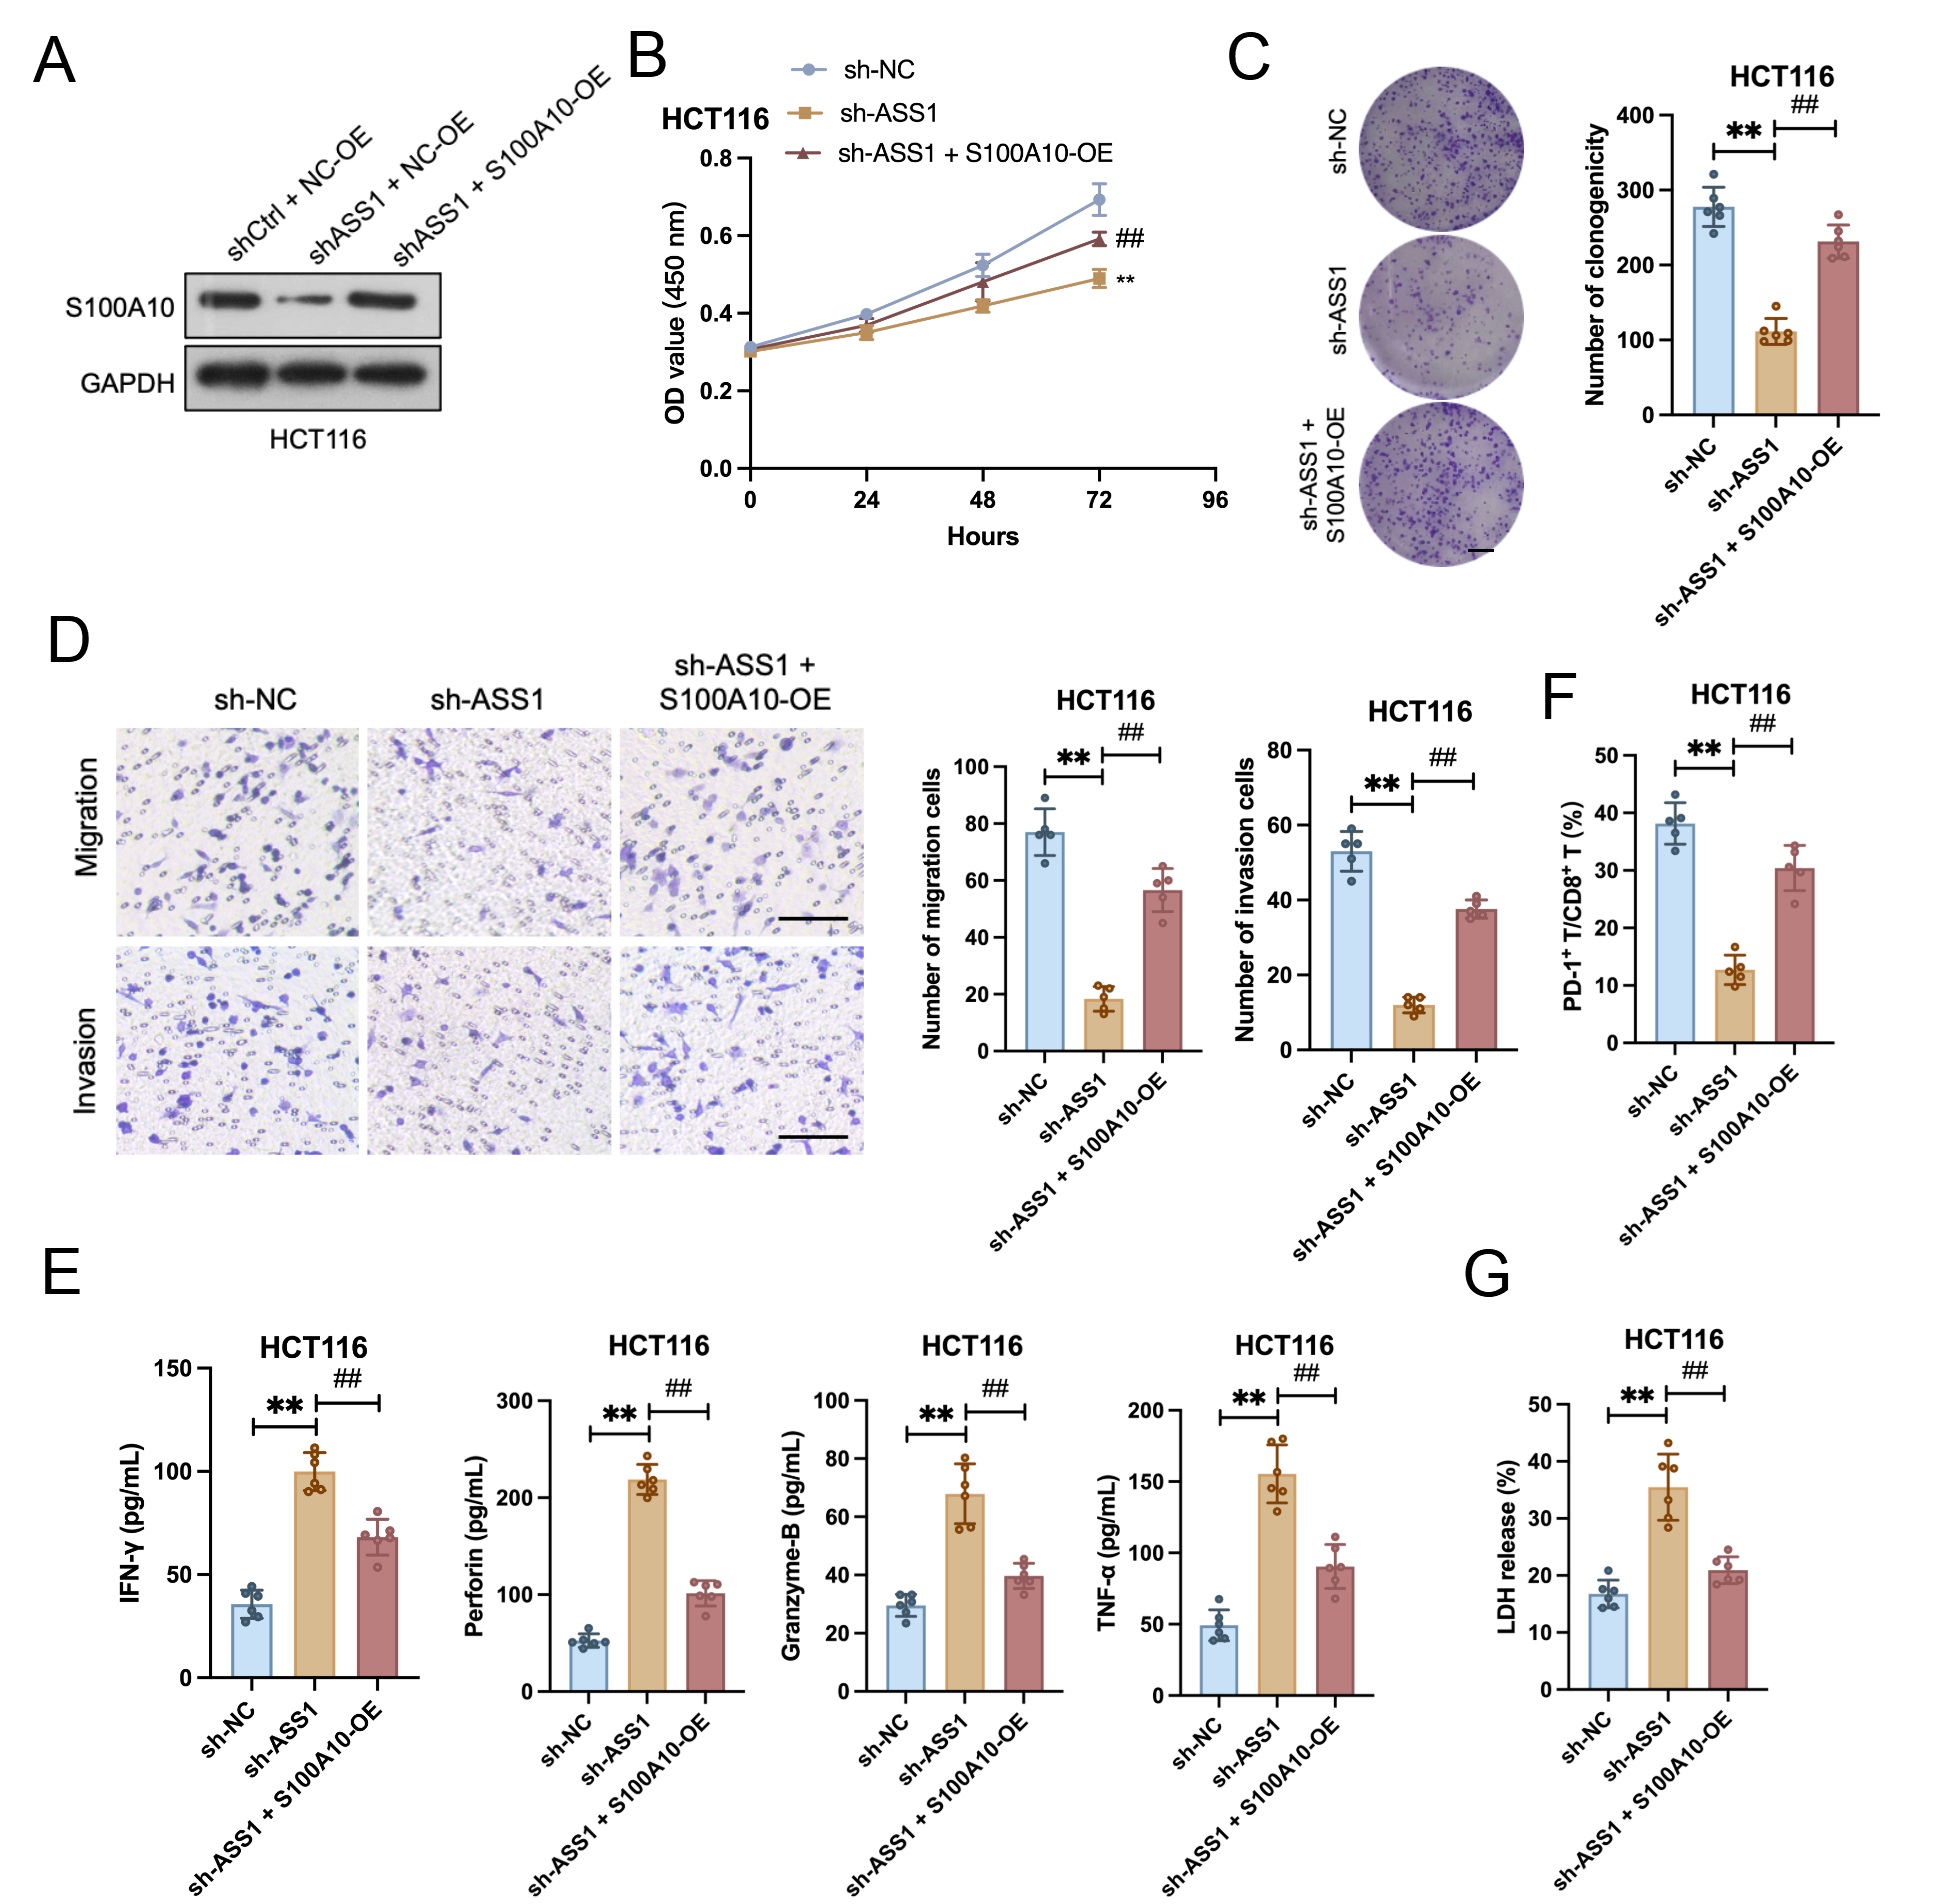 Fig. 7.
S100A10 overexpression rescues the tumor-promotive and
immune-evasive functions impaired by ASS1 knockdown. (A) Western blotting of
S100A10 in HCT116 cells (n = 3). (B) CCK-8 assay (n = 6). (C) Colony formation
assay (n = 6, scale bar: 10 mm). (D) Transwell migration/invasion assay (n = 5).
Scale bar: 100 µm. (E) Enzyme-linked immunosorbent assay (ELISA) analysis
of cytotoxic factors (IFN-
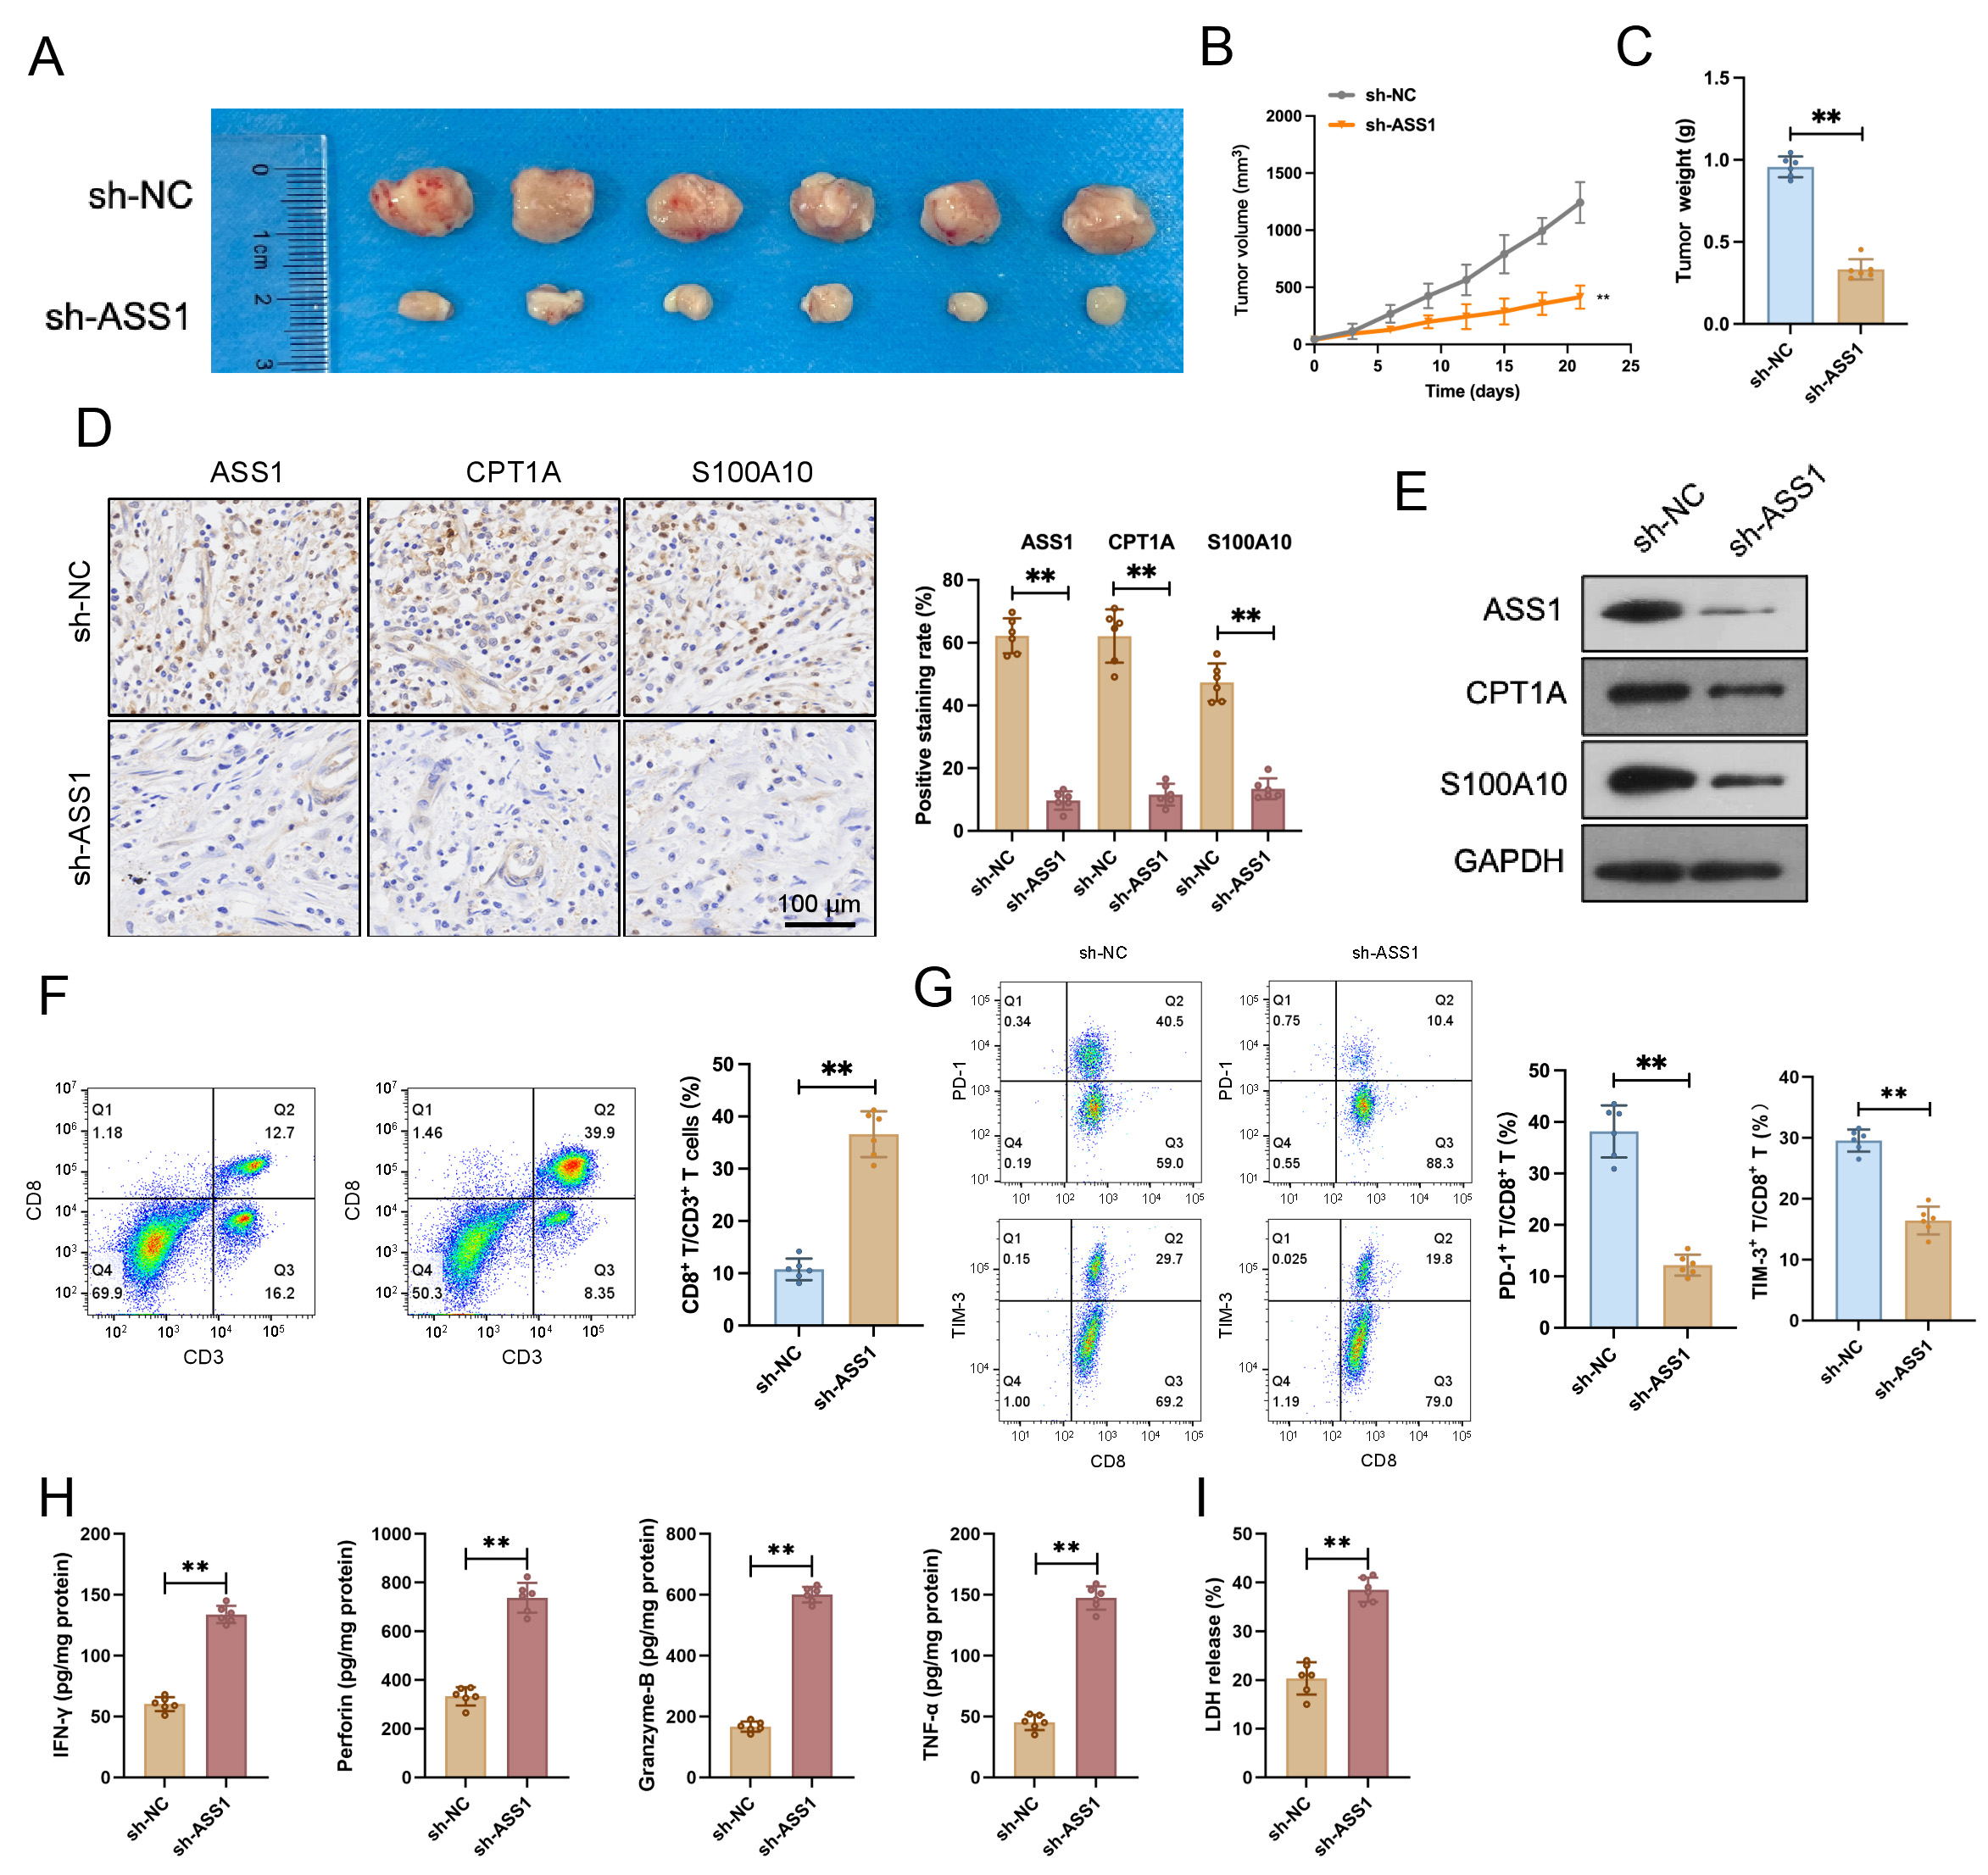
According to experimental results, the sh-ASS1 group showed considerably lower
tumor volume and weight than the sh-NC group in a CT26 cell transplantation tumor
model created in C57BL/6 mice (Fig. 8A–C). IHC and Western blotting revealed
markedly decreased ASS1, CPT1A, and S100A10 expression levels in tumor tissues
from the sh-ASS1 group (Fig. 8D,E). Flow cytometry results indicated a
significant increase in the CD8+ T cell proportion and a notable decrease in
the PD-1+ rate and TIM-3+ rate among tumor-infiltrating lymphocytes in
the sh-ASS1 group compared to the sh-NC group (Fig. 8F,G and
Supplementary Fig. 5A–C). ELISA revealed that sh-ASS1 CT26 cell-derived
tumors contained significantly elevated levels of the cytotoxic effector
molecules IFN-
 Fig. 8.
ASS1 knockdown inhibits tumor growth and modulates the immune
microenvironment in a CT26 murine CRC model. (A) Tumor appearance in each group (n=6). (B,C) Tumor volume curve (B) and tumor weight (C) were significantly reduced in mice injected with CT26 cells stably expressing sh-ASS1 compared to the sh-NC group (n = 6). (D) Representative IHC
staining and quantitative analysis exhibited decreased protein expression of
ASS1, CPT1A, and S100A10 in the sh-ASS1 group tumor tissues (n = 6). Scale bar:
100 µm. (E) Western blotting of ASS1, CPT1A, and S100A10 in tumor tissues
(n = 3). (F,G) Flow cytometry analysis revealed an increased CD8+ T cell
proportion (F) and a decreased PD-1+ rate (or TIM-3+ rate) among
tumor-infiltrating lymphocytes (G) in the sh-ASS1 group compared to sh-NC (n =
6). (H) Enzyme-linked immunosorbent assay (ELISA) analysis of cytotoxic factors
(IFN-
CRC remains the malignancy with the greatest global incidence and mortality. Despite considerable advances have been made in improving outcomes for patients with metastatic CRC, many continue to encounter challenges, including treatment resistance and immune evasion. The acidic and hypoxic tumor microenvironment is thought to contribute to these suboptimal therapeutic outcomes [20]. Consequently, elucidating CRC pathogenesis and identifying the key factors driving its progression are essential for developing more effective treatment strategies.
Initially, through bioinformatics analysis, validation in clinical tissue
samples, and cell-based models, we consistently observed high ASS1 expression in
CRC tissues. This expression pattern implicates ASS1 in the malignant progression
of CRC, offering a rationale for subsequent functional studies [21]. Previous
studies have revealed that ASS1, a crucial urea cycle enzyme, is critical for
endogenous arginine synthesis. It regulates cellular energy homeostasis and
balances pyrimidine and purine metabolites. Elevated ASS1 expression promotes
cell proliferation, migration, and metastasis in various cancers, including lung,
colon, gastric, and ovarian cancers [11, 21, 22, 23, 24]. The pro-tumorigenic role of ASS1
is further supported by our experimental findings, which showed that ASS1
overexpression increased these malignant behaviors whereas ASS1 knockdown
dramatically reduced these behaviors. These findings indicate that ASS1 promotes
tumor progression by modulating core cellular behaviors in CRC, consistent with
its high expression and functional effects. Notably, ASS1 is vital for regulating
the tumor immune microenvironment. ASS1 knockdown significantly improved
CD8+ T cells’ cytotoxic activity, decreased signs of exhaustion, and
increased their capacity to secrete cytokines (IFN-
To clarify the molecular mechanisms underlying ASS1’s role in CRC, this study
systematically investigated its downstream regulatory pathways. Located on the
mitochondrial outer membrane, CPT1A is a key regulatory enzyme that controls the
transport of long-chain fatty acids into the mitochondria for
The role of S100A10 as a plasminogen receptor is vital for tumor invasiveness, angiogenesis, and metastasis [17, 28, 29]. Its widespread upregulation in cancer is attributed to transcriptional activation and post-translational stabilization. Although S100A10 is inherently unstable, its binding to annexin A2 protects it from ubiquitin-dependent proteolysis [30, 31]. Here, we further demonstrate that CPT1A binds directly to S100A10 and promotes its succinylation specifically at the K47 site. This modification significantly delays S100A10 degradation and enhances its protein stability. S100A10 overexpression reversed the anti-tumor and immunomodulatory effects caused by ASS1 knockdown, indicating that the ASS1/CPT1A/S100A10 axis forms a key molecular pathway that mediates malignant behavior and immune evasion in CRC. Notably, CPT1A-mediated succinylation of S100A10 offers novel understanding into the regulation of tumor progression in CRC through post-translational modifications.
In vivo experiments further confirmed the physiological relevance of this mechanism. Significant inhibition of CRC cell growth in vivo was observed with ASS1 knockdown, which also reduced the expression of ASS1, CPT1A, and S100A10 in tumor tissues and improved the tumor immune microenvironment, as shown by increased CD8+ T cell infiltration and decreased PD-1 expression. These findings align with the in vitro results, affirming the essential regulatory function of ASS1 in CRC progression and immune modulation in vivo. Despite the findings presented, this study is subject to several limitations. First, the mechanisms through which ASS1 transcriptionally regulates CPT1A expression are unclear. Further studies using chromatin immunoprecipitation or dual-luciferase reporter assays are necessary to identify the potential transcription factors involved. Furthermore, this research mainly depended on xenograft mouse models, which might not completely capture the complexity and immune environment of human tumors. Future research employing patient-derived organoids or genetically engineered mouse models with intact immune systems might offer insights that are more applicable to clinical settings. Finally, the clinical translational potential of targeting this axis, including the development and specificity of inhibitors targeting ASS1 or CPT1A enzymatic activity, requires thorough evaluation.
This study has several limitations. First, the mechanisms by which ASS1 transcriptionally regulates CPT1A expression remain to be elucidated. Further investigations employing chromatin immunoprecipitation (ChIP) or dual-luciferase reporter assays are required to identify the potential transcription factors involved in this regulation. Second, this study predominantly relied on xenograft mouse models, which may not fully recapitulate the complexity and immune microenvironment of human colorectal cancer. Future research utilizing patient-derived organoids or genetically engineered mouse models with an intact immune system could provide insights that are more directly translatable to clinical settings. Finally, the clinical translational potential of targeting the ASS1/CPT1A/S100A10 axis, including the development and specificity of inhibitors directed against the enzymatic activities of ASS1 or CPT1A, warrants thorough evaluation.
Overall, the research explains the role of ASS1 in CRC, including its expression, biological functions, and the mechanisms that contribute to malignancy and immune evasion. We demonstrate that ASS1 enhances the stability of S100A10 protein by facilitating CPT1A-mediated succinylation at the K47 site, thereby driving malignant behaviors and immune escape in CRC cells. This research offers a new mechanistic basis for comprehending CRC pathogenesis and underscores the potential of targeting the ASS1/CPT1A/S100A10 axis for CRC diagnosis and treatment.
The data sets utilized or analyzed in this study can be obtained from the corresponding author upon reasonable request.
LS and DF conceived and designed the study. LS, DF, and HZ conducted the experiments, collected data, and performed analysis. LS and HZ wrote the manuscript. All authors reviewed and approved the final manuscript. All authors contributed to editorial changes in the manuscript. All authors have participated sufficiently in the work and agreed to be accountable for all aspects of the work.
This study was approved by the Ethics Committee of the Central Hospital of Zibo for human subject research (Ethics Approval No. IRB-ZBCH-2024-078A) and for animal experiments (Ethics Approval No. IACUC-ZBCH-2024-110B). All animal experiments were performed in compliance with the 3Rs principle (Replacement, Reduction, and Refinement) and followed the guidelines of the Public Health Service Policy and WHO. Written informed consent was obtained from all human participants in accordance with the Helsinki Declaration.
Not applicable.
This research received no external funding.
The authors declare no conflict of interest.
Supplementary material associated with this article can be found, in the online version, at https://doi.org/10.31083/FBL48764.
References
Publisher’s Note: IMR Press stays neutral with regard to jurisdictional claims in published maps and institutional affiliations.