[1]Li Z, Yang Y, Wang X, Yang N, He L, Wang J, et al. Comparative analysis of atherosclerotic cardiovascular disease burden between ages 20-54 and over 55 years: insights from the Global Burden of Disease Study 2019. BMC Medicine. 2024; 22: 303. https://doi.org/10.1186/s12916-024-03527-4.
[2]Lin MJ, Hu SL, Tian Y, Zhang J, Liang N, Sun R, et al. Targeting Vascular Smooth Muscle Cell Senescence: A Novel Strategy for Vascular Diseases. Journal of Cardiovascular Translational Research. 2023; 16: 1010–1020. https://doi.org/10.1007/s12265-023-10377-7.
[3]Suda M, Paul KH, Minamino T, Miller JD, Lerman A, Ellison-Hughes GM, et al. Senescent Cells: A Therapeutic Target in Cardiovascular Diseases. Cells. 2023; 12: 1296. https://doi.org/10.3390/cells12091296.
[4]Shu Z, Li X, Zhang W, Huyan Z, Cheng D, Xie S, et al. MG-132 activates sodium palmitate-induced autophagy in human vascular smooth muscle cells and inhibits senescence via the PI3K/AKT/mTOR axis. Lipids in Health and Disease. 2024; 23: 282. https://doi.org/10.1186/s12944-024-02268-w.
[6]Whaley-Connell A, Johnson MS, Sowers JR. Aldosterone: role in the cardiometabolic syndrome and resistant hypertension. Progress in Cardiovascular Diseases. 2010; 52: 401–409. https://doi.org/10.1016/j.pcad.2009.12.004.
[7]Kunieda T, Minamino T, Nishi JI, Tateno K, Oyama T, Katsuno T, et al. Angiotensin II induces premature senescence of vascular smooth muscle cells and accelerates the development of atherosclerosis via a p21-dependent pathway. Circulation. 2006; 114: 953–960. https://doi.org/10.1161/CIRCULATIONAHA.106.626606.
[9]Liao X, Sluimer JC, Wang Y, Subramanian M, Brown K, Pattison JS, et al. Macrophage autophagy plays a protective role in advanced atherosclerosis. Cell Metabolism. 2012; 15: 545–553. https://doi.org/10.1016/j.cmet.2012.01.022.
[10]Hyun SW, Lee TG, Song SJ, Kim CS. Evaluation of oral toxicity and genotoxicity of Achyranthis Radix extract. Journal of Ethnopharmacology. 2021; 274: 113944. https://doi.org/10.1016/j.jep.2021.113944.
[11]Chen YR, Niu YS, Zhou HL. Achyranthes bidentata Blume (Amaranthaceae): a review of its botany, traditional uses, phytochemistry, pharmacology, and toxicology. The Journal of Pharmacy and Pharmacology. 2024; 76: 930–966. https://doi.org/10.1093/jpp/rgae012.
[12]He X, Wang X, Fang J, Chang Y, Ning N, Guo H, et al. The genus Achyranthes: A review on traditional uses, phytochemistry, and pharmacological activities. Journal of Ethnopharmacology. 2017; 203: 260–278. https://doi.org/10.1016/j.jep.2017.03.035.
[13]Mohammed SAD, Liu H, Baldi S, Chen P, Lu F, Liu S. GJD Modulates Cardiac/Vascular Inflammation and Decreases Blood Pressure in Hypertensive Rats. Mediators of Inflammation. 2022; 2022: 7345116. https://doi.org/10.1155/2022/7345116.
[14]Zou Y, Wang R, Guo H, Dong M. Phytoestrogen β-Ecdysterone Protects PC12 Cells Against MPP+-Induced Neurotoxicity In Vitro: Involvement of PI3K-Nrf2-Regulated Pathway. Toxicological Sciences: an official journal of the Society of Toxicology. 2015; 147: 28–38. https://doi.org/10.1093/toxsci/kfv111.
[16]Buniam J, Chukijrungroat N, Rattanavichit Y, Surapongchai J, Weerachayaphorn J, Bupha-Intr T, et al. 20-Hydroxyecdysone ameliorates metabolic and cardiovascular dysfunction in high-fat-high-fructose-fed ovariectomized rats. BMC Complementary Medicine and Therapies. 2020; 20: 140. https://doi.org/10.1186/s12906-020-02936-1.
[17]Zhang X, Xu X, Xu T, Qin S. β-Ecdysterone suppresses interleukin-1β-induced apoptosis and inflammation in rat chondrocytes via inhibition of NF-κB signaling pathway. Drug Development Research. 2014; 75: 195–201. https://doi.org/10.1002/ddr.21170.
[20]Yan P, Li X, He Y, Zhang Y, Wang Y, Liu J, et al. The synergistic protective effects of paeoniflorin and β-ecdysterone against cardiac hypertrophy through suppressing oxidative stress and ferroptosis. Cellular Signalling. 2025; 125: 111509. https://doi.org/10.1016/j.cellsig.2024.111509.
[21]Wen F, Yu J, He CJ, Zhang ZW, Yang AF. β ecdysterone protects against apoptosis by promoting autophagy in nucleus pulposus cells and ameliorates disc degeneration. Molecular Medicine Reports. 2019; 19: 2440–2448. https://doi.org/10.3892/mmr.2019.9861.
[24]Sikora E, Bielak-Zmijewska A, Mosieniak G. A common signature of cellular senescence; does it exist? Ageing Research Reviews. 2021; 71: 101458. https://doi.org/10.1016/j.arr.2021.101458.
[25]Wirawan E, Vanden Berghe T, Lippens S, Agostinis P, Vandenabeele P. Autophagy: for better or for worse. Cell Research. 2012; 22: 43–61. https://doi.org/10.1038/cr.2011.152.
[26]Mondaca-Ruff D, Quiroga C, Norambuena-Soto I, Riquelme JA, San Martin A, Bustamante M, et al. Regulation of total LC3 levels by angiotensin II in vascular smooth muscle cells. Journal of Cellular and Molecular Medicine. 2022; 26: 1710–1713. https://doi.org/10.1111/jcmm.17215.
[28]Xu XJ, Zhao WB, Feng SB, Sun C, Chen Q, Ni B, et al. Celastrol alleviates angiotensin II mediated vascular smooth muscle cell senescence via induction of autophagy. Molecular Medicine Reports. 2017; 16: 7657–7664. https://doi.org/10.3892/mmr.2017.7533.
[30]Zhang Y, Peng X, Xue M, Liu J, Shang G, Jiang M, et al. SARS-COV-2 spike protein promotes RPE cell senescence via the ROS/P53/P21 pathway. Biogerontology. 2023; 24: 813–827. https://doi.org/10.1007/s10522-023-10019-0.
[31]Davalli P, Mitic T, Caporali A, Lauriola A, D’Arca D. ROS, Cell Senescence, and Novel Molecular Mechanisms in Aging and Age-Related Diseases. Oxidative Medicine and Cellular Longevity. 2016; 2016: 3565127. https://doi.org/10.1155/2016/3565127.
[32]Tsai IC, Pan ZC, Cheng HP, Liu CH, Lin BT, Jiang MJ. Reactive oxygen species derived from NADPH oxidase 1 and mitochondria mediate angiotensin II-induced smooth muscle cell senescence. Journal of Molecular and Cellular Cardiology. 2016; 98: 18–27. https://doi.org/10.1016/j.yjmcc.2016.07.001.
[33]Qu X, Pan P, Cao S, Ma Y, Yang J, Gao H, et al. Immp2l Deficiency Induced Granulosa Cell Senescence Through STAT1/ATF4 Mediated UPRmt and STAT1/(ATF4)/HIF1α/BNIP3 Mediated Mitophagy: Prevented by Enocyanin. International Journal of Molecular Sciences. 2024; 25: 11122. https://doi.org/10.3390/ijms252011122.
[34]Ji W, Sun J, Hu Z, Sun B. Resveratrol protects against atherosclerosis by downregulating the PI3K/AKT/mTOR signaling pathway in atherosclerosis model mice. Experimental and Therapeutic Medicine. 2022; 23: 414. https://doi.org/10.3892/etm.2022.11341.
[35]Wei J, Huang L, Li D, He J, Li Y, He F, et al. Total Flavonoids of Engelhardia roxburghiana Wall. Leaves Alleviated Foam Cells Formation through AKT/mTOR-Mediated Autophagy in the Progression of Atherosclerosis. Chemistry & Biodiversity. 2021; 18: e2100308. https://doi.org/10.1002/cbdv.202100308.
[36]Pi S, Mao L, Chen J, Shi H, Liu Y, Guo X, et al. The P2RY12 receptor promotes VSMC-derived foam cell formation by inhibiting autophagy in advanced atherosclerosis. Autophagy. 2021; 17: 980–1000. https://doi.org/10.1080/15548627.2020.1741202.
[37]Fan X, He Y, Wu G, Chen H, Cheng X, Zhan Y, et al. Sirt3 activates autophagy to prevent DOX-induced senescence by inactivating PI3K/AKT/mTOR pathway in A549 cells. Biochimica et Biophysica Acta. Molecular Cell Research. 2023; 1870: 119411. https://doi.org/10.1016/j.bbamcr.2022.119411.
β-Ecdysterone Attenuates Ang II–Induced Senescence in Human Aortic Smooth Muscle Cells via Autophagy Activation and ROS Suppression Through AKT/mTOR Pathway Inhibition
Di Wu 1,†, Tao Dong 2,†, Yitong Li 1, Honghong Wang 1, Lulu Wang 2, Xiaodong Zhang 2, Chengrun Song 1, Hongming Pan 2, Haifeng Jin 2, Lei Shen 2,*
Affiliations
Article Info
1 Basic Medical Research Center, Qiqihar Medical University, 161006 Qiqihar, Heilongjiang, China
2 Heilongjiang Provincial Key Laboratory of Medicine-Food Homologous Resources and Metabolic Disease Prevention and Control, Qiqihar Medical University, 161006 Qiqihar, Heilongjiang, China
This study aimed to elucidate the protective effects of β-ecdysterone (β-Ecd) against premature senescence in human aortic smooth muscle cells (HASMCs) and to unravel the underlying mechanisms.
Methods:
HASMCs’ senescence was induced with angiotensin II (Ang II), and cells were then treated with β-Ecd. Cell viability was assessed using the Cell Counting Kit-8 (CCK-8) assay. Cellular senescence was evaluated by senescence-associated β-galactosidase (SA-β-gal) staining, cell cycle analysis, and western blotting for the senescence-associated proteins tumor protein p53 (p53) and cyclin-dependent kinase inhibitor 1A (p21). IL-6 and MCP-1 levels in culture supernatants were measured using enzyme-linked immunosorbent assay (ELISA). Autophagy was assessed by microtubule-associated protein 1A/1B light chain 3 (LC3) immunofluorescence, autolysosome staining, and western blotting for LC3 and sequestosome 1 (p62). Intracellular reactive oxygen species (ROS) were quantified by flow cytometry. Transcriptomic profiling using Kyoto Encyclopedia of Genes and Genomes (KEGG), Gene Ontology (GO), and Gene Set Enrichment Analysis (GSEA), along with analyses and molecular docking, was used to explore potential mechanisms, with key findings validated by western blot.
Results:
Ang II induced pronounced senescence in HASMCs, characterized by increased SA-β-gal activity, elevated p53 and p21 expression, G0/G1 cell cycle arrest, impaired autophagic flux, increased ROS accumulation, and elevated secretion of IL-6 and MCP-1. CCK-8 assays confirmed that β-Ecd did not affect HASMCs’ viability at concentrations up to 200 μM. Treatment with 200 μM β-Ecd effectively attenuated Ang II–induced senescence, restoring cell cycle distribution, reducing p53 and p21 expression, and suppressing IL-6 and MCP-1 secretion. β-Ecd also enhanced autophagic activity, as evidenced by increased LC3II levels, reduced p62 accumulation, and enhanced autophagosome–lysosome fusion, while significantly decreasing intracellular ROS levels. Inhibition of autophagy with bafilomycin A1 abolished the protective effects of β-Ecd. Transcriptomic and bioinformatics analyses revealed enrichment for pathways related to autophagy regulation, with a prominent role for the PI3K/protein kinase B (AKT)/mechanistic target of rapamycin (mTOR) signaling axis. Consistently, western blot analysis showed that β-Ecd suppressed Ang II–induced phosphorylation of AKT and mTOR. Modulation of AKT activity further supported its involvement in β-Ecd–mediated protection, as AKT inhibition mimicked this effect. In contrast, AKT activation counteracted the pro-autophagic and anti-senescent effects of β-Ecd. Molecular docking further suggested favorable interactions between β-Ecd and AKT isoforms as well as mTOR.
Conclusion:
β-Ecd attenuates Ang II–induced premature senescence in HASMCs by enhancing autophagy and limiting oxidative stress, a process mediated by suppressed AKT/mTOR signaling.
Keywords
ecdysterone
autophagy
reactive oxygen species
cellular senescence
1. Introduction
The global burden of atherosclerotic cardiovascular disease (ASCVD) is
increasingly shifting toward younger adults. From 1990 to 2019, the prevalence of
ischemic heart disease, ischemic stroke, and peripheral arterial disease among
individuals aged 20 to 52 years increased by 20.55%, 11.50%, and 7.38%,
respectively [1]. These epidemiological changes suggest a need for a thorough
understanding of the molecular mechanisms underlying early-onset vascular aging
and for exploring potential preventive strategies. Vascular smooth muscle cells
(VSMCs) senescence is recognized as an essential contributor to the initiation
and progression of ASCVD. Senescent VSMCs participate in plaque instability,
vascular remodeling, and chronic inflammation, thereby contributing to the
development of atherosclerosis, hypertension, pulmonary hypertension, and
aneurysm formation [2, 3]. Previous studies have shown that multiple
stress-related processes, including impaired autophagy, oxidative stress,
persistent inflammation, and altered calcium signaling, can promote VSMC
senescence [4, 5]. Accordingly, therapeutic strategies targeting VSMC senescence
may have potential value in reducing cardiovascular risk.
Angiotensin II (Ang II), a key effector peptide of the
renin–angiotensin–aldosterone system, plays an essential role in vascular
pathophysiology. By promoting excessive production of reactive oxygen species
(ROS) and activating NF-B-dependent inflammatory signaling, Ang II
impairs antioxidant defenses, disrupts mitochondrial function, and contributes to
premature senescence of vascular cells [6, 7]. Increasing evidence from Ang
II–induced models of vascular injury indicates that impaired autophagy is
closely associated with ROS accumulation and enhanced cell death, thereby
aggravating vascular dysfunction [8, 9]. In advanced atherosclerosis, deletion of
the macrophage-specific autophagy-related gene Atg5 suppresses autophagy,
increases oxidative stress, and promotes apoptosis, thereby promoting plaque
necrosis [9]. Collectively, these findings indicate that oxidative stress arising
from defective autophagy is an essential factor in vascular aging. Given that
mTOR and lysosomal signaling pathways are well-recognized regulators of both
autophagy and cellular aging, modulation of the PI3K/AKT/mTOR pathway has been
proposed as a potential therapeutic strategy for ASCVD [3, 4].
Natural products with multitarget properties have attracted increasing interest
as potential sources for drug discovery in cardiovascular research.
Achyranthes bidentata Blume, a traditional East Asian medicinal herb,
has long been used to improve circulation and manage vascular disorders [10, 11].
Pharmacological studies have shown that its bioactive components exhibit
anti-inflammatory, antioxidant, neuroprotective, and anti-atherosclerotic effects
[11, 12, 13]. Among these components, -Ecd, also known as
20-hydroxyecdysone, is considered one of the major active phytosterols [14, 15].
Previous studies have reported that -Ecd displays a range of biological
activities, including lipid-lowering [16], anti-inflammatory [17], anti-apoptotic
[18], neuroprotective [19], antioxidant [20], and autophagy-promoting effects
[21]. However, it remains unclear whether -Ecd can alleviate Ang
II-induced VSMC senescence by coordinating autophagy and ROS metabolism. In this
study, we investigated the role of -Ecd in vascular protection and
assessed its potential to delay vascular aging and mitigate ASCVD progression.
2. Materials and Methods
2.1 Cell Culture
Human aortic smooth muscle cells (HASMCs; Catalog No. HTX2073P, Otwo Biotech,
Shenzhen, China) were cultured in Smooth Muscle Cell Medium (SMCM; Catalog No.
1101, ScienCell, San Diego, CA, USA). Cells were maintained at 37 °C in
a humidified incubator with 5% CO2. HASMCs between passages three and eight
were used for all experiments. Cell line identity was validated by short tandem
repeat (STR) profiling, and all cultures tested negative for mycoplasma.
2.2 Establishment of Cell Senescence Model and Experimental Groups
Cellular senescence was induced by treating HASMCs with 2 µM Ang II
(Catalog No. MB1677, Meilunbio, Dalian, China) for 72 h; this group was
designated as the Ang II group . To evaluate the protective effects of
-Ecd, cells were pretreated with 50, 100, or 200 µM -Ecd
(Catalog No. S25531, Yuanye, Shanghai, China) prior to Ang II exposure,
designated as the low-, medium-, and high-dose -Ecd groups,
respectively. For mechanistic analyses, cells in the high-dose -Ecd
group were additionally treated with 50 nM bafilomycin A1 (BafA1; Catalog No.
HY-100558, MCE, Shanghai, China), 10 µM SC79 (Catalog No. HY-18749, MCE,
Shanghai, China), or 2.5 mM N-acetyl-L-cysteine (NAC; Catalog No. A9165, Sigma,
Shanghai, China), referred to as the BafA1, SC79, and NAC groups, respectively.
In parallel, cells in the Ang II group were treated with 10 µM MK-2206
(Catalog No. GC16304, Glpbio, Shanghai, China) and designated as the MK-2206
group. Untreated HASMCs served as the control group.
2.3 Cell Viability Assay
HASMCs were seeded into 96-well plates and treated with different concentrations
of -Ecd for 72 h. Subsequently, 10 µL of CCK-8 reagent (Catalog
No. MA0218-5, MeilunBio, Dalian, China) was added to each well, followed by
incubation at 37 °C for 4 h. Absorbance was measured at 450 nm using a
microplate reader (SpectraMax iD3; Molecular Devices, USA). Cell viability was
analyzed and plotted using GraphPad Prism version 10.1.2 (GraphPad Software LLC,
San Diego, CA, USA).
2.4 -Galactosidase (SA--gal) Staining
HASMCs (2.5 104 cells/well) were seeded in 24-well plates,
pretreated with -Ecd or BafA1 as described above, and subsequently
exposed to Ang II for 72 h. Cells were fixed and stained using a commercial
SA--gal staining kit (Catalog No. GC16304, Beyotime, Shanghai, China),
followed by incubation overnight at 37 °C in a CO2-free incubator.
Senescent cells exhibiting blue staining were observed and quantified using an
IX73 inverted microscope (Olympus, Tokyo, Japan).
2.5 Enzyme-Linked Immunosorbent Assay (ELISA)
Cell culture supernatants were collected after treatment with varying
concentrations of -Ecd or Ang II for 72 h to measure IL-6 and MCP-1
levels. ELISA assays were performed according to the manufacturer’s instructions
(Catalog No. E-EL-H6156, Elabscience, Wuhan, China; Catalog No. E-EL-H6005,
Elabscience, Wuhan, China). Absorbance was measured at 450 nm using a SpectraMax
iD3 microplate reader (Molecular Devices, USA).
2.6 RNA Sequencing and Bioinformatics
Total RNA was extracted from HASMCs in the Ang II group and the 200 µM
-Ecd group (n = 3 per group) after 72 h of treatment. RNA library
preparation and sequencing were conducted on the Illumina NovaSeq X Plus platform
(Illumina, San Diego, CA, USA) by Hangzhou Kaitai Biotechnology (Hangzhou,
China). Differentially expressed genes (DEGs) were identified using edgeR version
4.0.0 (Bioconductor, http://www.bioconductor.org) with thresholds of
log2 fold change1 and adjusted p 0.05.
Volcano plots were generated using ggplot2. Functional enrichment analyses,
including Gene Ontology (GO) and Kyoto Encyclopedia of Genes and Genomes (KEGG)
pathway analyses, were performed using clusterProfiler (p 0.05).
Gene set enrichment analysis (GSEA) was performed using the fgsea package, with
normalized enrichment score1 and p 0.05. Data
visualization was performed using ggplot2, TBtools-II, and the Bioinformatics
platform (https://www.bioinformatics.com.cn).
2.7 Cell Cycle Analysis
HASMCs were treated with 200 µM -Ecd or 2.5 mM NAC, followed by
exposure to 2 µM Ang II for 72 h. Cells were fixed in 70% ethanol
overnight at 4 °C, stained with propidium iodide (Catalog No. C1052,
Beyotime, Shanghai, China), and analyzed by flow cytometry using a LongCyte C2060
system (Beijing Challen Biotechnology, China).
2.8 Western Blot Analysis
Cells were lysed using RIPA buffer (Catalog No. P0013B, Beyotime, Shanghai,
China), and protein concentrations were determined using a BCA assay. Equal
amounts of protein were separated by SDS-PAGE and transferred to PVDF membranes
(Catalog No. ISEQ00010, Sigma-Aldrich, USA). After blocking, membranes were
incubated overnight at 4 °C with primary antibodies against p53 (Catalog
No. AP062-1, Beyotime, Shanghai, China), p21 (Catalog No. AP021-1, Beyotime,
Shanghai, China), LC3 (Catalog No. 14600-1-AP, Proteintech, Wuhan, China), p62
(Catalog No. 18420-1-AP, Proteintech, Wuhan, China), mTOR (Catalog No.
66888-1-Ig, Proteintech, Wuhan, China), phosphorylated mTOR (p-mTOR; Catalog No.
67778-1-Ig, Proteintech, Wuhan, China), AKT (Catalog No. BM4400, Boster, Wuhan,
China), phosphorylated AKT (p-AKT; Catalog No. BM4744, Boster, Wuhan, China), and
GAPDH (Catalog No. BM3874, Boster, Wuhan, China), followed by incubation with
HRP-conjugated secondary antibodies (Catalog No. AS014, ABclonal, Wuhan, China;
Catalog No. AS003, ABclonal, Wuhan, China). Protein bands were visualized using
enhanced chemiluminescence (MeilunBio, Dalian, China) and quantified with ImageJ
software (NIH, Bethesda, MD, USA).
2.9 ROS Detection
Cells were incubated with 10 µM DCFH-DA (Catalog No. S0033S, Beyotime,
Shanghai, China) for 20 min at 37 °C, washed with PBS. Samples were
acquired on a BD FACSAria II flow cytometer (BD Biosciences, USA) and analyzed
using FlowJo software version 10.8.1 (BD Biosciences, Ashland, OR, USA) to
quantify intracellular ROS levels.
2.10 Immunofluorescence Staining
HASMCs cultured on coverslips were fixed with ethanol, permeabilized with Triton
X-100, and blocked with goat serum. Cells were incubated overnight at 4
°C with a primary antibody against LC3 (Catalog No. 14600-1-AP,
Proteintech, Wuhan, China), followed by incubation with a fluorophore-conjugated
an AF647-labeled Goat Anti-Rabbit IgG (H+L) secondary antibody (Catalog No.
A0468, Beyotime, Shanghai, China). Nuclei were counterstained, and LC3-positive
puncta were visualized using a Revolve fluorescence microscope (Aperbio, Suzhou,
China).
2.11 Autophagy-Lysosome Detection
Cells were incubated with DAL Green dye (Catalog No. D675, Dojindo, Japan) for
30 min, followed by treatment with Ang II, -Ecd, or BafA1 for 6 h.
Fluorescence signals were observed using a Revolve confocal imaging system
(Aperbio, Suzhou, China).
2.12 Molecular Docking
The three-dimensional structure of -Ecd was obtained from PubChem and
optimized using Chem3D version 22.0 (PerkinEImer Inc., Waltham, MA, USA). Crystal
structures of AKT1, AKT2, AKT3, and mTOR were downloaded from the RCSB Protein
Data Bank. Molecular docking simulations were performed using AutoDock Vina, and
docking poses were visualized with PyMOL. Binding energies lower than –5
kcal/mol were considered indicative of stable interactions. Additional docking
validation was conducted using the CB-Dock2 platform
(https://cadd.labshare.cn/cb-dock2).
2.13 Statistical Analysis
All experiments were independently repeated at least three times. Data are
presented as mean standard deviation (SD). Statistical analyses were
performed using GraphPad Prism version 10.1.2. Data normality was assessed using
the Shapiro–Wilk test. Comparisons among multiple groups were conducted using
one-way analysis of variance followed by Tukey’s post hoc test. A value of
p 0.05 was considered statistically significant.
3. Results
3.1 -Ecd Attenuates Ang II–Induced HASMCs Senescence
Cell viability assays showed that exposure to -Ecd at concentrations up
to 200 µM for 72 h did not significantly affect HASMCs’ viability compared
with controls, indicating that -Ecd within this concentration range was
not cytotoxic (Fig. 1A).
Fig. 1.
-Ecd attenuates Ang II–induced senescence in HASMCs. (A) Effects of -Ecd on HASMCs viability after 72 h of treatment, as
determined by CCK-8 assay. (B) Representative SA--gal staining images
showing SA--gal–positive HASMCs under the indicated treatment
conditions. Blue staining indicates SA--gal-positive cells. Scale bar =
100 µm. (C) Quantification of SA--gal–positive cells (n = 3). (D)
Western blot analysis of p53 and p21 protein expression in HASMCs treated with
Ang II in the presence or absence of -Ecd. (E,F) Quantitative analysis
of p53 and p21 protein expression normalized to GAPDH (n = 3). (G) Flow
cytometric analysis of cell cycle distribution in HASMCs treated with Ang II
and/or -Ecd. (H) Statistical analysis of the proportions of cells in the
G0/G1, S, and G2/M phases (n = 3). (I,J) ELISA-based quantification of IL-6 and
MCP-1 secretion in HASMCs culture supernatants following Ang II stimulation with
or without -Ecd treatment (n = 3). Values are expressed as mean
SD. *p 0.05, **p 0.01, ***p 0.001. HASMCs,
Human aortic smooth muscle cells; CCK-8, Cell Counting Kit-8; -Ecd,
Ecdysterone; Ang-II, Angiotensin II; SA--gal, Senescence-Associated
-Galactosidase; p53, Tumor protein p53; p21, Cyclin-dependent kinase
inhibitor 1A; ELISA, Enzyme-linked immunosorbent assay.
To evaluate the effects of -Ecd on Ang II–induced senescence, HASMCs
were pretreated with increasing concentrations of -Ecd and subsequently
exposed to Ang II. SA--gal staining demonstrated a marked increase in
senescent cells following Ang II treatment. Pretreatment with 200 µM
-Ecd significantly reduced the proportion of SA--gal-positive
HASMCs (Fig. 1B,C). Consistent with these results, Ang II–induced upregulation
of p53 and p21 was significantly attenuated by -Ecd pretreatment, as
determined by Western blot analysis (Fig. 1D–F).
Cell cycle analysis further revealed that Ang II induced pronounced G0/G1 phase
arrest, accompanied by a reduction in G2/M phase cells. -Ecd treatment
partially reversed Ang II–induced cell cycle arrest, promoting progression into
the G2/M phases (Fig. 1G,H). Because cellular senescence is often accompanied by
activation of the senescence-associated secretory phenotype (SASP), we next
assessed inflammatory cytokine secretion. ELISA analysis showed that Ang II
increased IL-6 and MCP-1 secretion in HASMCs, whereas 200 µM -Ecd
significantly inhibited this response (Fig. 1I,J). Overall, these results
indicate that -Ecd mitigates Ang II–induced HASMC senescence, as
evidenced by normalization of the cell cycle distribution and reduced SASP factor
production.
3.2 Transcriptomic Profiling of -Ecd–Treated HASMCs
RNA sequencing analysis revealed 137 DEGs between the -Ecd–treated
group and the Ang II groups, of which 130 were upregulated and 7 downregulated
(Fig. 2A; Supplementary Table 1). KEGG pathway enrichment analysis
revealed 18 significantly enriched pathways, with the PI3K–AKT signaling pathway
among the most prominently represented (Fig. 2B). GO enrichment analysis
indicated that the DEGs were significantly enriched in terms related to
cytoplasmic microtubule organization, TOR signaling, protein kinase A binding,
and small GTPase binding (Fig. 2C).
Fig. 2.
Transcriptomic changes induced by -Ecd in senescent
HASMCs. (A) Volcano plot of DEGs identified in HASMCs treated with -Ecd
compared with the Ang II group. Red dots indicate upregulated genes, green dots
indicate downregulated genes, and gray dots represent genes that did not exhibit
significant changes in expression. (B) KEGG pathway enrichment analysis of DEGs.
Bar height represents the number of enriched genes, and color intensity reflects
the level of statistical significance. *p 0.05, **p
0.01, ***p 0.001. (C) GO enrichment analysis of DEGs displayed as a
bubble plot. Bubble size corresponds to the number of enriched genes, and bubble
color denotes enrichment significance. (D) GSEA of Reactome pathways associated
with DEGs. (E) Bubble plot summarizing significantly enriched Reactome pathways
identified by GSEA. (F) Heatmap showing enriched Reactome pathways and their
associated DEGs. DEGs, Differentially Expressed Genes; KEGG, Kyoto Encyclopedia
of Genes and Genomes; GO, Gene Ontology; GSEA, Gene Set Enrichment Analysis.
GSEA identified 99 enriched Reactome pathways (Supplementary Table 2),
among which 12 were positively enriched. These pathways were mainly involved in
cell cycle regulation, PLK1-mediated signaling, G2/M phase transition, DNA
repair, centrosome maturation, and mitotic progression (Fig. 2D,E). Heatmap
visualization further highlighted 47 DEGs with relatively high normalized
expression, including CDK1, NEK2, HSP90AA1, and CENPF, which are involved in
mitotic control and cell proliferation (Fig. 2F). Taken together, these results
indicate that -Ecd treatment is associated with changes in gene
expression related to cell cycle progression and proliferation, potentially
relevant to Ang II–induced senescence.
3.3 -Ecd Promotes Autophagy and Reduces ROS Accumulation
Immunofluorescence analysis showed that LC3 puncta were significantly reduced in
Ang II–treated HASMCs compared with control cells. This reduction was partially
inhibited following -Ecd treatment (Fig. 3A,B). Consistent with these
observations, Western blot analysis demonstrated that Ang II treatment decreased
the LC3II/LC3I ratio and increased p62 protein levels, whereas -Ecd
treatment attenuated these changes. The addition of the autophagy inhibitor BafA1
abolished the effects of -Ecd, resulting in LC3II accumulation and
increased p62 levels (Fig. 3C–E). Autophagic flux analysis showed that Ang II
reduced autolysosome formation, while -Ecd significantly enhanced it. In
contrast, BafA1 treatment markedly reduced autolysosome formation in Ang II +
-Ecd–treated cells (Fig. 3F).
Fig. 3.
-Ecd enhances autophagy activity in HASMCs. (A)
Representative immunofluorescence images showing LC3 distribution in HASMCs under
the indicated treatment conditions (scale bar = 50 µm). (B) Quantitative
analysis of LC3 fluorescence intensity (n = 3). (C) Western blot analysis of the
autophagy-related proteins LC3 and p62 in HASMCs. (D,E) Densitometric analysis of
LC3 and p62 protein expression levels normalized to GAPDH (n = 3). (F)
Autolysosome staining was used to assess autophagic flux in HASMCs under the
indicated conditions (scale bar = 50 µm). Values are expressed as mean
SD. *p 0.05, **p 0.01, ***p 0.001.
LC3, Microtubule-associated protein 1A/1B light chain 3; p62, sequestosome 1; Baf
A1, Bafilomycin A1.
ROS measurements revealed that Ang II significantly increased intracellular ROS
levels. Treatment with NAC inhibited ROS generation, while -Ecd produced
a similar suppressive effect. In contrast, BafA1 attenuated the antioxidant
effect of -Ecd (Fig. 4A–D). Consistent with these findings,
SA--gal staining demonstrated that -Ecd treatment reduced Ang
II-induced cellular senescence, whereas BafA1 restored senescence levels (Fig. 4E,F). Similarly, -Ecd decreased Ang II–induced upregulation of p53 and
p21, while BafA1 partially counteracted this effect (Fig. 4G–I). Overall, these
findings indicate that the anti-senescent effects of -Ecd in HASMCs are
closely associated with enhanced autophagic activity and reduced ROS
accumulation.
Fig. 4.
Autophagy-associated regulation of oxidative stress and
senescence by -Ecd in HASMCs. (A) Representative flow cytometry plots
showing intracellular ROS levels in HASMCs following the indicated treatments.
(B) Quantification of intracellular ROS levels in each group (n = 3). (C) Flow
cytometric analysis of ROS levels following combined -Ecd and BafA1
treatment. (D) Quantitative comparison of ROS levels in HASMCs (n = 3). (E)
Representative SA--gal staining images used to evaluate cellular
senescence in HASMCs (scale bar = 100 µm). (F) Quantification of
SA--gal–positive cells (n = 3). (G) Western blot analysis of the
senescence-associated proteins p53 and p21 in HASMCs. (H,I) Quantitative analysis
of p53 and p21 protein expression levels normalized to GAPDH (n = 3). Values are
expressed as mean SD. *p 0.05, **p 0.01,
***p 0.001. NAC, N-acetyl-L-cysteine.
3.4 -Ecd Attenuates Ang II–Induced Activation of AKT/mTOR
Signaling
Western blot analysis showed that Ang II treatment significantly increased the
ratios of p-AKT/AKT and p-mTOR/mTOR compared with control cells. Pretreatment
with -Ecd markedly reduced both p-AKT/AKT and p-mTOR/mTOR ratios,
suggesting reduced activation of AKT/mTOR signaling (Fig. 5A–C). In addition,
compared with the Ang II group, treatment with the AKT inhibitor MK-2206
significantly decreased the levels of p-AKT/AKT, p-mTOR/mTOR, as well as the
senescence-associated proteins p53 and p21 (Fig. 5D–I). Conversely, treatment
with the AKT activator SC79 largely inhibited the effects of -Ecd,
restoring AKT and mTOR phosphorylation and the expression of p53 and p21 (Fig. 5D–I). These results further support the involvement of the AKT/mTOR pathway in
the anti-senescence effect of -Ecd on HASMCs.
Fig. 5.
-Ecd attenuates Ang II–induced activation of the
AKT/mTOR signaling pathway in HASMCs. (A) Representative Western blot images
showing total and phosphorylated AKT and mTOR protein levels in HASMCs under the
indicated treatment conditions. (B,C) Quantitative analysis of the p-AKT/AKT and
p-mTOR/mTOR ratios in each group (n = 3). (D) Representative Western blot images
showing p-AKT, AKT, p-mTOR, mTOR, p53, and p21 expression in HASMCs following
modulation of AKT signaling with MK-2206 or SC79. (E,F) Quantitative analysis of
p-AKT/AKT and p-mTOR/mTOR ratios (n = 3). (G–I) Quantification of p53 and p21
protein expression levels normalized to GAPDH (n = 3). Data are presented as mean
SD. *p 0.05, **p 0.01, ***p 0.001.
AKT, Protein Kinase B; p-AKT, Phosphorylated AKT; mTOR, Mechanistic Target of
Rapamycin; p-mTOR, Phosphorylated mTOR.
Molecular docking analysis suggested potential interactions between
-Ecd and components of the AKT/mTOR pathway. -Ecd showed
favorable predicted binding energies with AKT1, AKT2, AKT3, and mTOR (–8.0,
–8.5, –8.7, and –8.6 kcal/mol, respectively) and formed multiple hydrogen
bonds. Specifically, -Ecd formed hydrogen bonds with ARG328, TYR38, and
LYS30 on AKT1; VAL272, TYR327, ASP324, and LEU52 on AKT2; GLU154, GLN44, GLN38,
and GLU109 on AKT3; and GLU95, GLN140, ASP322, and ARG227 on mTOR (Fig. 6A–D).
These interactions were further supported by CB-Dock2 analysis, which yielded
comparable or slightly stronger predicted binding energies (–8.2 to –9.4
kcal/mol; Fig. 6E–H). Taken together, these results indicate that -Ecd
attenuates Ang II–induced HASMC senescence, associated with reduced AKT/mTOR
signaling activity, which may involve interactions with components of this
pathway.
Fig. 6.
Molecular docking analysis of -Ecd with components of
the AKT/mTOR signaling pathway. (A–D) Predicted binding modes of -Ecd
with AKT1, AKT2, AKT3, and mTOR, as determined by AutoDock Vina and visualized
using PyMOL. (E–H) Independent docking analysis of -Ecd with AKT1,
AKT2, AKT3, and mTOR was performed using the CB-Dock2 platform.
4. Discussion
Substantial evidence indicates that VSMCs within atherosclerotic plaques exhibit
reduced proliferative capacity and gradually acquire features of cellular
senescence, which contributes to plaque instability and disease progression [22].
Previous studies have shown that -Ecd can restore impaired autophagy in
a tert-butyl hydroperoxide-induced apoptosis model of rat nucleus pulposus cells
[21] and, when combined with paeoniflorin, exerts protective effects against
oxidative stress and ferroptosis in a model of cardiac hypertrophy [20]. However,
the role of -Ecd in regulating premature senescence in HASMCs remains
unclear. In this study, we show that -Ecd attenuates Ang II–induced
senescence in HASMCs and reduces intracellular ROS accumulation. These effects
are accompanied by enhanced autophagic activity and suppression of AKT/mTOR
signaling, suggesting a mechanistic link between -Ecd–mediated
autophagy regulation and the alleviation of cellular senescence.
SA--gal activity and the upregulation of p53 and p21 are widely
recognized markers of cellular senescence, with cell cycle arrest representing
another key hallmark [23, 24]. In the present study, Ang II treatment markedly
increased SA--gal positivity, elevated p53 and p21 expression, and
induced G0/G1 phase arrest in HASMCs. Notably, treatment with 200 µM
-Ecd effectively attenuated these senescence-associated alterations. In
addition to these cell-intrinsic senescence markers, senescent VSMCs actively
influence the vascular microenvironment through the SASP, characterized by
increased secretion of pro-inflammatory cytokines and chemokines. In line with
this, our results showed that Ang II treatment enhanced the secretion of the SASP
factors IL-6 and MCP-1, whereas -Ecd significantly suppressed their
production. These results suggest that -Ecd not only alleviates
intrinsic senescence-related alterations in HASMCs but may also attenuate the
pro-inflammatory paracrine effects of senescent cells, which are implicated in
vascular inflammation and plaque progression.
Autophagy is a fundamental cellular process that maintains protein and organelle
homeostasis and contributes to the regulation of cellular senescence. When this
process is impaired, damaged proteins and organelles accumulate, oxidative stress
increases, and VSMC senescence and atherosclerosis progression are consequently
accelerated [22, 25]. LC3II, which localizes to autophagosome membranes, is
commonly used as a marker of autophagosome formation [26], whereas p62
accumulation reflects defective autophagic degradation [27]. It has been reported
that elevated autophagy can inhibit Ang IIinduced senescence in VSMCs [28]. Our
data indicate that Ang II treatment reduced the LC3II/LC3I ratio and increased
p62 expression. In contrast, -Ecd treatment restored LC3II levels and
reduced p62 accumulation. Moreover, pharmacological inhibition of autophagy with
BafA1, which blocks autophagosome–lysosome fusion [29], partially attenuated the
protective effects of -Ecd, supporting the involvement of autophagy
activation in its anti-senescent action.
In our Ang II–treated HASMC model, increases in ROS were closely associated
with defective autophagy and the development of a senescent phenotype. Ang II
markedly elevated intracellular ROS and, concurrently, impaired autophagic flux,
as indicated by a reduced LC3II/LC3I ratio, p62 accumulation, and decreased
autolysosome formation. These changes occurred alongside increased
SA--gal positivity, upregulation of p53 and p21, G0/G1 arrest, and
elevated secretion of IL-6 and MCP-1. Treatment with -Ecd improved
autophagic flux, reduced ROS levels, and attenuated the secretion of senescence
markers and SASP factors. Prior work has linked oxidative stress to the
establishment and maintenance of stress-induced senescence through metabolic
disruption, mitochondrial injury, and persistent DNA damage signaling [30, 31],
and ROS scavenging has been reported to blunt Ang II–driven senescence
phenotypes [32]. Importantly, blockade of autophagosome-lysosome fusion with
BafA1 largely abolished the ROS-lowering and anti-senescent effects of
-Ecd, demonstrating that an intact autophagic process is essential for
-Ecd–mediated protection. Together, our data suggest that -Ecd
lowers ROS primarily by enhancing autophagic function. Although we did not
directly assess mitochondrial function, previous study has established a close
association between mitophagy, ROS, and cellular senescence. Impairment of
mitophagy results in excessive mitochondrial aggregation, leading to increased
intracellular ROS accumulation and accelerated cellular senescence [33]. Future
studies will examine mitophagy to clarify the contribution of mitochondrial
dysfunction to the senescence program and to determine how -Ecd
modulates this process.
The PI3K/AKT/mTOR pathway is a central regulator of autophagy and cellular
senescence and has been implicated in the progression of atherosclerosis [34, 35].
In addition, modulation of PI3K/AKT/mTOR signaling through P2RY12 receptor
activation [36] or Sirtuin 3 [37] has been reported to influence senescence and
oxidative stress by regulating autophagy. In this study, AngII treatment enhanced
the phosphorylation of AKT and mTOR in HASMCs. This activation was significantly
inhibited by -Ecd, an effect similar to that of MK-2206. Conversely,
SC79 attenuated the inhibitory effects of -Ecd on the AKT/mTOR signaling
pathway and senescenceassociated markers, providing functional evidence that the
AKT/mTOR pathway is involved in the protective effects of -Ecd.
Furthermore, molecular docking suggested potential binding of -Ecd to
AKT isoforms and mTOR, supporting a plausible molecular basis for pathway
modulation.
In summary, our findings demonstrate that -Ecd attenuates Ang
II–induced premature senescence in HASMCs by restoring autophagic flux, reducing
oxidative stress, and suppressing AKT/mTOR signaling (Fig. 7). Given the critical
role of VSMC senescence in atherosclerosis pathogenesis, this study provides
mechanistic insight into the vascular protective effects of -Ecd and
suggests that it may be relevant to strategies targeting vascular aging and
atherosclerotic disease progression.
Fig. 7.
Proposed mechanism by which -Ecd delays HASMCs
senescence. -Ecd enhances autophagic activity and promotes
autophagosome–lysosome fusion in HASMCs, thereby reducing intracellular
oxidative stress and improving cellular homeostasis. These effects collectively
alleviate Ang II–induced premature senescence in HASMCs. The
autophagy-regulating action of -Ecd appears to be mediated, at least in
part, through inhibition of the AKT/mTOR signaling pathway. Created with BioRender.com.
5. Limitations
Several limitations of this study should be noted. First, although
pharmacological approaches were used to modulate AKT signaling, the inclusion of
genetic strategies, such as siRNA-mediated knockdown or overexpression of key
pathway components, would provide more substantial evidence of causal
involvement. Second, the present findings are based on in vitro HASMC
models; validation in in vivo atherosclerosis models will be necessary
to assess their translational relevance. Thirdly, while molecular docking
analyses serve as a preliminary indication of potential direct interactions
between -Ecd and the AKT/mTOR pathway, definitive identification of key
functional binding sites will require future studies using site-directed
mutagenesis or genetic silencing.
6. Conclusion
-Ecd attenuates Ang II–induced senescence in HASMCs by enhancing
autophagic activity and limiting intracellular ROS accumulation, effects that are
associated with suppression of the AKT/mTOR signaling pathway. These findings
suggest that -Ecd may have the potential to modulate vascular senescence
and maintain vascular homeostasis, while providing mechanistic insight into
strategies to target vascular aging–related cardiovascular diseases.
Availability of Data and Materials
The data used to support the findings of the present study are included within
the article. The dataset used during the current study is available from the
corresponding author upon reasonable request.
Author Contributions
LS, HJ and HP designed the research study. DW, YL, HW and LW performed the research. DW, TD, XZ and CS analyzed the data and interpretation. LS, DW and TD wrote the manuscript. All authors contributed to editorial changes in the manuscript. All authors have read and approve the final manuscript. All authors have participated sufficiently in the work and agreed to be accountable for all aspects of the work.
Ethics Approval and Consent to Participate
Not applicable.
Acknowledgment
Not applicable.
Funding
This project was supported by research funds from the Qiqihar Municipal Science and Technology Bureau Joint Guidance Project (LSFGG-2025128), Postgraduate Innovation Fund Project of Qiqihar Medical College in 2024 (QYYCX2024-24), Engineering Research Center of Natural Cosmeceuticals College of Fujian Province Fund (XMMC-OP2024008), Construction Project of Dominant Characteristic Disciplines of Qiqihar Medical University (QYZDXK-013, Human Anatomy and Histoembryology).
[1] Li Z, Yang Y, Wang X, Yang N, He L, Wang J, et al. Comparative analysis of atherosclerotic cardiovascular disease burden between ages 20-54 and over 55 years: insights from the Global Burden of Disease Study 2019. BMC Medicine. 2024; 22: 303. https://doi.org/10.1186/s12916-024-03527-4.
[2] Lin MJ, Hu SL, Tian Y, Zhang J, Liang N, Sun R, et al. Targeting Vascular Smooth Muscle Cell Senescence: A Novel Strategy for Vascular Diseases. Journal of Cardiovascular Translational Research. 2023; 16: 1010–1020. https://doi.org/10.1007/s12265-023-10377-7.
[3] Suda M, Paul KH, Minamino T, Miller JD, Lerman A, Ellison-Hughes GM, et al. Senescent Cells: A Therapeutic Target in Cardiovascular Diseases. Cells. 2023; 12: 1296. https://doi.org/10.3390/cells12091296.
[4] Shu Z, Li X, Zhang W, Huyan Z, Cheng D, Xie S, et al. MG-132 activates sodium palmitate-induced autophagy in human vascular smooth muscle cells and inhibits senescence via the PI3K/AKT/mTOR axis. Lipids in Health and Disease. 2024; 23: 282. https://doi.org/10.1186/s12944-024-02268-w.
[5] Li X, Chen M, Chen X, He X, Li X, Wei H, et al. TRAP1 drives smooth muscle cell senescence and promotes atherosclerosis via HDAC3-primed histone H4 lysine 12 lactylation. European Heart Journal. 2024; 45: 4219–4235. https://doi.org/10.1093/eurheartj/ehae379.
[6] Whaley-Connell A, Johnson MS, Sowers JR. Aldosterone: role in the cardiometabolic syndrome and resistant hypertension. Progress in Cardiovascular Diseases. 2010; 52: 401–409. https://doi.org/10.1016/j.pcad.2009.12.004.
[7] Kunieda T, Minamino T, Nishi JI, Tateno K, Oyama T, Katsuno T, et al. Angiotensin II induces premature senescence of vascular smooth muscle cells and accelerates the development of atherosclerosis via a p21-dependent pathway. Circulation. 2006; 114: 953–960. https://doi.org/10.1161/CIRCULATIONAHA.106.626606.
[8] Li C, Lin L, Zhang L, Xu R, Chen X, Ji J, et al. Long noncoding RNA p21 enhances autophagy to alleviate endothelial progenitor cells damage and promote endothelial repair in hypertension through SESN2/AMPK/TSC2 pathway. Pharmacological Research. 2021; 173: 105920. https://doi.org/10.1016/j.phrs.2021.105920.
[9] Liao X, Sluimer JC, Wang Y, Subramanian M, Brown K, Pattison JS, et al. Macrophage autophagy plays a protective role in advanced atherosclerosis. Cell Metabolism. 2012; 15: 545–553. https://doi.org/10.1016/j.cmet.2012.01.022.
[10] Hyun SW, Lee TG, Song SJ, Kim CS. Evaluation of oral toxicity and genotoxicity of Achyranthis Radix extract. Journal of Ethnopharmacology. 2021; 274: 113944. https://doi.org/10.1016/j.jep.2021.113944.
[11] Chen YR, Niu YS, Zhou HL. Achyranthes bidentata Blume (Amaranthaceae): a review of its botany, traditional uses, phytochemistry, pharmacology, and toxicology. The Journal of Pharmacy and Pharmacology. 2024; 76: 930–966. https://doi.org/10.1093/jpp/rgae012.
[12] He X, Wang X, Fang J, Chang Y, Ning N, Guo H, et al. The genus Achyranthes: A review on traditional uses, phytochemistry, and pharmacological activities. Journal of Ethnopharmacology. 2017; 203: 260–278. https://doi.org/10.1016/j.jep.2017.03.035.
[13] Mohammed SAD, Liu H, Baldi S, Chen P, Lu F, Liu S. GJD Modulates Cardiac/Vascular Inflammation and Decreases Blood Pressure in Hypertensive Rats. Mediators of Inflammation. 2022; 2022: 7345116. https://doi.org/10.1155/2022/7345116.
[14] Zou Y, Wang R, Guo H, Dong M. Phytoestrogen β-Ecdysterone Protects PC12 Cells Against MPP+-Induced Neurotoxicity In Vitro: Involvement of PI3K-Nrf2-Regulated Pathway. Toxicological Sciences: an official journal of the Society of Toxicology. 2015; 147: 28–38. https://doi.org/10.1093/toxsci/kfv111.
[16] Buniam J, Chukijrungroat N, Rattanavichit Y, Surapongchai J, Weerachayaphorn J, Bupha-Intr T, et al. 20-Hydroxyecdysone ameliorates metabolic and cardiovascular dysfunction in high-fat-high-fructose-fed ovariectomized rats. BMC Complementary Medicine and Therapies. 2020; 20: 140. https://doi.org/10.1186/s12906-020-02936-1.
[17] Zhang X, Xu X, Xu T, Qin S. β-Ecdysterone suppresses interleukin-1β-induced apoptosis and inflammation in rat chondrocytes via inhibition of NF-κB signaling pathway. Drug Development Research. 2014; 75: 195–201. https://doi.org/10.1002/ddr.21170.
[18] Pan Z, Niu Y, Liang Y, Zhang X, Dong M. β-Ecdysterone Protects SH-SY5Y Cells Against 6-Hydroxydopamine-Induced Apoptosis via Mitochondria-Dependent Mechanism: Involvement of p38(MAPK)-p53 Signaling Pathway. Neurotoxicity Research. 2016; 30: 453–466. https://doi.org/10.1007/s12640-016-9631-7.
[19] Liu H, Yu C, Xu T, Zhang X, Dong M. Synergistic protective effect of paeoniflorin and β-ecdysterone against rotenone-induced neurotoxicity in PC12 cells. Apoptosis. 2016; 21: 1354–1365. https://doi.org/10.1007/s10495-016-1293-7.
[20] Yan P, Li X, He Y, Zhang Y, Wang Y, Liu J, et al. The synergistic protective effects of paeoniflorin and β-ecdysterone against cardiac hypertrophy through suppressing oxidative stress and ferroptosis. Cellular Signalling. 2025; 125: 111509. https://doi.org/10.1016/j.cellsig.2024.111509.
[21] Wen F, Yu J, He CJ, Zhang ZW, Yang AF. β ecdysterone protects against apoptosis by promoting autophagy in nucleus pulposus cells and ameliorates disc degeneration. Molecular Medicine Reports. 2019; 19: 2440–2448. https://doi.org/10.3892/mmr.2019.9861.
[23] Bernard M, Yang B, Migneault F, Turgeon J, Dieudé M, Olivier MA, et al. Autophagy drives fibroblast senescence through MTORC2 regulation. Autophagy. 2020; 16: 2004–2016. https://doi.org/10.1080/15548627.2020.1713640.
[24] Sikora E, Bielak-Zmijewska A, Mosieniak G. A common signature of cellular senescence; does it exist? Ageing Research Reviews. 2021; 71: 101458. https://doi.org/10.1016/j.arr.2021.101458.
[25] Wirawan E, Vanden Berghe T, Lippens S, Agostinis P, Vandenabeele P. Autophagy: for better or for worse. Cell Research. 2012; 22: 43–61. https://doi.org/10.1038/cr.2011.152.
[26] Mondaca-Ruff D, Quiroga C, Norambuena-Soto I, Riquelme JA, San Martin A, Bustamante M, et al. Regulation of total LC3 levels by angiotensin II in vascular smooth muscle cells. Journal of Cellular and Molecular Medicine. 2022; 26: 1710–1713. https://doi.org/10.1111/jcmm.17215.
[28] Xu XJ, Zhao WB, Feng SB, Sun C, Chen Q, Ni B, et al. Celastrol alleviates angiotensin II mediated vascular smooth muscle cell senescence via induction of autophagy. Molecular Medicine Reports. 2017; 16: 7657–7664. https://doi.org/10.3892/mmr.2017.7533.
[29] Wang X, Zhang M, Mao C, Zhang C, Ma W, Tang J, et al. Icariin alleviates ferroptosis-related atherosclerosis by promoting autophagy in xo-LDL-induced vascular endothelial cell injury and atherosclerotic mice. Phytotherapy Research. 2023; 37: 3951–3963. https://doi.org/10.1002/ptr.7854.
[30] Zhang Y, Peng X, Xue M, Liu J, Shang G, Jiang M, et al. SARS-COV-2 spike protein promotes RPE cell senescence via the ROS/P53/P21 pathway. Biogerontology. 2023; 24: 813–827. https://doi.org/10.1007/s10522-023-10019-0.
[31] Davalli P, Mitic T, Caporali A, Lauriola A, D’Arca D. ROS, Cell Senescence, and Novel Molecular Mechanisms in Aging and Age-Related Diseases. Oxidative Medicine and Cellular Longevity. 2016; 2016: 3565127. https://doi.org/10.1155/2016/3565127.
[32] Tsai IC, Pan ZC, Cheng HP, Liu CH, Lin BT, Jiang MJ. Reactive oxygen species derived from NADPH oxidase 1 and mitochondria mediate angiotensin II-induced smooth muscle cell senescence. Journal of Molecular and Cellular Cardiology. 2016; 98: 18–27. https://doi.org/10.1016/j.yjmcc.2016.07.001.
[33] Qu X, Pan P, Cao S, Ma Y, Yang J, Gao H, et al. Immp2l Deficiency Induced Granulosa Cell Senescence Through STAT1/ATF4 Mediated UPRmt and STAT1/(ATF4)/HIF1α/BNIP3 Mediated Mitophagy: Prevented by Enocyanin. International Journal of Molecular Sciences. 2024; 25: 11122. https://doi.org/10.3390/ijms252011122.
[34] Ji W, Sun J, Hu Z, Sun B. Resveratrol protects against atherosclerosis by downregulating the PI3K/AKT/mTOR signaling pathway in atherosclerosis model mice. Experimental and Therapeutic Medicine. 2022; 23: 414. https://doi.org/10.3892/etm.2022.11341.
[35] Wei J, Huang L, Li D, He J, Li Y, He F, et al. Total Flavonoids of Engelhardia roxburghiana Wall. Leaves Alleviated Foam Cells Formation through AKT/mTOR-Mediated Autophagy in the Progression of Atherosclerosis. Chemistry & Biodiversity. 2021; 18: e2100308. https://doi.org/10.1002/cbdv.202100308.
[36] Pi S, Mao L, Chen J, Shi H, Liu Y, Guo X, et al. The P2RY12 receptor promotes VSMC-derived foam cell formation by inhibiting autophagy in advanced atherosclerosis. Autophagy. 2021; 17: 980–1000. https://doi.org/10.1080/15548627.2020.1741202.
[37] Fan X, He Y, Wu G, Chen H, Cheng X, Zhan Y, et al. Sirt3 activates autophagy to prevent DOX-induced senescence by inactivating PI3K/AKT/mTOR pathway in A549 cells. Biochimica et Biophysica Acta. Molecular Cell Research. 2023; 1870: 119411. https://doi.org/10.1016/j.bbamcr.2022.119411.


 , Tao Dong 2,†
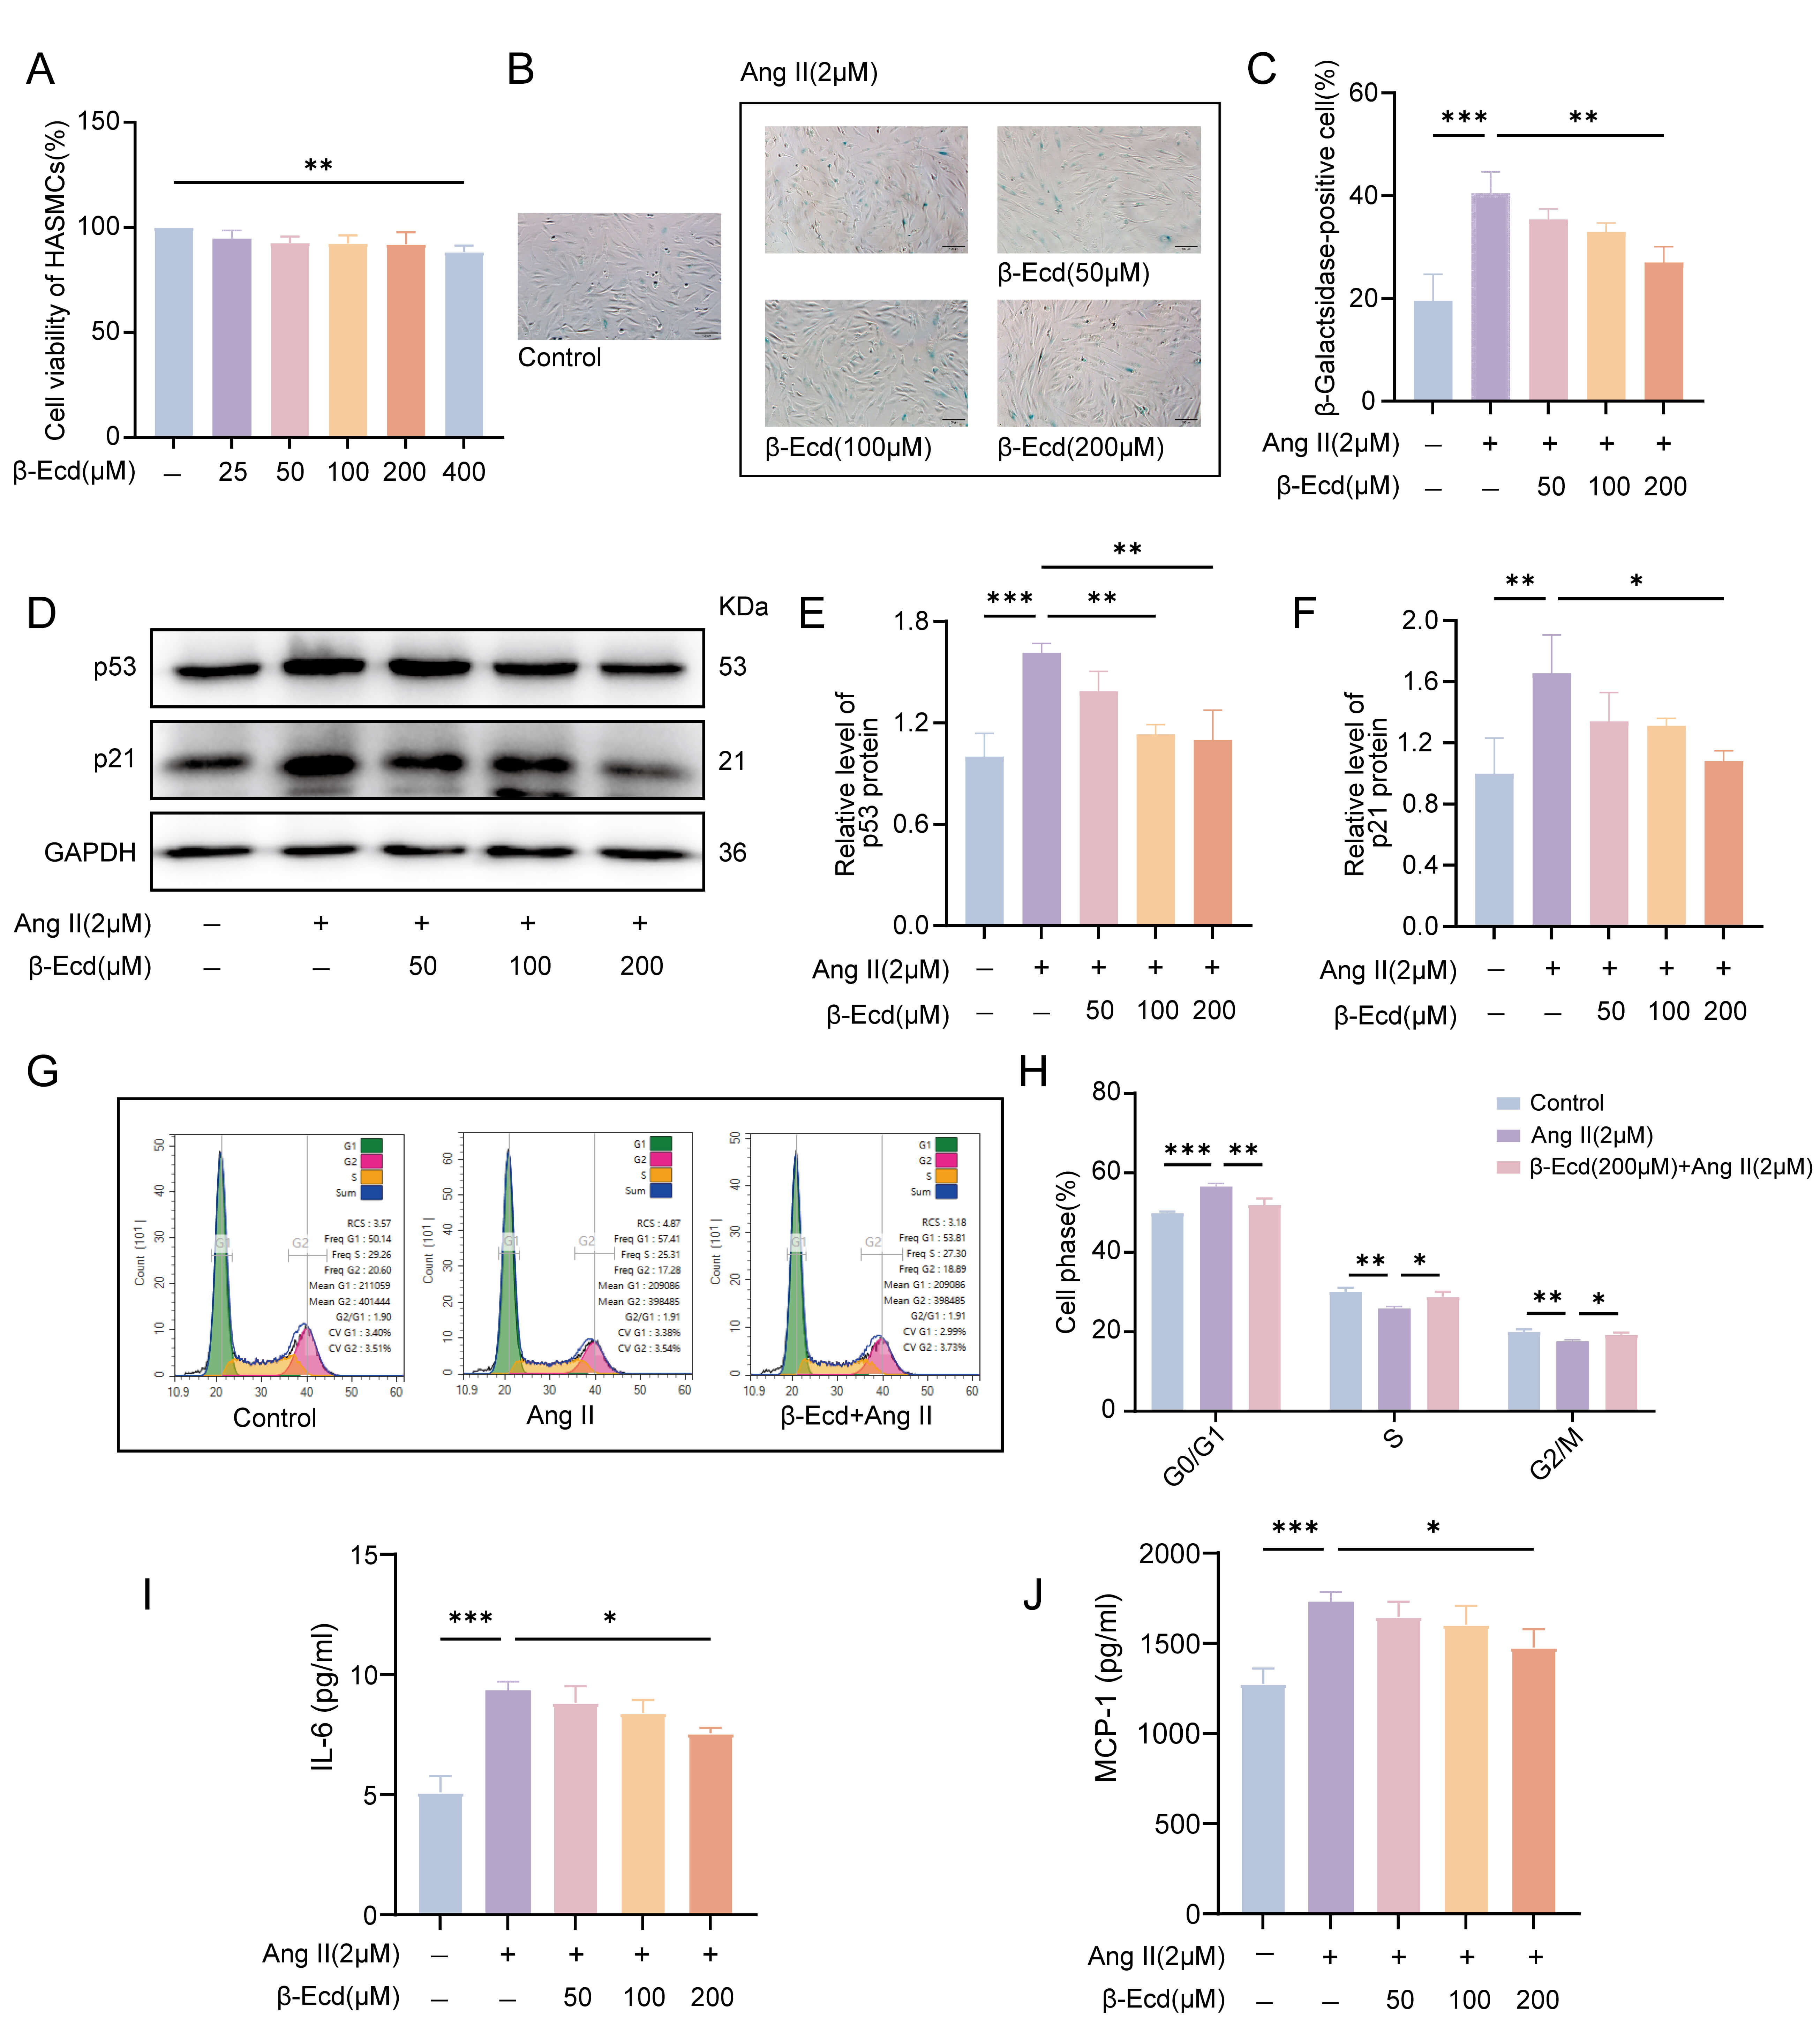 Fig. 1.
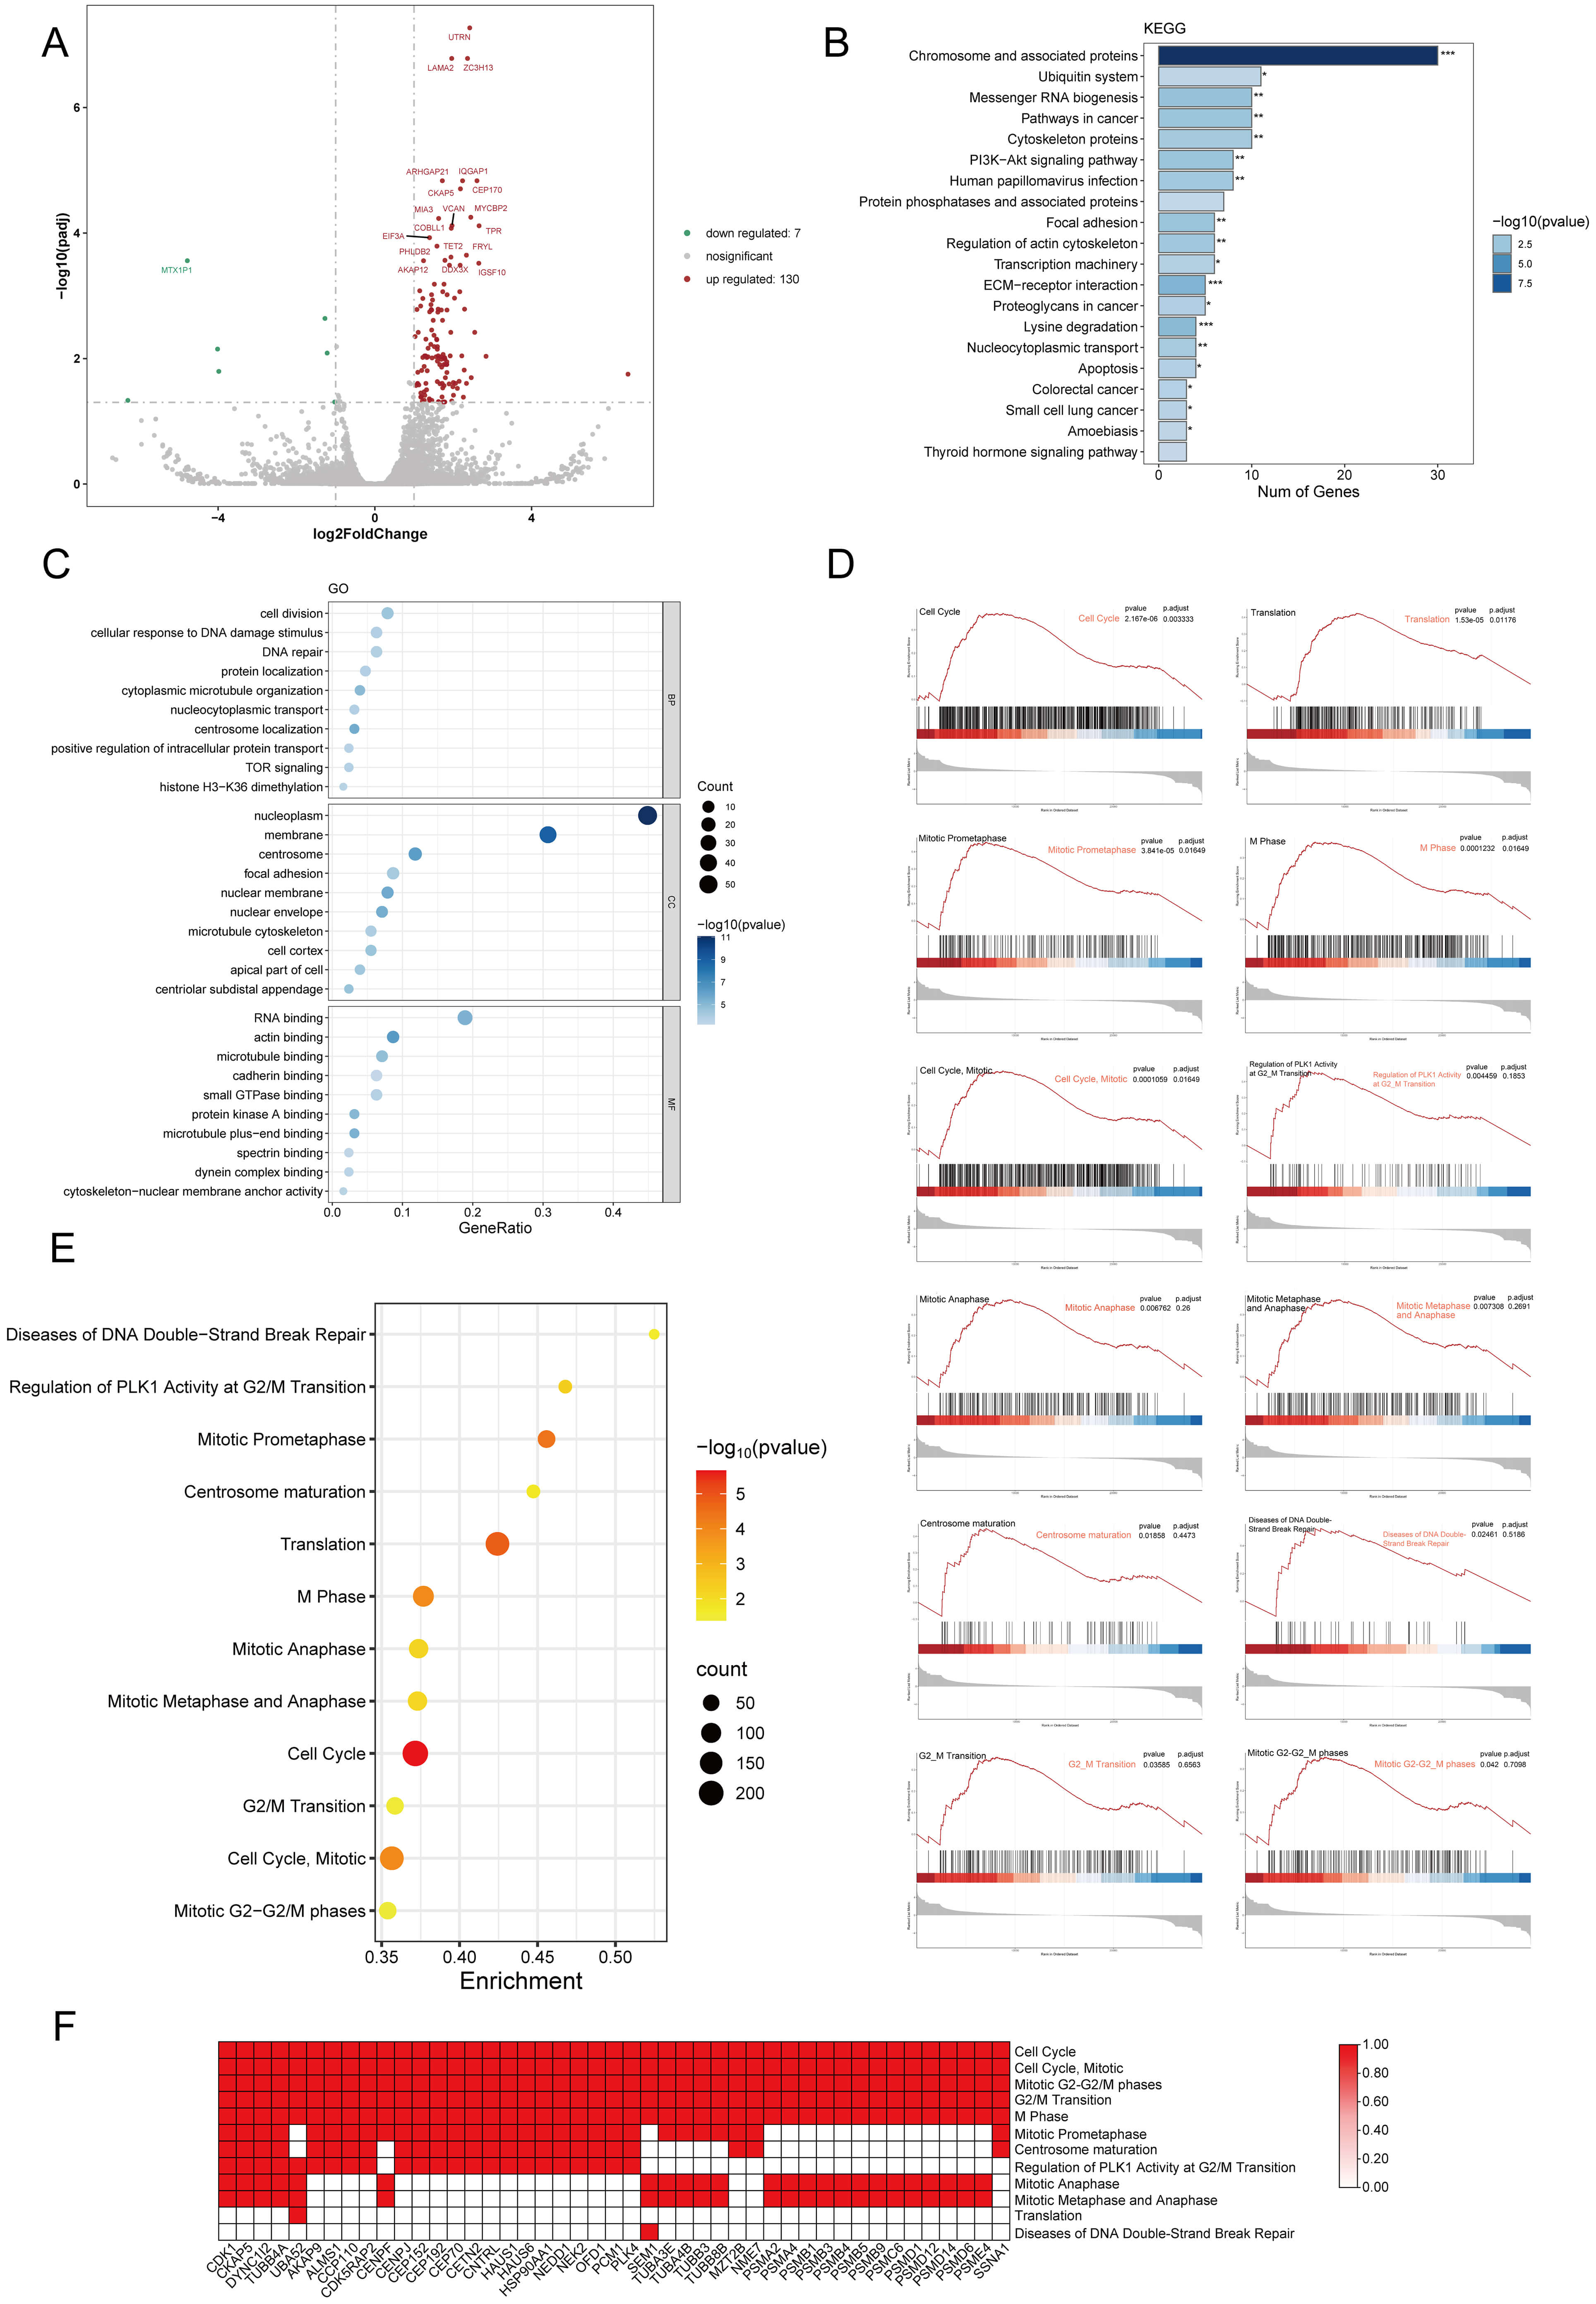 Fig. 2.
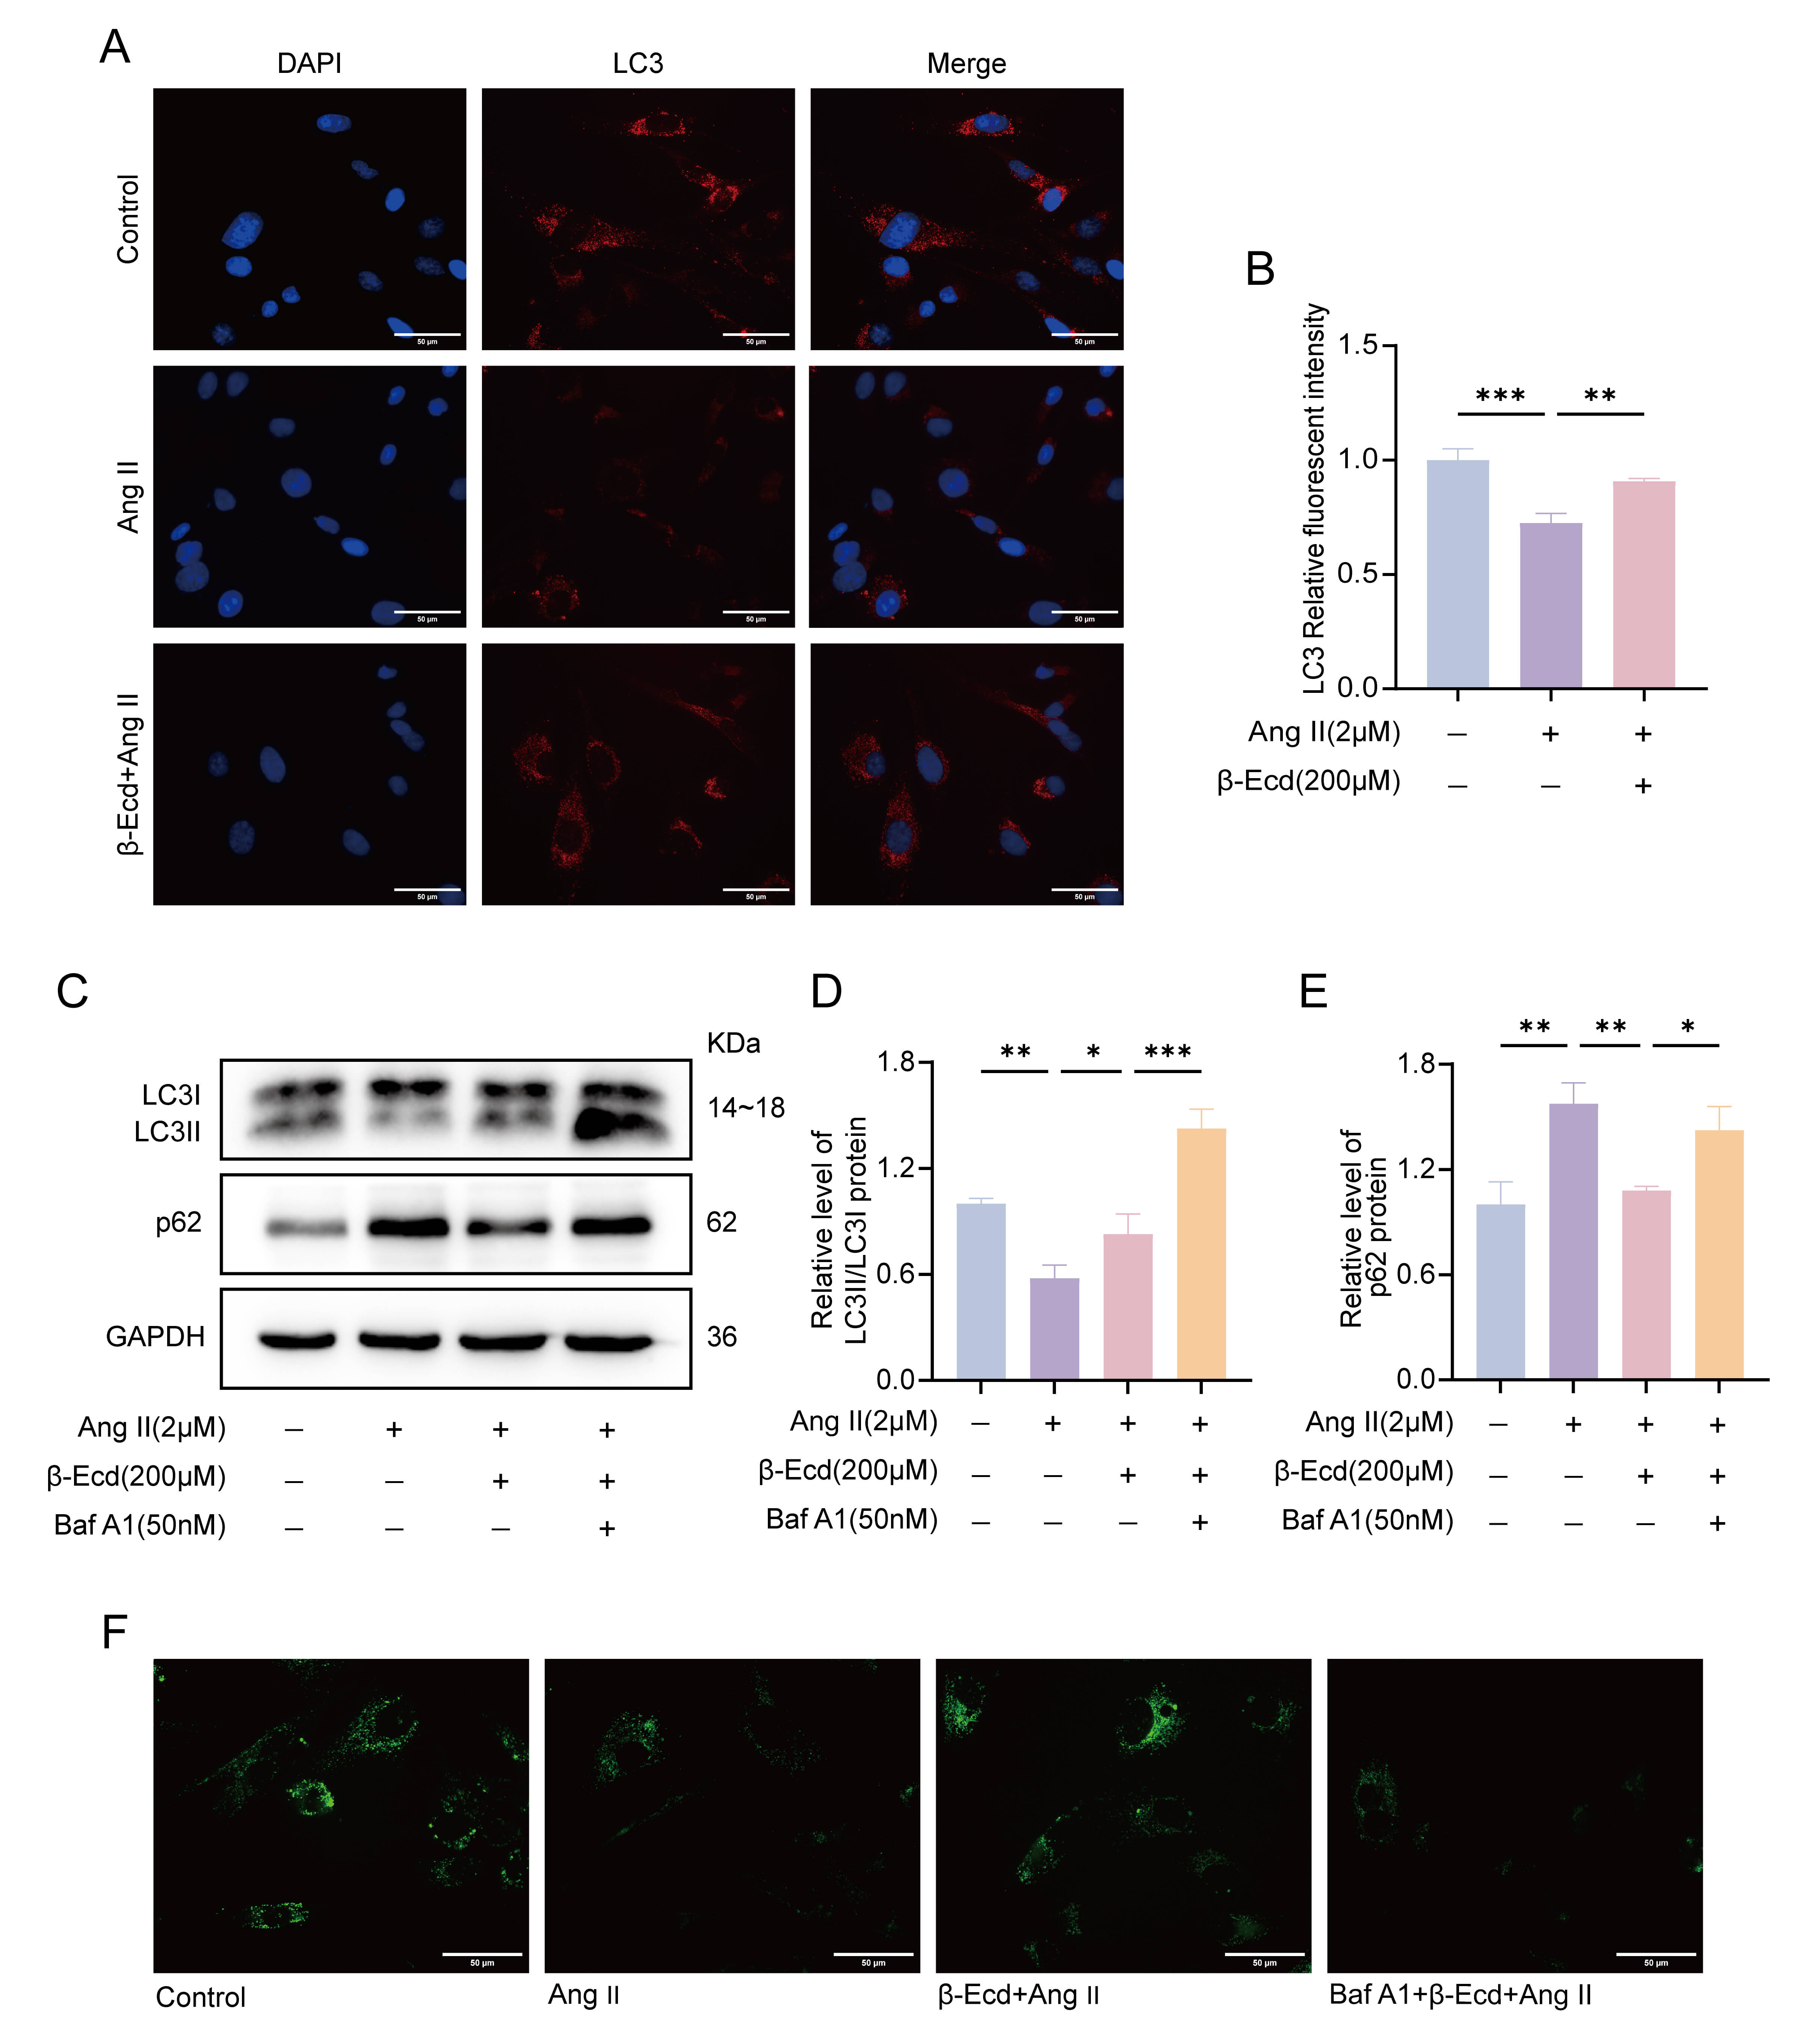 Fig. 3.
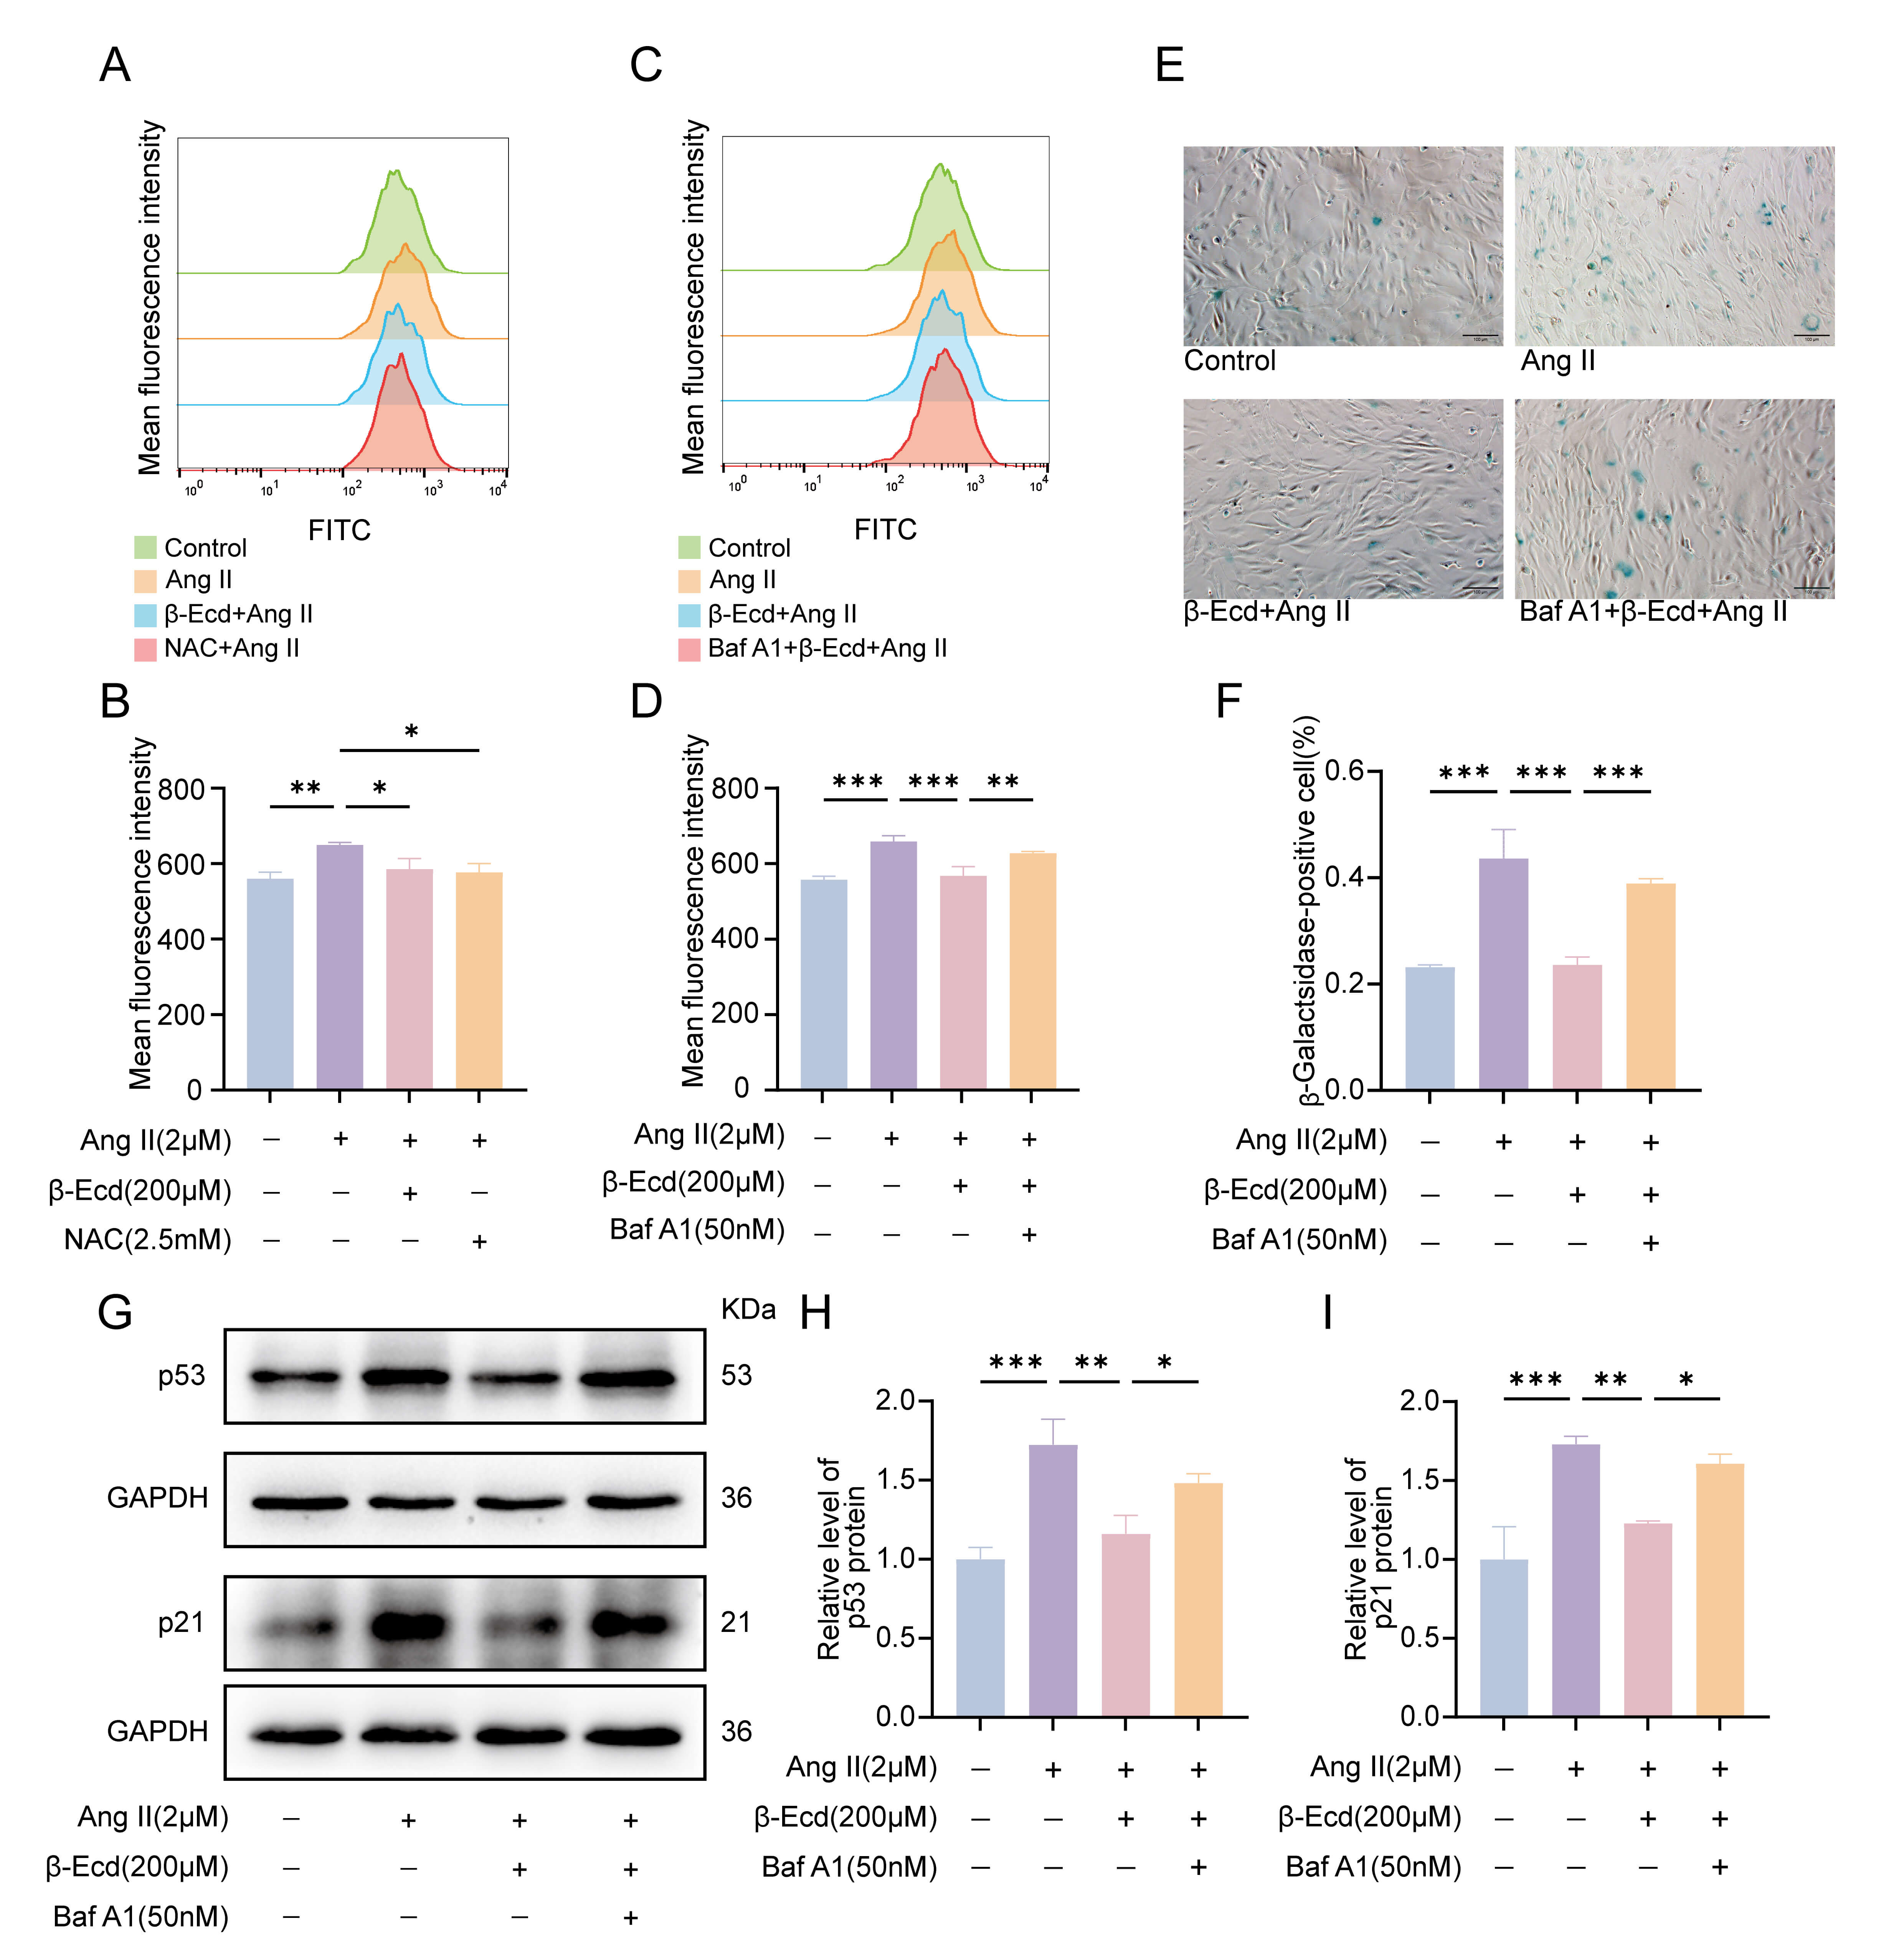 Fig. 4.
 Fig. 5.
 Fig. 6.
 Fig. 7.