


 , Reza Maleki 1,2, Peter J Wookey 3, Eric Smith 1,4, Wendy V Ingman 1,2,*
1 School of Medicine, College of Health, Adelaide University, The Queen Elizabeth Hospital, Woodville South, SA 5011, Australia
2 Robinson Research Institute, Adelaide University, Adelaide, SA 5005, Australia
3 Department of Medicine-Austin, University of Melbourne, Austin Health, Heidelberg, VIC 3084, Australia
4 Medical Oncology, Basil Hetzel Institute, The Queen Elizabeth Hospital, Woodville South, SA 5011, Australia
Abstract
Cellular stress can arise from external and internal stimuli and induce mechanisms that either maintain survival or activate cell death pathways. Nuclear factor kappa B (NF-κB) is a key transcription factor that mediates a range of responses to cellular stress, including senescence, DNA repair, and inflammation in breast cancer; however, there are currently limited biomarkers that identify its activation. CalRexinTM, a monoclonal antibody that targets the human calcitonin receptor, was investigated as a novel biomarker for cell stress associated with NF-κB activation.
Triple-negative breast cancer cell lines MDA-MB-231 and MDA-MB-468 were treated with lipopolysaccharide (LPS) to induce NF-κB-mediated cellular stress or treated with the cytotoxin staurosporine to induce apoptosis as a positive control. CalRexinTM and Annexin V positivity were investigated by flow cytometry and immunofluorescence.
Flow cytometry analysis revealed a dose- and time-dependent increase in the mean fluorescence intensity of CalRexinTM following LPS treatment of breast cancer cells. The mean fluorescence intensity of Annexin V, as a marker of apoptosis was not increased by LPS treatment and the cells remained viable. Immunofluorescence imaging demonstrated CalRexinTM positivity in LPS-stimulated cells accompanied by nuclear translocation of NF-κB.
Increased expression of calcitonin receptor, identified using the novel CalRexinTM antibody, has potential use as a biomarker for NF-κB-mediated cellular stress in breast cancer cells.
Keywords
- calcitonin receptor
- triple negative breast cancer
- stress
- NF-κB
- cell survival
- apoptosis
Cell stress is a state of dysfunction where cells initiate molecular responses to maintain their survival or undergo apoptosis [1]. Various stimuli trigger cellular stress, including heat shock, radiation, hypoxia, oxidants, tissue injury, and infection [2]. Cells respond to stress through multiple mechanisms that determine the cell’s destiny depending on the nature and duration of the stress as well as the cell type [3]. Cancer cells can co-opt these mechanisms to overcome apoptotic signals and increase survival [4].
Nuclear factor kappa B (NF-κB) is a transcription factor family made up of five protein subunits with diverse roles in cancer [5]. NF-κB is activated during cellular stress and regulates a broad range of responses including inflammation, cell proliferation and apoptosis in a cell and context-dependent manner [6]. In normal mammary tissue, NF-κB activation contributes to the stress responses associated with forced weaning, leading to mammary gland involution [7]. In breast cancer, NF-κB can become constitutively activated and promote cancer cell “stemness” which is associated with chemoresistance and enhanced cell survival [8].
Lipopolysaccharide (LPS) is a major surface molecule of Gram-negative bacteria, and is frequently used in vitro as a model activator of the NF-κB signalling pathway [9]. LPS has been shown to induce cellular stress responses, including autophagy [10] and oxidative stress [11] in multiple cell types. The most well-characterised effects of LPS on biological processes are mediated through the toll-like receptor 4 (TLR4)/NF-κB pathway. Binding of LPS to TLR4 activates myeloid differentiation primary response 88 (MYD88) and TIR-domain-containing adaptor-inducing interferon-beta (TRIF) leading to NF-κB activation. Sustained activation of this pathway can promote unresolved inflammation and cellular stress responses [12]. Traditionally, NF-κB activation is monitored by detecting protein activity in its pathway, including degradation of the inhibitor of kappa B (IKB) protein and phosphorylation of IKB alpha and IKB beta [13]. However, a limitation of these markers is their requirement for cell fixation or invasive protein extraction. This prevents the tracking of NF-κB-mediated stress dynamics responses in living cells.
Calcitonin receptor is a seven-transmembrane G-protein coupled receptor broadly expressed throughout mammalian development and adulthood [14]. It plays a pivotal role in calcium homeostasis through its interaction with the hormone calcitonin, inhibiting bone resorption through regulating the activity of osteoclasts [15], and also contributes to cell growth, differentiation and tissue development [15]. Increasing evidence indicates that the calcitonin receptor is linked to pre-apoptotic cellular stress responses [16]. In response to stressors, calcitonin receptor signalling can promote either cell survival or apoptosis in a context-dependent manner [17, 18]. Upon activation, the calcitonin receptor upregulates adenylate cyclase activity and downstream cyclic AMP signalling pathways inducing protein kinase A [15]. These signalling events can modulate key molecular programs in directing cell fate decisions between apoptosis or survival [19].
The role of the calcitonin receptor in breast cancer development and progression remains unclear. In vitro studies demonstrate that interaction between calcitonin and its receptor reduces breast cancer cell invasion and promotes survival under cellular stress [20]. On the other hand, knockdown of the calcitonin receptor has been shown to suppress cell proliferation by inducing apoptosis in various cancer cell lines, including those from prostate cancer and non-small-cell lung cancer [21, 22]. Interestingly, mRNA encoding the calcitonin receptor is downregulated in more aggressive human breast cancers, suggesting its role as a potential biomarker of tumour behaviour and stress adaptation [23, 24]. The cell-surface expression of the calcitonin receptor offers distinct advantages compared with quantifying intracellular proteins that are subject to rapid degradation, phosphorylation, or subcellular translocation as a potential indicator of NF-κB-mediated stress response. Here, we use the novel calcitonin receptor antibody CalRexinTM, which binds an extracellular epitope on live cells, to investigate the calcitonin receptor as a novel marker associated with NF-κB-mediated cellular stress in the context of breast cancer.
Human malignant mammary epithelial cell lines MDA-MB-231 and MDA-MB-468 were obtained from the American Type Culture Collection (ATCC, Manassas, VA, USA) validated by STR profiling. All cell lines were routinely screened for mycoplasma contamination employing established qPCR protocol and specific primers [25]. These cell lines were selected for this research as NF-κB activation has been well-characterised [26]. These studies used staurosporine (Sigma-Aldrich; Saint Louis, MO, USA; Cat#S5921) and lipopolysaccharide (LPS) isolated from Escherichia Coli O111:B4 (Sigma-Aldrich; Cat# L2630).
Breast cancer cell lines were cultured in Dulbecco’s Modified Eagle’s Medium (DMEM) with high glucose (Thermo Fisher Scientific, Waltham, MA, USA; Cat#D5796), supplemented with 10% Fetal Bovine Serum (FBS; Thermo Fisher Scientific; Cat#A5670701), 1% penicillin/streptomycin (Life Technologies, Carlsbad, CA, USA; Cat#15240062). Cells were then maintained at 37 °C in a humidified incubator with 5% CO2.
At 80–90% confluency, cells were seeded into sterile, flat-bottom 24-well
plates (Greiner Bio-One, Kremsmünster, Austria; Cat#662160). MDA-MB-231
cells were seeded at 0.1
At each time point and LPS concentration, 0.3
Viability staining was performed using propidium iodide (PI; 1.3 µg/mL; BioLegend, San Diego, CA, USA; Cat# 421301) for 5 min at room temperature, followed by washing with FACS buffer. Calcitonin receptor was detected using CalRexinTM:647 (Apop Biosciences, Melbourne, Victoria, Australia, 1 mg/mL) at a 1:50 dilution, with incubation for 30 min at 37 °C, according to the manufacturer’s instructions. As CalRexinTM binds an extracellular epitope of calcitonin receptor and is accumulated into live cells, CalRexinTM positivity may be a combination of cell surface expression and intracellular accumulation. Cells were then washed in FACS buffer and stained with APC/FireTM 750 Annexin V (BioLegend; Cat# 640953) at a 1:100 dilution in Annexin V binding buffer (BioLegend; Cat# 422201) for 15 min at room temperature. Cells were resuspended in 200 µL Annexin V binding buffer and transferred to FACS tubes.
Flow cytometry was performed using a Cytek Aurora spectral flow cytometer (Cytek Biosciences, Fremont, CA, USA), with acquisition of a minimum of 30,000 events per sample. Unstained cells were used to assess autofluorescence. Heat-killed breast cancer cells (60 °C for 5 min) served positive control for PI staining. Single-stained controls were generated using cells treated with 1 µM staurosporine and stained individually with each fluorophore to enable spectral unmixing and background correction. Data were analysed using FlowJo v10.10.0 (FlowJo LLC, Ashland, OR, USA). Marker expression was quantified as geometric mean fluorescence intensity (GMFI). Debris was excluded using forward scatter (FSC-A), and doublets were excluded using FSC-H versus FSC-A gating.
Breast cancer cells were seeded at 0.5
Blocking was performed using 10% goat serum (Sigma-Aldrich; Cat# G9023) in PBS for 1 h at room temperature. Slides were gently washed, then incubated overnight at 4 °C with a primary polyclonal antibody against NF-κB p65 (Abcam, Cambridge, UK; Cat# ab16502; 1:300 dilution) in PBS containing 1% bovine serum albumin (BSA; Sigma-Aldrich, Cat# A5611). Following washing, slides were incubated with Alexa Fluor 568-conjugated goat anti-rabbit IgG (H+L) secondary antibody (Invitrogen, Carlsbad, CA, USA; Cat# A-11036; 1:500 dilution) for 1 h at room temperature. Slides were then incubated overnight at 4 °C with CalRexinTM:488 (Apop Biosciences, Australia, 1 mg/mL; diluted 1:200). All slide incubations were performed in a humidified chamber unless otherwise stated.
After thorough washing, slides were counterstained with DAPI (Sigma-Aldrich; Cat# MBD0015) for 5 min, followed by coverslipping with fluorescence mounting medium (Agilent, Santa Clara, CA, USA; Cat# S3023). Images were acquired using a confocal laser scanning microscope (Carl Zeiss LSM 900, Oberkochen, Germany) operated with Zen Blue software 3.3 (Carl Zeiss, Oberkochen, Germany).
Confocal images acquired using a 20
CalRexinTM:488 intensity was quantified by measuring the percentage of pixel intensity above threshold in the green channel. NF-κB nuclear translocation was assessed by colocalisation analysis using JACoP (Just Another Colocalization Plugin) in Fiji. Colocalisation was evaluated between the DAPI (nuclear) and Alexa Fluor-568 (NF-κB p65) channels. Pearson’s correlation coefficient was used to quantify spatial colocalisation [29].
Data were obtained from two independent experiments, with eight randomly selected fields per experiment, mean values were calculated for each condition. All results were exported for subsequent statistical analysis and data visualisation.
All statistical analyses were performed using Prism v10.10 (GraphPad Software,
San Diego, CA, USA). Differences between the control and treated groups were
assessed using ordinary one-way analysis of variance (ANOVA) followed by
Dunnett’s post hoc test. A p-value
To determine whether LPS alters calcitonin receptor positivity (detected using CalRexinTM antibody) in breast cancer cells, MDA-MB-231 and MDA-MB-468 cells were treated with increasing concentrations of LPS for 19 h and analysed by flow cytometry.
In MDA-MB-231 cells, calcitonin receptor positivity, quantified as
CalRexinTM GMFI, was increased following treatment with 10
µg/mL and 25 µg/mL compared to untreated controls (Fig. 1A,C; p
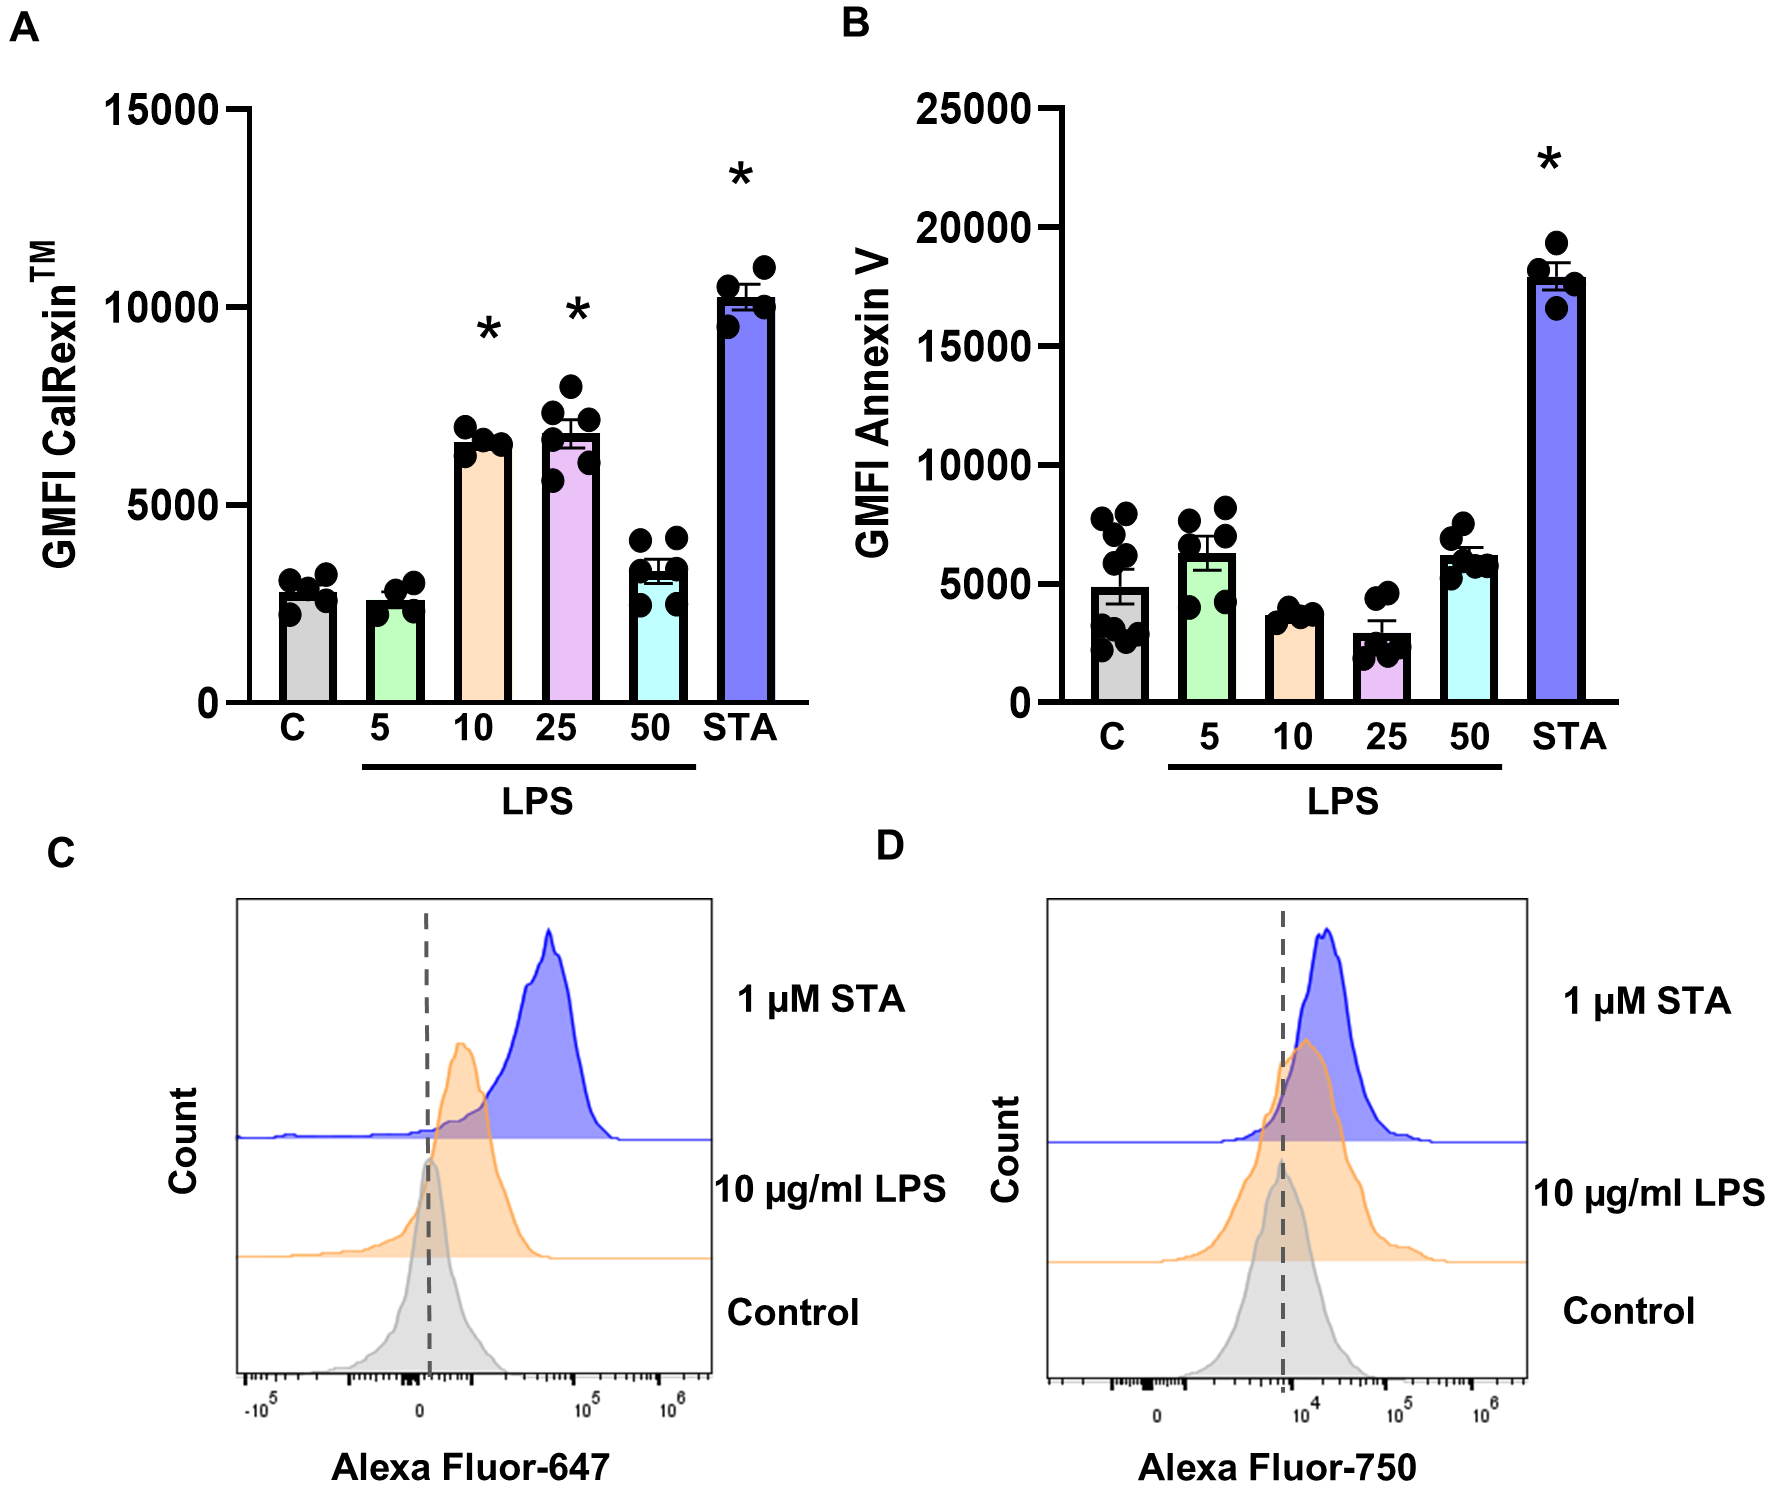 Fig. 1.
Dose-dependent effect of LPS on calcitonin receptor fluorescence
in MDA-MB-231 cells. (A) Calcitonin receptor and (B) Annexin V GMFI quantifying
on cells treated with 5, 10, 25, 50 µg/mL LPS and 1 µM
staurosporine (STA) after 19 h, or untreated Controls. Representative flow
cytometry-based plots showing the fluorescence cell count following treatment
with 10 µg/mL LPS and 1 µM staurosporine (STA) for (C)
CalRexinTM:647 and (D) APC-Fire-750 Annexin V, when compared to untreated
control cells. Data are from two independent experiments conducted in triplicate,
mean
In MDA-MB-468 cells, treatment with 10, 25, and 50 µg/mL LPS (p = 0.002, 0.007, and 0.001 respectively) resulted in an increase in fluorescence intensity of CalRexinTM relative to untreated controls (Fig. 2A,C). As observed in MDA-MB-231 cells, Annexin V GMFI did not differ from control levels at any LPS concentration (Fig. 2B,D). Staurosporine treatment resulted in increased fluorescence intensity of both CalRexinTM and Annexin V. Together, these findings indicate that LPS increases calcitonin receptor availability in a concentration-dependent manner without triggering apoptosis in either breast cancer cell line.
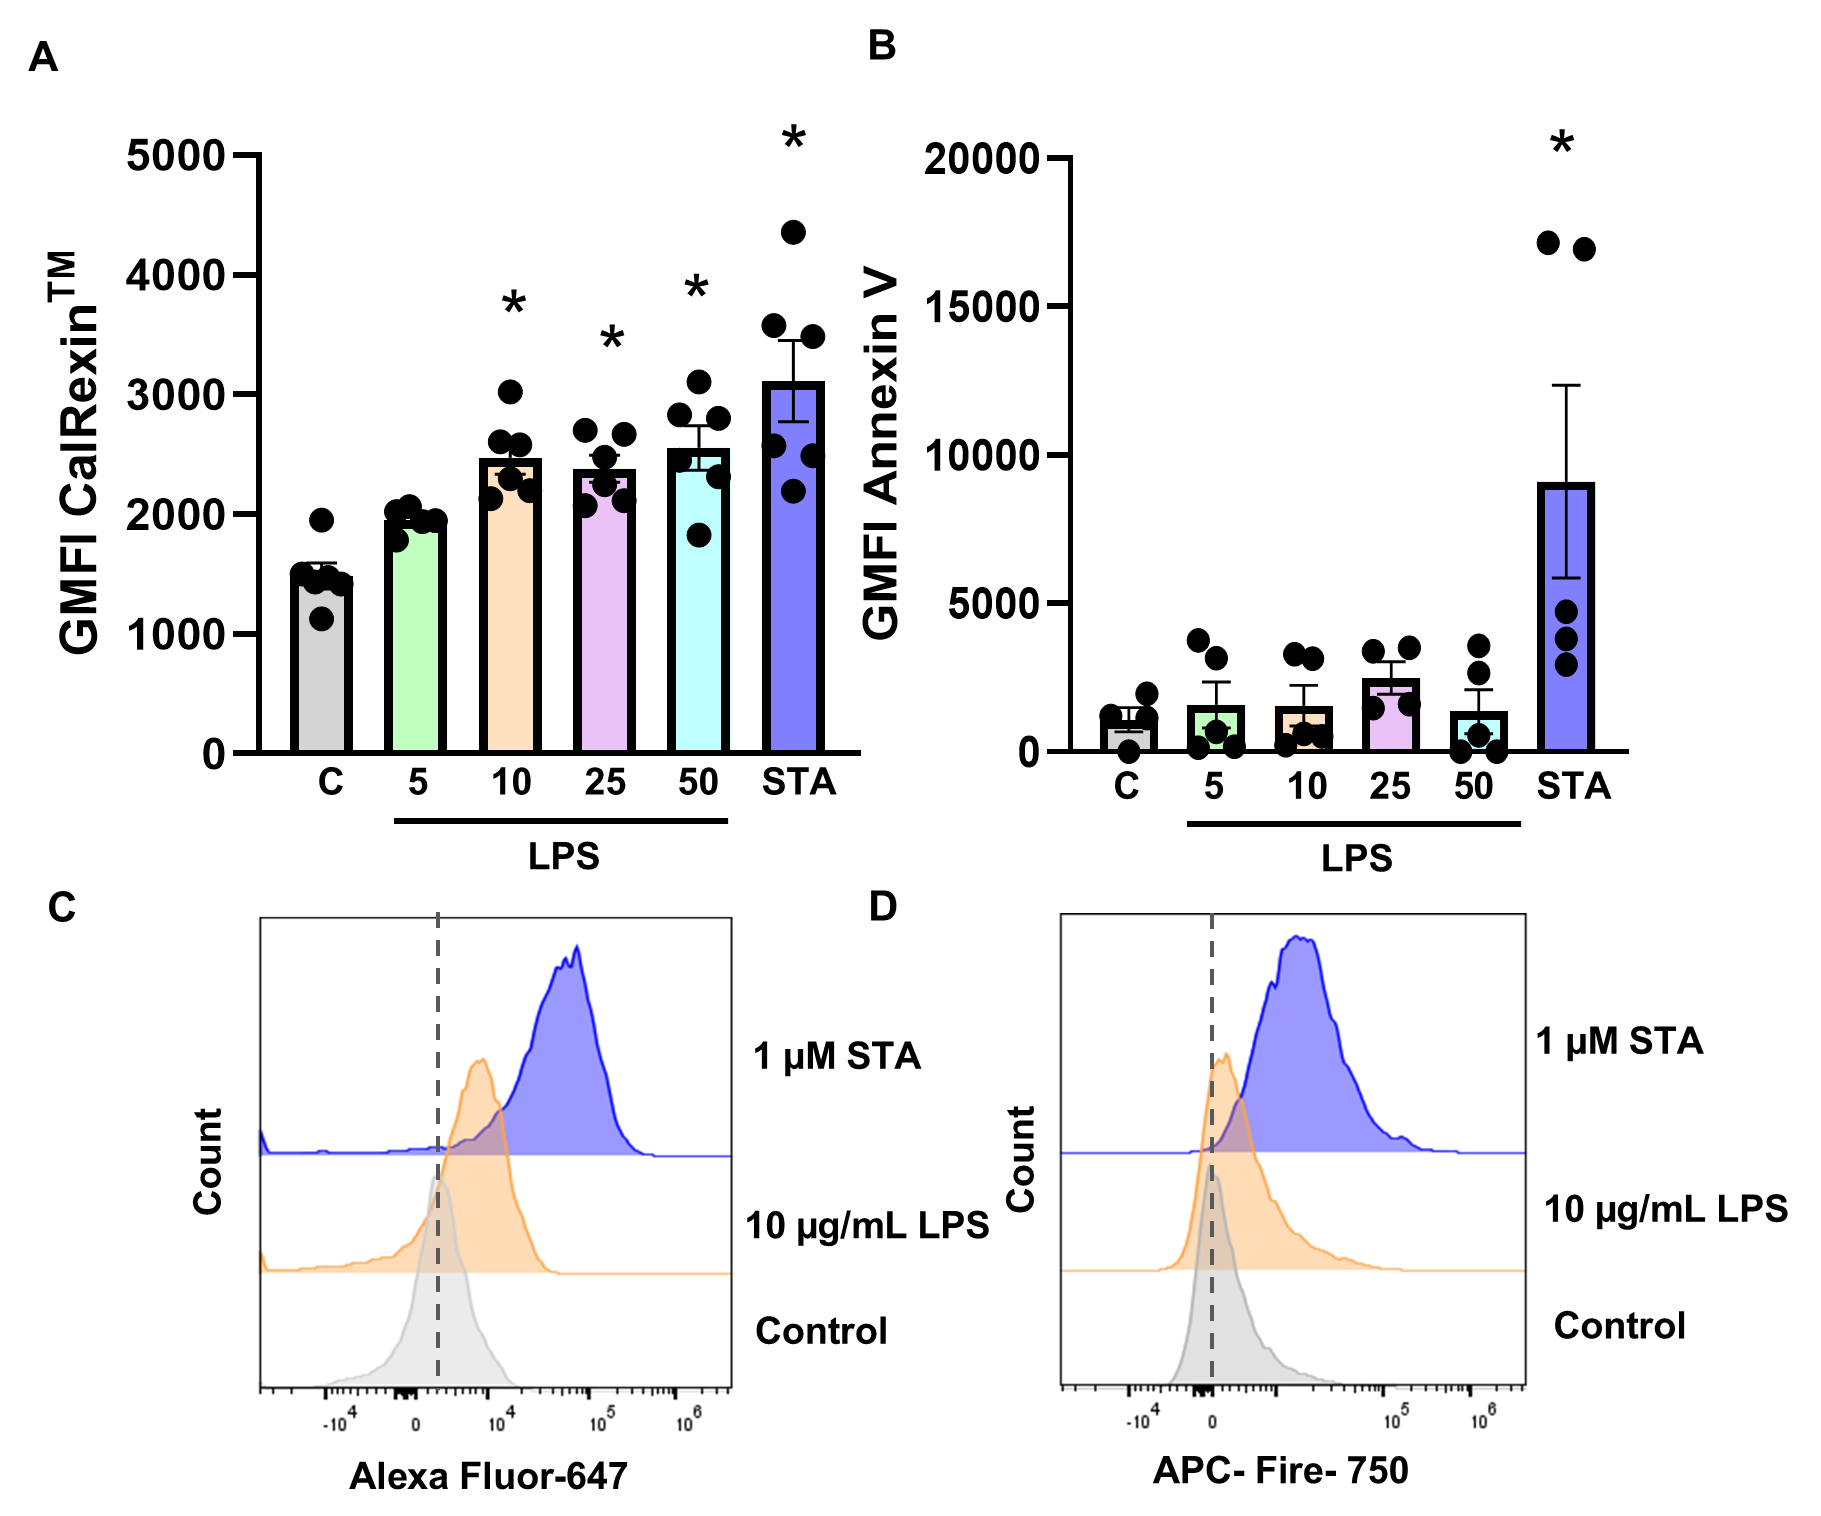 Fig. 2.
Dose-dependent effect of LPS on calcitonin receptor fluorescence
in the MDA-MB-468 cell. (A) Calcitonin receptor and (B) Annexin V GMFI
quantifying on cells treated with 5, 10, 25, 50 µg/mL LPS and 1
µM staurosporine (STA) after 19 h, or untreated Controls.
Representative flow cytometry-based plots showing the fluorescent cell count
following treatment with 10 µg/mL LPS and 1 µM
staurosporine (STA) for (C) CalRexinTM:647 and (D) APC-Fire-750 Annexin V,
when compared to untreated control cells. Data are from two independent
experiments conducted in triplicate, mean
To visualise calcitonin receptor subcellular distribution, immunofluorescence staining was performed following LPS or staurosporine treatment. Minimal CalRexinTM staining was detected in untreated control cells (Fig. 3A–C). Staurosporine treatment for 19 h resulted in markedly increased calcitonin receptor staining in MDA-MB-231 cells (Fig. 3G–I), consistent with previous findings in HeLa human cervical adenocarcinoma cells [32] and MG63 osteosarcoma cells [16]. CalRexinTM fluorescence signal was predominantly localised to cytoplasmic and perinuclear regions, with punctate staining patterns evident following staurosporine treatment. In contrast, LPS-treated cells displayed moderate CalRexinTM fluorescence signal with fewer puncta (Fig. 3D–F).
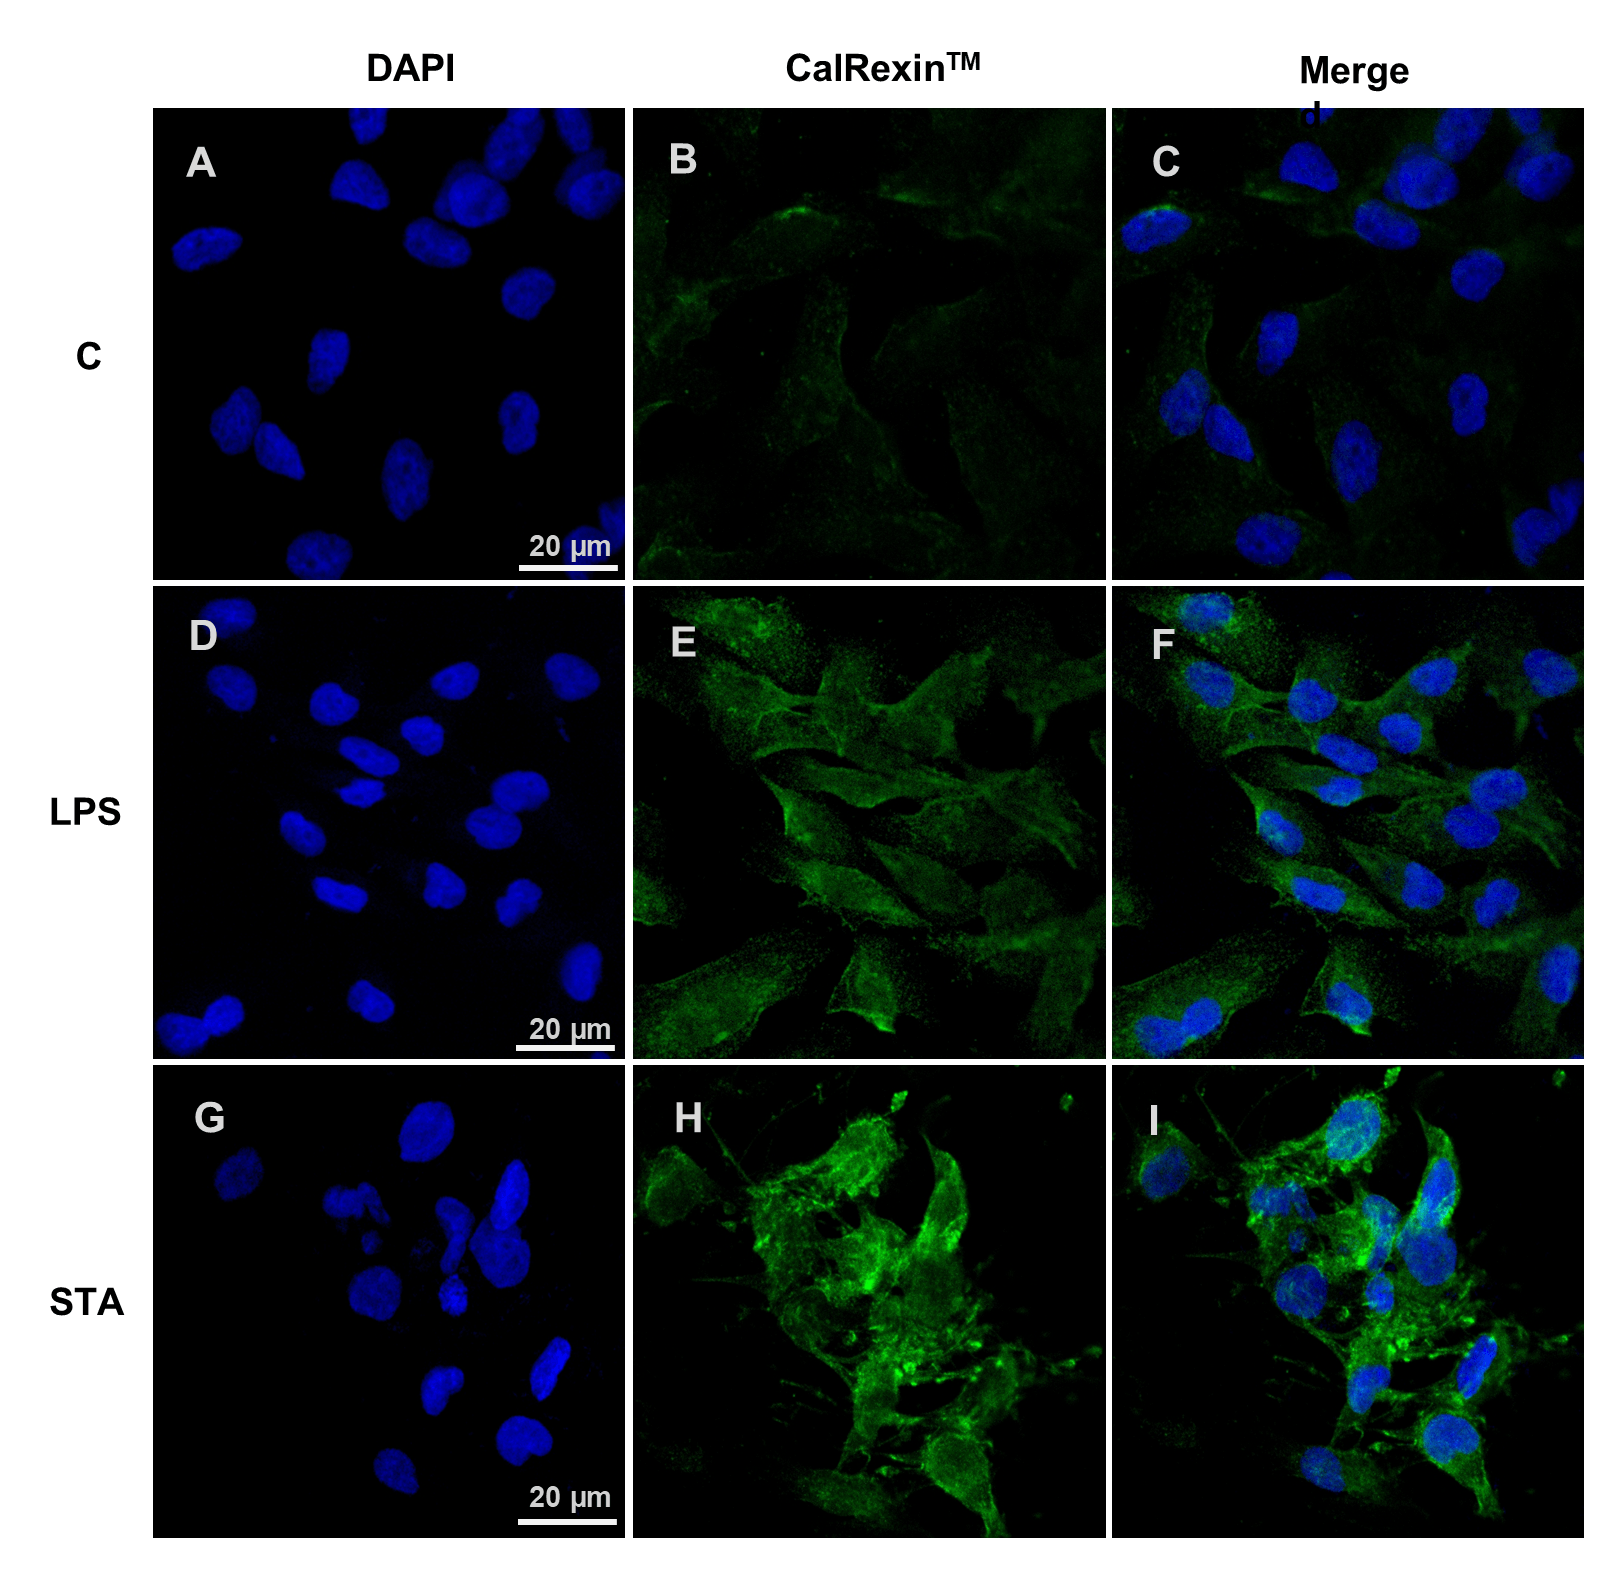 Fig. 3.
CalRexin𝐓𝐌 immunofluorescence staining of breast cancer cells following LPS or staurosporine (STA) treatment. (A–C) Representative immunofluorescence images of MDA-MB-231 cells untreated, or (D–F) treated with 10 µg/mL LPS or (G–I) 1 µM staurosporine for 19 h. Cells were stained with DAPI (A,D,G; blue) to visualise nuclei and CalRexinTM antibody (B,E,H; green) to detect calcitonin receptor. Merged images are shown (C,F,I). All images were acquired using identical confocal settings. Scale bar = 20 µm.
To examine the temporal dynamics of calcitonin receptor positivity, MDA-MB-231 and MDA-MB-468 cells were treated with 10 µg/mL LPS and analysed after 6, 24, and 48 h.
In MDA-MB-231 cells, a modest increase in CalRexinTM GMFI was observed
after 6 h of LPS treatment (p = 0.03), with no changes detected at later
time points (Fig. 4A). The majority of cells remained negative for both
CalRexinTM and Annexin V (Fig. 4B). In comparison, GMFI for CalRexinTM
was increased when cells were treated with staurosporine for 48 h (Fig. 4C;
p
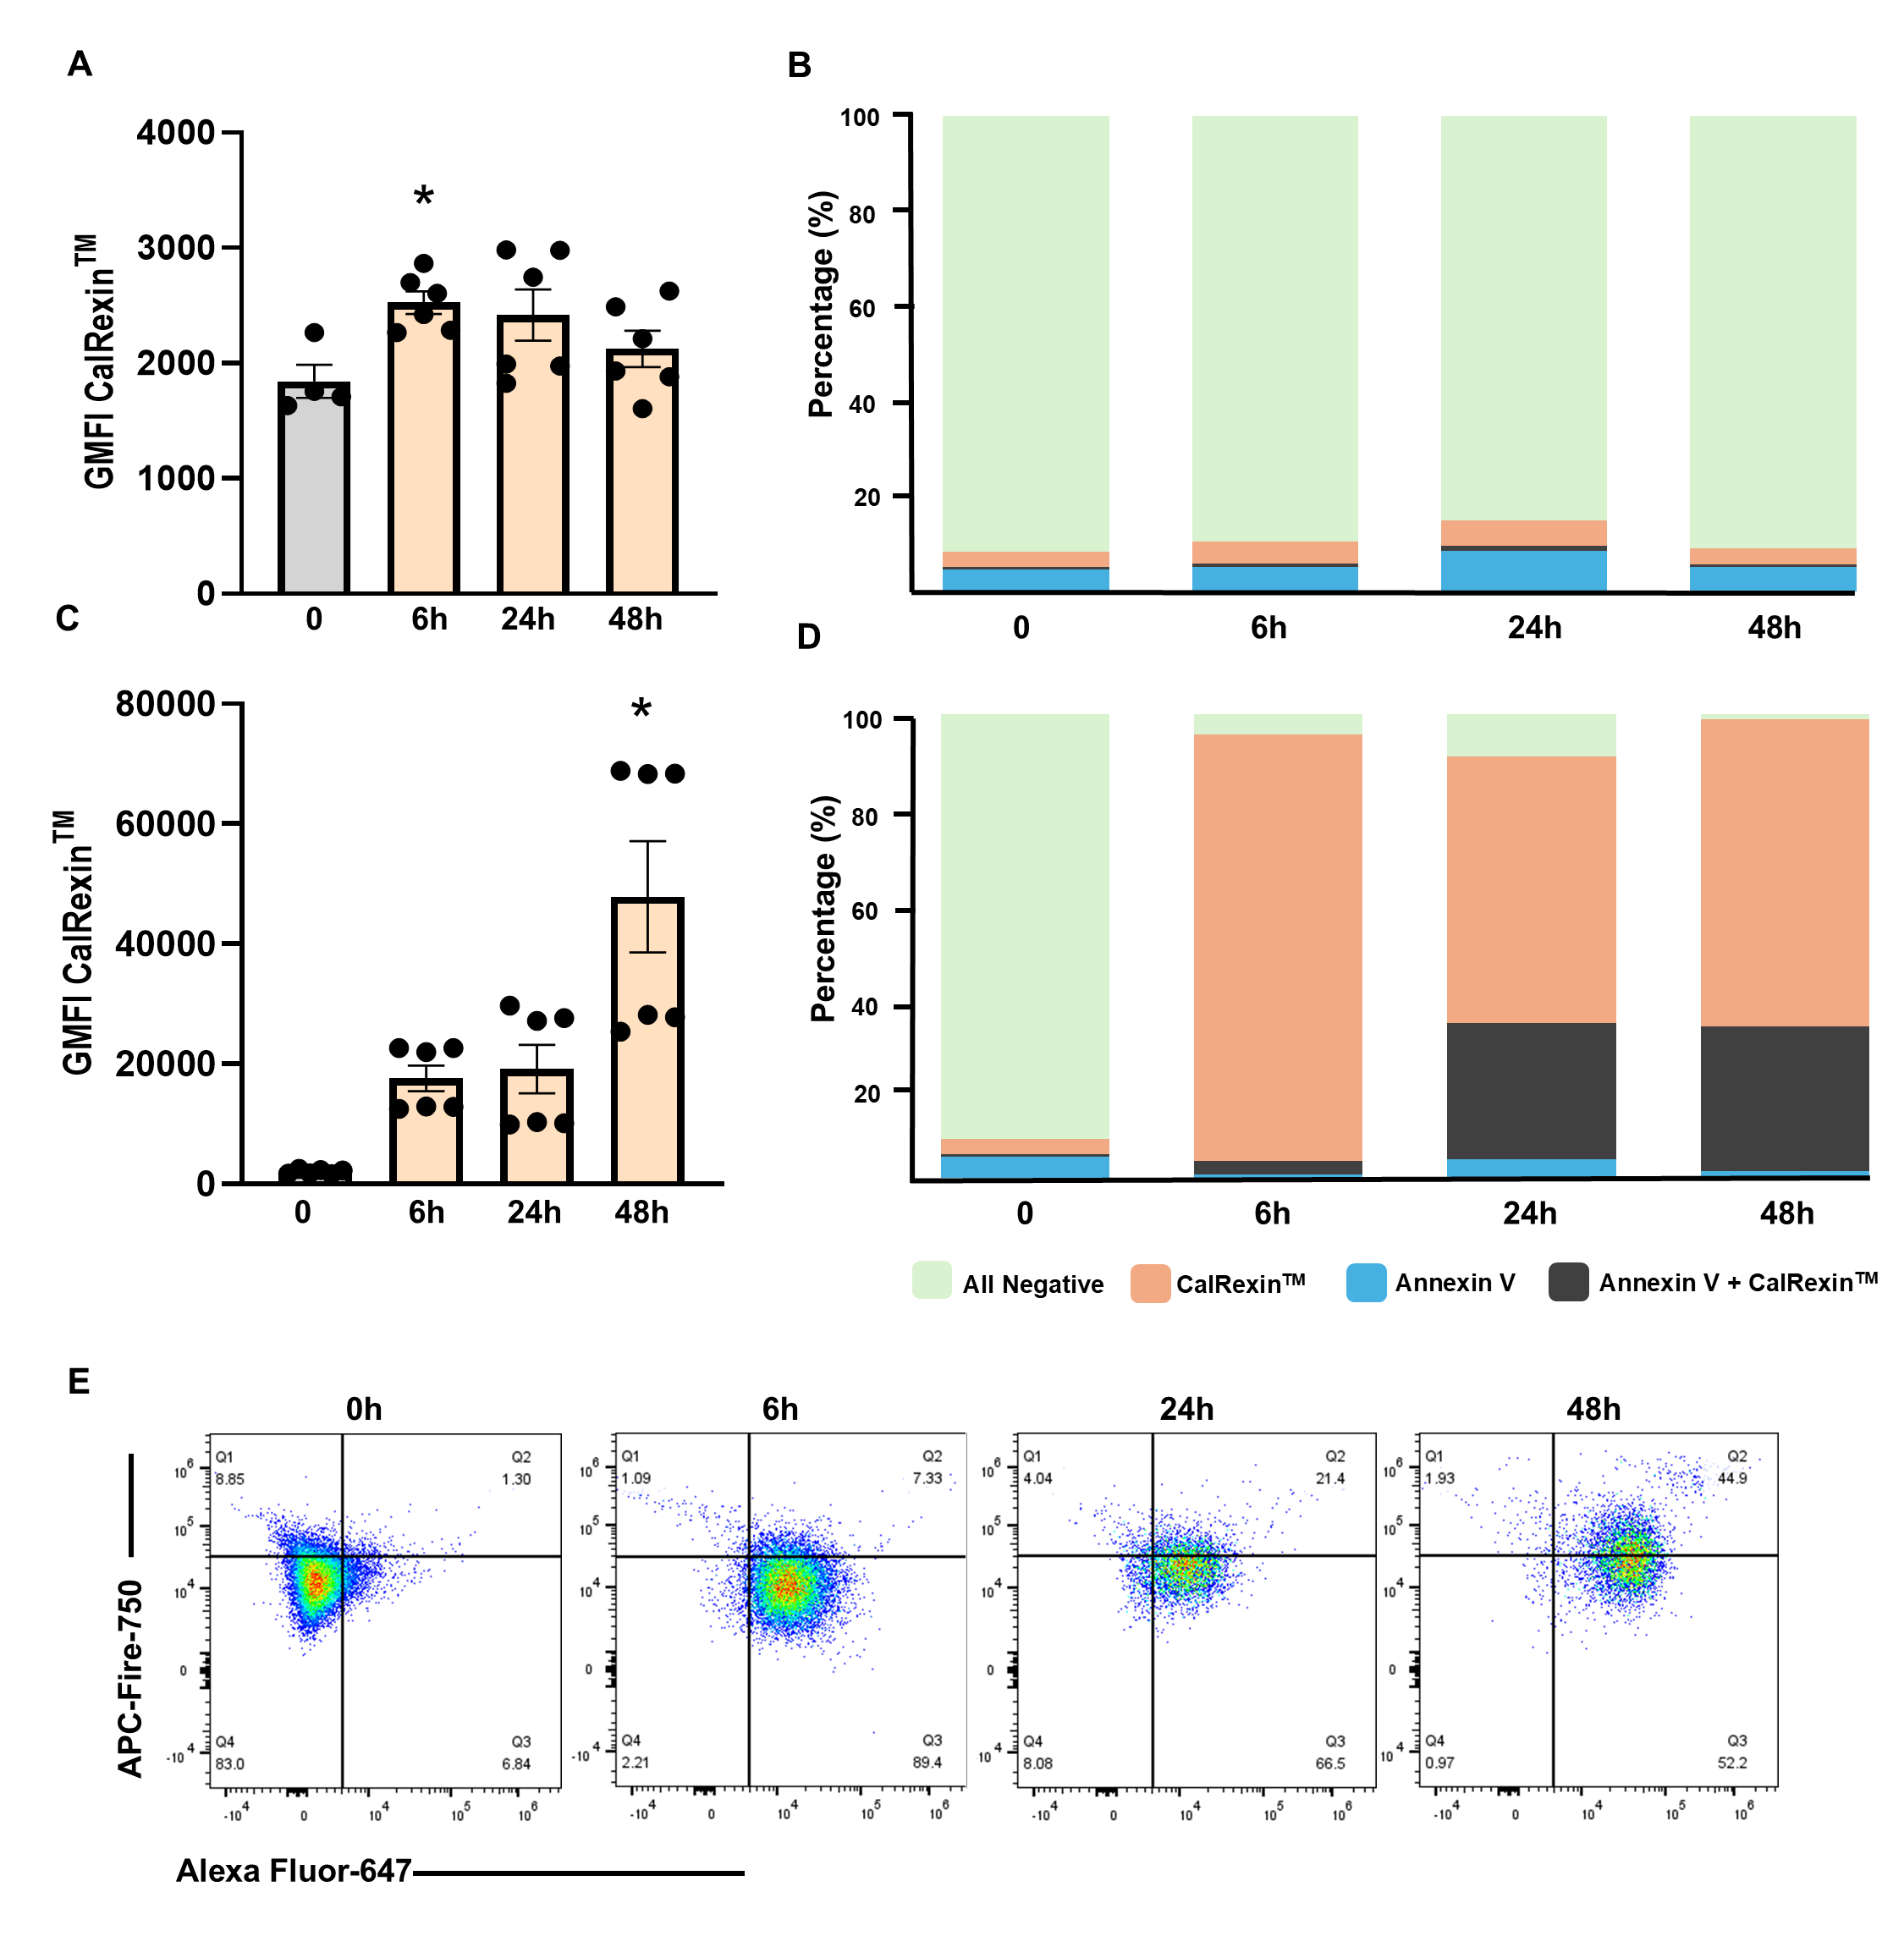 Fig. 4.
Time-dependent effects of LPS and staurosporine (STA) on CalRexin𝐓𝐌 and Annexin V staining in MDA-MB-231 cells. (A)
CalRexinTM GMFI and (B) CalRexinTM/Annexin V positivity in cells
treated with 10 µg/mL LPS at the 6, 24 and 48-h time points. (C)
CalRexinTM GMFI and (D) CalRexinTM/Annexin V positivity in cells treated
with 1 µM staurosporine at the 6, 24 and 48-h time points. Stacked
bar charts represent the percentage of total live cell expressing
CalRexinTM+, CalRexinTM+ Annexin V+, Annexin V+, and CalRexinTM–
Annexin V–. (E) Representative flow cytometry plot of the cells treated with
1 µM staurosporine at the 6, 24 and 48-h time points; Q1 quadrant; Annexin
V+, Q2; CalRexinTM– Annexin V–, Q3; CalRexinTM+ Annexin V+,
and Q4 CalRexinTM+ populations. Cells were stained with CalRexinTM
–AF647 for CalRexinTM and APC–Fire750 antibodies for Annexin V detection.
Data are from two independent experiments conducted in triplicate, mean
In MDA-MB-468 cells, CalRexinTM fluorescent signal was not
significantly altered at early time points; however, an increase was observed at
48 h of LPS treatment (Fig. 5A; p = 0.01). Similar to MDA-MB-231, most
of the cells treated with LPS do not express CalRexinTM nor Annexin V (Fig. 5B). Staurosporine treatment resulted in increased CalRexinTM GMFI at 24 and
48 h (Fig. 5C; p
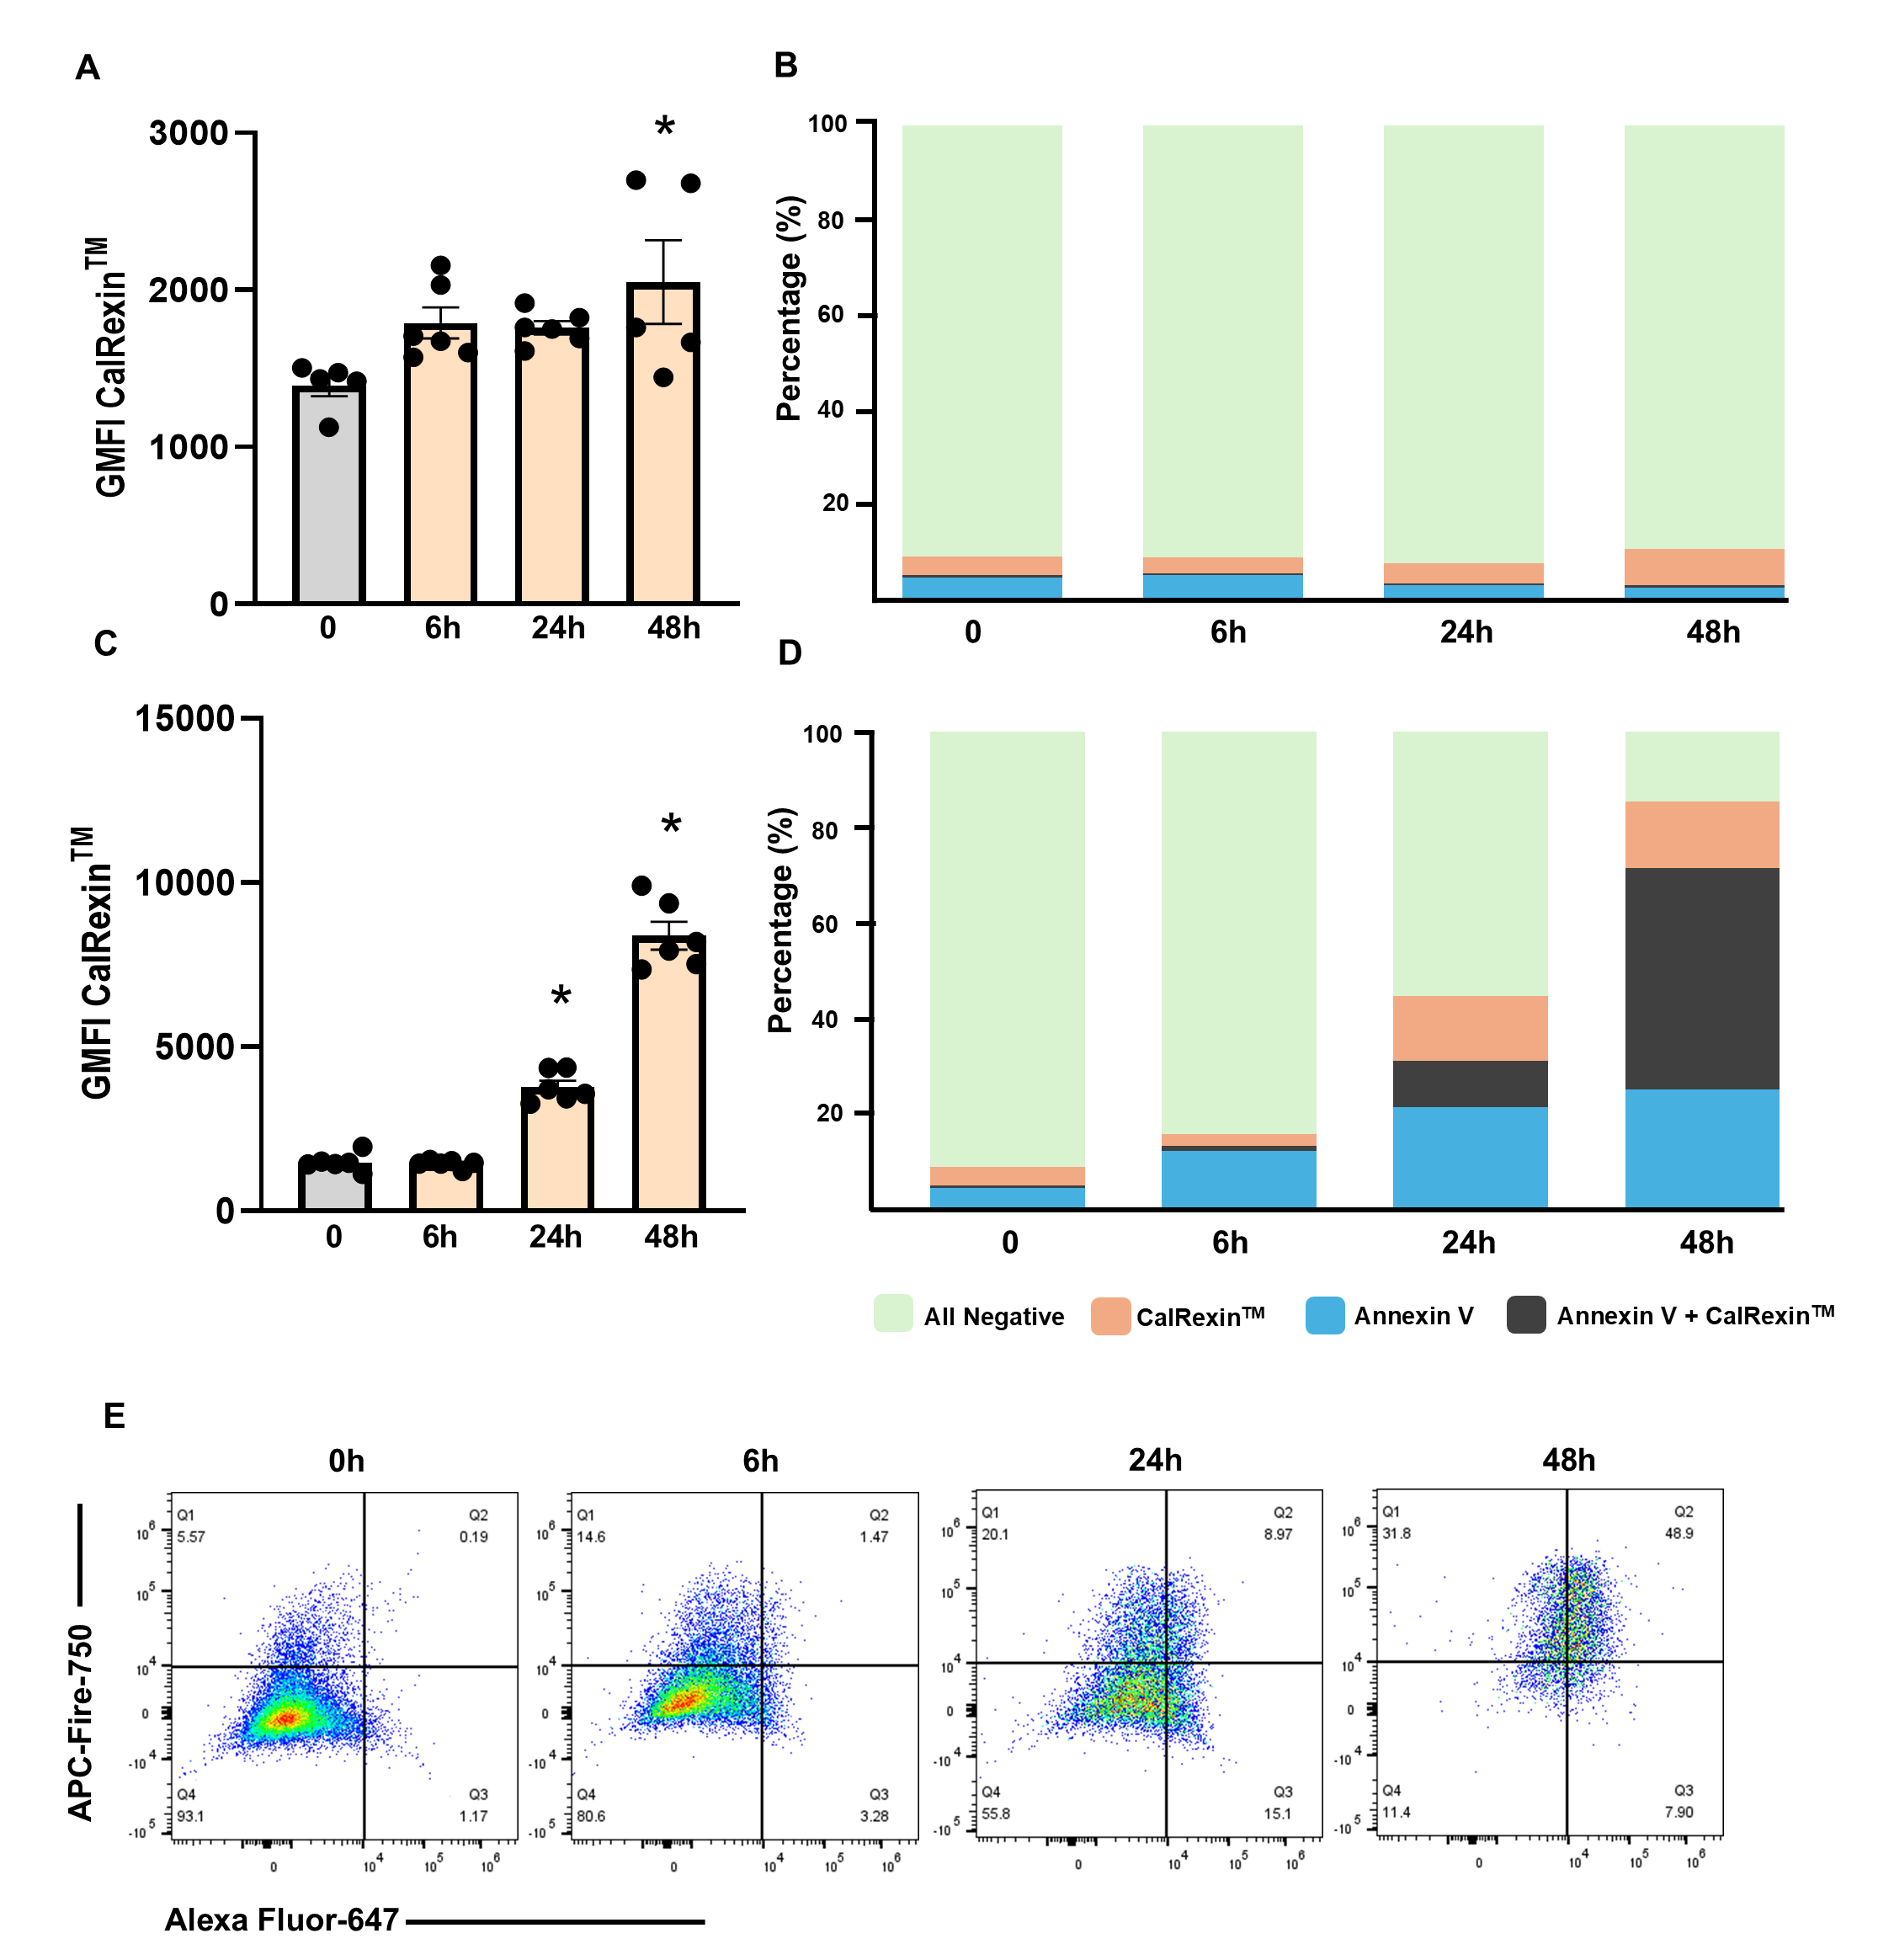 Fig. 5.
Time-dependent effects of LPS and staurosporine (STA) on
CalRexin𝐓𝐌 and Annexin V staining in MDA-MB-468 cells. (A) CalRexinTM
GMFI and (B) CalRexinTM/Annexin V positivity in cells treated with 10
µg/mL LPS at the 6, 24 and 48-h time points. (C) CalRexinTM GMFI and
(D) CalRexinTM/Annexin V positivity in cells treated with 1 µM
staurosporine at the 6, 24 and 48-h time points. Stacked bar charts represent the
percentage of total live cell expressing CalRexinTM+, CalRexinTM+
Annexin V+, Annexin V+, and CalRexinTM– Annexin V–. (E) Representative
flow cytometry plot of the cells treated with 1 µM staurosporine at the 6,
24 and 48-h time points; Q1 quadrant; Annexin V+, Q2; CalRexinTM–
Annexin V–, Q3; CalRexinTM+ Annexin V+, and Q4 CalRexinTM+
populations. Cells were stained with CalRexinTM: AF647 for CalRexinTM
and APC–Fire750 antibodies for Annexin V detection. Data are from two
independent experiments conducted in triplicate, mean
To assess cell viability in response to treatment with 10 µg/mL LPS or 1 µM staurosporine, MDA-MB-231 and MDA-MB-468 cells were stained with propidium iodide (PI), analysed by flow cytometry, and the percentage of non-viable cells was quantified by gating the PI-positive population. For this study, both live and heat-killed cells were used to define the boundary of the PI-positive population which represented dead cells. LPS treatment did not increase the proportion of PI-positive MDA-MB-231 (Fig. 6A,C) or MDA-MB-468 (Fig. 6B,D) cells, indicating that LPS did not adversely affect cell viability under these conditions. In contrast, staurosporine treatment reduced viability to below 90% in MDA-MB-231 and approximately 70% in MDA-MB-468 cells, consistent with induction of cell death.
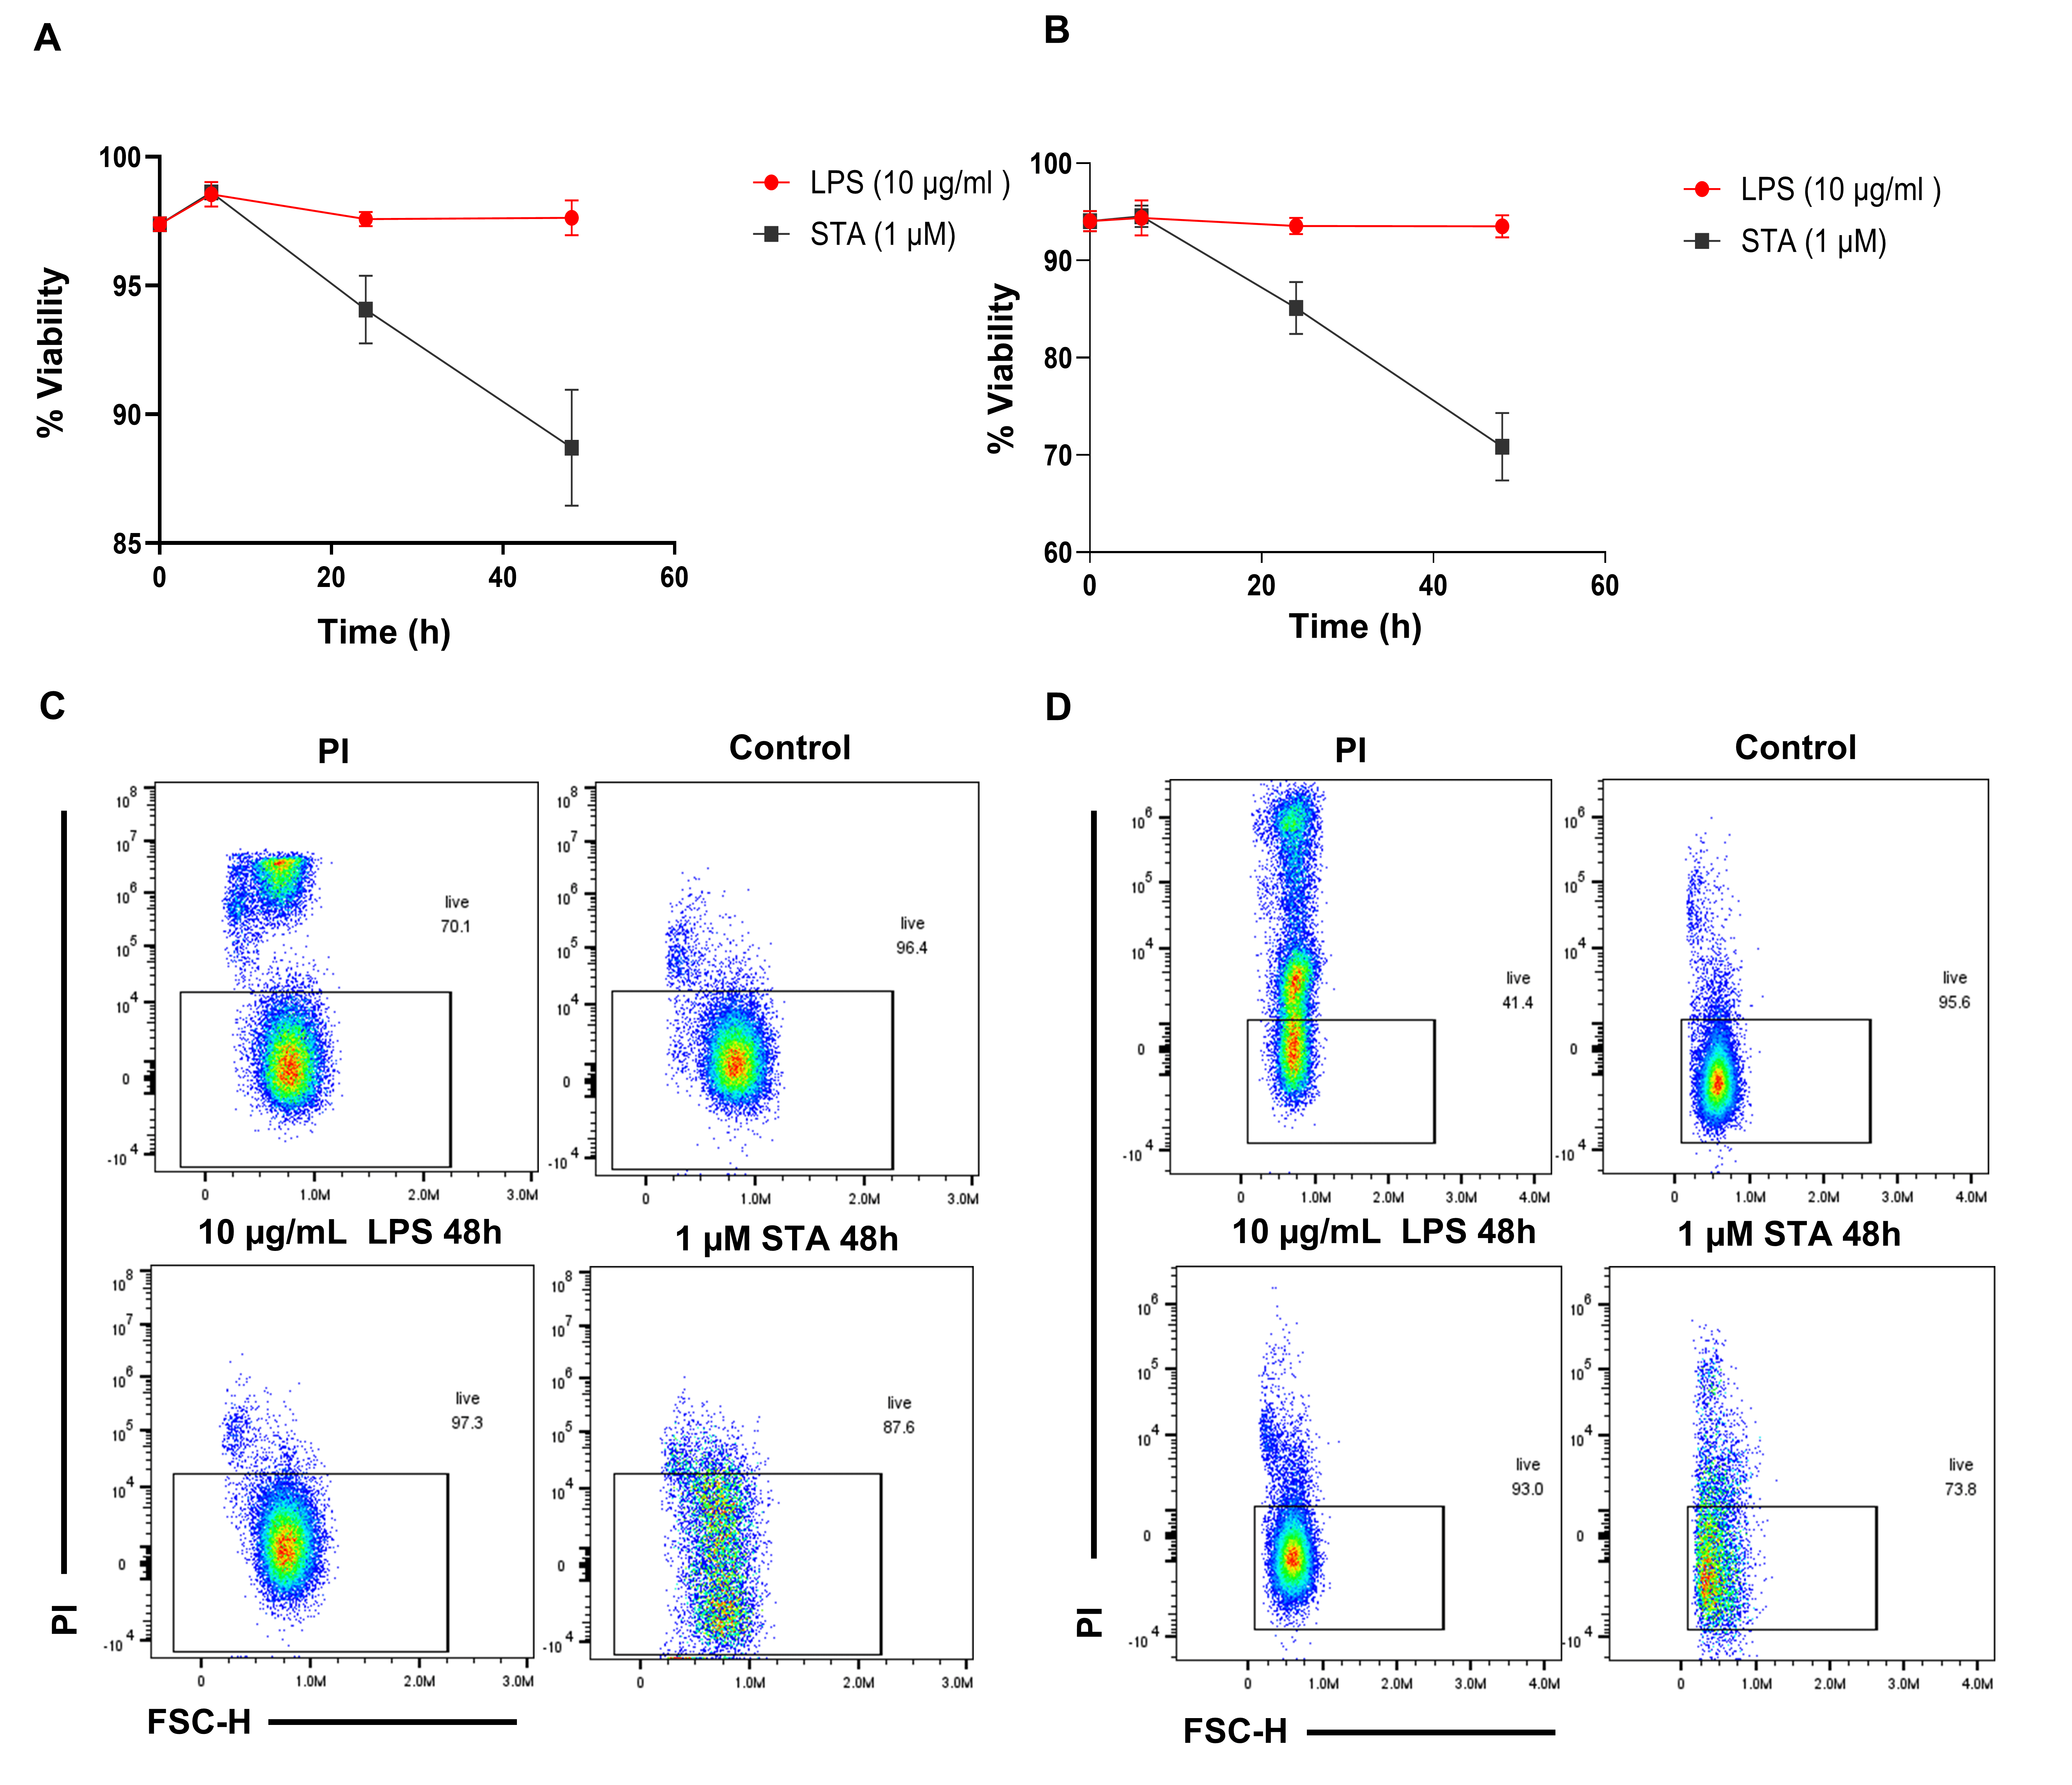 Fig. 6.
Viability study of breast cancer cells using PI staining with
flow cytometry over time. (A) Percentage of live MDA-MB-231 and (B) MDA-MB-468
cells treated with 10 µg/mL LPS and 1 µM staurosporine
(STA) at the indicated time points (6, 24, and 48 h). (C) Representative flow
cytometry PI scatter plots displaying the distribution of the MDA-MB-231 and (D)
MDA-MB-468 cells population after 48 h of treatment with 10 µg/mL
LPS and 1 µM staurosporine. Data are from two independent
experiments conducted in triplicate, mean
To investigate whether LPS-induced calcitonin receptor positivity was associated with NF-κB activation, immunofluorescent co-staining for CalRexinTM and NF-κB was performed in MDA-MB-231 cells. Minimal CalRexinTM staining was observed in untreated controls, with NF-κB staining localised to the cytoplasm (Fig. 7A–D). Following 4 h of LPS treatment, CalRexinTM positive cells were increased and NF-κB was detected (Fig. 7E–H). In staurosporine-treated cells, CalRexinTM staining was evident and NF-κB staining remained predominantly cytoplasmic (Fig. 7I–L). Quantitative analysis demonstrated that CalRexinTM fluorescence signal was increased by LPS and staurosporine treatment compared with controls (Fig. 7M; LPS p = 0.003, STA p = 0.001), and there was increased colocalisation between NF-κB and nuclei DAPI staining when cells were treated with LPS (Fig. 7N; p = 0.001). These findings indicate that NF-κB activation occurs alongside increased CalRexinTM fluorescence signal in LPS-treated breast cancer cells but not in staurosporine-treated cells.
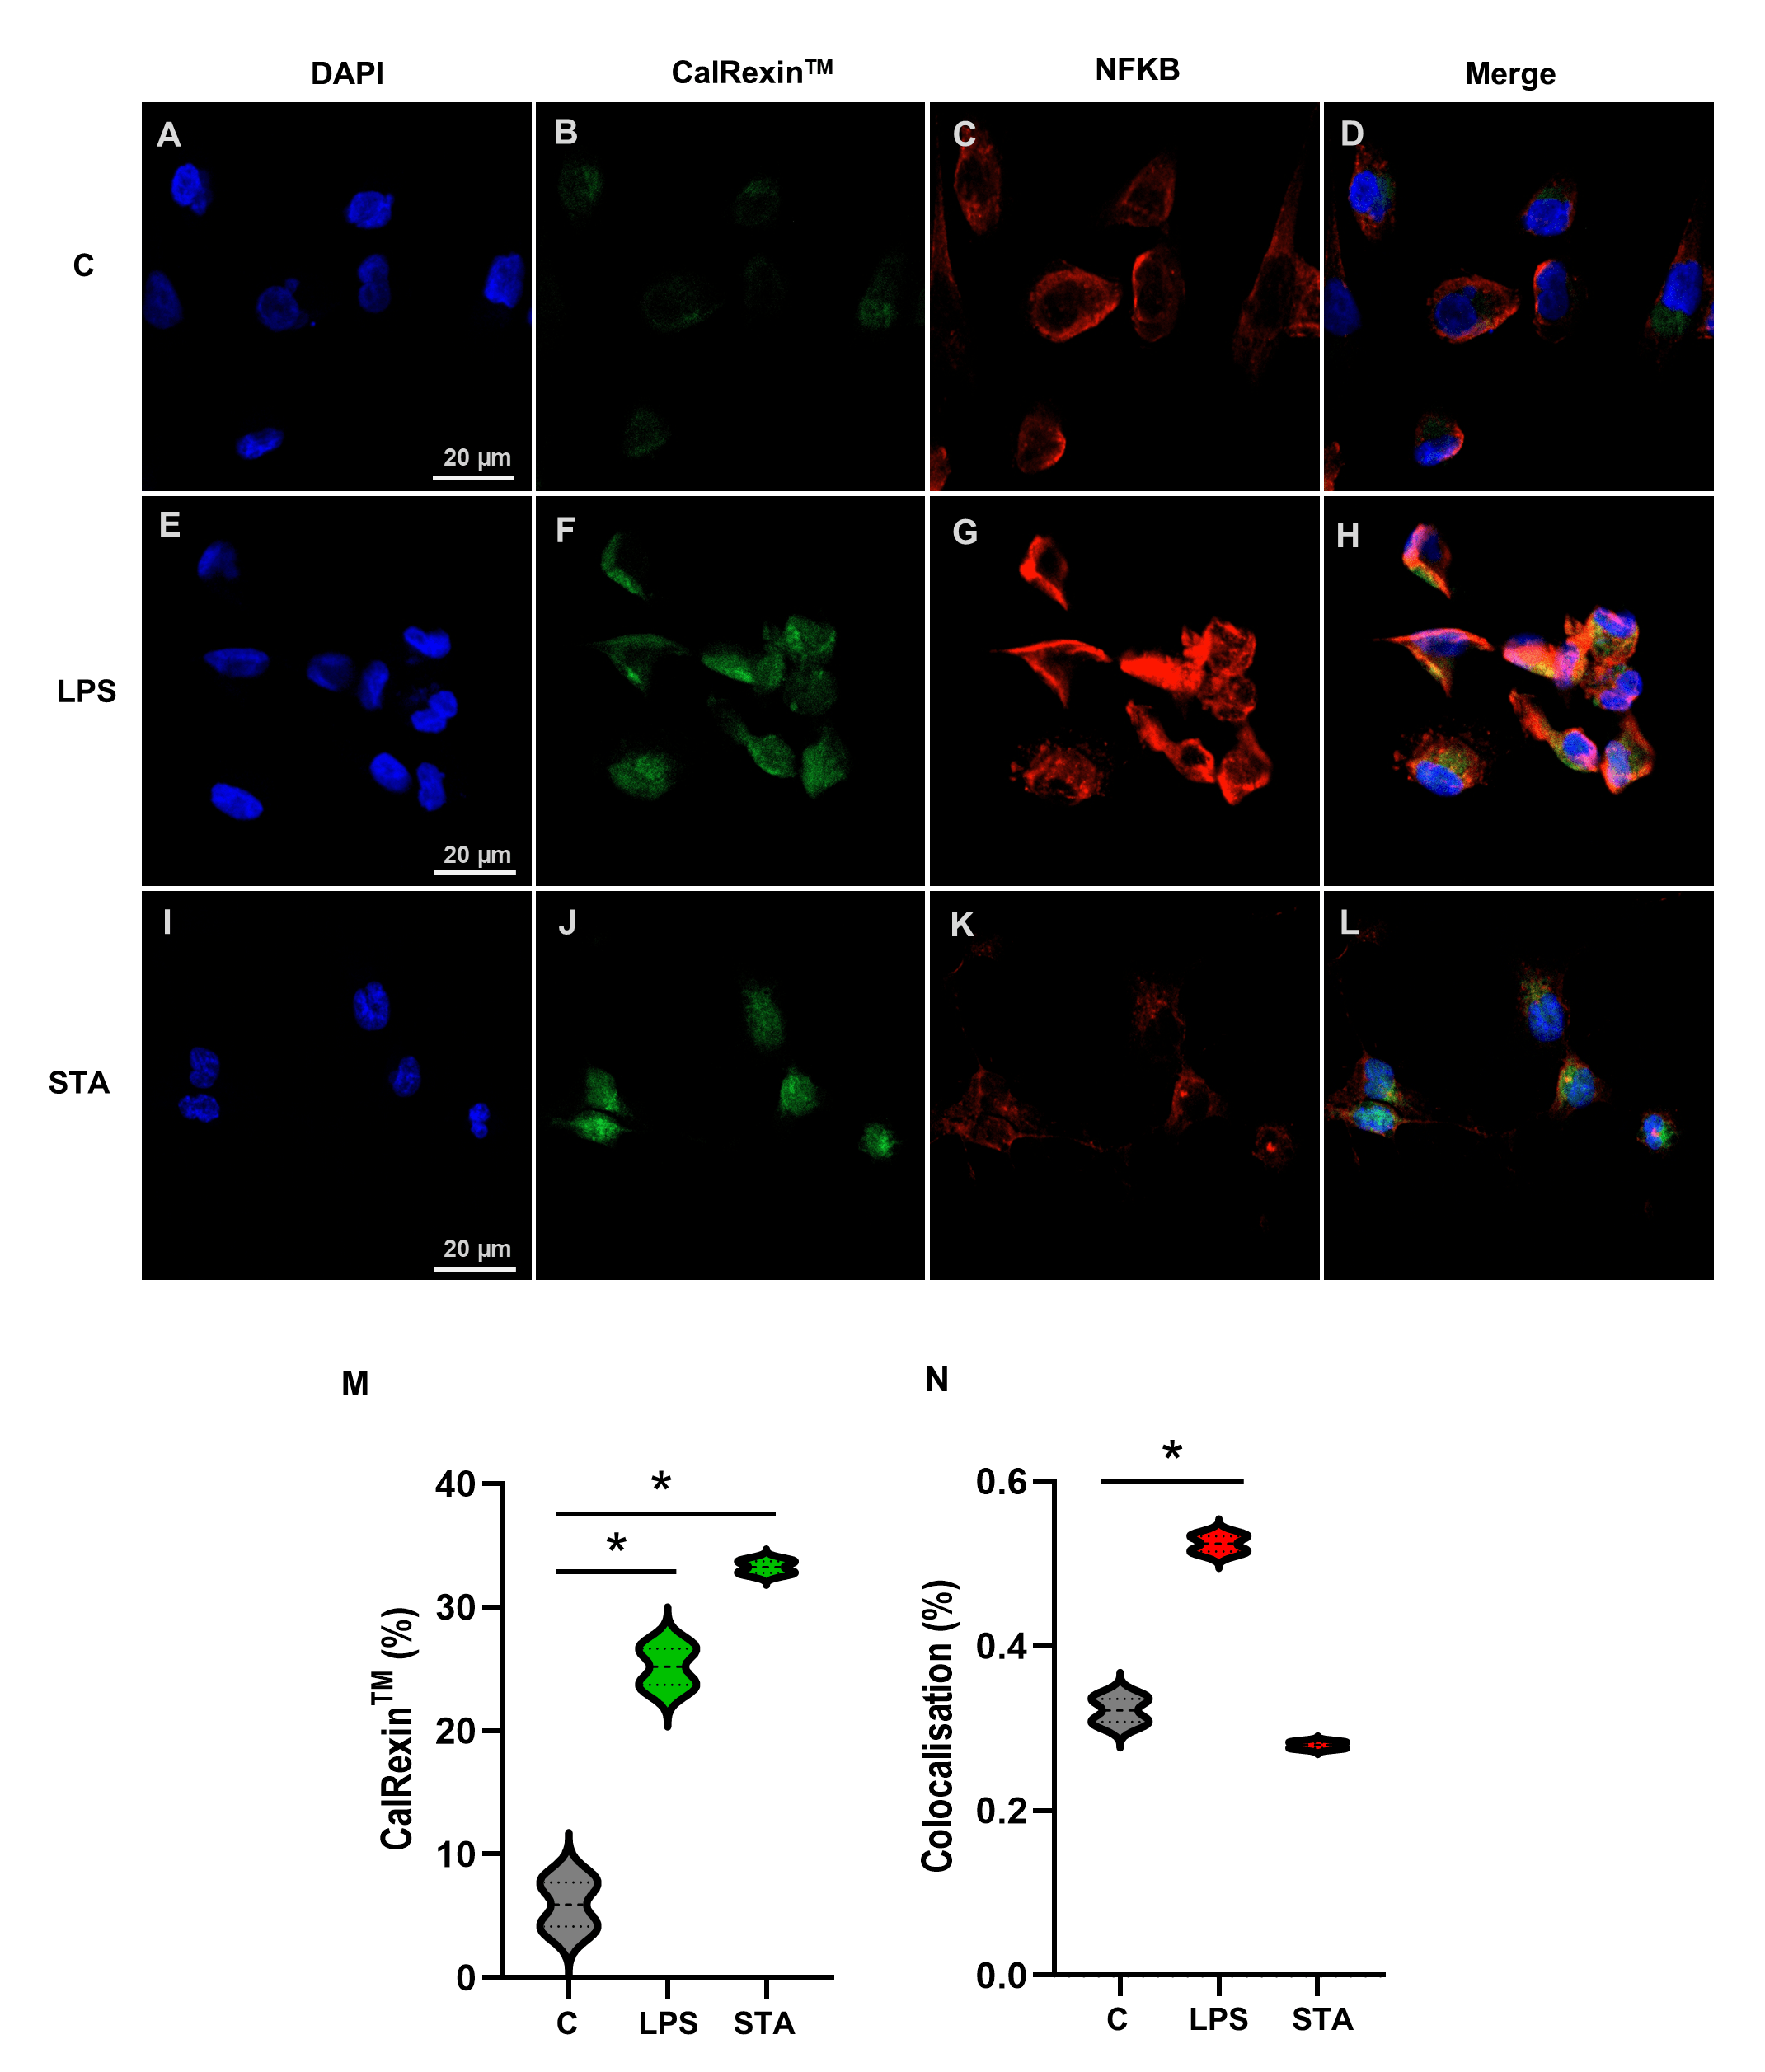 Fig. 7.
CalRexin𝐓𝐌 and NF-κB immunofluorescence staining of breast
cancer cells following LPS or staurosporine (STA) treatment. (A–D) MDA-MB-231
cells were untreated controls, (E–H) treated with 10 µg/mL LPS , or
(I–L) treated with 1 µM staurosporine (STA) for 4 h. Representative
images of DAPI in nuclei (A,E,I; blue), CalRexinTM (B,F,J; green) and
NF-κB-p65 (C,G,K; red), and the merged image of all three stains (D,H,L). (M)
Percentage of CalRexinTM positive cells and (N) colocalisation of DAPI
(nuclei) and NF-κB-p65. Images were acquired on an LSM 900 confocal microscope
using a 20
Triple-negative breast cancer is an aggressive breast cancer subtype, defined by the lack of expression of receptors that enable targeted therapy. This cancer subtype often develops resistance to apoptotic signals by down-regulating pro-apoptotic proteins and upregulating anti-apoptotic proteins to survive [33]. A key transcription factor involved in this is NF-κB, which interacts with mucin 1 to promote cell survival through upregulation of BCL2 leading to inhibition of apoptosis [8]. MDA-MB-231 and MDA-MB-468 are well-established models of triple negative breast cancer and here we describe a potential biomarker for NF-κB-activated stress response which is detectable on these cell lines in the absence of apoptosis.
In humans, the calcitonin receptor gene CALCR encodes three transcripts which arise from alternative mRNA splicing [34, 35]. Other isoforms may arise in cancer cells where alternative splicing in G-protein coupled receptors is common [36, 37, 38]. There are functional differences in calcitonin receptor isoforms [39] however our understanding of their physiological and pathological relevance is limited. Calcitonin receptor is consistently detected in both healthy mammary ductal epithelium and in breast cancer [23, 24], although which isoforms are expressed in these instances has not been reported and little is known about their function in breast tissue. CalRexinTM is a novel mouse monoclonal anti-human calcitonin receptor antibody which binds an extracellular epitope on live cells, is accumulated and provides new opportunities to explore the role of calcitonin receptor in triple negative breast cancer.
After treating breast cancer cells with LPS or the cytotoxin staurosporine, we characterised dose- and time-dependent CalRexinTM positivity. Increased CalRexinTM positivity following LPS treatment was observed by flow cytometry and immunofluorescence, while Annexin V was not increased and the cells remained viable. In contrast, treatment with staurosporine increased both CalRexinTM and Annexin V positivity and reduced cell viability, similar to results reported for other cell lines [16]. Increased accumulation of CalRexinTM antibody by breast cancer cells treated with LPS or a cytotoxin is indicative of increased calcitonin receptor activity that recycles to the cell surface. That this occurred whether or not the cells remained viable or underwent apoptosis suggests that CalRexinTM may be a marker of cell stress independent of cell fate. Activation of NF-κB has diverse consequences in cancer cells, and can induce senescence, initiate DNA repair, and regulate proliferation, inflammation, angiogenesis, and metastasis [5]. Here, we have used a model NF-κB activator, LPS, however many other factors can induce its activation including hypoxia, carcinogens, and DNA damage, and NF-κB is also constitutively active in some contexts such as cancer [5, 6]. Over 400 genes have been identified as targets for NF-κB [40]. CALCR has not been reported, however TLR5 activation, which leads to NF-κB activation, has been shown to increase expression of Calcr mRNA in mouse osteoclasts [41]. Our study shows that NF-κB activation is associated with increased CalRexinTM positivity in LPS-treated cells but whether this is a causal relationship is unclear. Further studies are required to determine whether CalRexinTM positivity is dependent on NF-κB activation and this could be explored using NF-κB inhibitors [42].
Cell surface expression of calcitonin receptor is known to be regulated by a process of recycling [32, 43]. In the absence of ligand binding, calcitonin receptor can undergo tonic endocytosis, maintaining a pool of intracellular receptors and regulating cell surface expression, a process requiring actin-binding filamin [44]. The mechanism inducing increased CalRexinTM positivity remains unclear. However, we propose a model wherein cellular stress triggers calcitonin interaction with calcitonin receptor to induce a temporary state of quiescence while the cell undergoes fate decisions that determine survival or apoptosis [45]. CalRexinTM positivity may therefore be a marker of breast cancer cell stress, and that cells with increased CalRexinTM accumulation may undergo apoptosis or maintain survival depending on the nature of the stressor. Further research is required to explore other stress pathways and other breast cancer cell lines and non-neoplastic cell lines that may show CalRexinTM positivity.
This research provides new possibilities for the translational potential of calcitonin receptor in breast cancer detection and treatment. Calcitonin inhibits cell growth in T47D breast cancer cells [46, 47] and reduces invasiveness in MDA-MB-231 cancer cells [20], suggesting that calcitonin or a ligand such as CalRexinTM could be used in breast cancer treatment. In hepatocellular carcinoma, higher expression of CALCR is associated with poorer overall survival, where blocking CALCR was demonstrated to promote apoptosis while inhibiting cell proliferation and migration [48]. Cancer cells may progressively become more resistant to calcitonin receptor-mediated growth inhibition, as lymph node metastasis and lymphatic invasion is associated with reduced expression of CALCR mRNA in primary breast cancers [23], suggesting CalRexinTM may be investigated as a prognostic biomarker. Furthermore, calcitonin receptor is co-expressed with heat shock protein (Hsp70) in extracellular vesicles extracted from patients with glioblastoma, suggesting a potential role for CalRexinTM in liquid biopsies for cancer detection [49]. However, further investigation is required to explore these possibilities, and it’s important to consider that calcitonin receptor has multiple isoforms with different functions and binds to other ligands in addition to calcitonin [50].
Study findings are limited to the two triple negative breast cancer cell lines used to generate these results, and it is not known if calcitonin receptor positivity is a biomarker for NF-κB activation in other breast cancer cell lines or primary breast cancer cells. Furthermore, the findings are limited to in vitro culture studies and it is not known whether this reflects calcitonin receptor positivity in breast cancer in vivo. These results indicate calcitonin receptor positivity is increased when breast cancer cells are treated with an agonist that induces NF-κB activation, but it is not clear whether calcitonin receptor positivity is dependent on NF-κB activation.
CalRexinTM is a potential biomarker associated with cell stress in the two triple negative breast cancer cell lines which were investigated. We observed increased CalRexinTM positivity was induced by a cytotoxic agent and also by LPS treatment that induced NF-κB activation. However, while the cytotoxin induced Annexin V as well as CalRexinTM positivity, LPS induced only CalRexinTM, and the cells remained viable. This suggests CalRexinTM positivity is a potential biomarker for cellular stress independent of whether the cell subsequently undergoes apoptosis. Further research is required to explore the significance of calcitonin receptor in regulating biological responses to cellular stress in breast cancer.
The data and material supporting the findings of the current study are available from the corresponding author upon reasonable request.
HH, PW, ES and WI designed the research study. RM and HH performed the research. HH analysed the data. HH wrote the first draft of the manuscript and all authors contributed to editorial changes in the manuscript. All authors read and approved the final manuscript. All authors have participated sufficiently in the work to take public responsibility for appropriate portions of the content and agreed to be accountable for all aspects of the work in ensuring that questions related to its accuracy or integrity.
Not applicable.
We are grateful to Apop for providing the CalRexinTM:488 and CalRexinTM:647 antibodies used in this study.
This research was funded by National Health and Medical Research Council of Australia (APP2011845). HH was supported by an Australian Government Research Training Program (RTP) Scholarship. HH and RM are supported by supplementary scholarships from The Hospital Research Foundation Group.
PW is founder, shareholder, CSO, and an executive director of Apop Biosciences Pty Ltd. All other authors declare no conflicts of interest. The authors confirm that their judgments in data interpretation and manuscript writing were not influenced by any external relationships.
References
Publisher’s Note: IMR Press stays neutral with regard to jurisdictional claims in published maps and institutional affiliations.