


 , Xue Deng 1, Qian-wen Zhu 1,2, Jing Zhang 1, Zhi-wei Qian 1, Fang Gao 1, Shu-qin Zhan 1, Chao Wu 1, Lin Wang 1, Shu Li 1, Ze-bo Hu 1,*
1 Department of Pathophysiology, School of Basic Medical Sciences, Wannan Medical University, 241002 Wuhu, Anhui, China
2 Department of Clinical Laboratory, Meixian People’s Hospital, 722300 Baoji, Shaanxi , China
Abstract
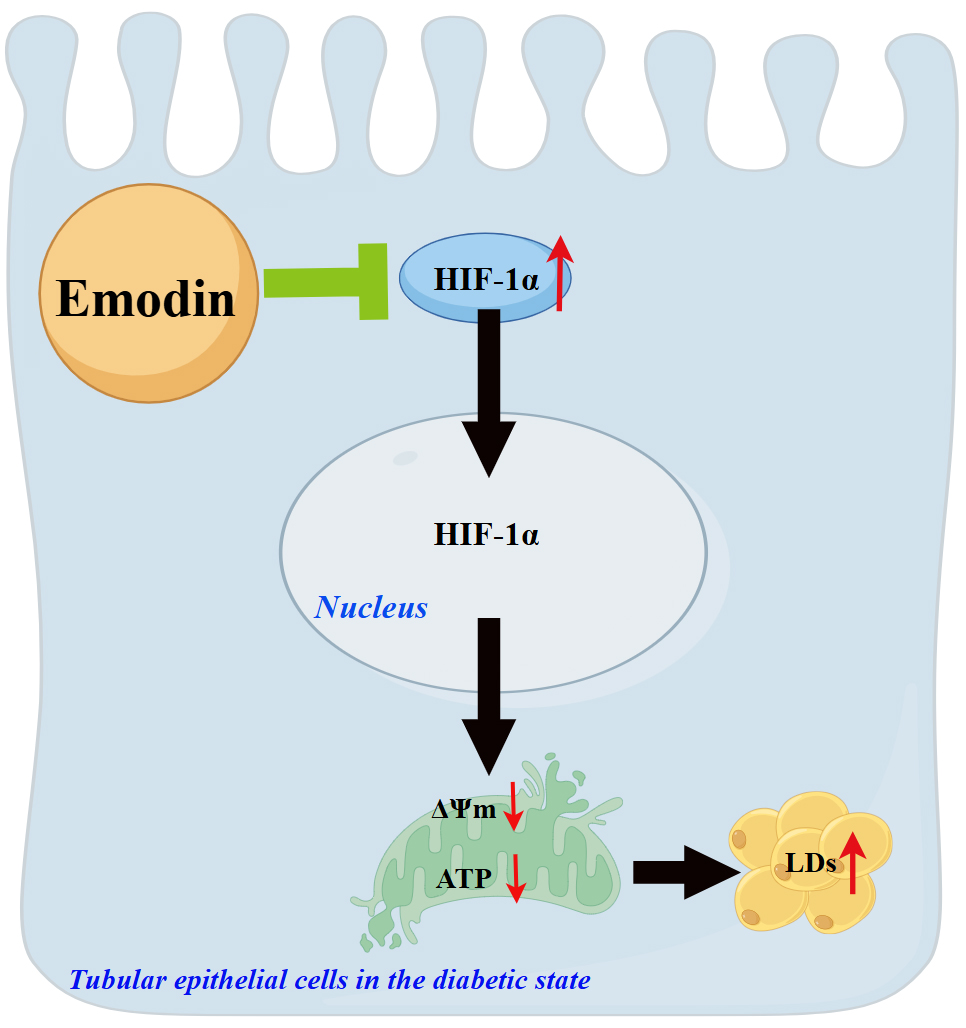
Our previous study verified that lipid nephrotoxicity mediated by hypoxia-inducible factor-1 alpha (HIF-1α) activation aggravates diabetic tubular injury. This study investigated whether emodin, an inhibitor of HIF-1α, improves tubular injury by reducing lipid accumulation in diabetic tubules, and examined its underlying mechanism.
Type 1 diabetic rats were administered 40 mg/kg emodin by gavage daily. For the in vitro study, HK-2 cells were pretreated with emodin for 6 h and then stimulated with HIF-1α activator cobalt chloride (CoCl2).
In vivo, emodin significantly downregulated HIF-1α protein expression in the kidneys of rats with diabetes. Emodin treatment substantially attenuated tubular pathological damage and reduced 24-h urinary total protein levels and the urinary albumin-to-creatinine ratio in rats with diabetes, accompanied by decreased expression of transforming growth factor-beta 1 (TGF-β1) and connective tissue growth factor (CTGF). Meanwhile, lipid accumulation and mitochondrial dysfunction in diabetic kidneys markedly improved after emodin treatment. Similarly, in vitro, emodin effectively reduced HIF-1α protein expression in CoCl2-treated HK-2 cells. Moreover, emodin ameliorated lipid accumulation, cellular injury, and mitochondrial homeostasis imbalance in these cells.
These data demonstrate that emodin prevents lipid accumulation and cellular injury in diabetic tubular epithelial cells, possibly by inhibiting HIF-1α activation and exerting a protective effect on mitochondria.
Graphical Abstract
Keywords
- emodin
- diabetic nephropathy
- hypoxia-inducible factor-1 alpha
- lipid droplets
- kidney tubules
As a chronic microvascular complication arising from diabetes, diabetic nephropathy (DN) ranks among the most severe manifestations of the disease and now stands as the predominant cause of end-stage renal disease on a global scale [1]. In recent years, because the progress of renal insufficiency is closely linked with tubular atrophy and interstitial fibrosis, more and more attention has been paid the impact of tubular lesions on DN [2]. Despite ongoing efforts to develop novel therapies targeting renal interstitial fibrosis in clinical studies, the side effects of these drugs emphasize the necessity to further explore the underlying mechanisms of diabetic tubulopathy.
Toxic lipid intermediates accumulate in nonadipose tissues (kidney, liver, heart, pancreas, and skeletal muscle), leading to lipotoxicity. It commonly causes cellular dysfunction and even death [3]. Kimmelstiel and colleagues first reported the lipid accumulation in the proximal tubules of diabetic kidneys [4], which contributed to DN progression in type 1 and 2 diabetic models [5, 6]. The deposition of toxic lipid intermediates in proximal tubules expedited cellular apoptosis, contributing to tubular atrophy in the progression of chronic kidney disease [7]. Various mechanisms referring to increased de novo lipogenesis, lipid uptake, synthesis, and decreased fatty acid oxidation caused lipid accumulation in tubules [8].
Our previous study indicated that hypoxia-inducible factor-1 alpha
(HIF-1
Several previous studies suggested a renoprotective effect of emodin treatment in DN animal models [16]. Emodin prevented podocyte injury in DN by restraining apoptosis and increasing the autophagy of podocytes [17]. Moreover, Ji et al. [18] elucidated that emodin protected against DN by inhibiting ferroptosis via restoring nuclear factor E2-related factor 2 expression. Herein, we examined the regulatory role of emodin in lipid metabolism of diabetic renal tubular epithelial cells (RTECs) and pursued an in-depth analysis of its operative mechanisms.
Male Sprague–Dawley rats (150
The human proximal tubular cell line HK-2, purchased from Wuhan Pricella Biotechnology Co., Ltd., was cultured as described [22]. The cell line was verified by STR profiling and tested negative for mycoplasma. Cells were randomly allocated into three groups: control, cobalt chloride (CoCl2, 100 µmol/L), and CoCl2+ emodin (100 µmol/L CoCl2 and 20 µmol/L emodin) groups. Upon reaching 40–50% cellular confluence, cultures underwent 24 h of serum starvation to achieve cell cycle synchronization, followed by 6 h incubation with either emodin or vehicle (dimethyl sulfoxide, DMSO), and then stimulated with or without CoCl2 (C8661, Sigma–Aldrich) for another 24 h.
Blood biochemical indicators, including blood glucose levels and lipid profiles, and urinary creatinine levels were determined using automatic analyzers (Rayto, Shenzhen, China). Urinary protein concentrations were quantified via commercial colorimetric assay (E-BC-K252-M, Elabscience, Wuhan, Hubei, China) and then multiplied by 24-h total urine volume to calculate the total protein content in 24-h urine. For albumin detection, a sandwich ELISA protocol was employed according to the manufacturer’s specifications. (E-EL-R0025c, Elabscience).
Following the procedures outlined in prior studies [23], specimens were processed for PAS staining and ultrastructural evaluation via electron microscopy. In PAS staining, five fields in each rat were randomly selected, and tubulointerstitial damage was quantified using Image-Pro Plus software 6.0 (Media Cybernetics, Rockville, MD, USA).
The lipid deposition in kidney tissue and HK-2 cells was determined using triglyceride (TG) quantitative assays and Oil Red O staining as previously described [9, 23].
Immunohistochemical staining of kidney tissue and immunofluorescence staining of
HK-2 cells were performed by applying previously described methods [23]. Primary
antibodies of transforming growth factor-beta 1 (TGF-
Total cellular RNA was extracted from HK-2 cells utilizing TRIzol reagent (9109, TaKaRa, Shiga, Japan) for subsequent RT-qPCR analysis. Then reverse transcripted to cDNA with a commercially available kit (R323-01, Vazyme, Nanjing, Jiangsu, China). Next, Quantitative amplification of target transcripts was subsequently performed on a Bio-Rad thermocycler with gene-specific primers and SYBR green PCR Master Mix (Q711-02, Vazyme). Relative mRNA expression was determined through the comparative 2-ΔΔCT approach. Primer sequences utilized for human gene detection are listed in Table 1.
| Gene | Primers sequences (5′-3′) |
| Drp1 | TCACCCGGAGACCTCTCATTC-sense |
| GGTTCAGGGCTTACTCCCTTAT-antisense | |
| Mfn2 | CTCTCGATGCAACTCTATCGTC-sense |
| TCCTGTACGTGTCTTCAAGGA-antisense | |
| OPA1 | TGTGAGGTCTGCCAGTCTTTA-sense |
| TGTCCTTAATTGGGGTCGTTG-antisense | |
| GAPDH | CTGCACCACCAACTGCTTAG-sense |
| AGGTCCACCACTGACACGTT-antisense |
We conducted Western blot experiments following protocols outlined in our
earlier publication [22]. Incubation with primary antibodies targeted
HIF-1
Cell survival rates were evaluated through CCK-8 colorimetric assay (BS350B, Biosharp, Hefei, Anhui, China) following standard procedures. In brief, cells were seeded at roughly 2000 cells per well in 96-well plates and allowed to grow for 24 h prior to analysis. After synchronized, the cells were treated with emodin (0, 5, 10, 20, 40, 60, 80, and 100 µM) dissolved in DMSO for 6 h. Then, the supernatant containing emodin or DMSO was discarded, followed by adding 10 µL of CCK-8 reagent into each well for 2 h. Finally, optical density readings were then acquired using a multi-mode microplate reader (Thermo Fisher Scientific, Waltham, MA, USA).
The adenosine triphosphate (ATP) content in kidney tissues was evaluated using a commercial kit (E-BC-K157-M, Elabscience).
Total DNA isolation from renal tissues and HK-2 cells was accomplished utilizing a commercial extraction kit (DP304, Tiangen, Beijing, China). Then, the gene NADH dehydrogenase subunit-2 (ND2) of mitochondrial DNA (mtDNA) was amplified using the real-time quantitative PCR method previously described. The sequences of rat and human primers are shown in Table 2.
| Gene | Species | Primers sequences (5′-3′) |
| ND2 | Homo sapiens | ACTGCGCTAAGCTCGCACTGATTT-sense |
| GATTATGGATGCGGTTGCTTGCGT-antisense | ||
| ND2 | Rattus norvegicus | AGTTGGGAGGAAAGCGGTAG-sense |
| CCCTCACCATATTCCCAACCA-antisense | ||
| Homo sapiens | AAAGACCTGTACGCCAACAC-sense | |
| GTCATACTCCTGCTTGCTGAT-antisense | ||
| Rattus norvegicus | TTTCCAGCCTTCCTTGGGTATG-sense | |
| CACTGTGTTGGCATAGAGGTCTTTAC-antisense |
Mitochondrial transmembrane potential was evaluated through
5,5′,6,6′-Tetrachloro-1,1′,3,3′-tetraethylbenzimidazolylcarbocyanine iodide
(JC-1) staining methodology (E-CK-A301, Elabscience). Briefly, adherent cells
from six-well plates were detached, pelleted, and suspended in loading buffer
before exposure to JC-1 dye for 20 minutes at 37 °C. After dual washing
steps, samples were re-suspended in chilled 1
Statistical analyses were conducted with GraphPad Prism 8.0 (GraphPad Software,
San Diego, CA, USA) or SPSS 22.0 (IBM Corporation, Armonk, NY, USA). Data are
presented as mean
Emodin treatment significantly decreased the ratio of kidney weight to body
weight, the 24-h urinary total protein levels, and the ratio of urinary albumin
to creatinine in rats with diabetes (Fig. 1A–C), but did not affect blood urea
nitrogen levels (Fig. 1D). Meanwhile, the body weights, and serum glucose levels
in diabetic rats were not significantly changed by emodin treatment (Fig. 1E,F),
suggesting that emodin did not improve kidney damage by affecting blood glucose
level. PAS staining showed that emodin treatment rescued the pathological injury
of renal tubules in diabetic rats (Fig. 1G,H), characterized by reduced glycogen
deposition, attenuated luminal dilation, and less extensive epithelial cell
detachment and necrosis. Consistently, the protein expression levels of
TGF-
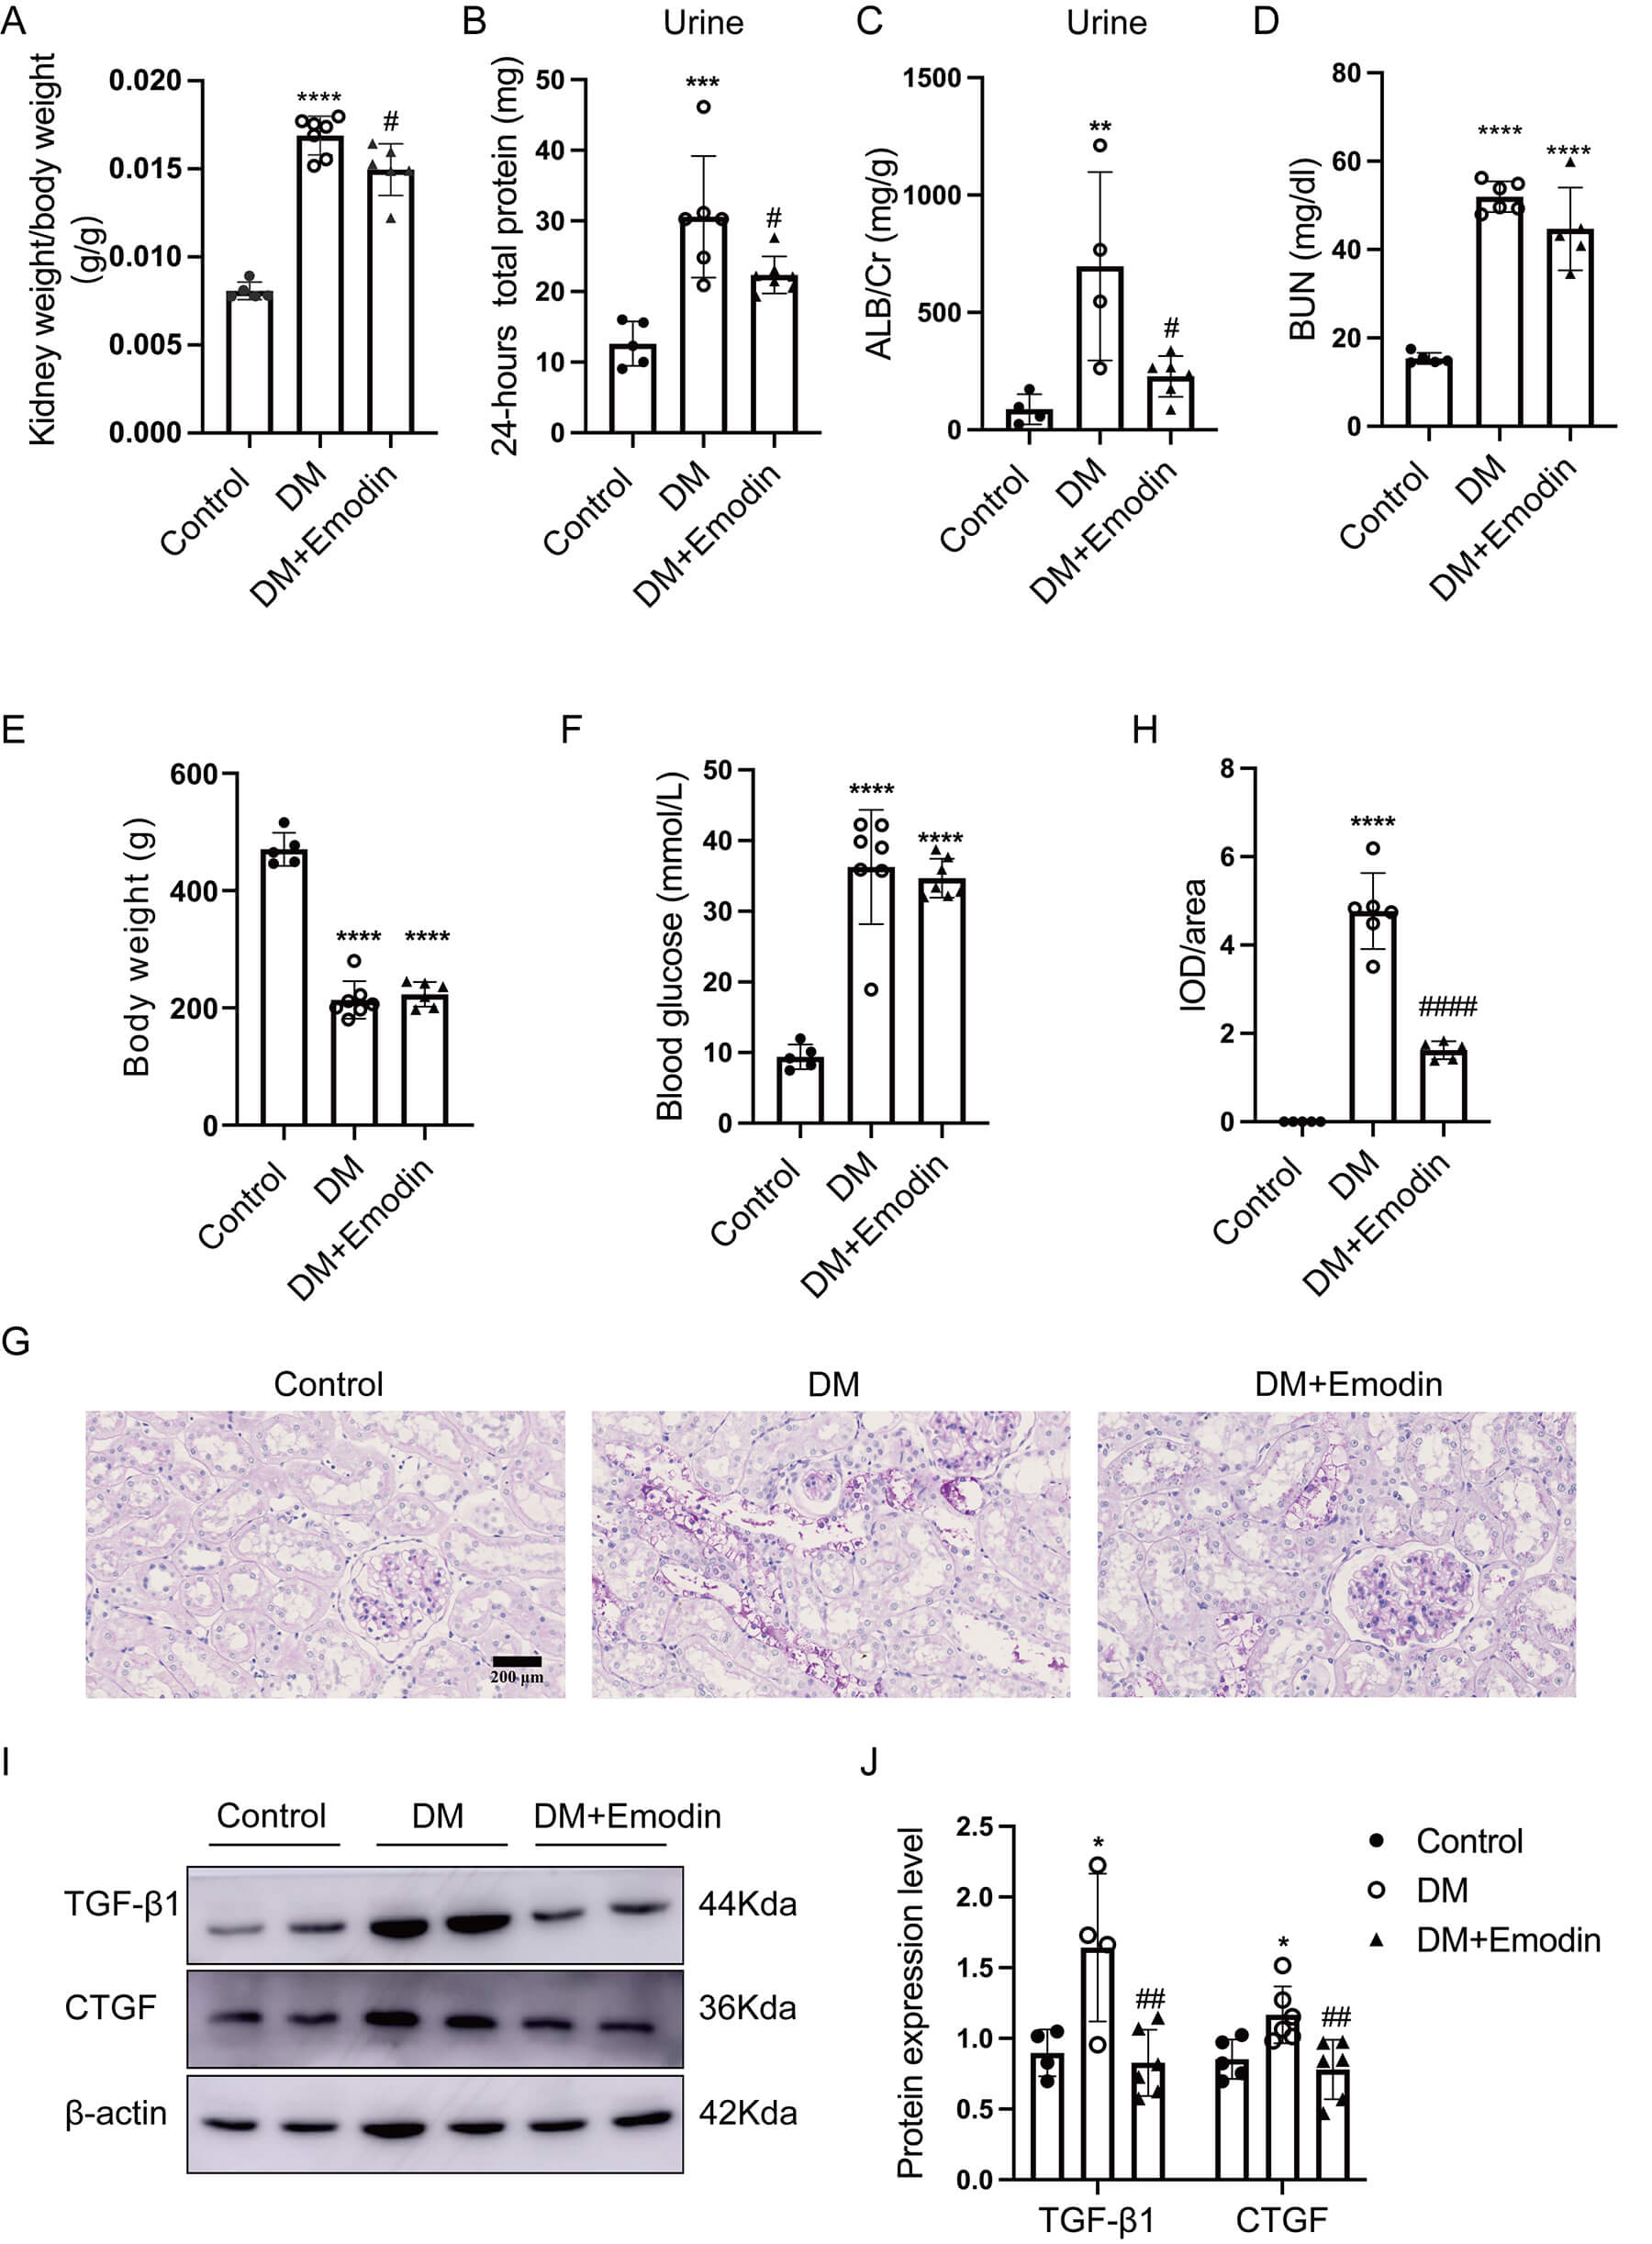 Fig. 1.
Emodin alleviated tubular damage in diabetic kidneys. (A) Ratio
of kidney weight to body weight (n = 5–7), (B) 24-h total protein
levels in urine (n = 5–7), (C) urinary albumin-to-creatinine ratio
(n = 4–6), (D) blood urea nitrogen levels (n = 5–6), (E) body
weights (n = 5–7), (F) blood glucose levels (n = 5–7) were
measured. (G,H) PAS staining (original magnification 400
Hou and colleagues showed that emodin inhibited HIF-1
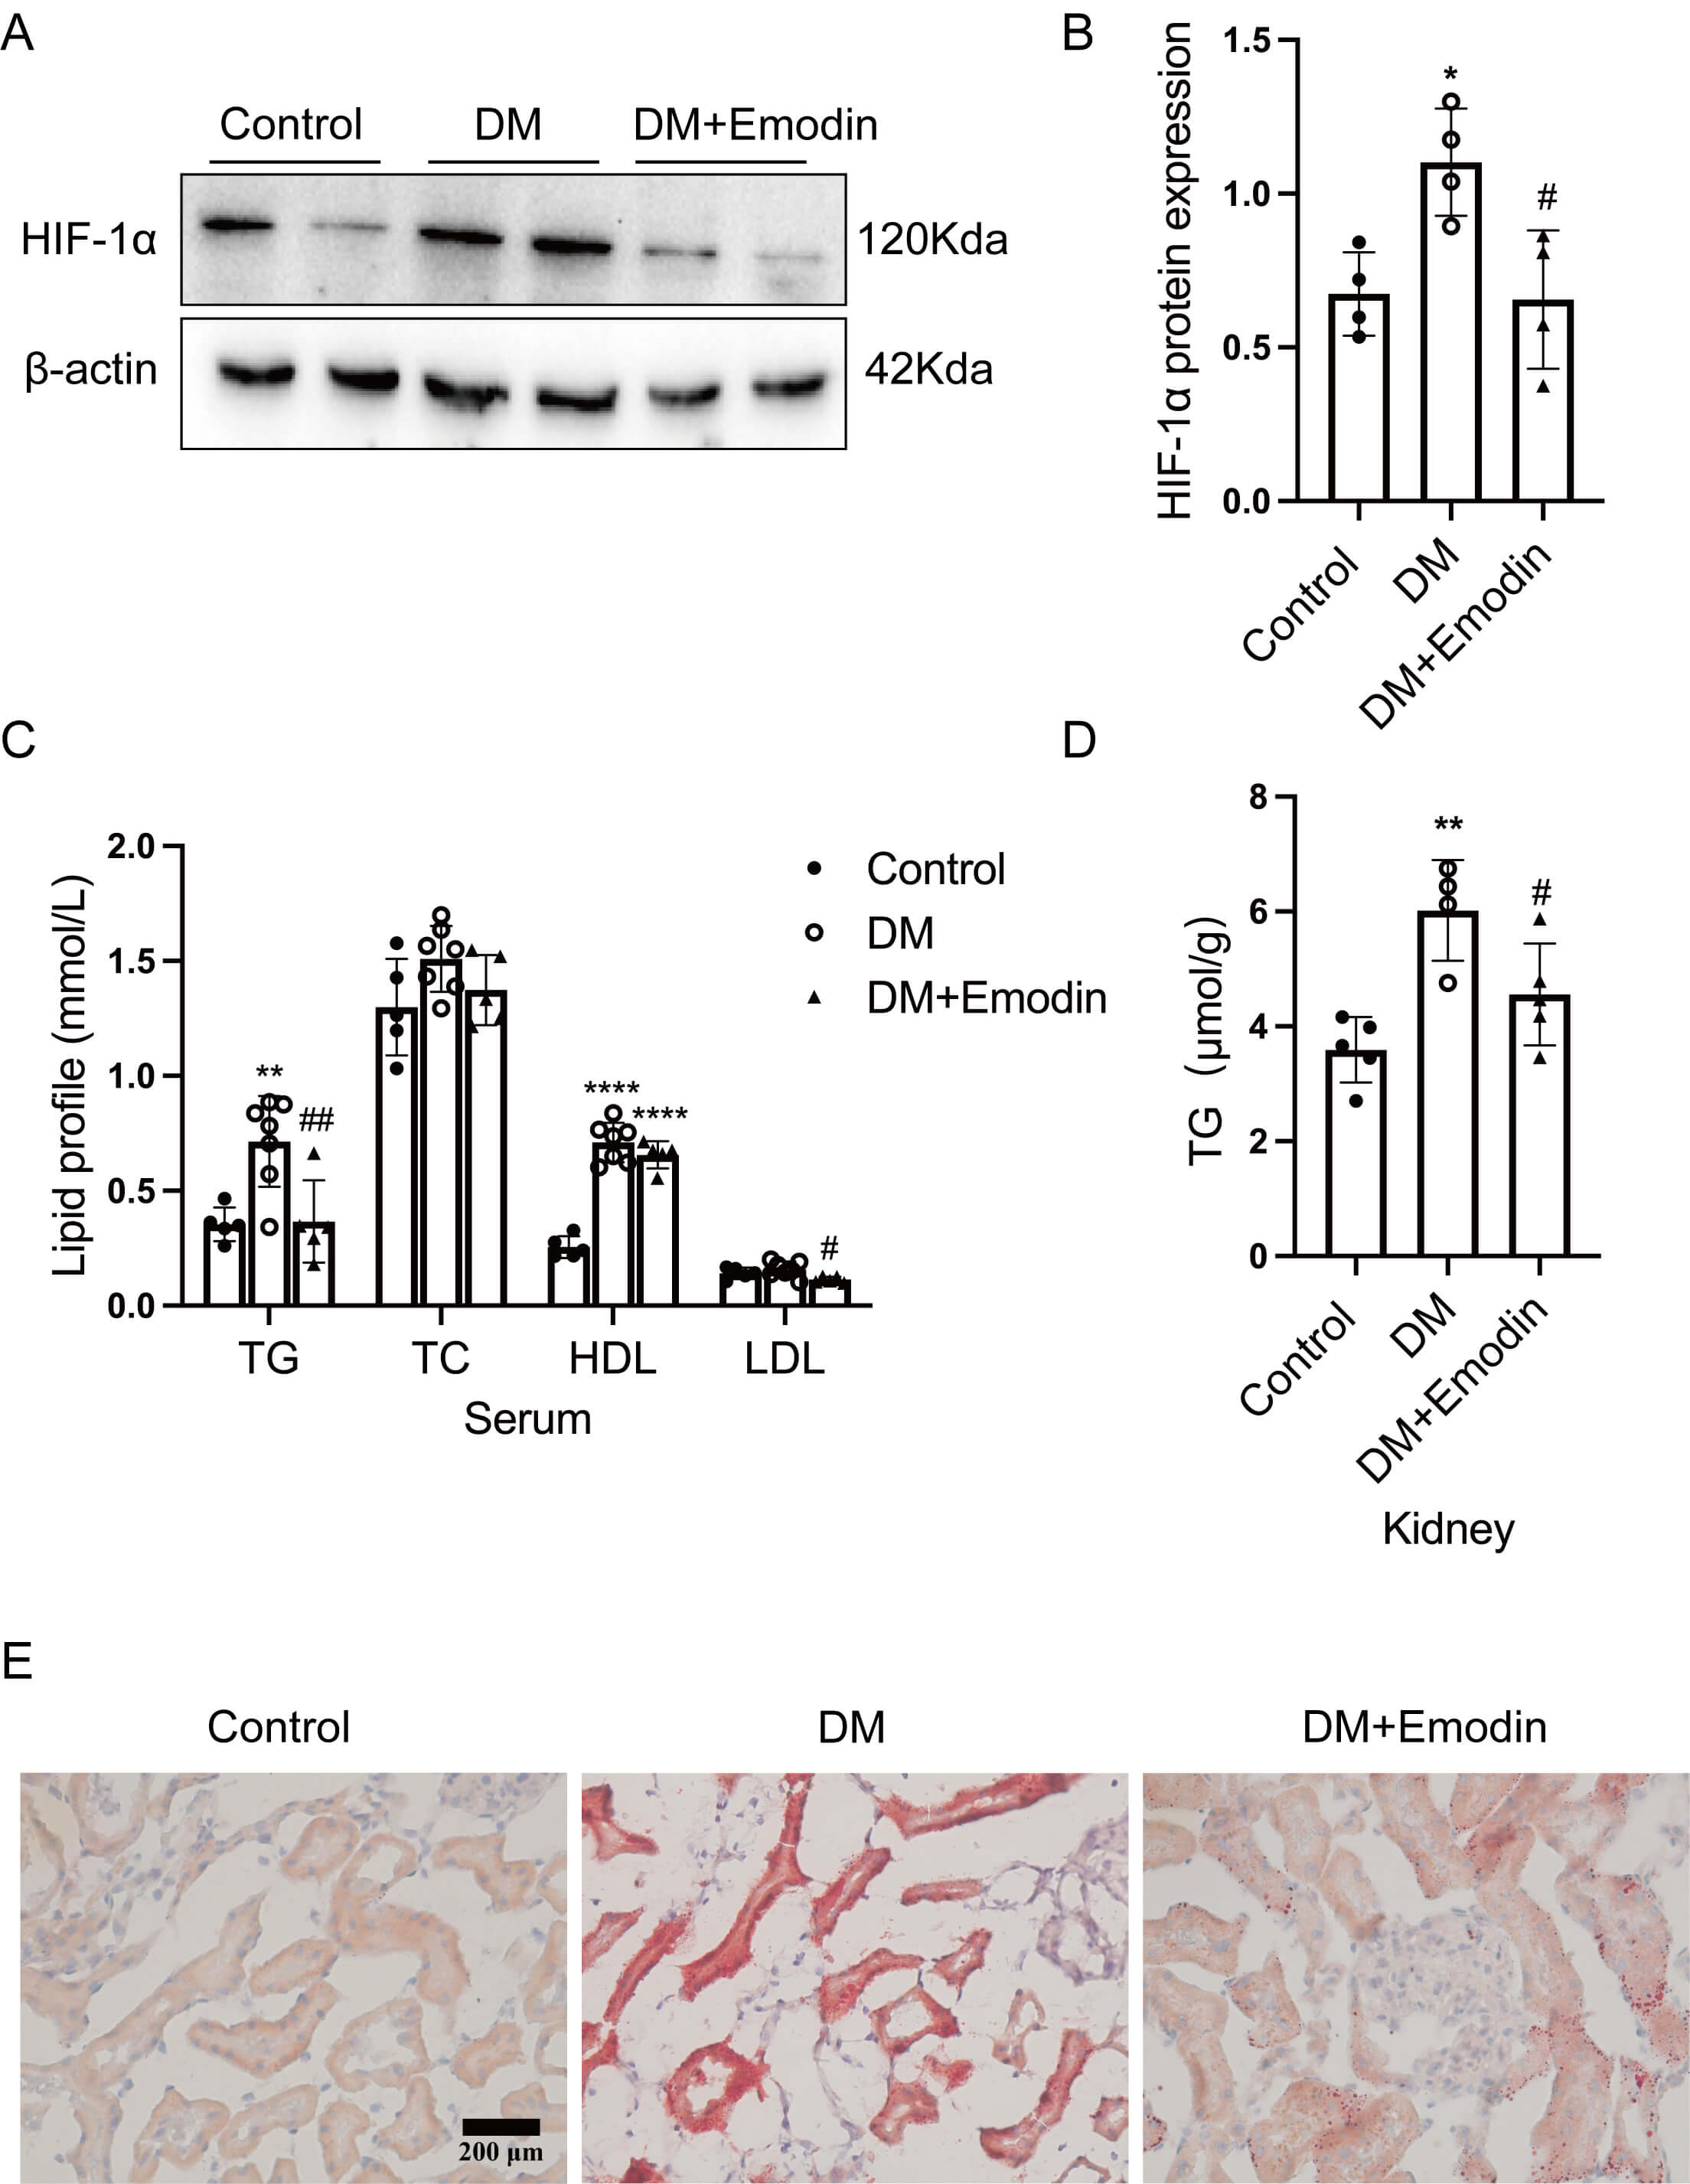 Fig. 2.
Emodin decreased lipid deposition in the kidneys of rats with
diabetes by inhibiting HIF-1
It was revealed that the mitochondrial damage mediated by HIF-1
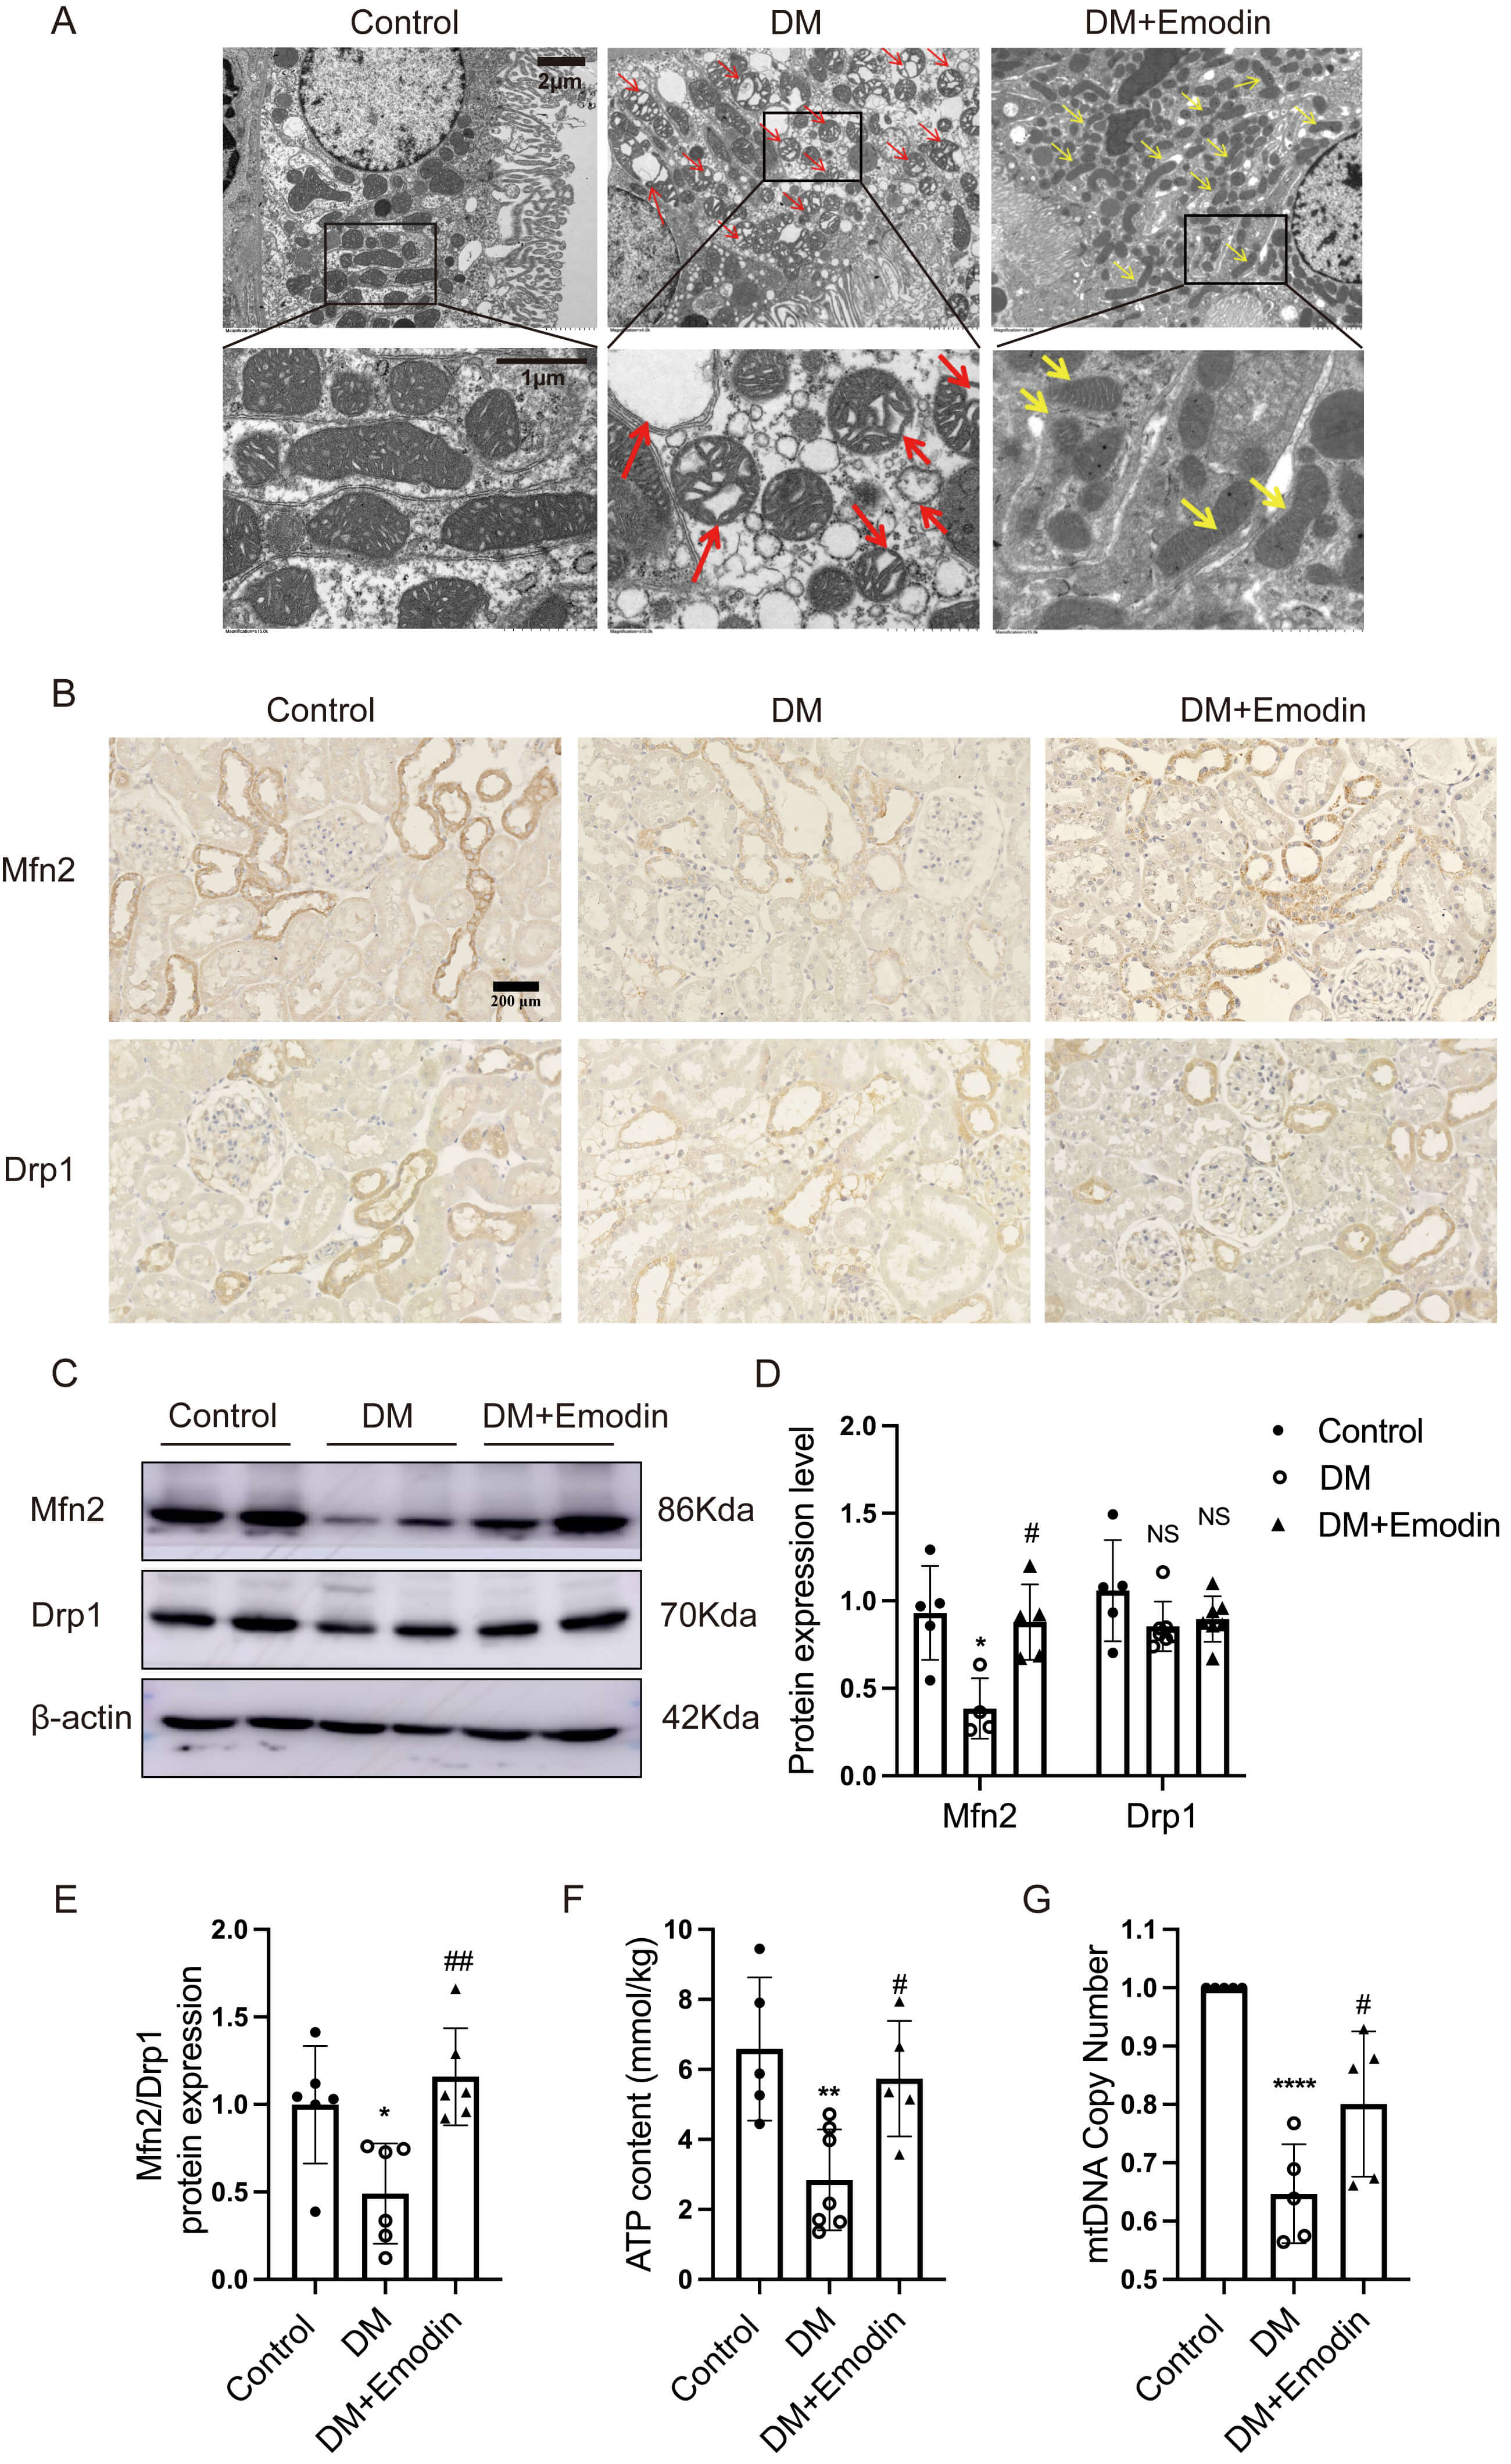 Fig. 3.
Emodin improved mitochondrial damage in the tubules of diabetic
kidneys. (A) Representative transmission electron microscopy image of tubular
epithelial cells in rats. The red arrows indicate damaged mitochondria and their
cristae, whereas the yellow arrows indicate improved mitochondria and their
cristae (4000
Based on CCK-8 assay results, emodin at a concentration of 20 µM was
selected as the optimal intervention concentration for HK-2 cells (Fig. 4A).
Western blot and immunofluorescence staining revealed that CoCl2 stimulation
markedly increased HIF-1
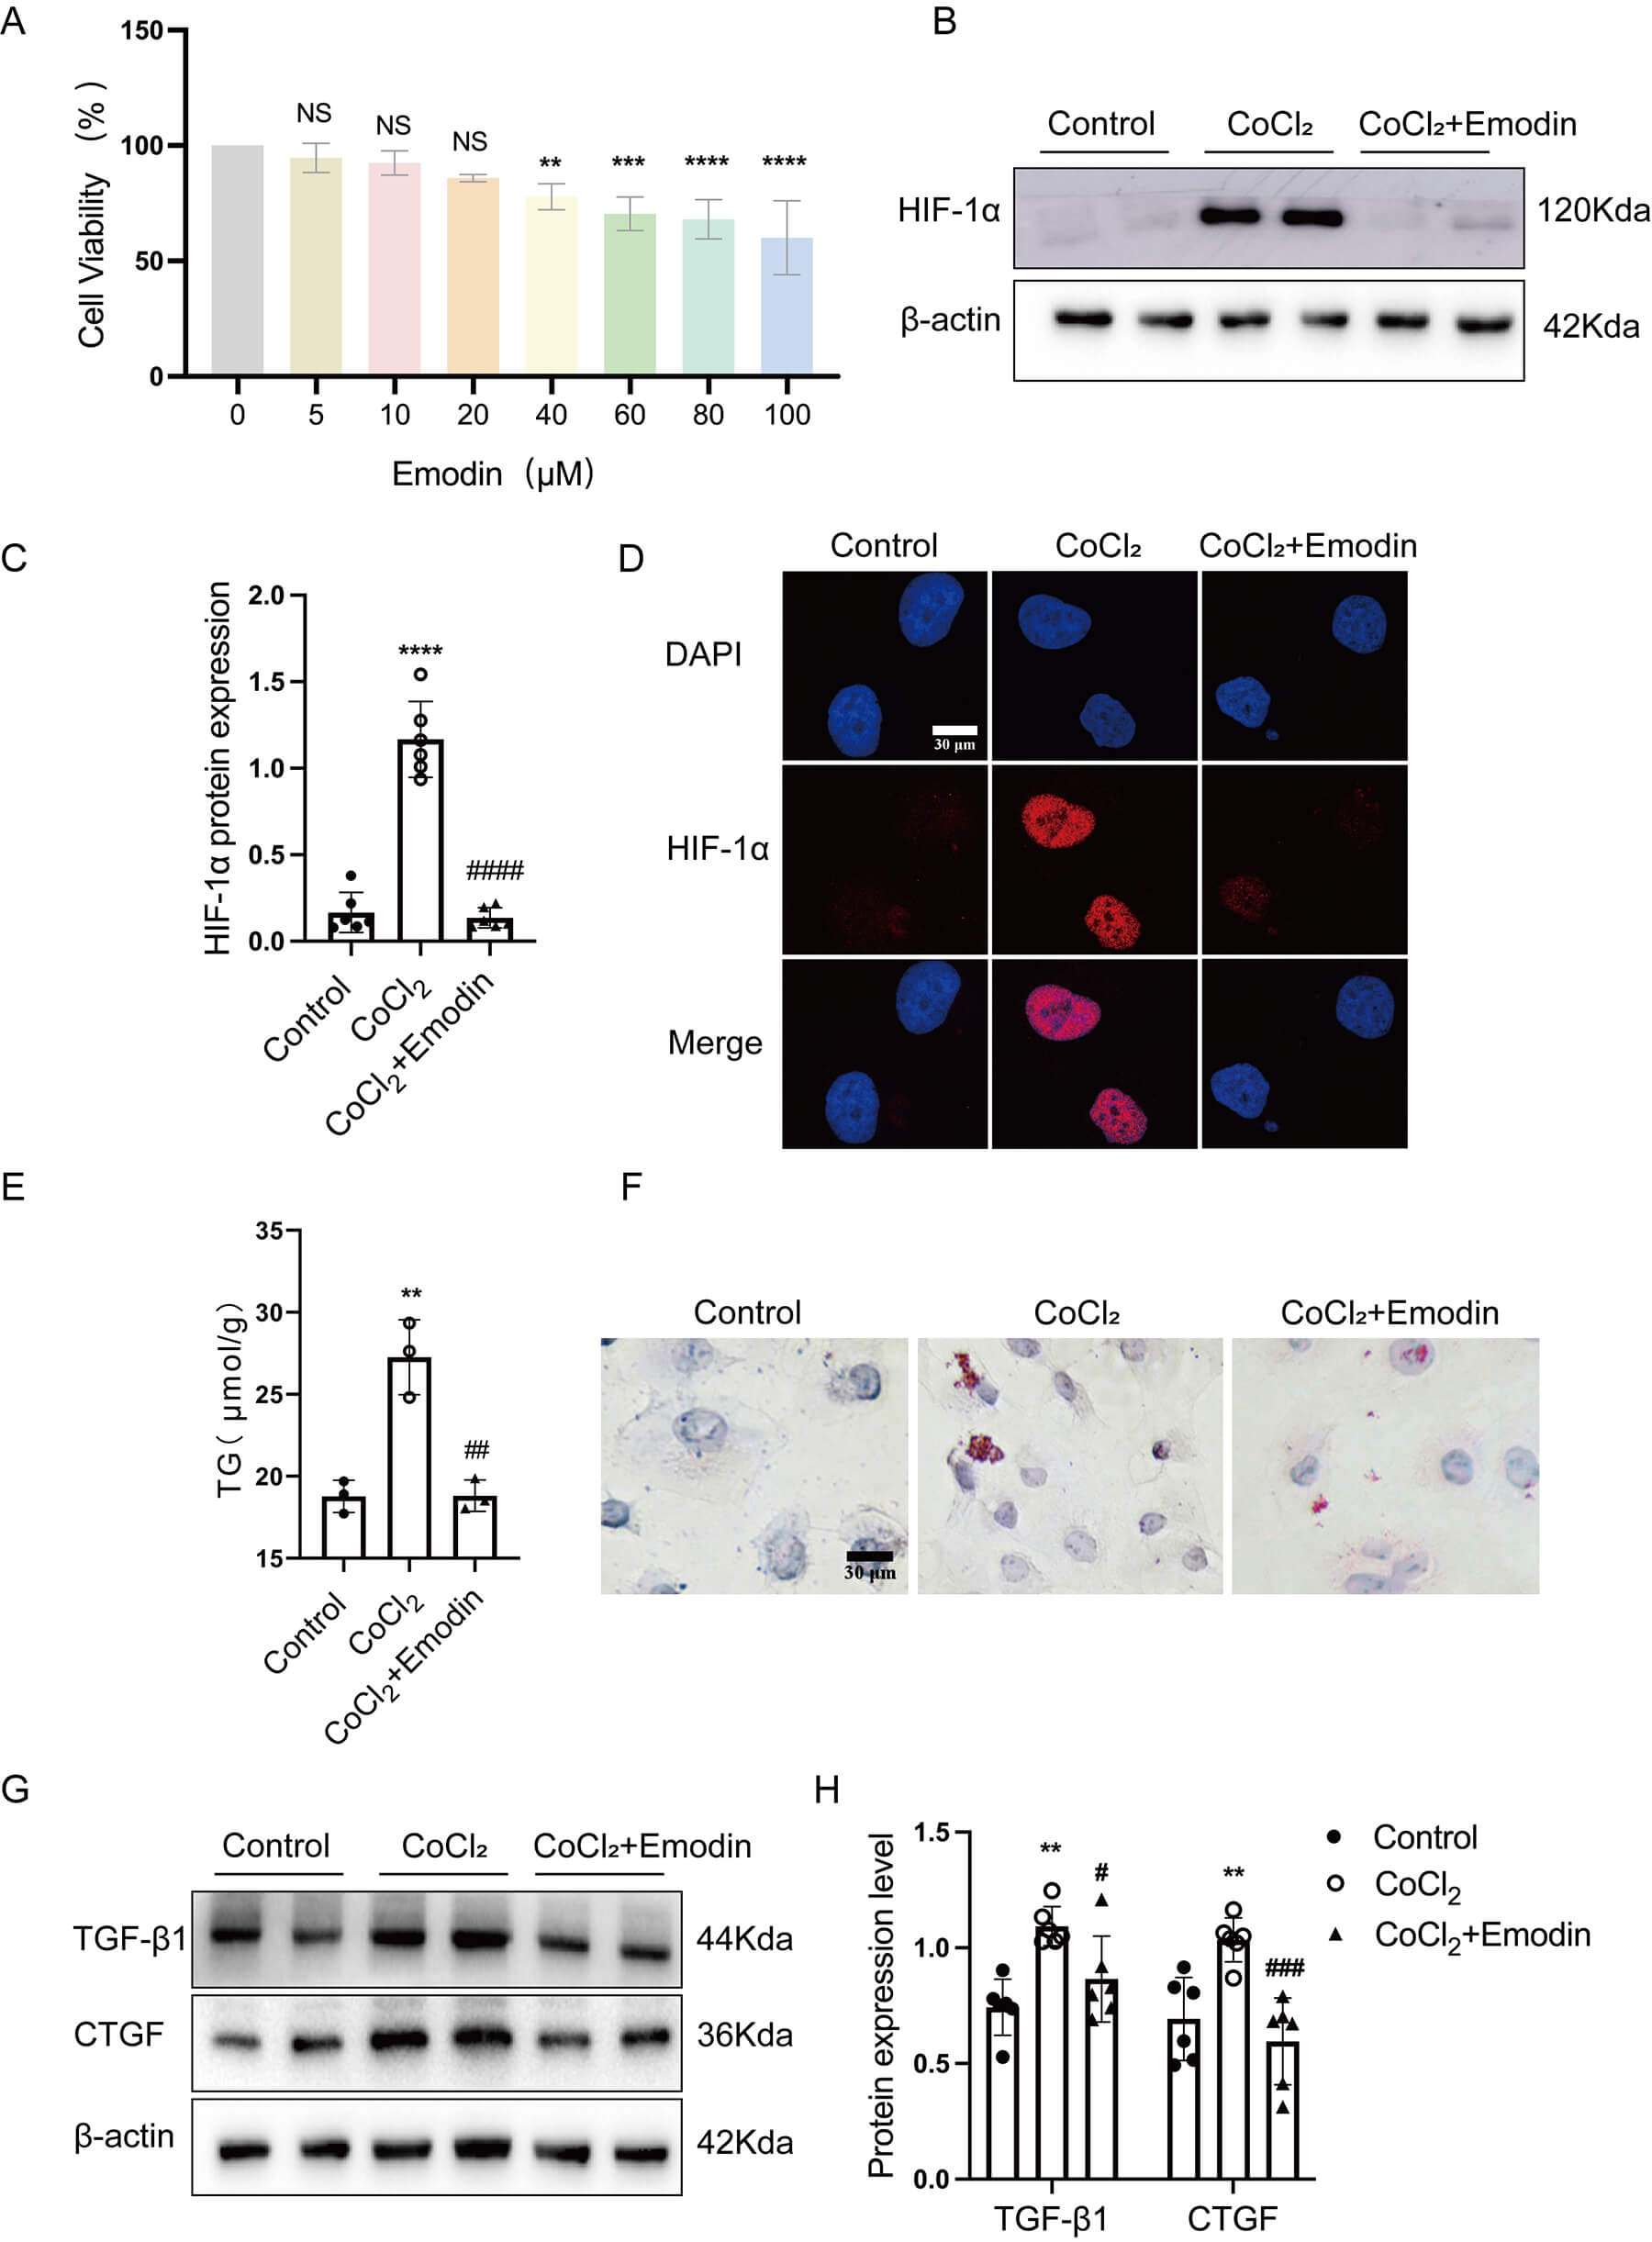 Fig. 4.
Emodin attenuated lipid deposition and cellular damage in
CoCl2-treated HK-2 cells by inhibiting HIF-1
The mRNA expression levels of Drp1, Mfn2, and OPA1 significantly decreased in CoCl2-treated HK-2 cells, which were rescued by emodin treatment (Fig. 5A–C). The protein expression of the mitochondrial fusion protein Mfn2 was reduced in CoCl2-treated HK-2 cells but was markedly restored by emodin treatment. While no significant difference was observed in the expression levels of mitochondrial fission protein Drp1 among the three groups (Fig. 5D,E). However, the ratio of Mfn2 to Drp1 expression levels still significantly diminished in CoCl2-treated HK-2 cells compared with those in the control group, which was restored after emodin treatment (Fig. 5F). These results suggested that emodin improved mitochondrial dynamics disorder by regulating the ratio of Mfn2 to Drp1 protein expression levels. Moreover, this treatment reversed the reduction of mtDNA copy number (Fig. 5G) and the loss of mitochondrial membrane potential (Fig. 5H,I) in CoCl2-treated HK-2 cells.
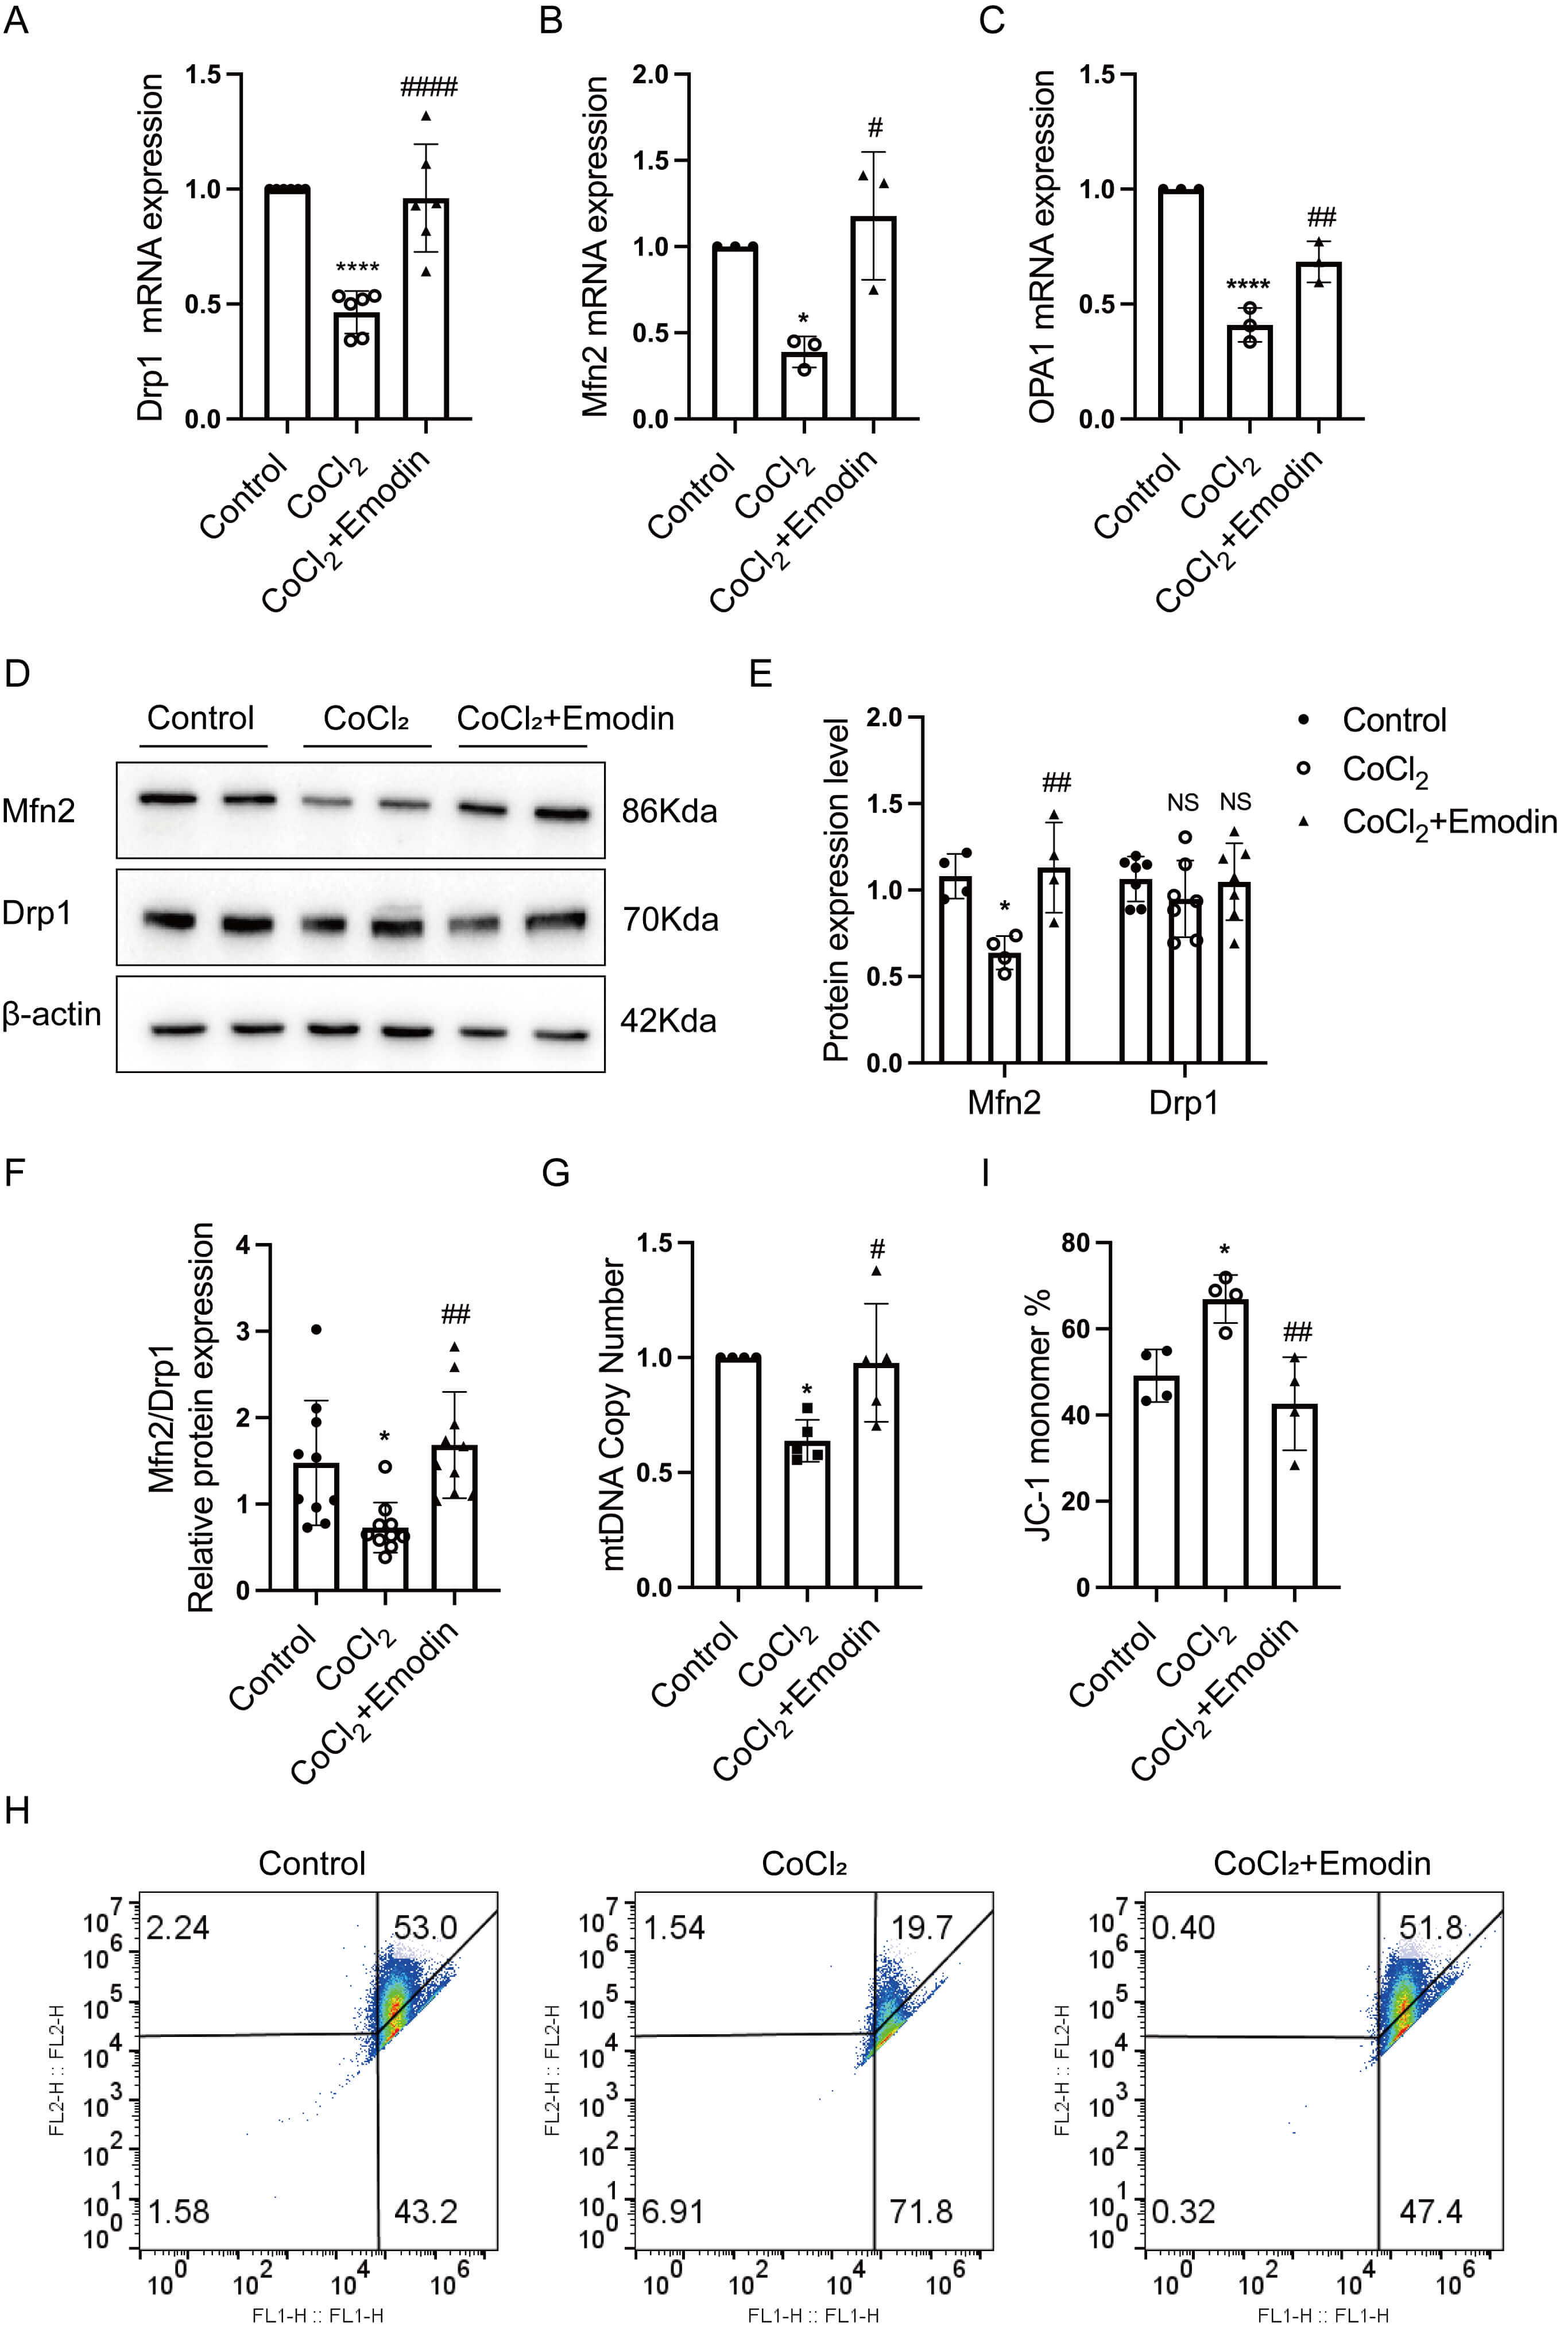 Fig. 5.
Emodin ameliorated mitochondrial dysfunction in
CoCl2-treated HK-2 cells. (A–C) Real-time quantification PCR was performed
to detect the mRNA expression of Drp1, Mfn2, and OPA1
in HK-2 cells. (D,E) Western blot was conducted to evaluate of Mfn2 and Drp1
protein expression in HK-2 cells, with
Although traditional Chinese medicine plays a vital role in DN therapies, its underlying mechanisms in treating DN need exploration to promote its clinical application [25, 26]. Emodin has been reported to prevent DN progression through ameliorating podocyte and mesangial cell injury [17, 27, 28, 29, 30]. Emodin treatment suppressed podocyte apoptosis and boosted autophagy of podocytes in diabetic kidneys [17, 27]. Besides, in vivo and in vitro studies indicated that fibrotic protein expression and cell proliferation in mesangial cells were inhibited by emodin [28, 29, 30]. The present study was novel in demonstrating that emodin protected against DN in rat models by mitigating lipid accumulation and cellular injury of tubular epithelial cells. The results showed that the pathological damage of tubules in rats with diabetes was obviously alleviated, accompanied by significantly decreased lipid accumulation after emodin treatment.
Emodin exerted beneficial effects on lipid metabolism in multiple disease models, including obesity, atherosclerosis, severe acute pancreatitis, and nonalcoholic fatty liver disease [14, 15, 31, 32]. Yu et al. [15] demonstrated that emodin reduced lipid deposition in the adipose tissue of mice by promoting M2 macrophage polarization. Also, emodin protected hepatocytes against lipid deposition in nonalcoholic fatty liver disease via downregulating cholesterol absorption, decreasing lipid synthesis [32, 33]. However, the lipid-modulating effect of emodin in DN requires elucidation. This study showed that emodin treatment significantly downregulated serum TG and LDL levels in rats with DN and inhibited lipid accumulation in diabetic kidneys, which was consistent with the lipid-lowering effect of emodin on other disease models. Besides, these results suggested that emodin did not improve serum lipid profiles in rats with DN by promoting ectopic lipid deposition in kidneys, but simultaneously improved them both.
It is noteworthy that despite significant kidney protective effects, emodin
treatment did not achieve glycemic control in our study. This dissociation
between renal and metabolic outcomes suggests that emodin’s beneficial effects on
kidney function may operate through HIF-1
Emodin protects RTECs from pathological damage via multiple mechanisms. Liu and
colleagues revealed that emodin hindered epithelial–mesenchymal
transdifferentiation by enhancing autophagy through upregulating the expression
of bone morphogenic protein 7 in renal fibrosis [34]. Wang et al. [35]
identified the miR-490-3p/HMGA2 signaling axis as the mechanistic conduit through
which emodin exerts renoprotective effects, specifically attenuating tubular
epithelial cell damage in fibrotic kidney disease. Moreover, the in
vitro study showed that emodin prevented cellular damage from
hypoxia/reoxygenation by downregulating oxidative stress and apoptosis in HK-2
cells [36]. Consistent with the aforementioned findings, our study confirmed that
emodin effectively reduced RTECs injury in vivo and in vitro.
Moreover, our results revealed that emodin prevented lipid accumulation and
cellular injury by inhibiting HIF-1
Previous studies suggested that mitochondrial homeostasis imbalance exacerbated
cellular lipid deposition [37, 38, 39]. The present study showed that emodin treatment
mitigated structural and functional imbalance of mitochondria in vivo
and in vitro, suggesting that emodin might alleviate lipid accumulation
and cellular injury in diabetic tubules through reversing mitochondrial
homeostasis. HIF-1
We acknowledge two important limitations of this study. First, the present study employed standard oral administration as a proof-of-concept to demonstrate pharmacological efficacy in diabetic nephropathy; However, translation to clinical practice will require formulation optimization because emodin has poor oral bioavailability and low aqueous solubility. Recent advances demonstrate that nano-drug delivery systems (liposomes, polymeric nanoparticles, nanogels) can significantly enhance emodin solubility and bioavailability [43], while structural modifications and material-based targeted delivery strategies offer additional avenues to overcome pharmacokinetic limitations [44]. Second, this study used established urinary biomarkers to assess renal injury. While clinically validated, these markers may be affected by reporting quality issues, and our targeted approach excludes the comprehensive profiling achievable through “omics” technologies. Future multi-omics integration could enhance diagnostic and mechanistic insights.
In summary, this study was novel in demonstrating that emodin prevented lipid
accumulation and cellular injury in RTECs of diabetic kidneys. Emodin inhibited
excessive HIF-1
All data used and analyzed during this study will be available from the corresponding author upon reasonable request.
YW and XD performed the research, conducted the data analysis, and wrote the manuscript. QZ and JZ assisted in conducting the animal experiments. ZQ, FG and SZ assisted in cell culture. CW, LW, SL participated in research design and data interpretation. ZH designed the work and conducted manuscript polishing. All authors contributed to editorial changes in the manuscript. All authors read and approved the final manuscript. All authors have participated sufficiently in the work and agreed to be accountable for all aspects of the work.
The animal protocols used in current study were approved by the Laboratory Animal Welfare and Ethics Committee of Wannan Medical University (No. LLSC-2022-212), and the experimental procedures were conducted in accordance with the Guide for the Care and Use of Laboratory Animals.
Not applicable.
This study was supported by the Excellent Youth Research Project in Anhui Province’s Universities (Grant No. 2024AH030056), the National Natural Science Foundation of China Youth Fund (Grant No. 82000698), the Wuhu City Basic Research on the Application of Science and Technology Projects under Grant 2022jc28, the Wannan Medical University Doctoral Research Initiation Fund (Grant No. WYRCQD2019007), and the Anhui Province College Students’ Innovation and Entrepreneurship Training Program Project (Grant No. S202410368007).
The authors declare no conflict of interest.
References
Publisher’s Note: IMR Press stays neutral with regard to jurisdictional claims in published maps and institutional affiliations.