


 , Xiancheng Zhang 1,2, Shuai Ma 1,2, Feiyang Wu 3,*
 , Xingguo Zhong 1,2,*
1 Graduate School, Bengbu Medical University, 233030 Bengbu, Anhui, China
2 Department of General Surgery, Anhui No. 2 Provincial People’s Hospital, 230041 Hefei, Anhui, China
3 Department of General Surgery, The People’s Hospital of Yingshang, 236200 Fuyang, Anhui, China
Abstract
Hepatocellular carcinoma (HCC) is a major contributor to cancer-related mortality worldwide. Store-operated calcium (Ca2+) entry (SOCE), the principal Ca2+ influx pathway in non-excitable cells, has been implicated in regulating tumor cell proliferation, migration, and survival. Although annexin A5 (ANXA5) has been implicated in several malignancies, its mechanistic contribution to Ca2+ signaling in HCC remains unclear.
SOCE-related differentially expressed genes were identified through integrated bioinformatics analyses of The Cancer Genome Atlas and the Gene Expression Omnibus datasets. Huh-7 and HepG2 cells with stable ANXA5 knockdown were established using lentiviral transduction. Molecular interactions and functional alterations were examined by co-immunoprecipitation, enzymatic activity assays, inositol 1,4,5-trisphosphate (IP3) quantification, Ca2+ imaging, western blotting, quantitative polymerase chain reaction (PCR), and flow cytometry. Cellular phenotypes were assessed using proliferation and migration assays, whereas tumor growth was evaluated in subcutaneous xenograft models using nude mice. Notably, all in vitro experiments in this study were validated using both Huh-7 and HepG2 cells, whereas only Huh-7 cells were employed for in vivo experiments.
ANXA5 was identified as an SOCE-associated gene whose elevated expression correlated with poor prognosis in HCC. Functional assays demonstrated that ANXA5 depletion significantly suppressed HCC cell proliferation and migration. Co-immunoprecipitation assays showed reduced levels of GAPDH co-precipitating with ANXA5 in ANXA5-deficient cells, suggesting impaired association between ANXA5 and GAPDH. Although ANXA5 knockdown did not alter GAPDH expression, it markedly reduced GAPDH enzymatic activity, leading to decreased IP3 production, impaired endoplasmic reticulum Ca2+ release, and attenuated SOCE-mediated Ca2+ influx. Importantly, pharmacological modulation of phospholipase C (PLC) activity with U73122 and its inactive analog U73443 further supported the involvement of PLC–IP3 signaling in SOCE impairment and malignant phenotypes following ANXA5 depletion. In vivo, ANXA5 silencing significantly inhibited tumor growth and was accompanied by reduced expression of Ki-67, vimentin, and the M2 macrophage marker cluster of differentiation 206 (CD206).
These findings support a working model in which ANXA5 interacts with GAPDH and is associated with altered IP3 production and SOCE-dependent Ca2+ signaling, potentially contributing to HCC progression and immune modulation. Collectively, this ANXA5/GAPDH/IP3/SOCE axis may provide a mechanistic framework for understanding HCC development and suggests ANXA5 as a potential therapeutic target.
Keywords
- annexin A5
- glyceraldehyde-3-phosphate dehydrogenases
- inositol 1,4,5-trisphosphate
- store-operated calcium entry
- hepatocellular carcinoma
Liver cancer ranks sixth in global cancer incidence and is the third most common cause of cancer-related mortality worldwide, reflecting its substantial fatal burden [1]. Hepatocellular carcinoma (HCC) constitutes the predominant histological subtype, accounting for approximately 85% of primary liver cancers [2]. The development of HCC involves multiple etiological factors, including viral infections, toxin exposure, excessive alcohol consumption, and metabolic disorders [3]. In essence, persistent exposure to these insults subjects hepatocytes to repeated cycles of injury and regeneration, leading to the accumulation of oncogenic mutations that drive malignant transformation [4]. Over the past decades, treatment options for HCC have expanded substantially, encompassing surgery, locoregional interventions, immunotherapy, molecularly targeted therapy, radiotherapy, and chemotherapy, which together have led to improved survival outcomes and a decreased overall cancer burden [2, 5, 6]. Nevertheless, HCC continues to pose major therapeutic challenges, as reflected by unfavorable long-term prognosis, frequent postoperative recurrence and metastasis, and a 5-year survival rate of approximately 60–80% [7, 8]. Nevertheless, HCC continues to pose major therapeutic challenges, as reflected by unfavorable long-term prognosis, frequent postoperative recurrence and metastasis, and a 5-year survival rate of approximately 60–80%.
Annexin A proteins are a family of calcium (Ca2+)-dependent phospholipid-binding proteins that are evolutionarily conserved and present in nearly all eukaryotic organisms. They function by reversibly binding to anionic phospholipids on membrane surfaces in a Ca2+-dependent manner. This fundamental property allows annexins to regulate diverse cellular processes, including inflammation, signal transduction, adhesion, migration, differentiation, proliferation, and apoptosis [9, 10]. In vertebrates, annexins are designated annexin A and comprise 12 subtypes (annexins A1–A11 and A13) [11]. Among these, human annexin A5 (ANXA5) is widely expressed in cells and body fluids. It reversibly and specifically binds phosphatidylserine in a Ca2+-dependent manner, performing multiple biological functions. This characteristic is essential for a wide range of physiological and pathological processes, but also enables ANXA5 to serve as a potential targeting agent for cancer therapy [12, 13]. ANXA5 has been implicated in tumor metastasis and invasion, promoting cancer progression and angiogenesis [14]. HCC is associated with frequent recurrence, strong metastatic capacity, and unfavorable clinical outcomes. HCC frequently infiltrates the portal vein, forming macroscopic tumor thrombi, which represents a prominent growth pattern in patients with intermediate to advanced-stage disease [14, 15, 16]. Notably, ANXA5 is reportedly upregulated in tumor thrombus samples and may represent a candidate biomarker associated with portal vein tumor thrombus formation. Moreover, ANXA5 expression has been associated with lymphatic metastasis [17].
As a ubiquitous intracellular signaling molecule, Ca2+ participates in
diverse cellular processes such as proliferation, apoptosis, migration, and
immune regulation [18, 19]. Consequently, the ability of cancer cells to execute
malignant functions critically depends on dysregulated intracellular Ca2+
homeostasis, which is a well-established driver of tumor initiation, progression,
and treatment response [20, 21]. Unlike excitable cells, cancer cells lack
voltage-gated Ca2+ channels and therefore rely on store-operated calcium
(Ca2+) entry (SOCE) as the primary pathway for Ca2+ influx to support
numerous pro-tumorigenic processes [22, 23, 24]. SOCE occurs at specialized junctions
between the plasma membrane and the endoplasmic reticulum (PM–ER), where the
local lipid composition—specifically phosphatidylinositol-(4,5)-bisphosphate
(PI(4,5)P2, PIP2)—plays a critical role in maintaining structural
stability [25, 26]. The activation of SOCE is initiated by the cleavage of
PIP2 by phospholipase C (PLC) to generate inositol 1,4,5-trisphosphate
(IP3), which binds to IP3 receptors on the ER membrane, depleting ER
Ca2+ stores and triggering Ca2+ influx [27, 28]. Dysregulation of this
pathway has been implicated in tumor progression; however, the upstream
regulators of SOCE, including annexins, remain incompletely understood. Notably,
ANXA5 can form a complex with phosphatidylinositol phosphate kinase gamma
(PIPKI
Based on our study and current mechanistic knowledge, we propose a model where
ANXA5 regulates SOCE-mediated Ca2+ signaling in HCC. Specifically, decreased
GAPDH activity is expected to impair the production of phosphoinositides (PPIs),
as their synthesis depends on metabolic pathways (glycolysis, gluconeogenesis,
and the pentose phosphate pathway) driven by GAPDH’s catalytic function [33, 34, 35, 36].
ANXA5 may modulate PIP2 synthesis by regulating GAPDH enzymatic activity,
which in turn affects the Warburg effect—the primary metabolic pathway in tumor
cells—thereby altering PPI availability. In addition, ANXA5 can interact with
PIPKI
Our observations support a model in which ANXA5 regulates HCC malignancy by bridging metabolism, Ca2+ signaling pathways, and tumor-related immunity. In this study, we investigated the molecular framework linking ANXA5 to GAPDH activity, PIP2 metabolism, PM–ER junction formation, and SOCE function, as well as its potential impact on macrophage polarization. Understanding these mechanisms may provide novel insights into HCC biology, positioning ANXA5 as a promising target for therapeutic intervention. The proposed mechanism is illustrated in Fig. 1.
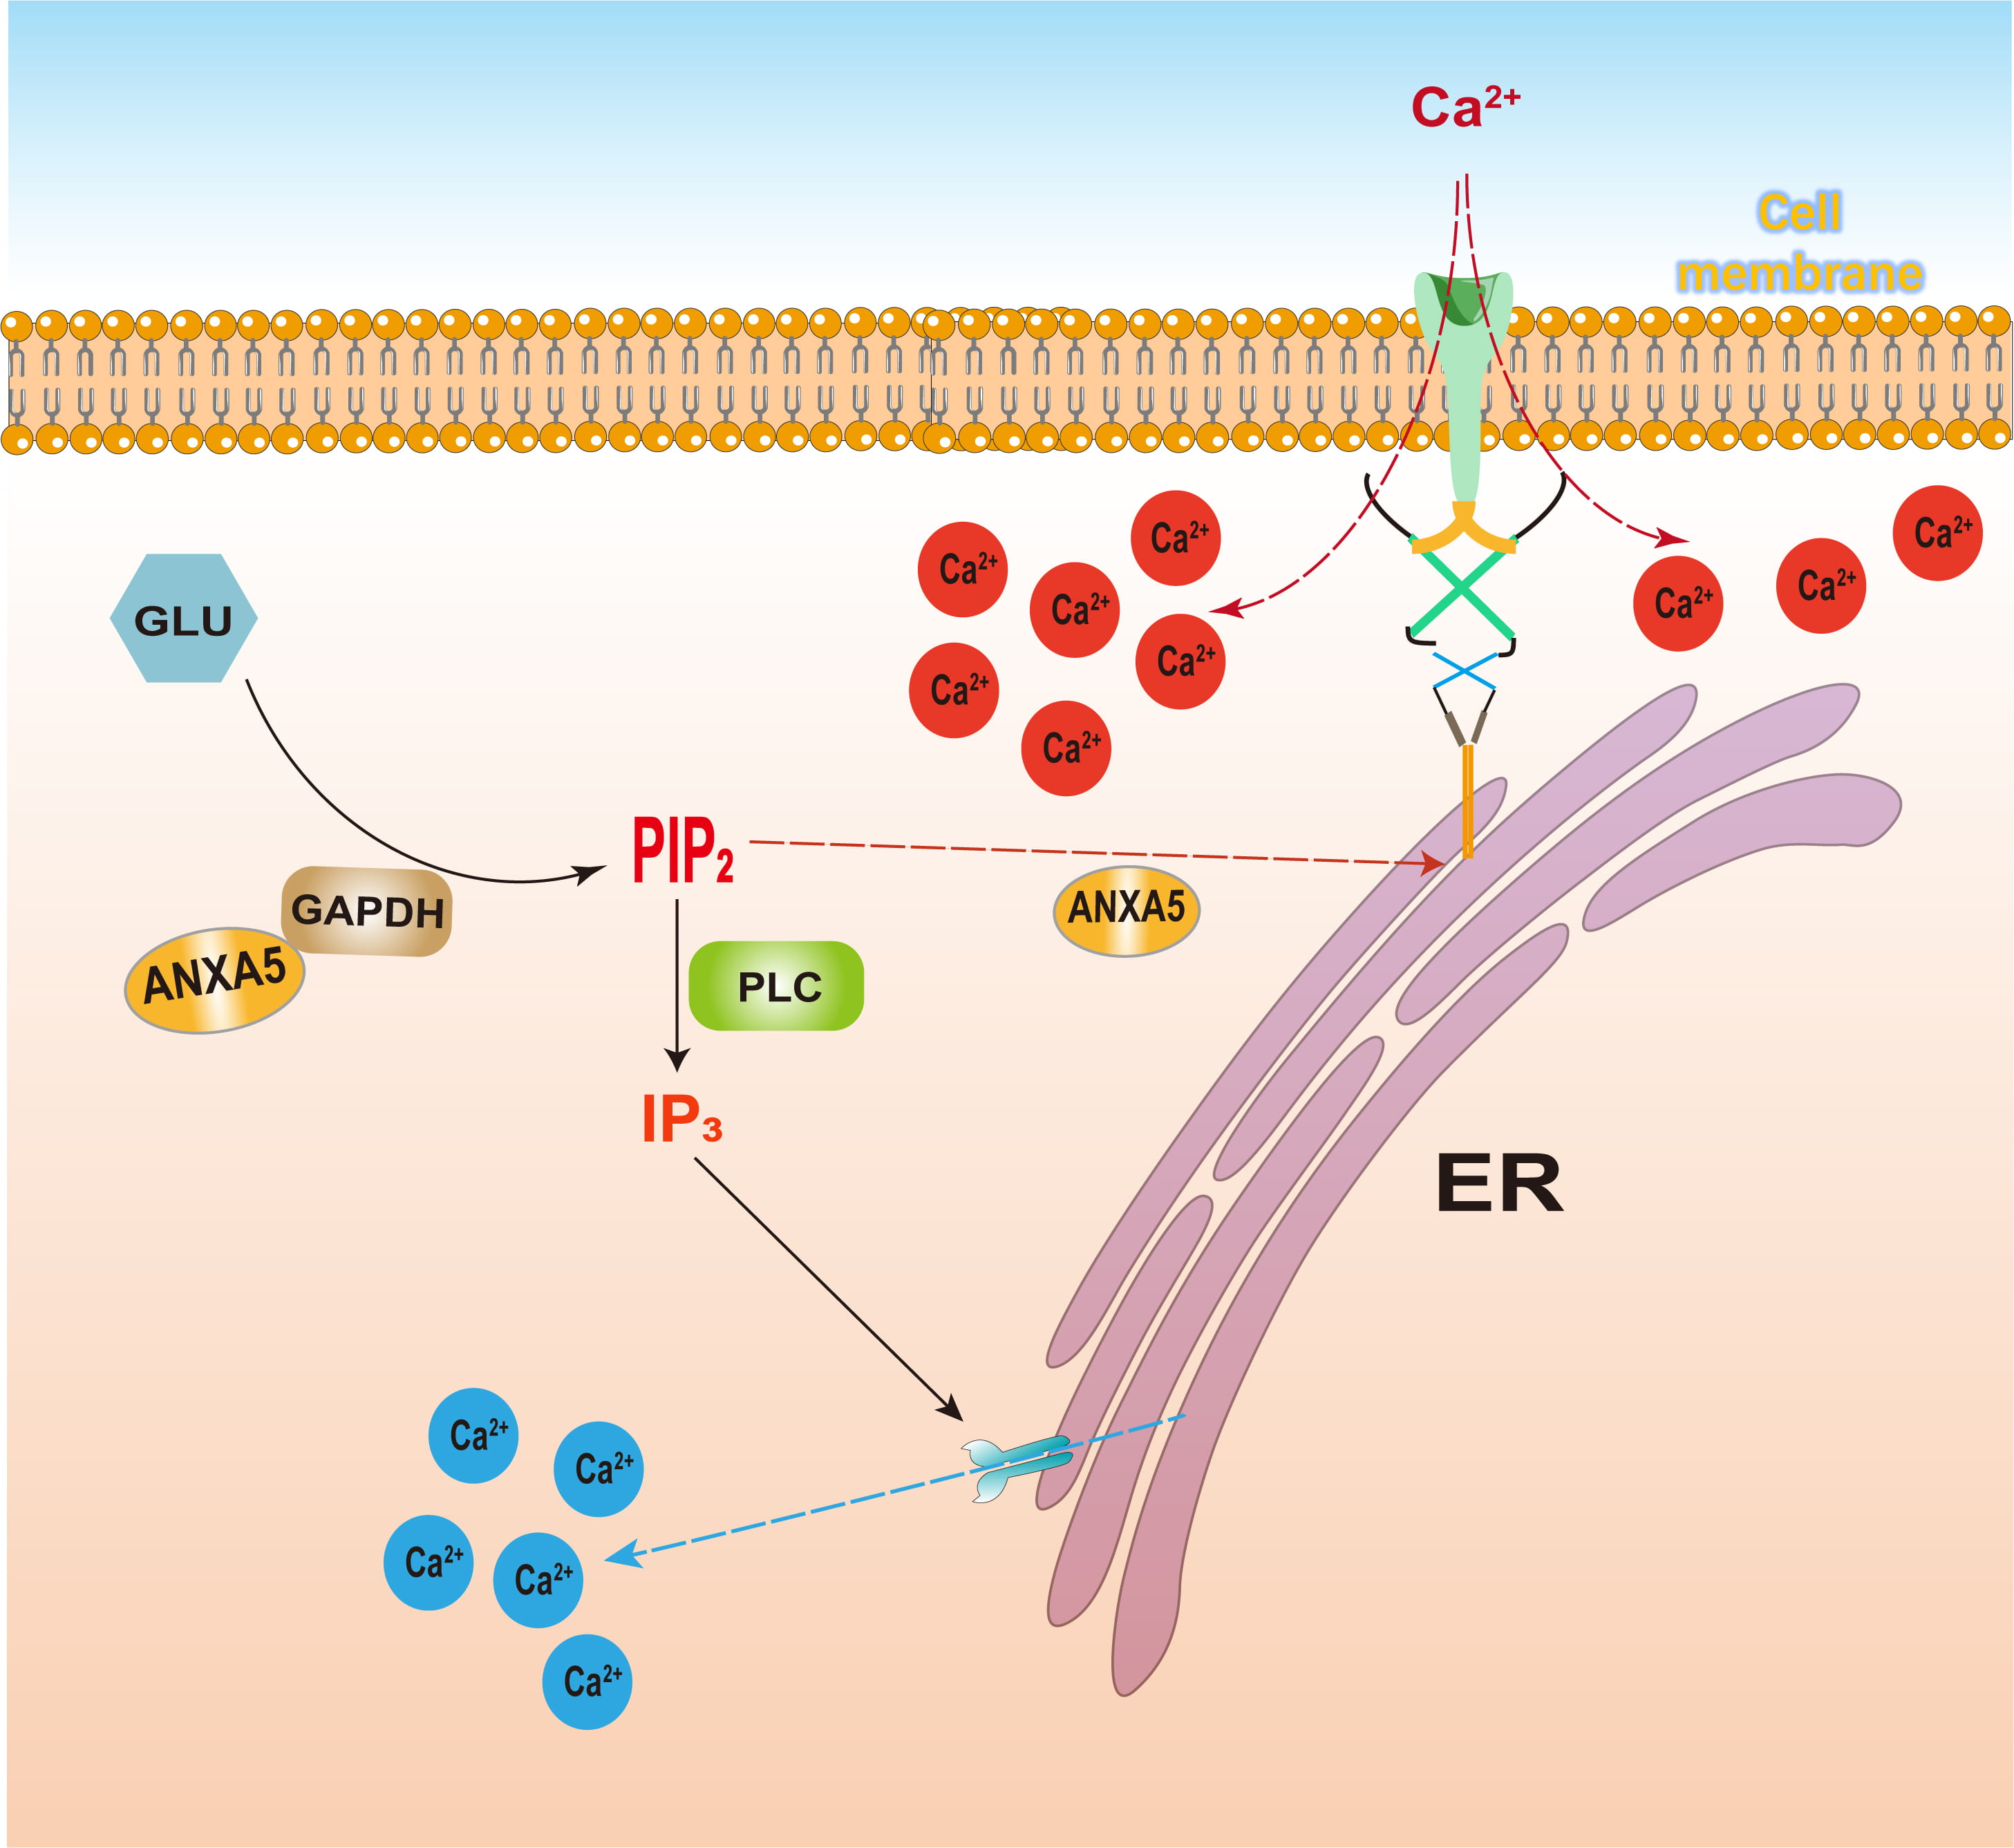 Fig. 1.
ANXA5 regulates the SOCE pathway. ANXA5, annexin A5; SOCE, store-operated calcium (Ca2+) entry. This figure was created using Adobe Illustrator 2023.
Data acquisition involved three steps. First, HCC gene expression profiles and
matched clinical data were acquired from The Cancer Genome Atlas (TCGA;
https://www.cancer.gov), including 424 tissue samples (374 tumor, 50 normal) and
corresponding clinical data for 377 patients. Second, survival-specific
expression data for 118 HCC cases were independently obtained from the Gene
Expression Omnibus (GEO) dataset (GSE10186; https://www.ncbi.nlm.nih.gov). Third,
a list of 246 SRGs was generated by screening the GeneCards database
(https://www.genecards.org), retaining only genes with a relevance score
Bioinformatics analysis was conducted using Perl (v5.30.0) and R (v4.3.2). Gene
expression data were formatted into a matrix, featuring genes as rows and samples
as columns. For genes with multiple probes, expression values were averaged to
produce a single value per gene. Genes with zero mean expression across all
samples were removed. Finally, the analysis was limited to the intersection of
this filtered expression matrix and the curated SRG set. Differential expression
analysis between normal and tumor tissues was conducted using the Wilcoxon
rank-sum test. Differentially expressed genes (DEGs) were defined as those with a
false discovery rate (FDR)
Tumor transcriptomic data from TCGA (https://www.cancer.gov) and GEO (https://www.ncbi.nlm.nih.gov), encompassing survival-associated gene expression profiles, were subjected to molecular subtyping using an unsupervised consensus clustering approach. This was implemented via the ConsensusClusterPlus R package with the following parameters: clusterAlg = “km”, 80% pItem = 0.8, pFeature = 1, and reps = 500 to ensure robustness. The consensus matrix and cumulative distribution function (CDF) were evaluated across a predefined range of cluster numbers (k = 2 to 9) to determine the optimal k value. The optimal number of stable clusters (k = 2) was selected based on the criteria of maximal intercluster divergence and intracluster concordance, as reflected by the consensus matrix heatmap and relative change in area under the CDF curve. The resulting subtypes were designated Cluster A and Cluster B. Subsequently, to evaluate the prognostic value of the identified subtypes, we integrated OS data. Survival differences between clusters were visualized using Kaplan–Meier analysis and statistically compared via the log-rank (Mantel-Cox) test. Furthermore, HRs and their CIs were also determined using a univariate Cox proportional hazards model, with all analyses conducted using the survival and survminer R packages.
To develop a prognostic risk signature based on SRGs, a combination of least
absolute shrinkage and selection operator (LASSO) regression and multivariate Cox
proportional hazards regression was employed. The data were randomly divided into
training (70%) and testing (30%) sets using the caret package in R, which was
used for all statistical analyses. To identify genes linked to survival, a
LASSO-penalized Cox proportional hazards model was applied to the training cohort
using the glmnet package. The optimal regularization parameter (
The absorbance at 340 nm was recorded immediately (
Here, F0 represents the baseline fluorescence intensity prior to stimulation, and Ft represents the fluorescence intensity at time t. The resulting F/F0 versus time curves were used to characterize dynamic intracellular Ca2+ responses.
Using the median training set risk score as a cutoff, patients in both the
training and testing cohorts were stratified into high- and low-risk groups.
Survival differences between these groups were assessed using the log-rank test.
Time-dependent receiver operating characteristic (ROC) analysis (timeROC package)
was conducted to assess the 3-year prognostic accuracy of the model. The model
was validated across both cohorts based on specific performance metrics: training
set (log-rank p
The prognostic capacity of the risk score was assessed separately in the training, testing, and combined cohorts. For each cohort, OS probabilities between the predefined high- and low-risk groups were estimated via the Kaplan–Meier method. To evaluate the statistical significance of survival differences, the log-rank (Mantel-Cox) test was employed, with survival curves visualized with the survminer package. To quantify the time-dependent predictive accuracy of the risk score, a time-dependent ROC analysis was performed using the timeROC package. This analysis was conducted at three clinically relevant time points: 1, 3, and 5 years post-diagnosis. To evaluate the model’s discriminative power, the area under the curve (AUC) and its 95% CIs were calculated for each time point. A custom function was used to plot all three ROC curves on a single graph.
To assess whether the SRG-derived risk score serves as an independent predictor of OS, multivariate Cox proportional hazards regression analysis was performed. Clinical covariates (including age, sex and tumor stage) were incorporated alongside the continuous risk score. Prior to analysis, samples with any missing clinical information (coded as “unknown”) were excluded. To ensure a consistent, matched cohort, only samples present in both the risk score and complete clinical datasets were retained. The Cox proportional hazards model, defined by Mathematical Components 2, was then fitted using a combined dataframe that included survival time (futime), status (fustat), all clinical variables, and the riskScore (Mathematical Components 2). HRs, 95% CIs, and Wald test p were extracted for each variable from the fitted model, and then summarized and exported. Finally, a forest plot was generated using the ggforest function from the survminer package to visually present the HRs and 95% CIs of all covariates, with the risk score highlighted.
To visually depict the expression profiles of the signature genes across the patient cohort, a heatmap was constructed using the pheatmap package. Patients were sorted by ascending risk order, after which the model gene expression matrix was extracted and transposed to align genes as rows and ordered patients as columns. To visualize relative expression patterns, row-wise z-score normalization (scale = “row”) was applied and mapped to a continuous blue-white-red color scale.
A prognostic nomogram was developed using the regplot package to provide quantitative estimates of 1-, 3-, and 5-year OS. This tool was based on a final multivariate Cox proportional hazards model that incorporated all significant independent predictors, including clinical variables and the continuous risk score. To assess the accuracy of the nomogram’s predictions, calibration curves were generated for the same three time points using the rms::calibrate function with 1000 bootstrap iterations. This method compares the predicted survival probabilities against the observed Kaplan–Meier estimates to determine performance. The model’s goodness-of-fit was visually verified by the proximity of the calibration curves to the 45-degree line. Cumulative hazard curves (via survminer::ggsurvplot with fun = “cumhaz”) were used to compare risk over time between groups divided by their median nomogram score. Prior to all analyses, data integrity was ensured by excluding samples with any missing clinical information and retaining only those patients present in both the risk score and clinical datasets.
To explore the immune microenvironment associated with high-risk genes, immune cell enrichment analysis was performed leveraging the Tumor Immune Single Cell Hub 2 (TISCH2) database (https://tisch.compbio.cn/gallery/). Separately, to elucidate the functional interactions among these genes, a protein–protein interaction network was constructed. The network data were retrieved from the STRING database (version 12.0; https://cn.string-db.org/), applying a minimum required interaction confidence score threshold to filter for high-confidence interactions. The resulting network was subsequently imported into Cytoscape software (version 3.9.0) for advanced visualization and topological analysis, enabling clearer representation of molecular interaction hubs and modules [38].
The human HCC cell lines Huh-7 (STCC10102; Servicebio, Wuhan, China) and HepG2 (STCC10114P; Servicebio) were cultured in Dulbecco’s Modified Eagle Medium (DMEM, G4511-500ML; Servicebio) supplemented with 10% fetal bovine serum (FBS, FSP500; ExCell Bio, Shanghai, China) and 1% penicillin–streptomycin (G4003; Servicebio). Cells were maintained under standard conditions at 37 ℃ in a 5% CO2 humidified atmosphere, with daily monitoring of confluence and morphology, ensuring optimal growth before subsequent experimental use. Both Huh-7 and HepG2 cell lines have been authenticated by STR profiling and confirmed to be mycoplasma-negative.
To investigate the functional impact of ANXA5, Huh-7 and HepG2 cells were transduced with a recombinant lentiviral vector targeting ANXA5 (single hairpin RNA [shRNA]-ANXA5; Genebio, Shanghai, China). A non-targeting, scrambled shRNA lentivirus (shRNA-negative control [NC]) was used as the NC.
The specific shRNA sequences are listed in Table 1. Briefly, Huh-7 and HepG2 cells were seeded in 6-well plates; at approximately 80% confluence, they were transduced with lentiviruses in a mixture of DMEM and polybrene (40804ES76; Yeasen, Shanghai, China). After 12 h, the transduction mixture was replaced with fresh complete culture medium. Following an additional 3–4 days of culture, stable cell pools were selected using puromycin (HY-K1057; MedChemExpress, Shanghai, China) over a 3- to 4-day period. Transduction efficiency was initially assessed by observing green fluorescent protein expression under a fluorescence microscope. The knockdown (KD) efficiency of ANXA5 was subsequently confirmed at the mRNA and protein levels using quantitative PCR (qPCR) and Western blotting, respectively. All procedures were performed according to the manufacturer’s protocol (Genebio) and established laboratory methods [39, 40].
| No. | Lentiviral vector name | Gene sequence |
| 1 | shRNA-NC | 5′-GGGTGAACTCACGTCAGAA-3′ |
| 2 | shRNA-ANXA5(h)-1 | 5′-GCATCCTGACTCTGTTGACAT-3′ |
| 3 | shRNA-ANXA5(h)-2 | 5′-GCCATCAAACAAGTTTATGAA-3′ |
| 4 | shRNA-ANXA5(h)-3 | 5′-CGCGAGACTTCTGGCAATTTA-3′ |
shRNA, short hairpin RNA; NC, negative control.
Total protein was isolated from control and transfected cells (Huh-7 and HepG2)
with RIPA lysis buffer (G2002-100ML; Servicebio). Following extraction, lysates
were clarified by centrifugation at 12,000 rpm for 10 min at 4 ℃. The protein
concentration in the supernatants was quantified using a BCA assay kit
(G2026-200T; Servicebio). Equal protein concentrations were resolved by 10%
sodium dodecyl sulfate polyacrylamide gel electrophoresis (SDS-PAGE) and
electrotransferred onto PVDF membranes. After blocking in 5% non-fat milk for 30
min at room temperature, the membranes were probed overnight at 4 °C
with primary antibodies against ANXA5 (1:1000, 11060-1-AP; Sanying, Wuhan,
China), GAPDH (1:1000, GB15004; Servicebio), and
Co-immunoprecipitation (Co-IP) assays were performed to assess the interaction
between ANXA5 and GAPDH under different ANXA5 expression conditions. Huh-7 and
HepG2 cells from the wild-type (WT), NC, and ANXA5-KD groups were lysed using
ice-cold IP lysis buffer supplemented with protease inhibitors. After
centrifugation at 12,000
Total RNA extraction was performed using TRIzol Reagent (G3013; Servicebio) on
control and transfected cells samples (Huh-7 and HepG2). RNA quality was
determined by spectrophotometry. Subsequently, cDNA was synthesized from the RNA
templates with the SweScript All-in-One RT SuperMix Kit (G3337; Servicebio). Gene
expression was quantified by qPCR using the 2
| Species | Gene | Forward primer (5′ to 3′) | Reverse primer (5′ to 3′) |
| Human | ACTIN | CACCCAGCACAATGAAGATCAAGAT | CCAGTTTTTAAATCCTGAGTCAAGC |
| Human | ANXA5 | GACTTCCCTGGATTTGATGAGC | GAGGGTTTCATCAGAGCCACAA |
| Human | GAPDH | GGAAGCTTGTCATCAATGGAAATC | TGATGACCCTTTTGGCTCCC |
qPCR, quantitative Polymerase Chain Reaction.
Following trypsinization and resuspension in complete medium, control and
transfected cells (Huh-7 and HepG2) were plated in 96-well plates at a density
ranging from 5
The enzymatic activity of GAPDH in cultured control and transfected cells (Huh-7 and HepG2) were measured using a commercial GAPDH activity assay kit (BC2215; Solarbio) according to the manufacturer’s instructions [41]. GAPDH activity was expressed as units per mg of protein, where one unit was defined as the amount of enzyme that oxidizes 1 nmol of NADH per minute under the assay conditions. For measurements performed in a 96-well ultraviolet (UV) plate (light path = 0.6 cm), activity was calculated using Mathematical Components 3.
For IP3 quantification, control and transfected cells (Huh-7 and HepG2)
lysates were prepared, and a standard curve was established using serial
dilutions of the supplied standard. The biotinylated detection antibody and HRP
conjugate were diluted to 1
For rescue and inhibition assays, Huh-7-WT and HepG2-WT cells were assigned to
three groups: vehicle control (dimethyl sulfoxide [DMSO] (GC203006-10 mL;
Servicebio), PLC inhibitor-treated (U73122, HY-13419; MedChemExpress) and
inactive analog-treated (U73343, HY-108630; MedChemExpress), However ANXA5-KD
(Huh-7-ANXA5 and HepG2-ANXA5) was another group. For pharmacological modulation,
above three groups WT cells were pretreated with U73122 or U73443 (5 µM)
for 30 min prior to subsequent analyses, whereas control cells received an
equivalent volume of DMSO (
Control and transfected cells (Huh-7 and HepG2) were seeded into black 96-well
clear-bottom plates at a density of 1
Fluorescence measurements were recorded using the SpectraMax iD3 multi-mode
microplate reader (MD SpectraMax iD3; Molecular Devices, Shanghai, China) with a
540
For each well, time-dependent fluorescence intensity (Ft) was collected, and intracellular Ca2+ changes were expressed as the ratio (Mathematical Components 4).
Cell migratory capacity was evaluated using a wound healing assay. WT, NC, and
ANXA5-KD cells (Huh-7 and HepG2) were plated in 6-well plates at a density of 5
Apoptosis was evaluated by flow cytometry using an Annexin V-FITC/PI apoptosis
detection kit (BL107B; Biosharp, Guangzhou, China). To ensure inclusion of
detached apoptotic cells, both culture supernatants and adherent cells were
collected. Control and transfected cells (Huh-7 and HepG2) were detached with
EDTA-free trypsin (G4002-100ML; Servicebio) to avoid nonspecific staining,
followed by centrifugation at 2000
All animal procedures were reviewed and approved by the Animal Care and Use
Committee of Bengbu Medical University (Approval No. [2025]514), and conducted in
compliance with relevant institutional and national regulations. Fifteen male
BALB/c nude mice (3 weeks old) obtained from Jiangsu Cavens Biotechnology
(Shanghai, China) were randomly assigned to three groups (n = 5 per group):
Huh-7-WT, Huh-7-NC, and Huh-7-ANXA5. Due to constraints in time and resources,
the study was conducted exclusively with Huh-7 cells, representing a potential
experimental limitation. For xenograft establishment, mice were anesthetized with
isoflurane (induction at 3–4% and maintenance at 1.5–2% in oxygen,
administered via inhalation; Hengfeng Qiang Biotechnology Co., Ltd., Jiangsu,
China, batch No. 2401) and 5
Tumor and adjacent tissue specimens were fixed in 4% polyoxymethylene (G1101; Servicebio) at 37 ℃ with gentle agitation overnight. Following fixation, tissues were dehydrated, paraffin-embedded, and cut into sections with a thickness of 4–5 µm. Histological evaluation was carried out by hematoxylin and eosin (H&E) staining using a commercial H&E staining kit (G1076; Servicebio) in accordance with the manufacturer’s instructions.
Immunohistochemical staining was performed on paraffin sections following deparaffinization and antigen retrieval. To reduce nonspecific binding, sections were blocked in 10% bovine serum albumin at 37 ℃ for 1 h. Slides were subsequently incubated with primary antibodies at 4 ℃ overnight and then treated with the corresponding HRP-conjugated secondary antibodies for 30 min at 37 ℃. Signal development was carried out using the GTvision IHC detection system (Gene Tech Company Ltd., Shanghai, China) in accordance with the manufacturer’s protocol, with PBS washes performed between steps.
Statistical analyses were conducted using Origin 2022, ImageJ, and R Studio.
Quantitative data obtained from qPCR and Western blot analyses are expressed as
the mean
The bioinformatics analysis workflow of this study is summarized in Fig. 2A. To
explore the involvement of SRGs in HCC, we compared their expression profiles
between tumor and adjacent normal tissues. Among the 106 differentially expressed
SRGs (FDR
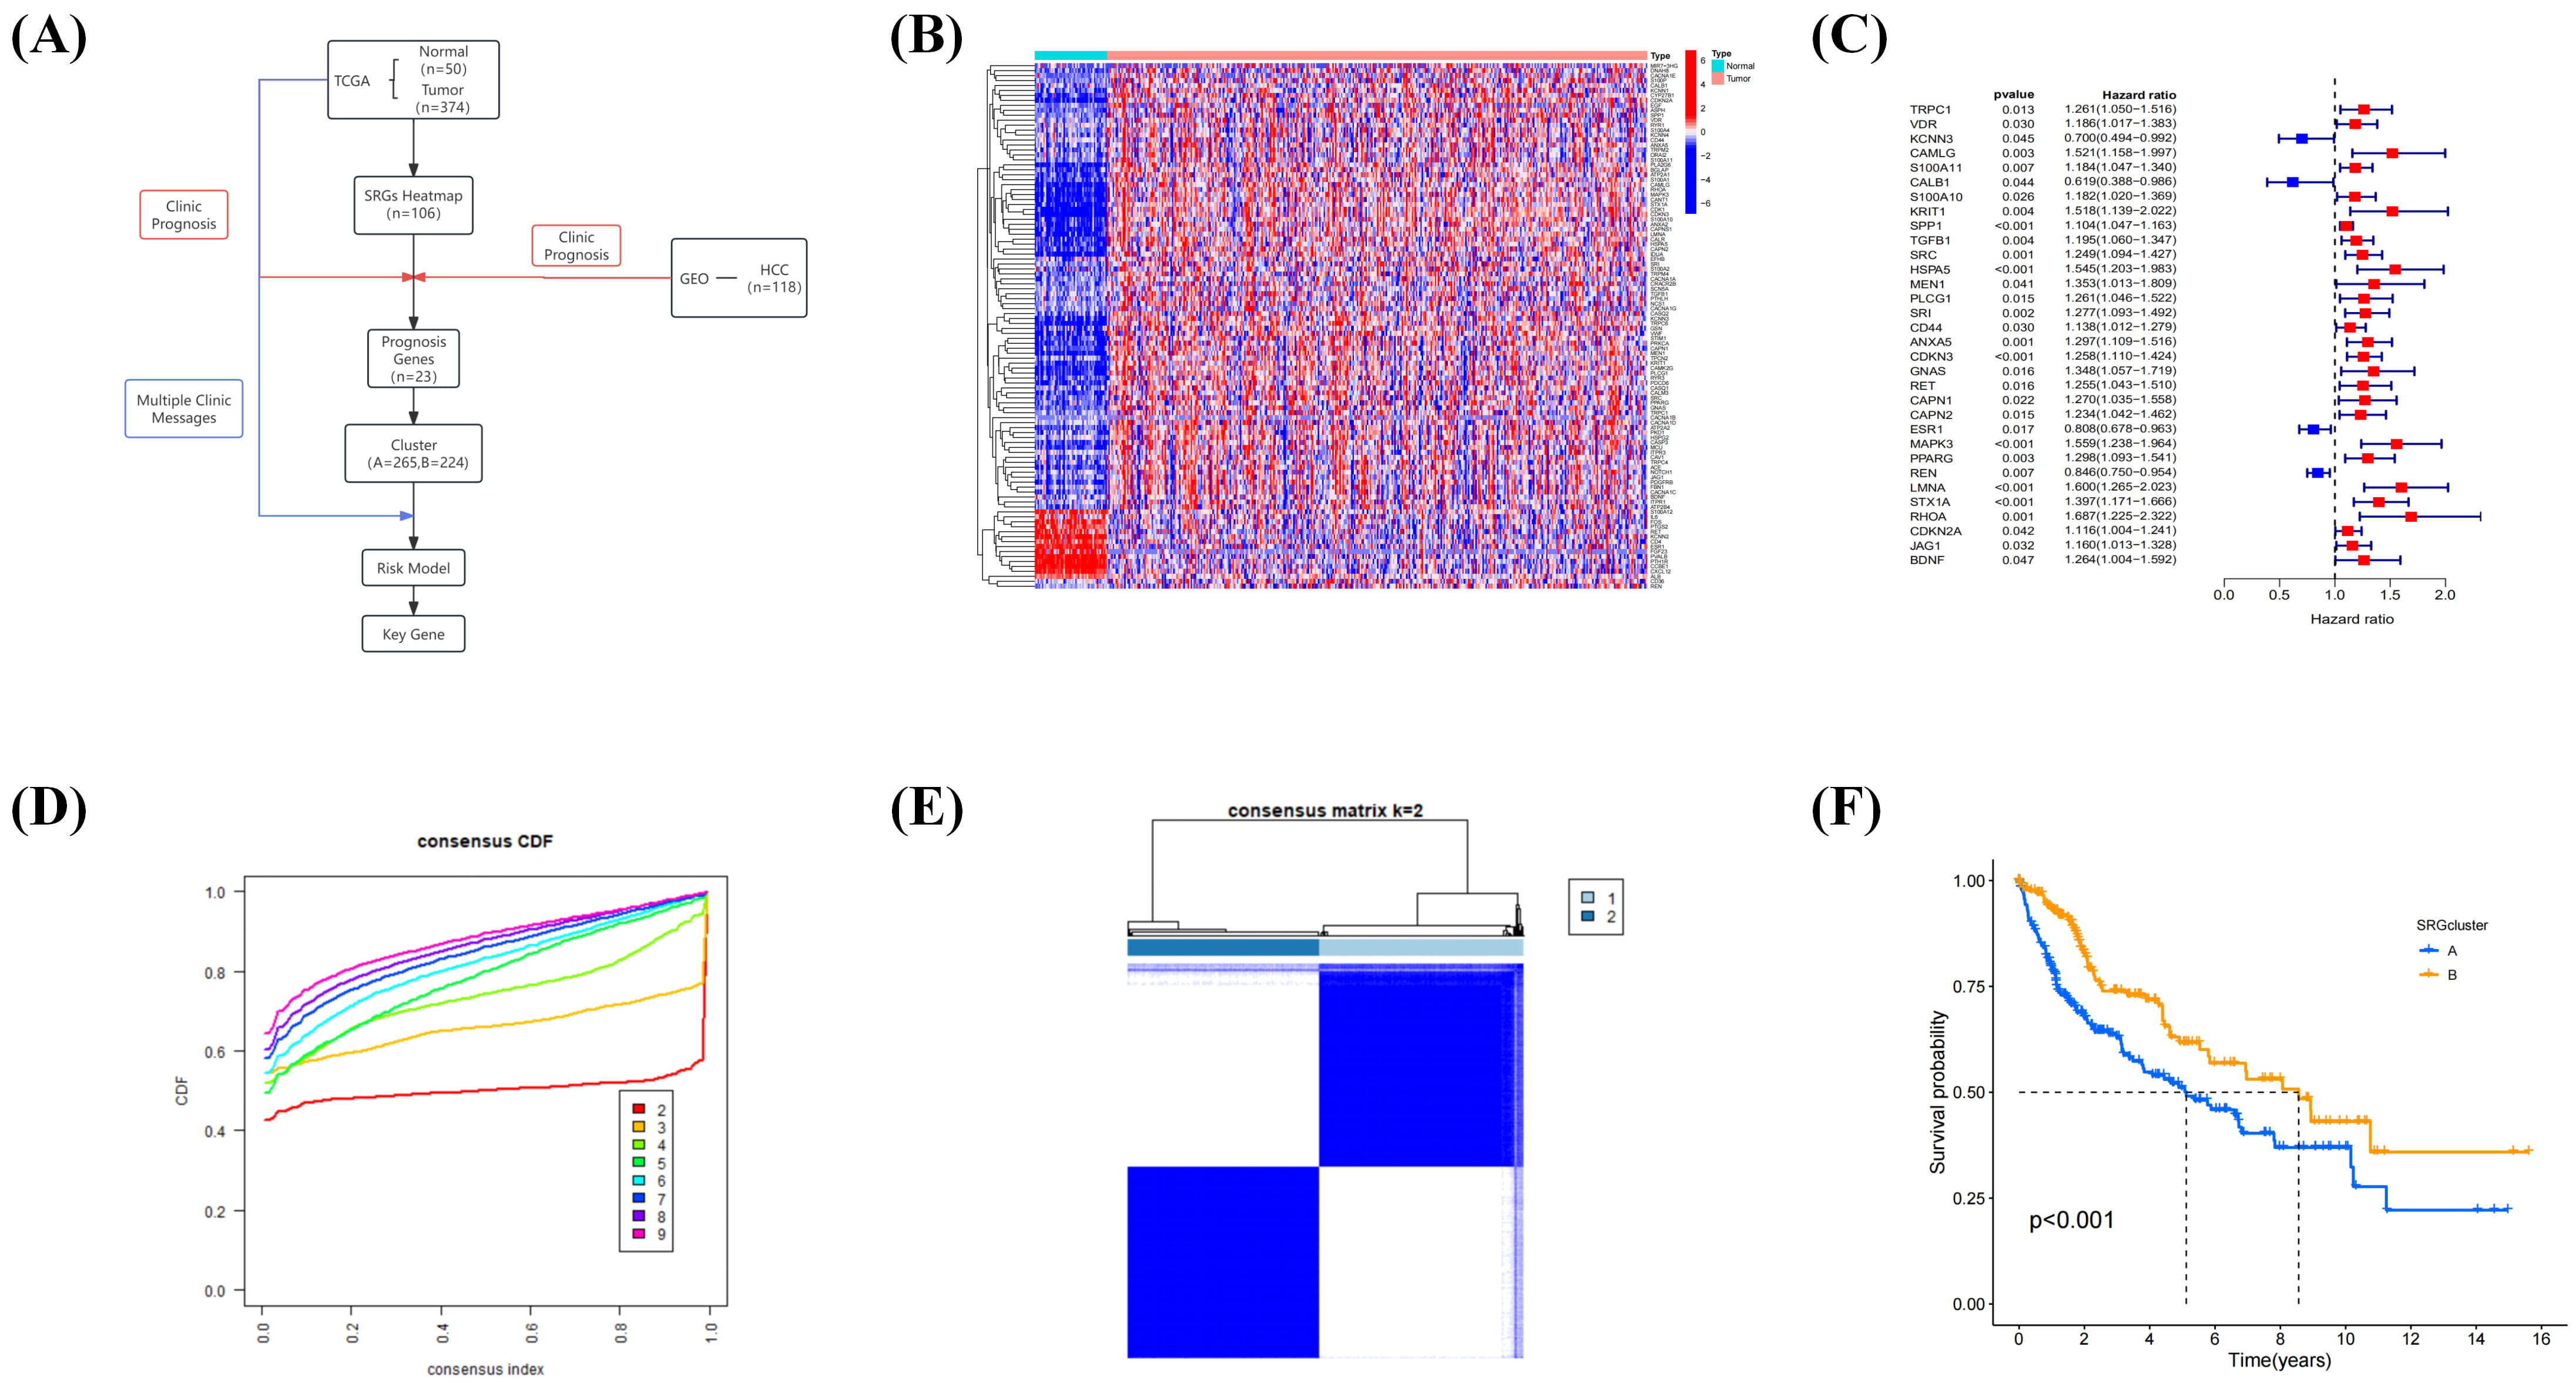 Fig. 2.
DEG heatmap to illustrate prognostic genes. (A) Bioinformatics
analysis workflow of this study. (B) Water blue represents normal sample tissues;
pink represents tumor tissues; and red and blue in the DEG heatmap correspond to
high and low gene expression, respectively. (C) Prognostic forest plot with color
HRs: blue indicates genes with protective roles (HR
In summary, differential expression and univariate Cox regression analyses identified a subset of SRGs associated with HCC prognosis, including 28 risk genes. Consensus clustering based on these prognostic SRGs divided patients into two distinct subgroups with significantly different OS, indicating that these gene clusters may serve as robust indicators of clinical outcomes in HCC.
To optimize the gene set, minimize overfitting, and select the most informative
prognostic markers, we applied the LASSO regression. Based on the optimal penalty
parameter (
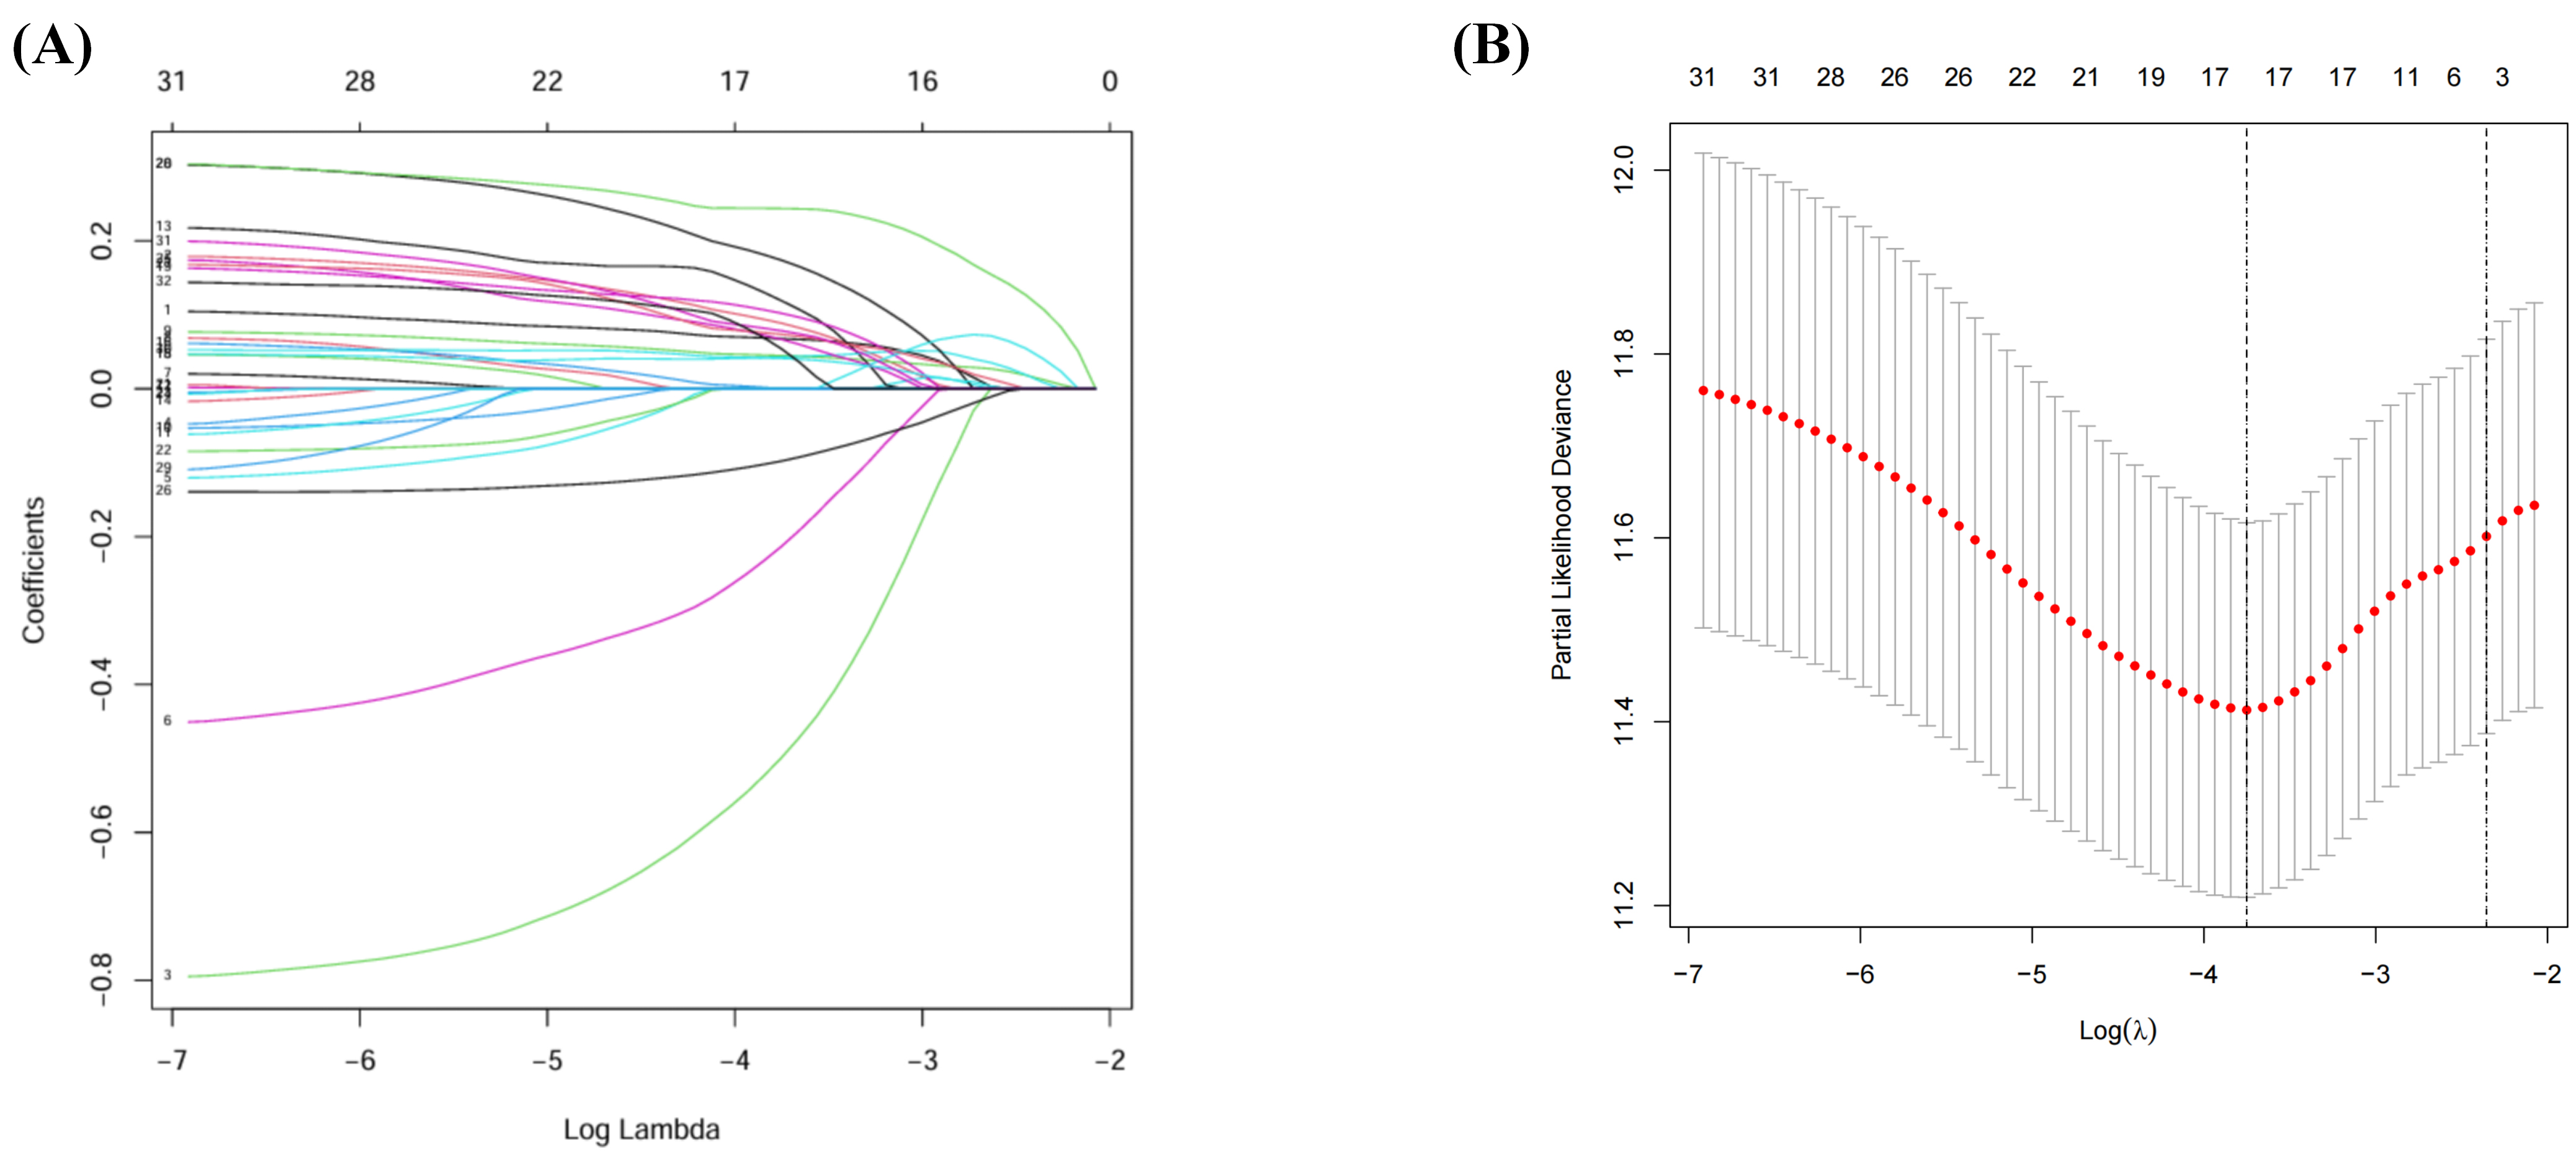 Fig. 3.
Identification of risk signature. (A) LASSO regression of the OS-related genes. (B) Cross-validation for tuning the parameter selection in the LASSO regression. LASSO, least absolute shrinkage and selection operator.
In summary, LASSO regression enabled the identification of a concise 17-gene signature, and the derived risk scores provide a quantitative measure of patient prognosis in HCC.
To evaluate the prognostic value of the refined SRG signature, a risk score was
calculated for each patient in the TCGA and GEO cohorts. Patients were stratified
into low- and high-risk groups based on the median risk score. Kaplan–Meier
analysis revealed a significant difference in OS, with patients in the low-risk
group exhibiting markedly longer survival times than those in the high-risk group
(p
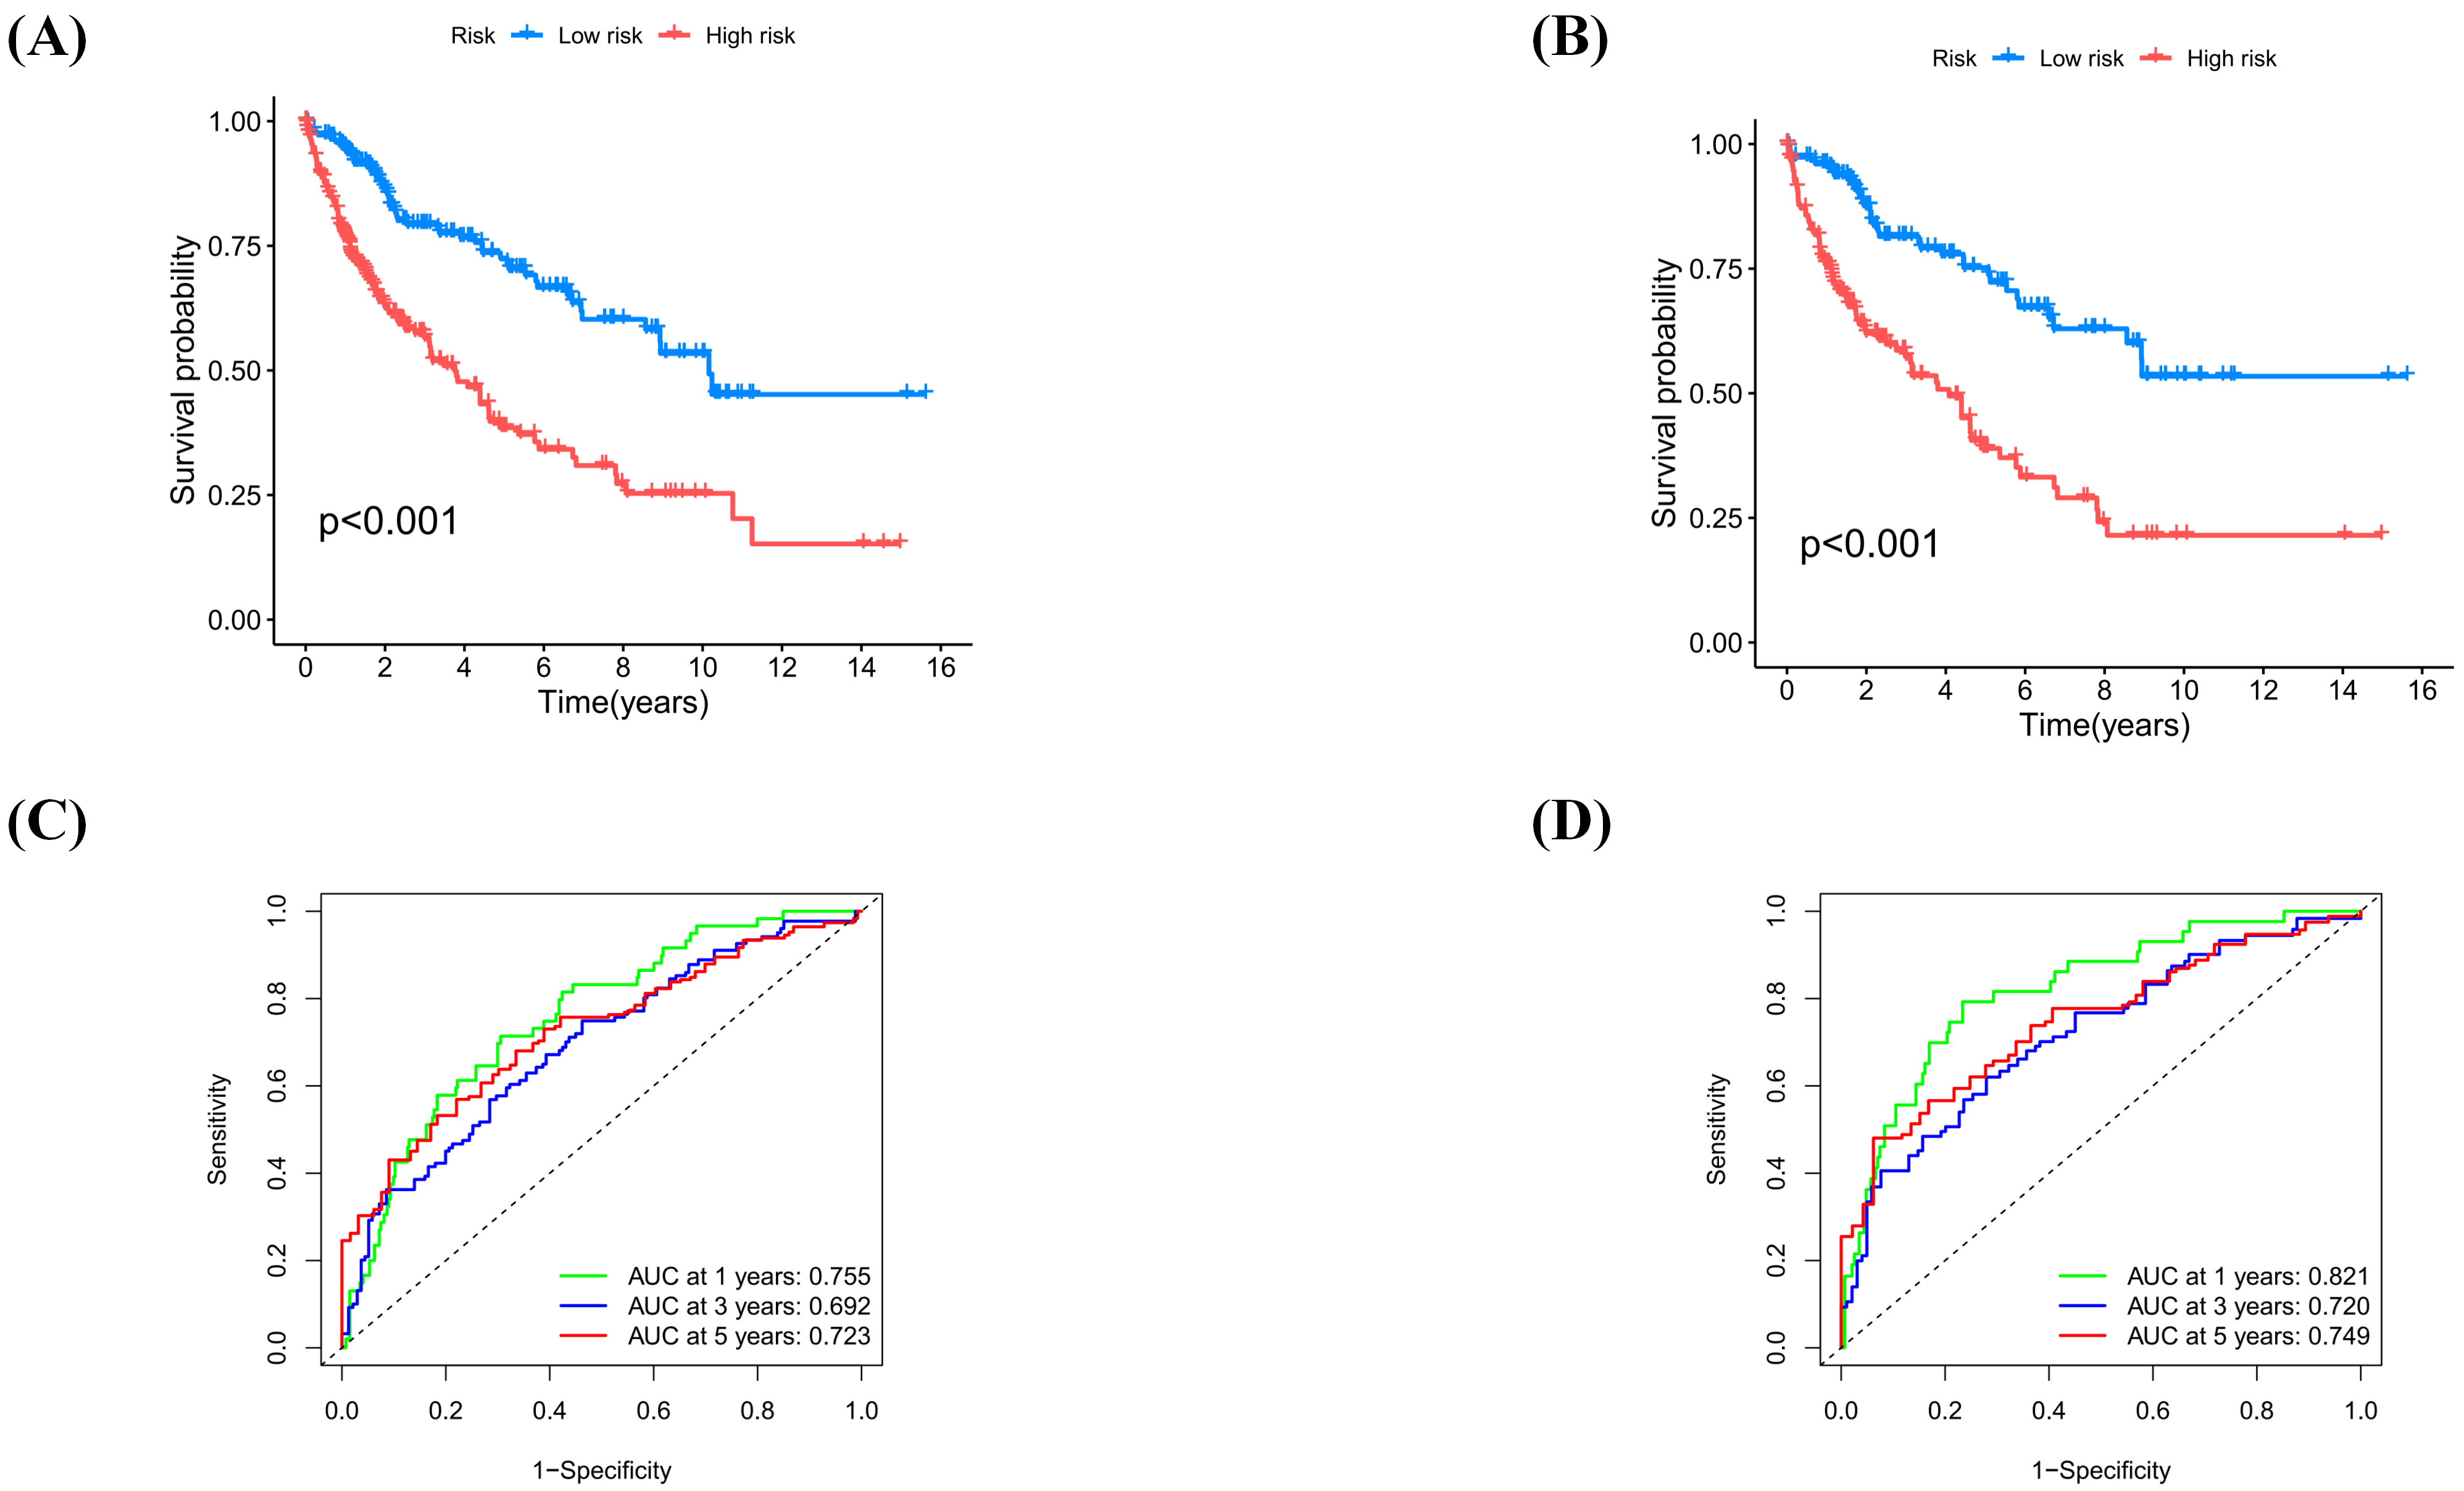 Fig. 4.
Validation of risk signature in TCGA and GEO cohort. (A)
Kaplan–Meier curves for the entire cohort show blue (low-risk) and red
(high-risk) groups (p
Overall, the SOCE-related prognostic signature successfully categorized patients into distinct risk groups that exhibited significant differences in clinical outcomes.
Multivariate Cox regression analysis was conducted to identify which genes within the 17-gene LASSO-derived prognostic signature had independent prognostic significance. This analysis identified nine genes as factors with independent prognostic value. A heatmap illustrating the expression patterns of these nine genes was created to visualize their relationship with patient outcomes (Fig. 5A).
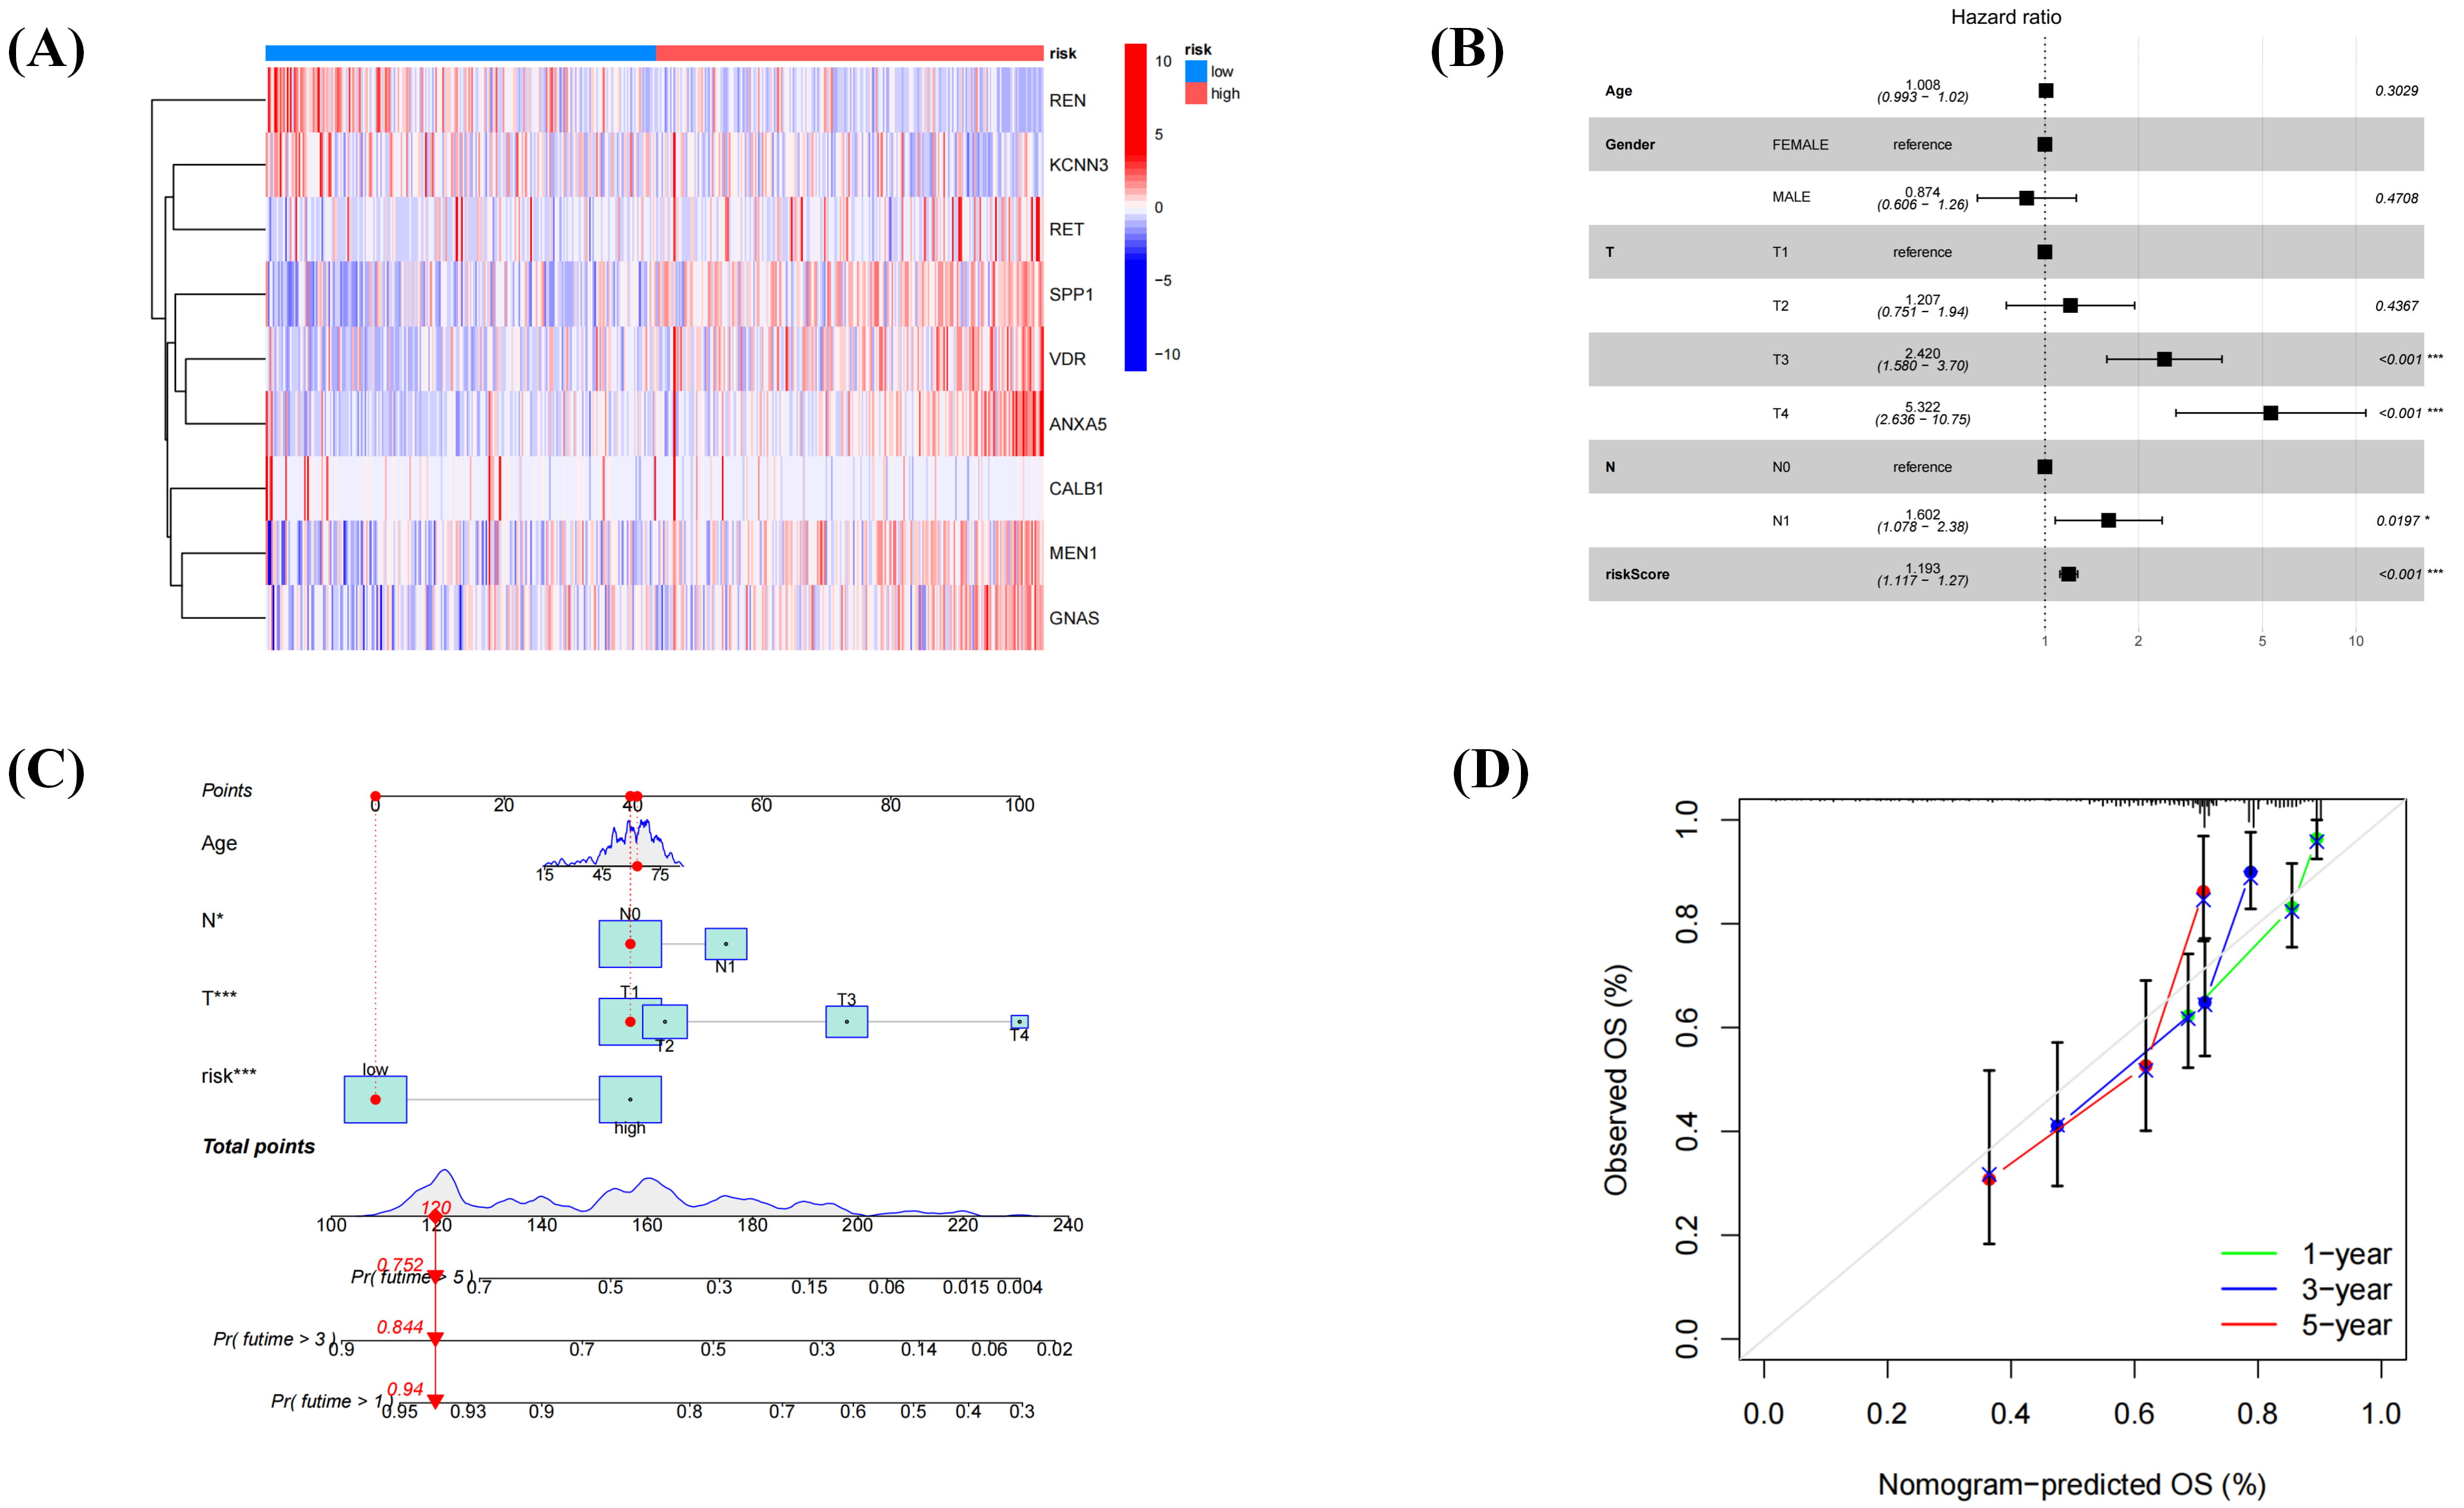 Fig. 5.
Refinement of the prognostic signature and construction of a nomogram. (A) The risk heatmap shows nine genes. (B) Forest plot illustrating independent prognostic factors. (C) The nomogram incorporates four risk factors: age, T stage, N stage, and risk score. A specific point value is assigned to each factor on its corresponding scale. The total points are the sum of all four factors. A vertical line drawn from the total points axis to the outcome axes provides approximate predictions of the patient’s 1-, 3-, and 5-year OS probabilities, as illustrated by the red vertical line in the figure. (D) The calibration curve of the nomogram shows that the green, blue, and red lines represent 1-, 3-, and 5-year survival probability calibrations, respectively.
Subsequently, the relationship between these nine genes and key
clinicopathological factors was evaluated using multivariate analysis, and the
results were visualized as a forest plot (Fig. 5B). The analysis revealed
significant correlations between these genes and tumor T stage and N stage
(p
By integrating the remaining variables, an individualized prognostic nomogram was generated to predict 1-, 3-, and 5-year OS probabilities (Fig. 5C). Curve analysis demonstrated strong concordance between the model’s predicted and actual survival outcomes (Fig. 5D). Closer examination of the heatmap focused on risk-associated genes, and found that six (rearranged during transfection [RET], secreted phosphoprotein 1/osteopontin [SPP1], vitamin D receptor [VDR], annexin A5 [ANXA5], menin 1 [MEN1], and GNAS complex locus [GNAS]) were upregulated in the high-risk group, marking them as candidates for further analysis.
In summary, multivariate Cox regression identified nine genes with independent prognostic value, and their expression patterns were associated with key clinicopathological features such as tumor T and N stages. An individualized nomogram incorporating these variables reliably predicted 1-, 3-, and 5-year OS, with calibration curves confirming strong agreement between predicted and observed outcomes. Among the risk-associated genes, six (RET, SPP1, VDR, ANXA5, MEN1, and GNAS) were notably upregulated in the high-risk group, highlighting their potential relevance in HCC progression and patient prognosis.
To systematically investigate the enrichment patterns of the aforementioned six high-risk genes within the tumor immune microenvironment, we conducted a detailed analysis of each gene using the TISCH2 database, with representative results illustrated using the HCC dataset LIHC-GSE140228 (Fig. 6A). The analysis revealed that the key gene ANXA5 is highly expressed across multiple immune cell types, with notable enrichment particularly in dendritic cells and macrophages (Fig. 6B,C), suggesting its potential involvement in antigen presentation and innate immune regulation. In contrast, the other five genes showed generally low expression levels across various immune cells without significant enrichment. Although GNAS exhibited relatively high expression in certain cell populations, its expression pattern lacked cell type specificity and appeared diffuse, and thus was not pursued further. Based on these findings and established evidence linking ANXA5 to tumor progression, metastasis, and poor clinical outcomes in diverse cancers—including HCC—we selected it as a key gene for subsequent mechanistic investigation. Studies have shown that overexpressed ANXA5 in HCC is linked to malignant phenotypes and poor prognoses in in vitro and in vivo models [14, 43, 44, 45]. Furthermore, high ANXA5 expression is significantly correlated with aggressive clinicopathological features and poor survival in various solid tumors [46, 47, 48, 49]. To further elucidate the biological functions and regulatory networks of ANXA5, we constructed a protein–protein interaction network. Our analysis demonstrated a high-confidence interaction between ANXA5 and GAPDH (Fig. 6D), indicating their potential synergy in cellular metabolic regulation and immune responses. This finding provides a critical molecular clue for future functional studies.
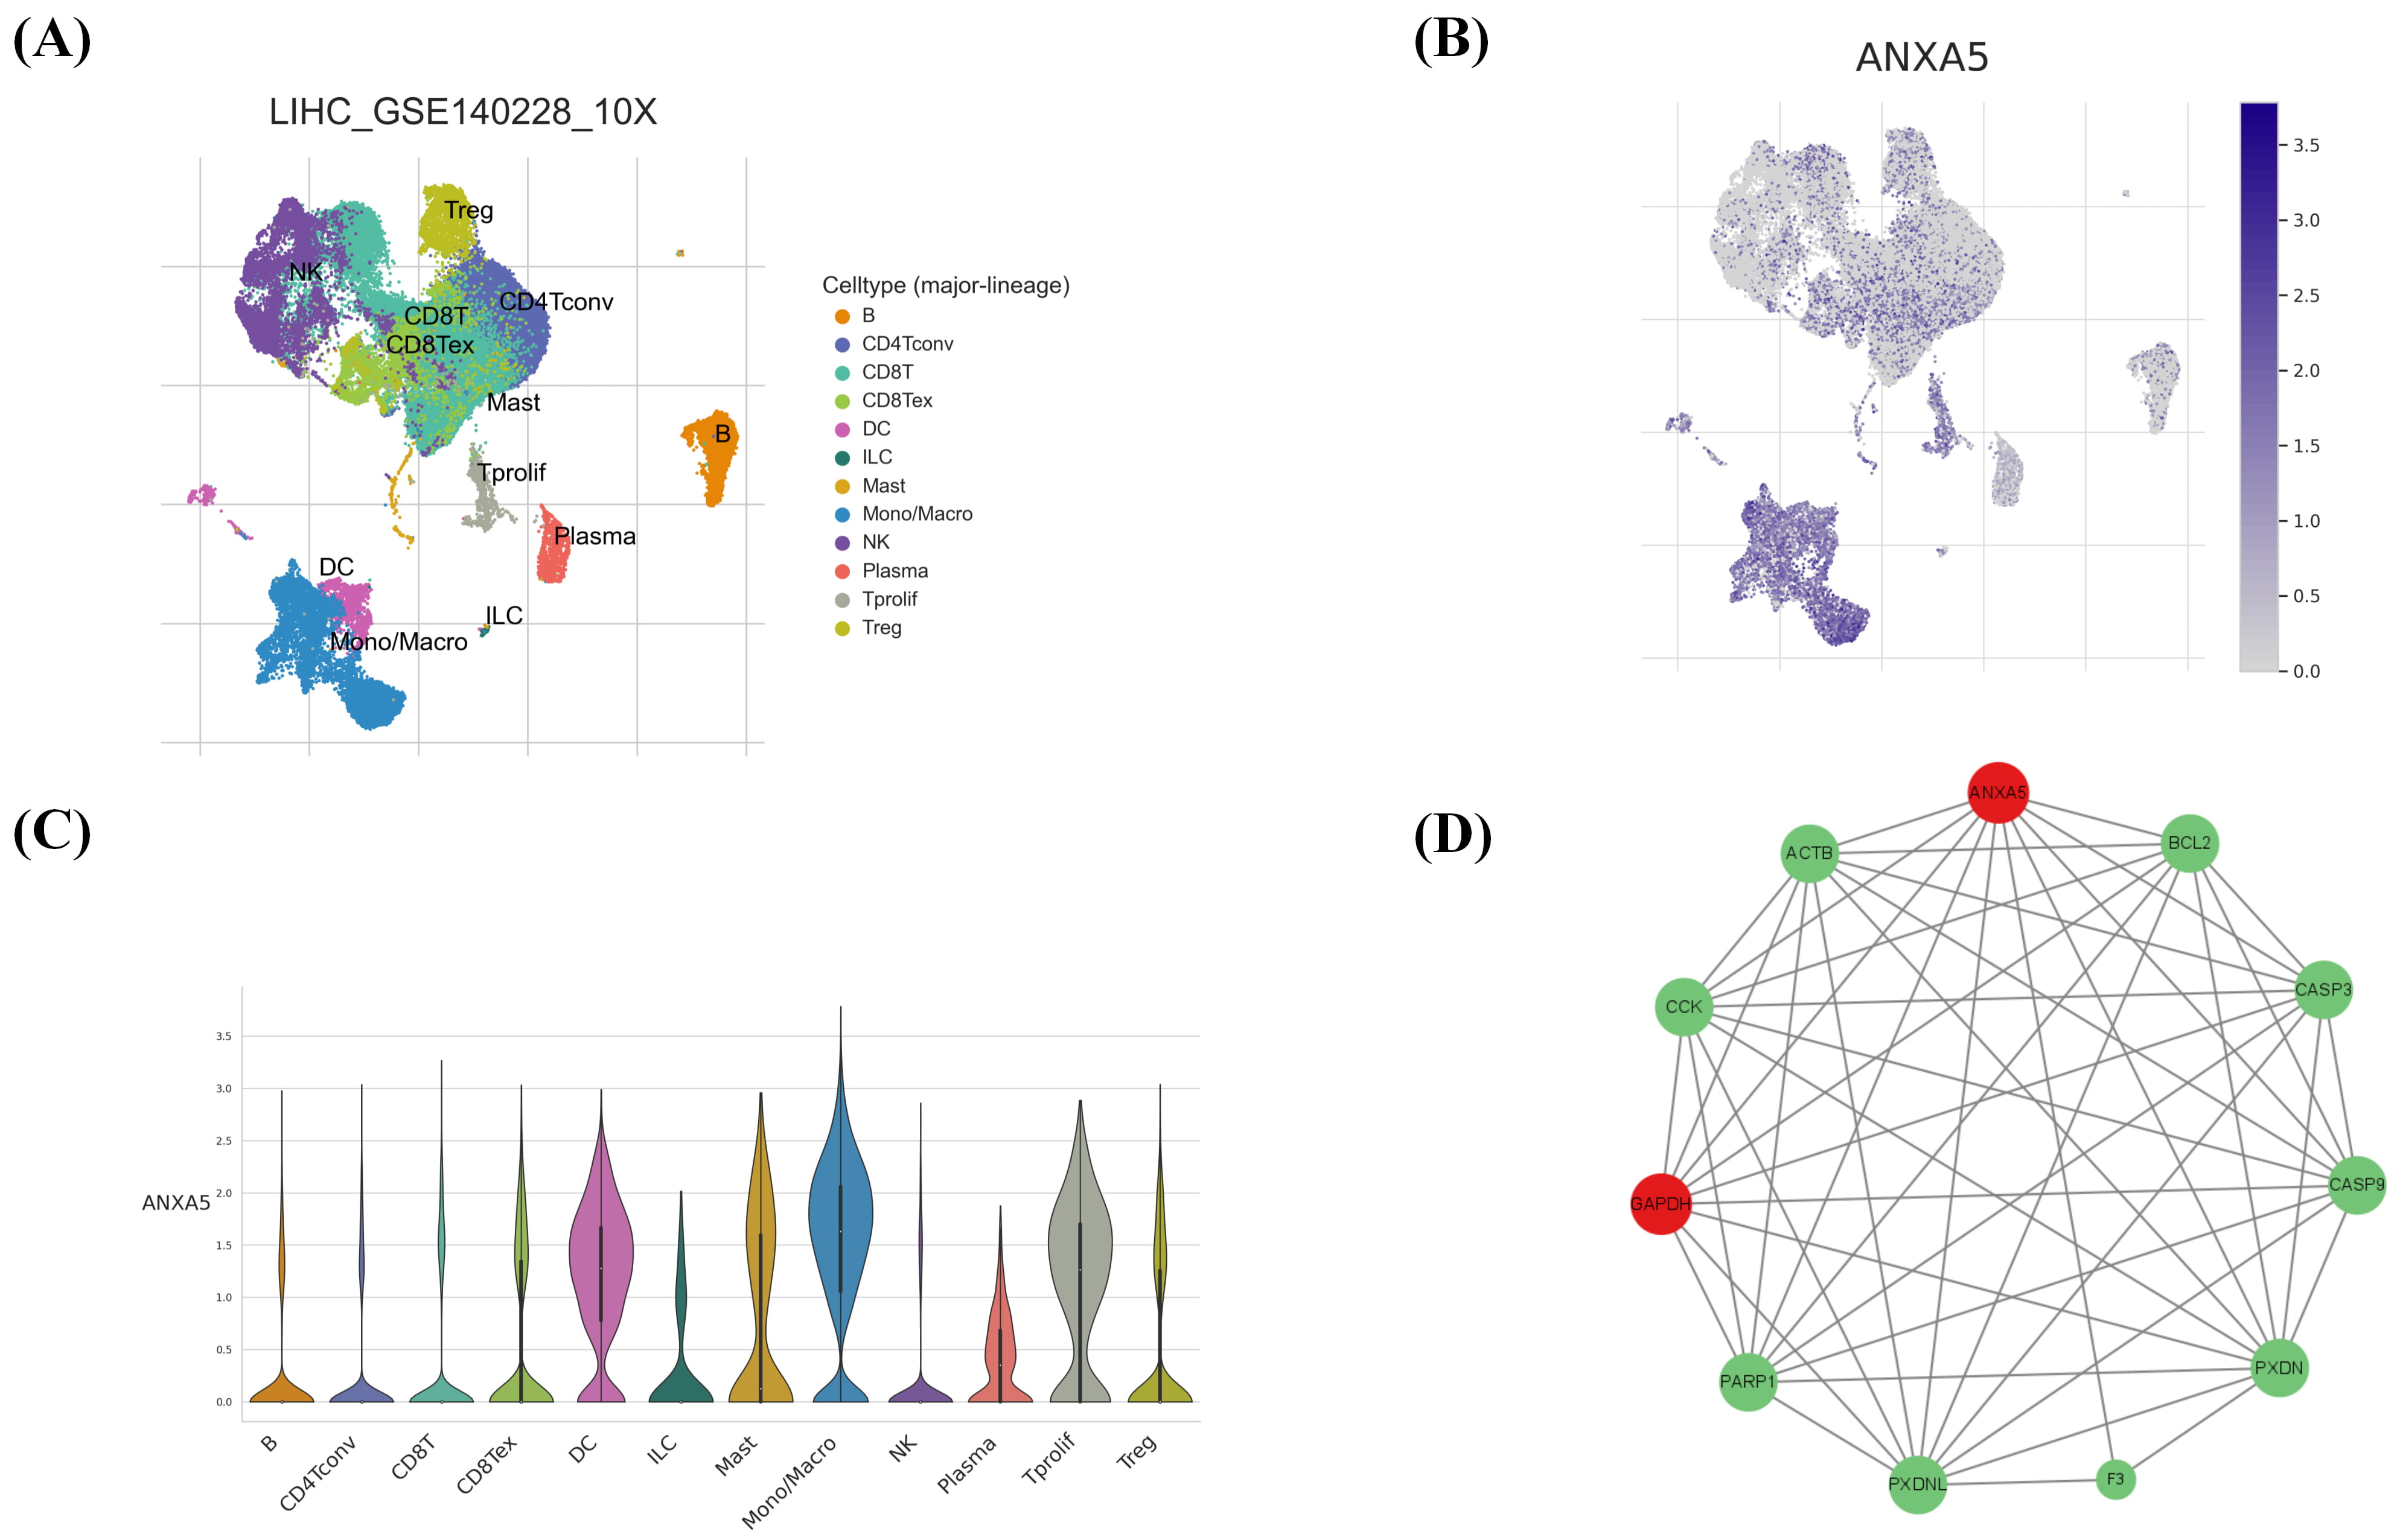 Fig. 6.
Immune cell distribution map in LIHC-GSE140228. (A) Example of an immune cell distribution map; different colors represent different immune cells. (B) The map shows the distribution of the key gene ANXA5, with color intensity representing the degree of enrichment. (C) Immune cell expression of the key gene ANXA5, with column height representing enrichment degree. (D) The protein–protein interaction network demonstrated a strong interaction between ANXA5 and GAPDH. Node size represents the number of interactions, with larger nodes indicating greater connectivity. Since most proteins (except F3) had similar interaction counts, size differences were minimal. The most connected nodes, ANXA5 and GAPDH, are marked in red. Panels (A–C) were generated using the TISCH2 database (https://tisch.compbio.cn/gallery/). Panel (D) was constructed based on data obtained from the STRING database (version 12.0; https://cn.string-db.org/) and visualized using Cytoscape (v3.9.0).
In summary, while ANXA5 expression was detected in immune cell subsets within the tumor microenvironment—a topic for future research—this study primarily focused on investigating its functional role in key HCC malignant phenotypes, including proliferation, invasion, and metastatic potential.
To assess transfection efficiency, ANXA5 expression was evaluated in WT, NC, and
three ANXA5-targeting shRNA groups (shRNA-ANXA5(h)-1, shRNA-ANXA5(h)-2,
shRNA-ANXA5(h)-3) using Western blotting and qPCR. The results demonstrated that
shRNA-ANXA5(h)-1 was the most effective sequence for KD (Fig. 7A–C), whereas no
significant difference was observed between the WT and NC groups (p
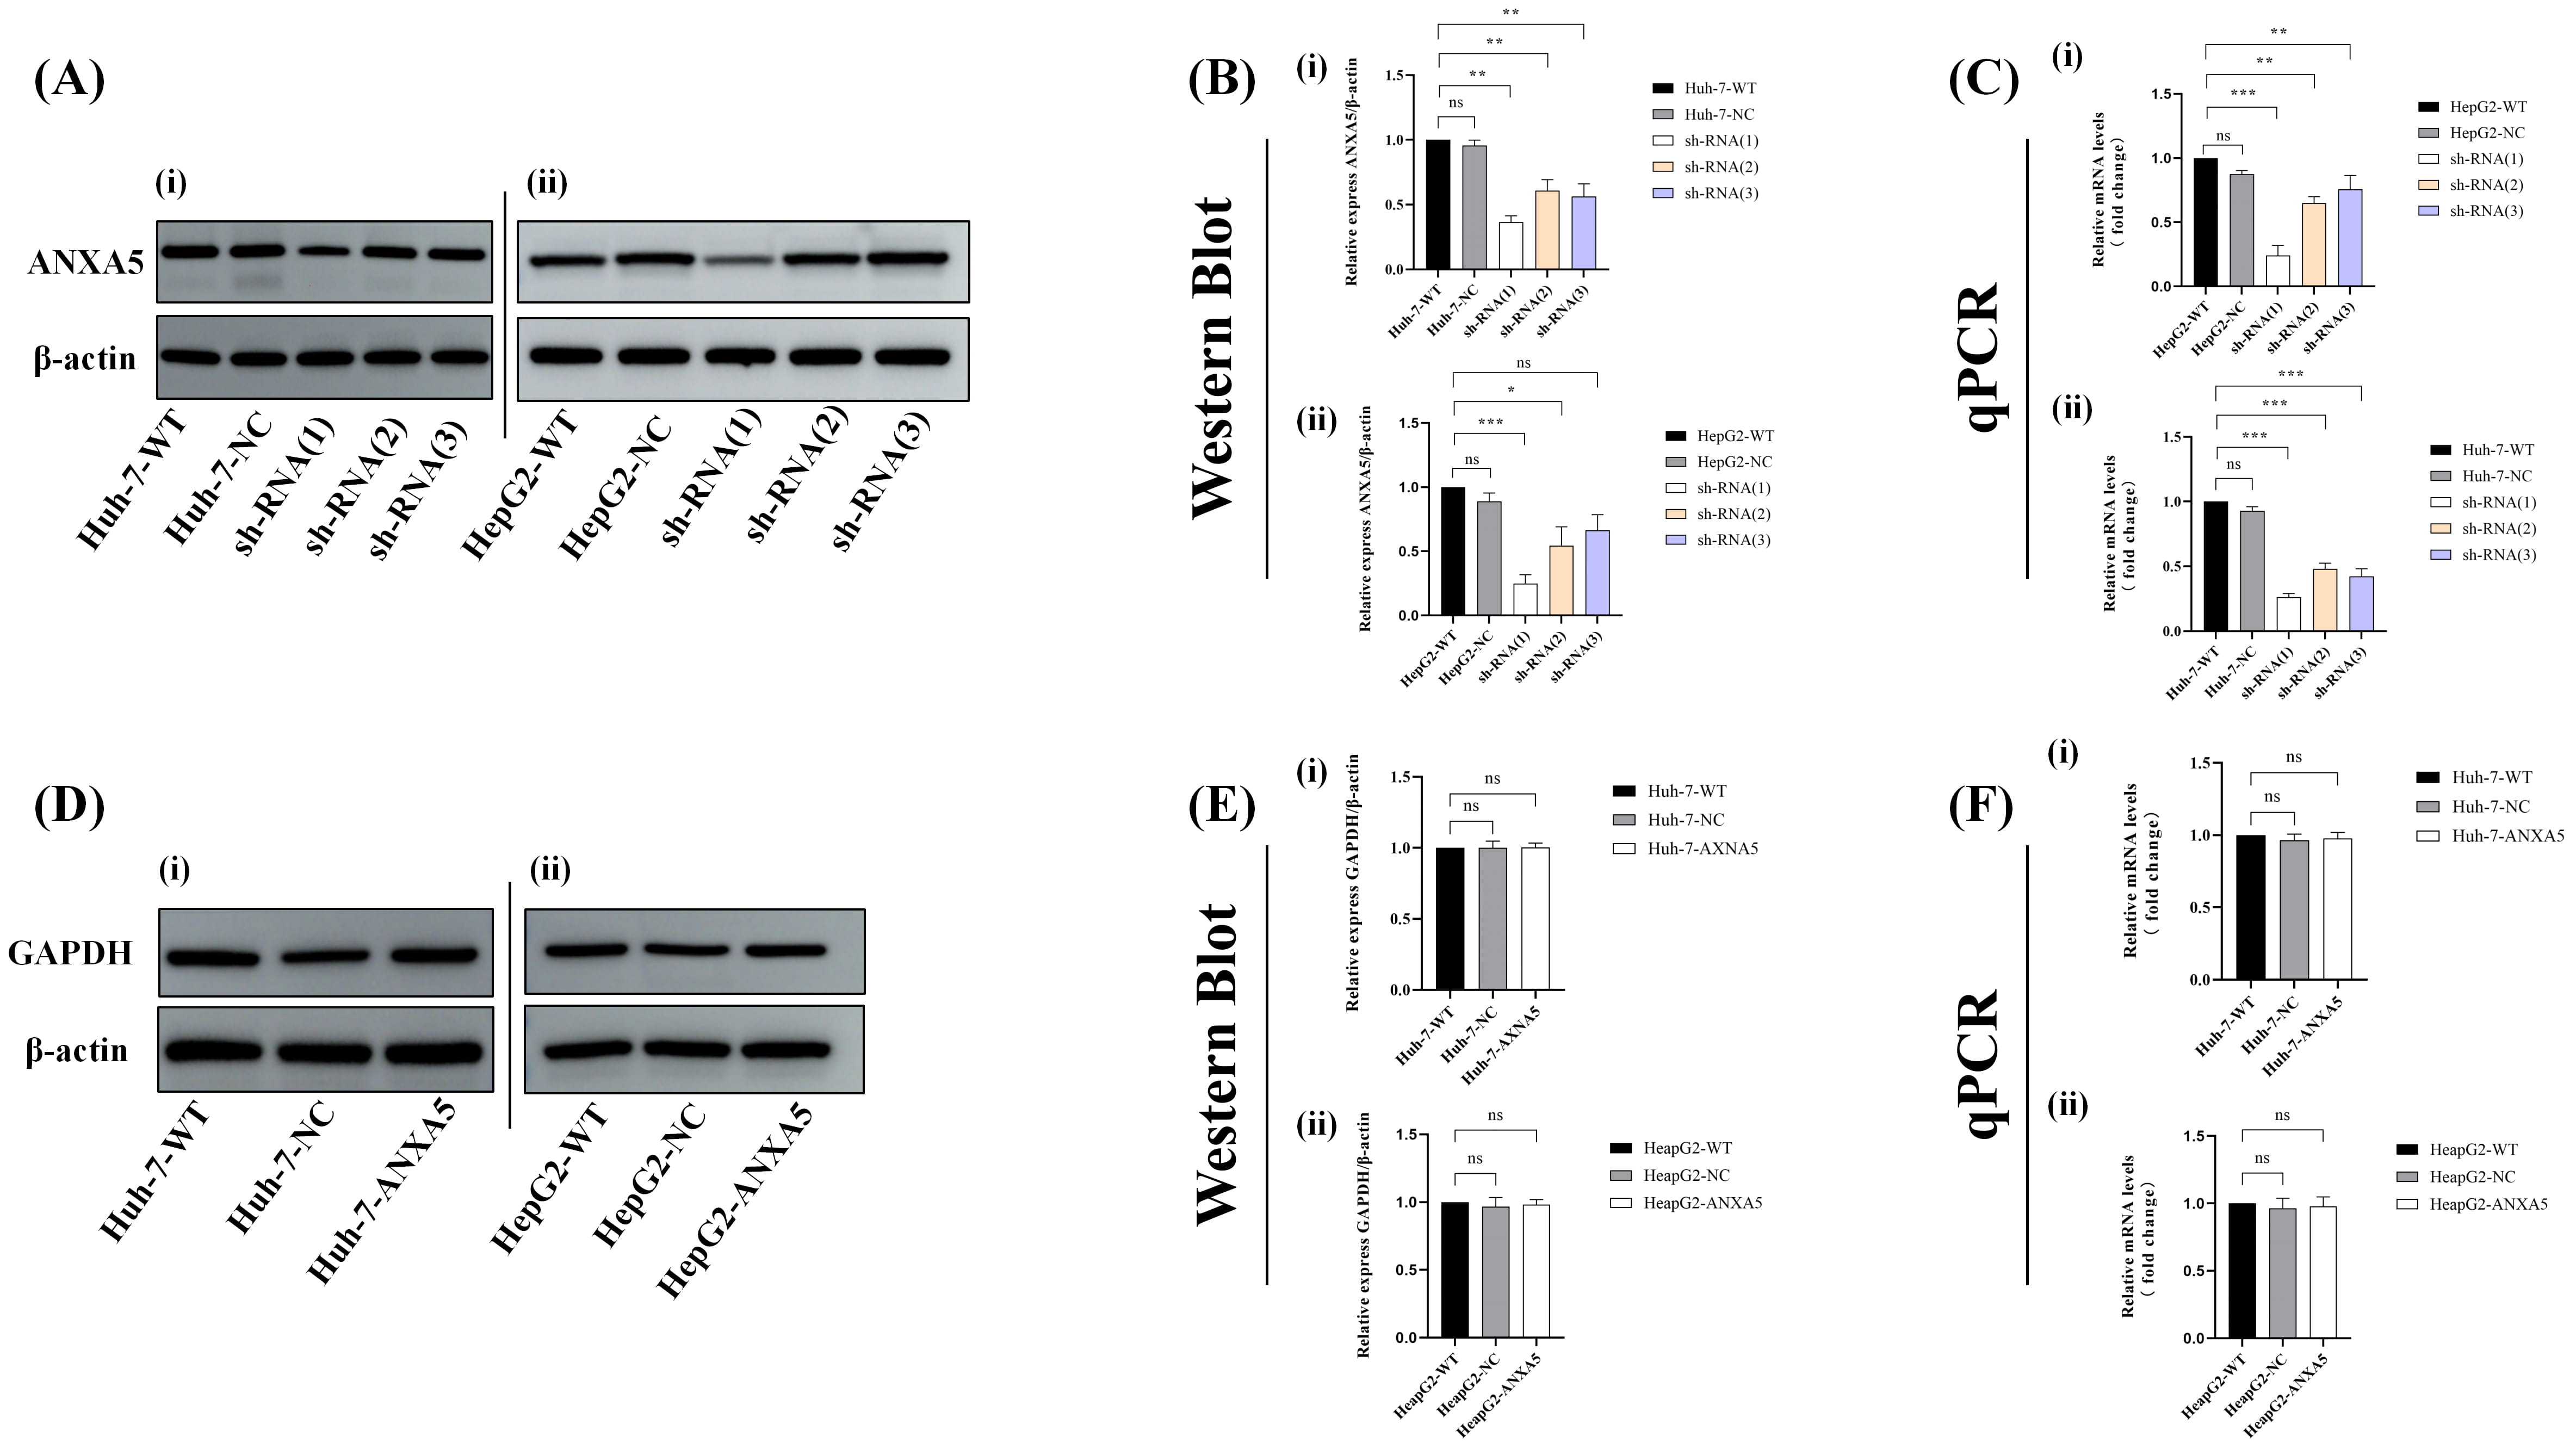 Fig. 7.
Western blotting and qPCR analysis of ANXA5 and GAPDH
expression. (A) Western blot bands of ANXA5. (B) Quantitative analysis of ANXA5
protein expression based on Western blot band intensity (p
Western blotting and qPCR analyses across WT, NC, and ANXA5-KD groups
consistently demonstrated that ANXA5 KD did not significantly alter GAPDH
expression levels (p
To determine whether the interaction between ANXA5 and GAPDH depends on ANXA5
expression levels, co-IP assays were conducted in WT, NC, and ANXA5-KD cells.
Input analysis confirmed comparable GAPDH expression levels across all groups,
whereas ANXA5-KD cells exhibited a significant reduction in ANXA5 levels. Co-IP
using an anti-ANXA5 antibody followed by immunoblotting for GAPDH revealed a
notable ANXA5–GAPDH interaction in WT and NC cells, which was substantially
diminished in the ANXA5-KD group. No GAPDH signal was detected in the IgG control
IP (Fig. 8A). Quantitative analysis of input samples showed no significant
differences in GAPDH expression among the groups (p
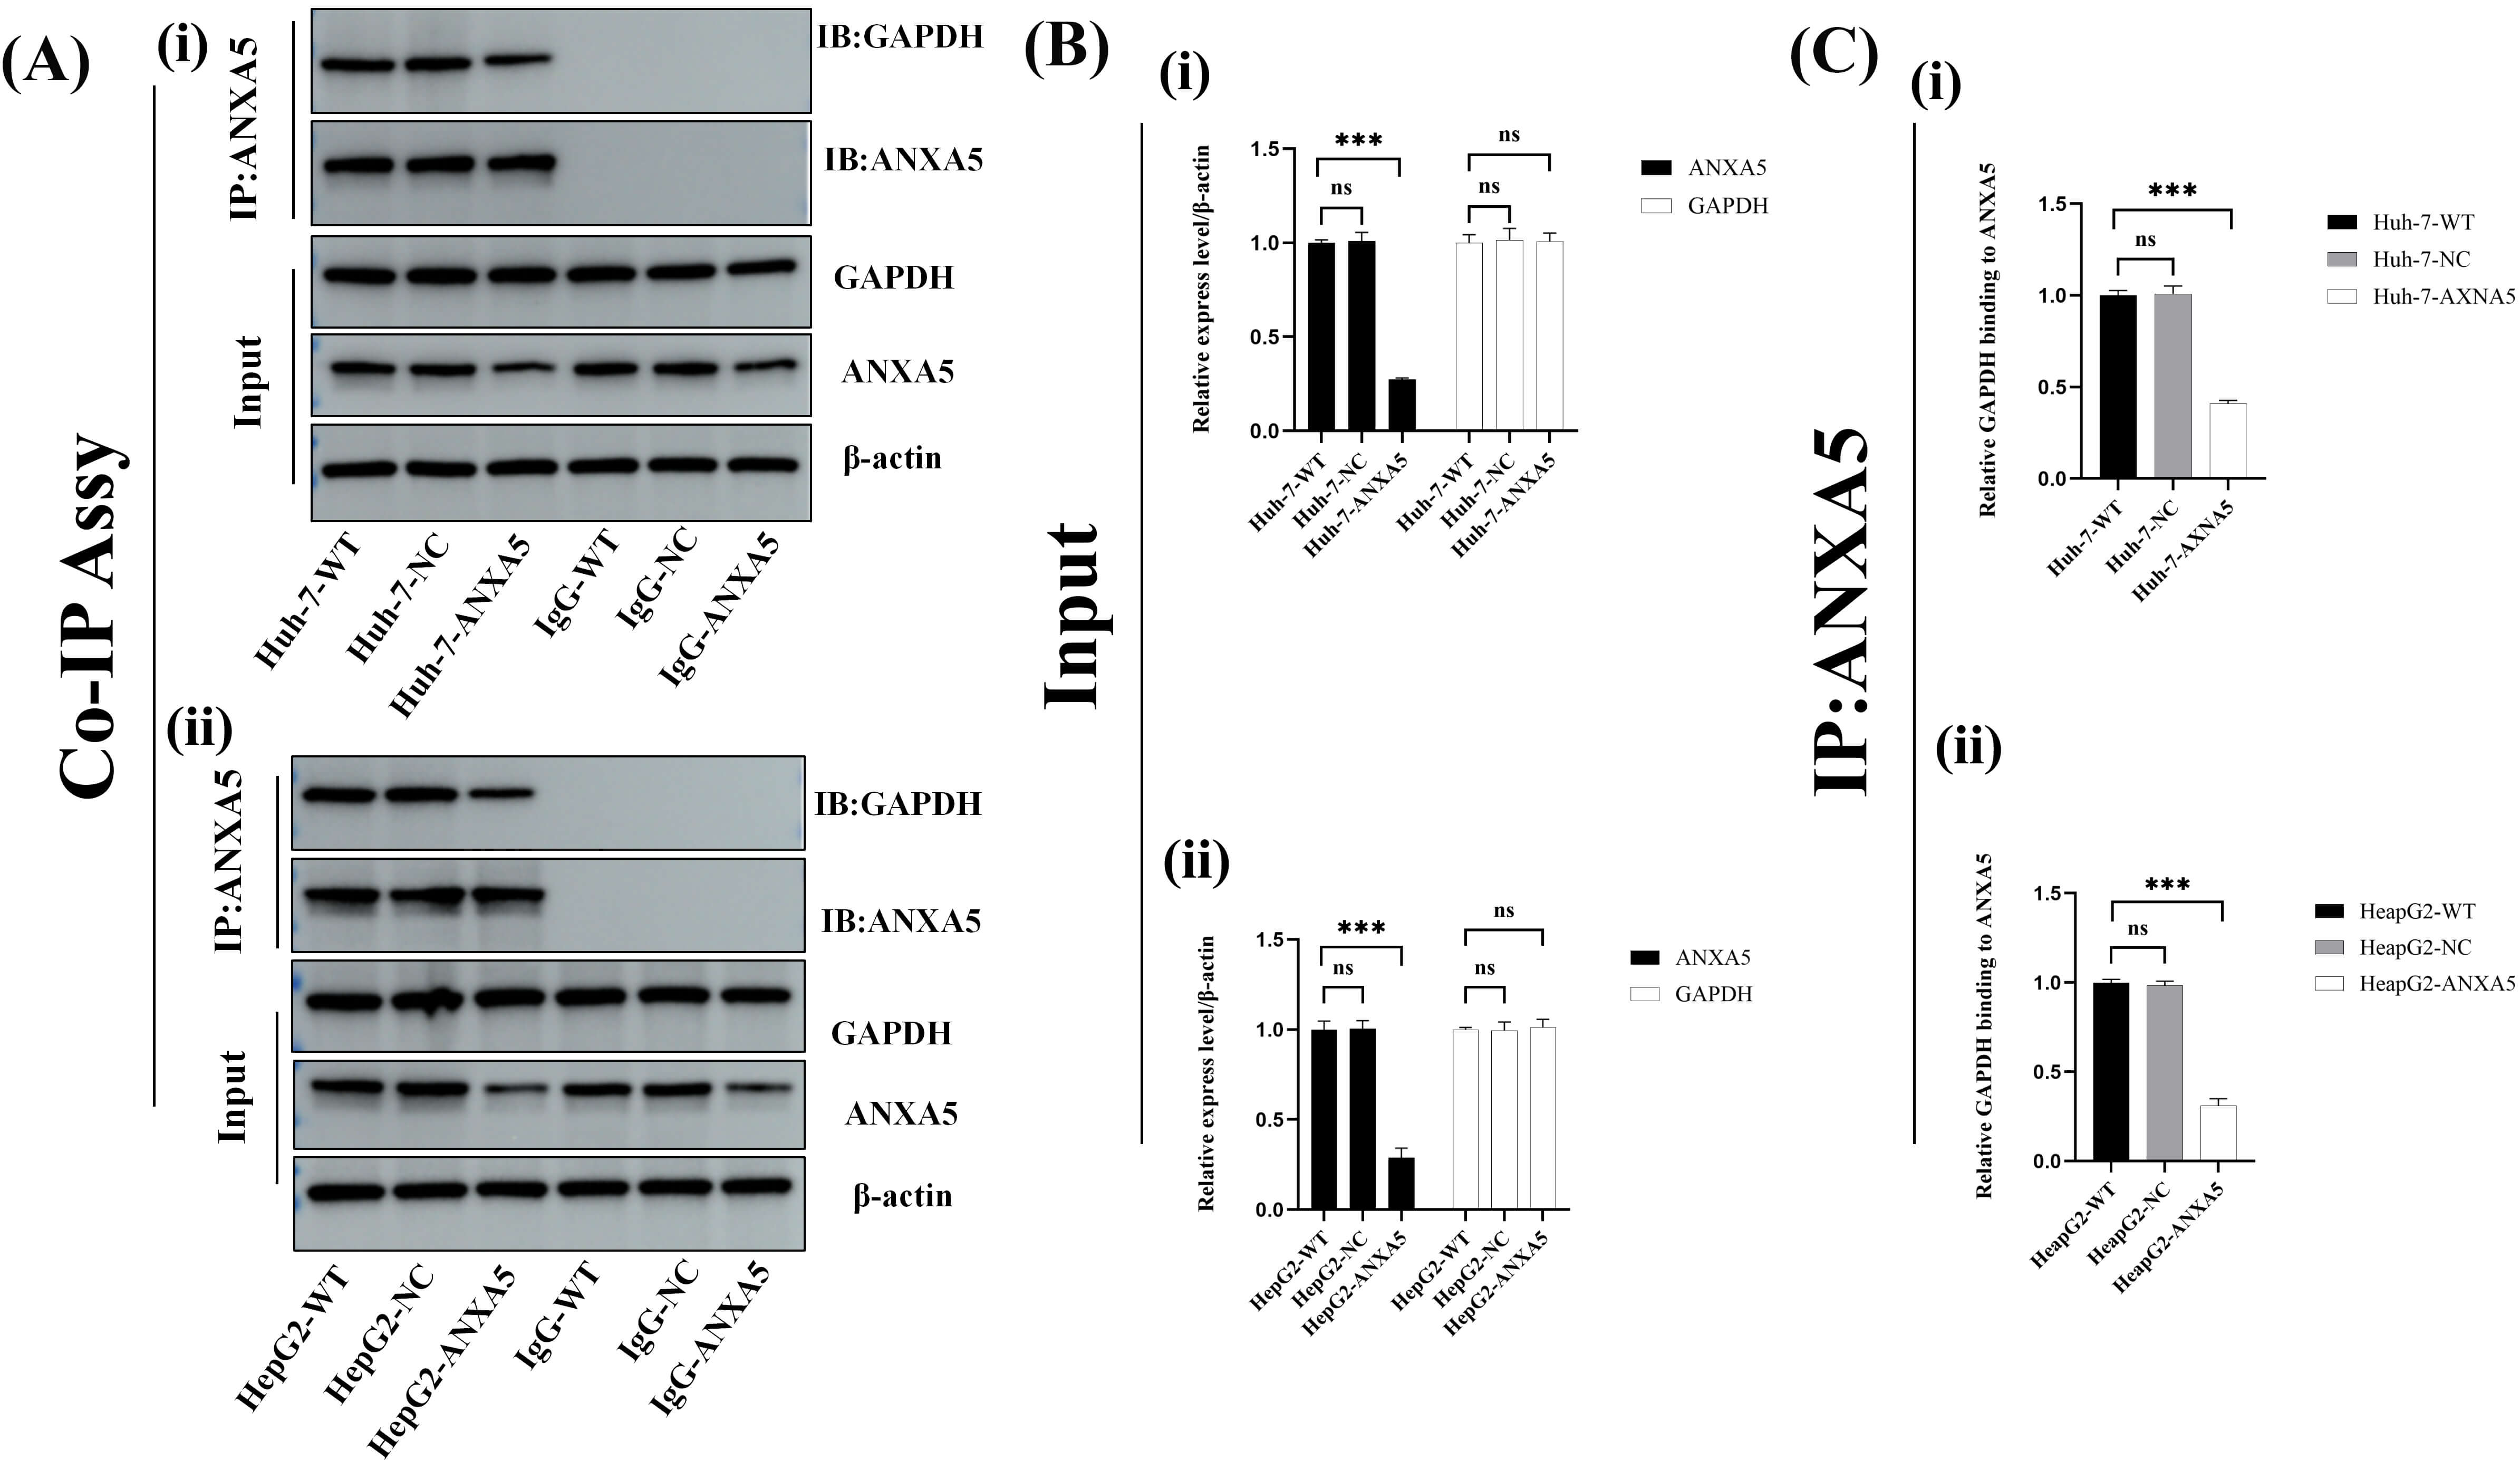 Fig. 8.
Interaction of ANXA5 with GAPDH by Co-IP. (A) Input bands
showed comparable GAPDH expression across all groups, whereas ANXA5 expression
was markedly reduced in ANXA5-KD cells. IP with an anti-ANXA5 antibody followed
by immunoblotting for GAPDH revealed a strong ANXA5–GAPDH interaction in WT and
NC cells, which was substantially diminished upon ANXA5-KD, whereas no GAPDH
signal was detected in the IgG IP control. (B) Quantitative analysis showed no
significant difference in GAPDH protein expression among input sample groups
(p
In summary, these findings indicate that ANXA5 forms a specific complex with GAPDH in HCC cells in an ANXA5-dependent manner. Importantly, ANXA5 depletion markedly weakened the ANXA5–GAPDH interaction without altering total GAPDH protein levels, suggesting that ANXA5 regulates GAPDH primarily via protein–protein interaction rather than expression control. This observation provides a mechanistic basis for subsequent analyses exploring how ANXA5 modulates GAPDH enzymatic activity and downstream metabolic and Ca2+ signaling pathways.
To systematically investigate the role of ANXA5 in the malignant behavior of HCC cells, functional assays including wound healing, CCK-8 proliferation, and flow cytometry-based apoptosis analysis were performed.
In the wound healing assay, ANXA5-KD cells exhibited significantly slower wound
closure compared with WT and NC cells (Fig. 9A). Quantitative analysis confirmed
a marked reduction in cell migration rate in the KD group (p
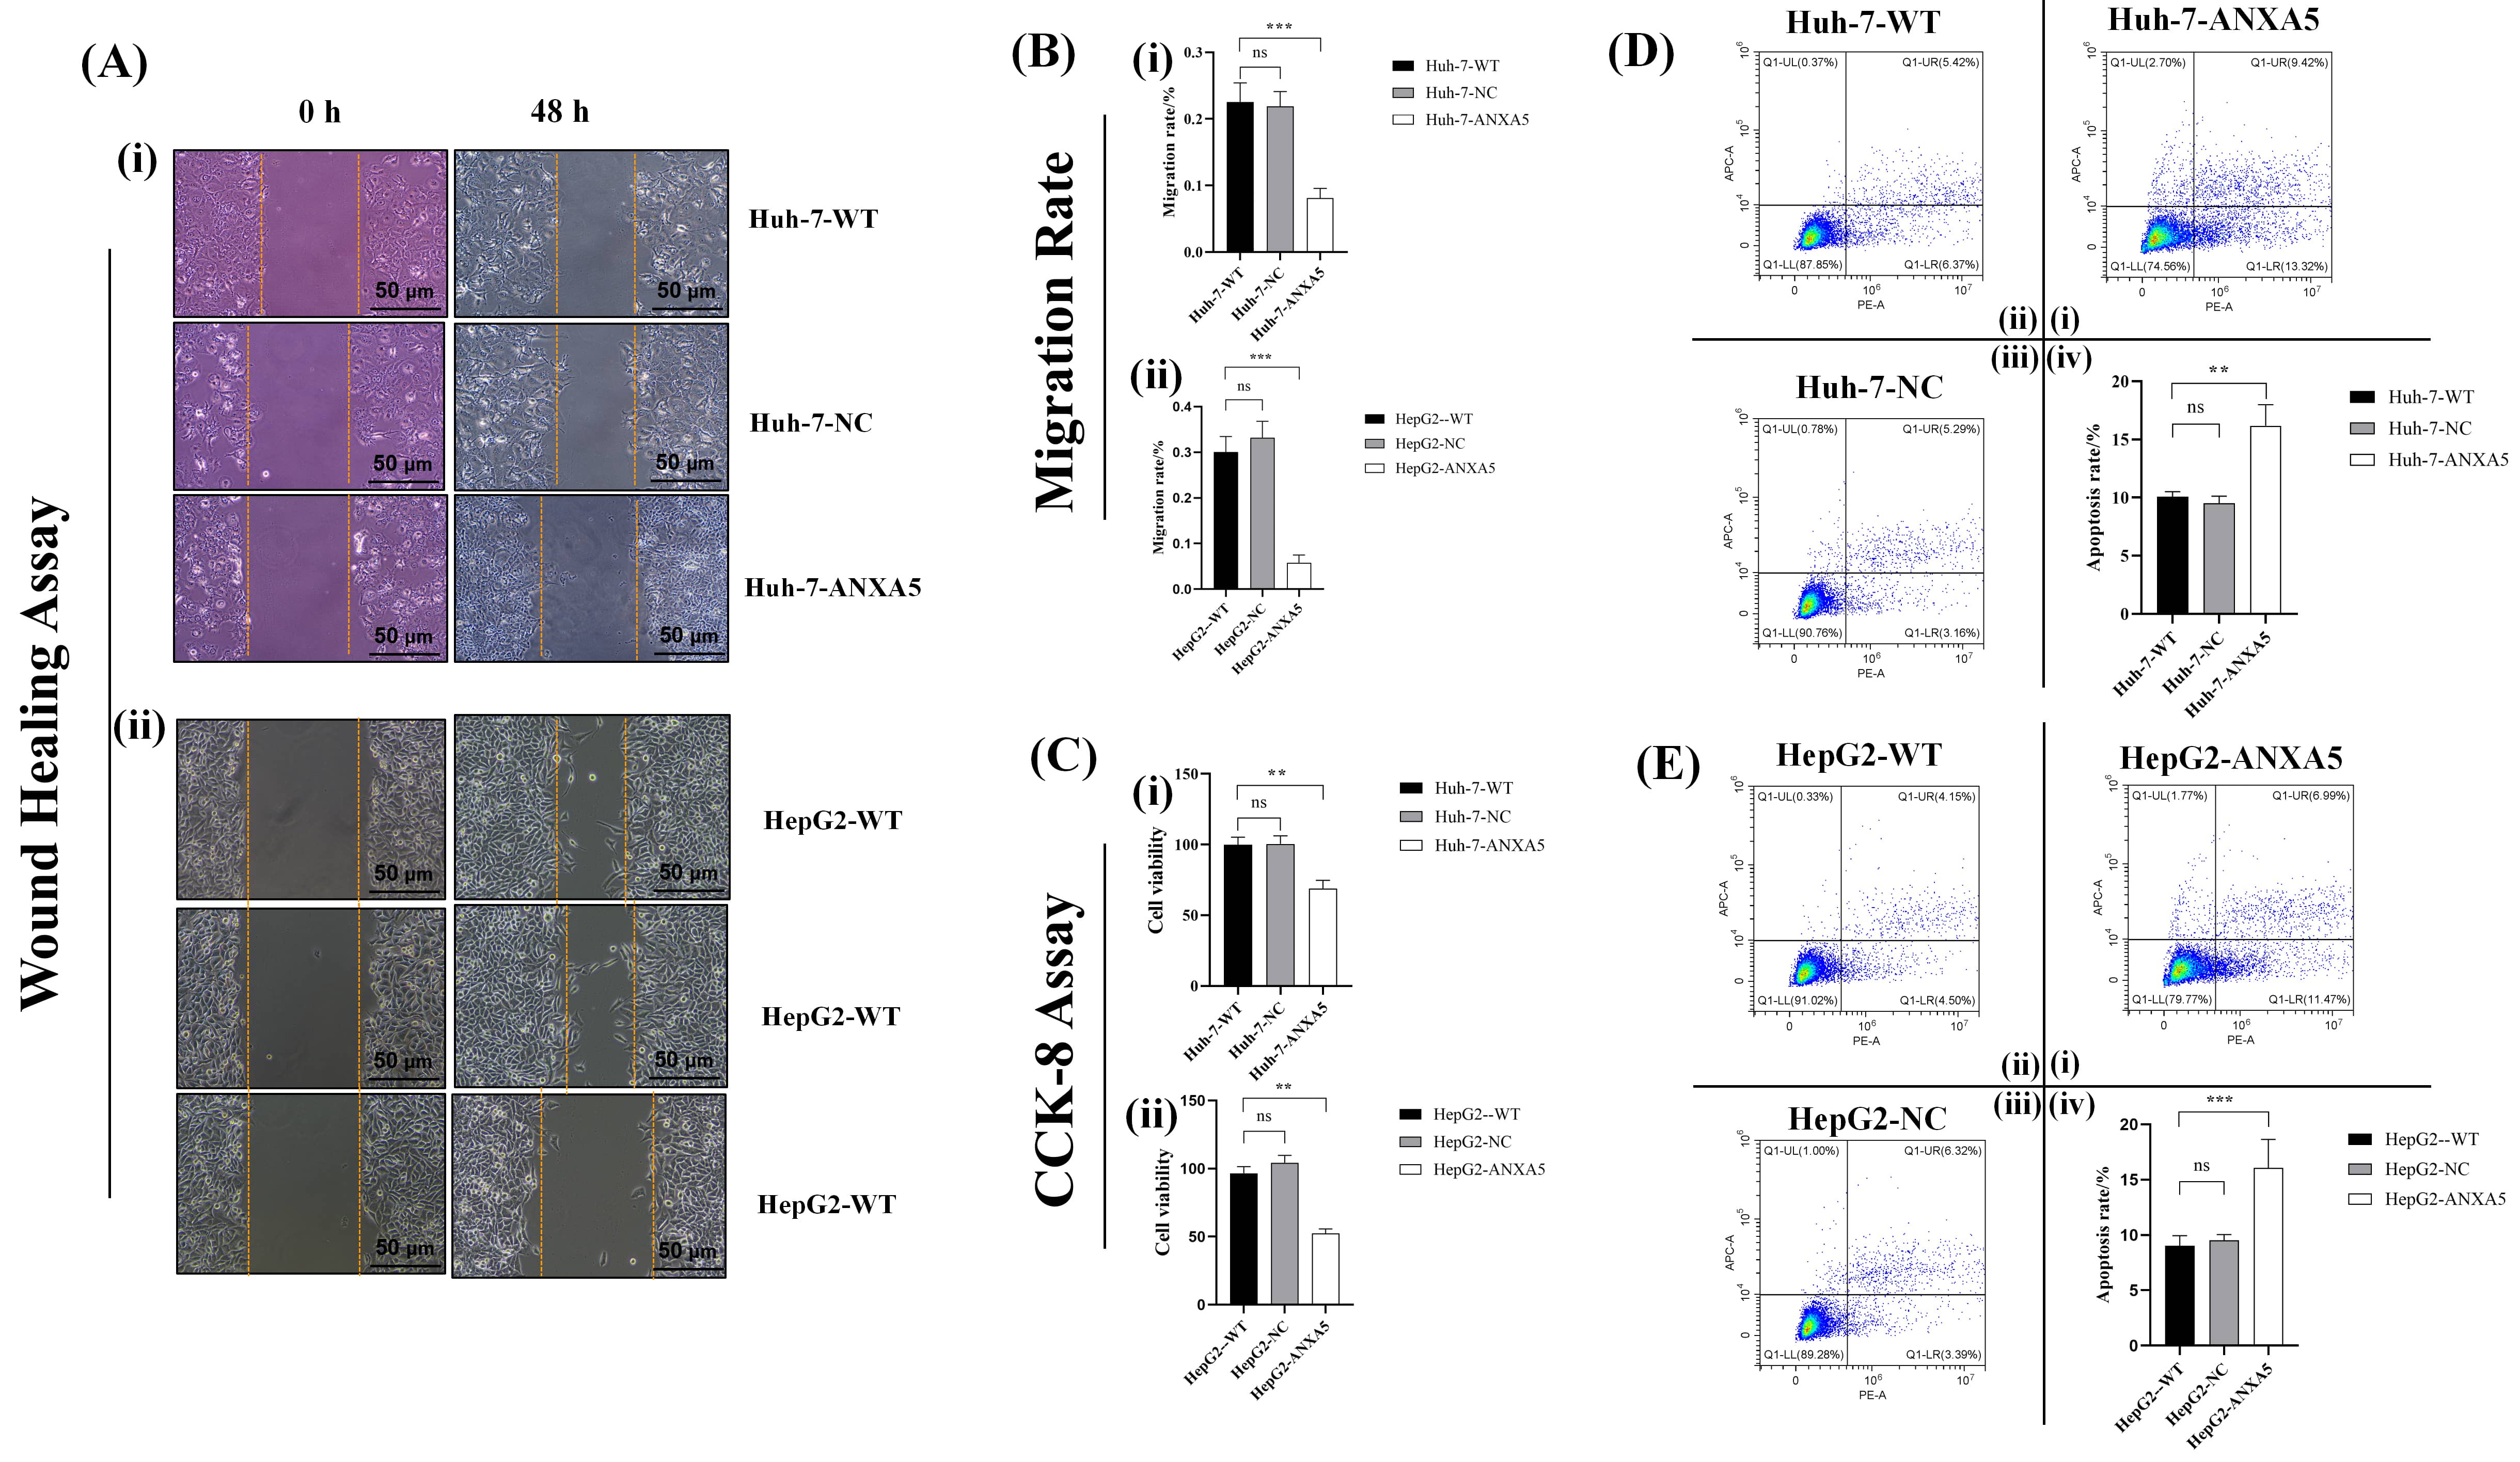 Fig. 9.
ANXA5 regulates HCC cells in vitro. (A) Micrographs of
wound healing assays: (i) Huh-7, (ii) HepG2. (B) Quantification of cell migration
in the wound healing assay: (i) Huh-7, (ii) HepG2. (C) CCK-8 assay quantifying
cell proliferation: (i) Huh-7, (ii) HepG2. (D) Flow cytometry scatter plots of
apoptosis detection. The quadrants represent: lower left (viable cells), upper
left (mechanically damaged cells), upper right (late apoptotic cells), and lower
right (early apoptotic cells); (i) Quantitative analysis of Huh-7-WT, (ii)
Huh-7-NC, (iii) Huh-7-ANXA5, (iv) Huh-7 cells. (E) Flow cytometry scatter plots
of apoptosis detection. (i) Quantitative analysis of HepG2-WT, (ii) HepG2-NC,
(iii) HepG2-ANXA5, (iv) HepG2 cells. Statistical significance is indicated as
follows: **, p
Cell proliferation was assessed using the CCK-8 assay, which showed that
absorbance values in the ANXA5-KD group showed significantly decreased levels
relative to the control groups (p
Flow cytometry with Annexin V-FITC/PI staining was used to measure the apoptosis
level. Scatter plots revealed a notable increase in the proportions of apoptotic
cells in the ANXA5-KD groups (Fig. 9D). Quantitative analysis confirmed that the
proportion of apoptotic cells was markedly increased in the KD group relative to
the control groups (p
Together, these findings establish that ANXA5 plays a critical role in regulating migration, proliferation, and apoptosis in HCC cells. ANXA5 KD led to reduced cell migration and growth while significantly increasing apoptosis, highlighting its potential as a therapeutic target for HCC.
Based on prior evidence indicating a strong interaction between ANXA5 and GAPDH,
and having confirmed that ANXA5 does not alter GAPDH expression, we investigated
whether ANXA5 influences GAPDH enzymatic activity. An ELISA-based assay revealed
a positive correlation between ANXA5 levels and GAPDH activity (p
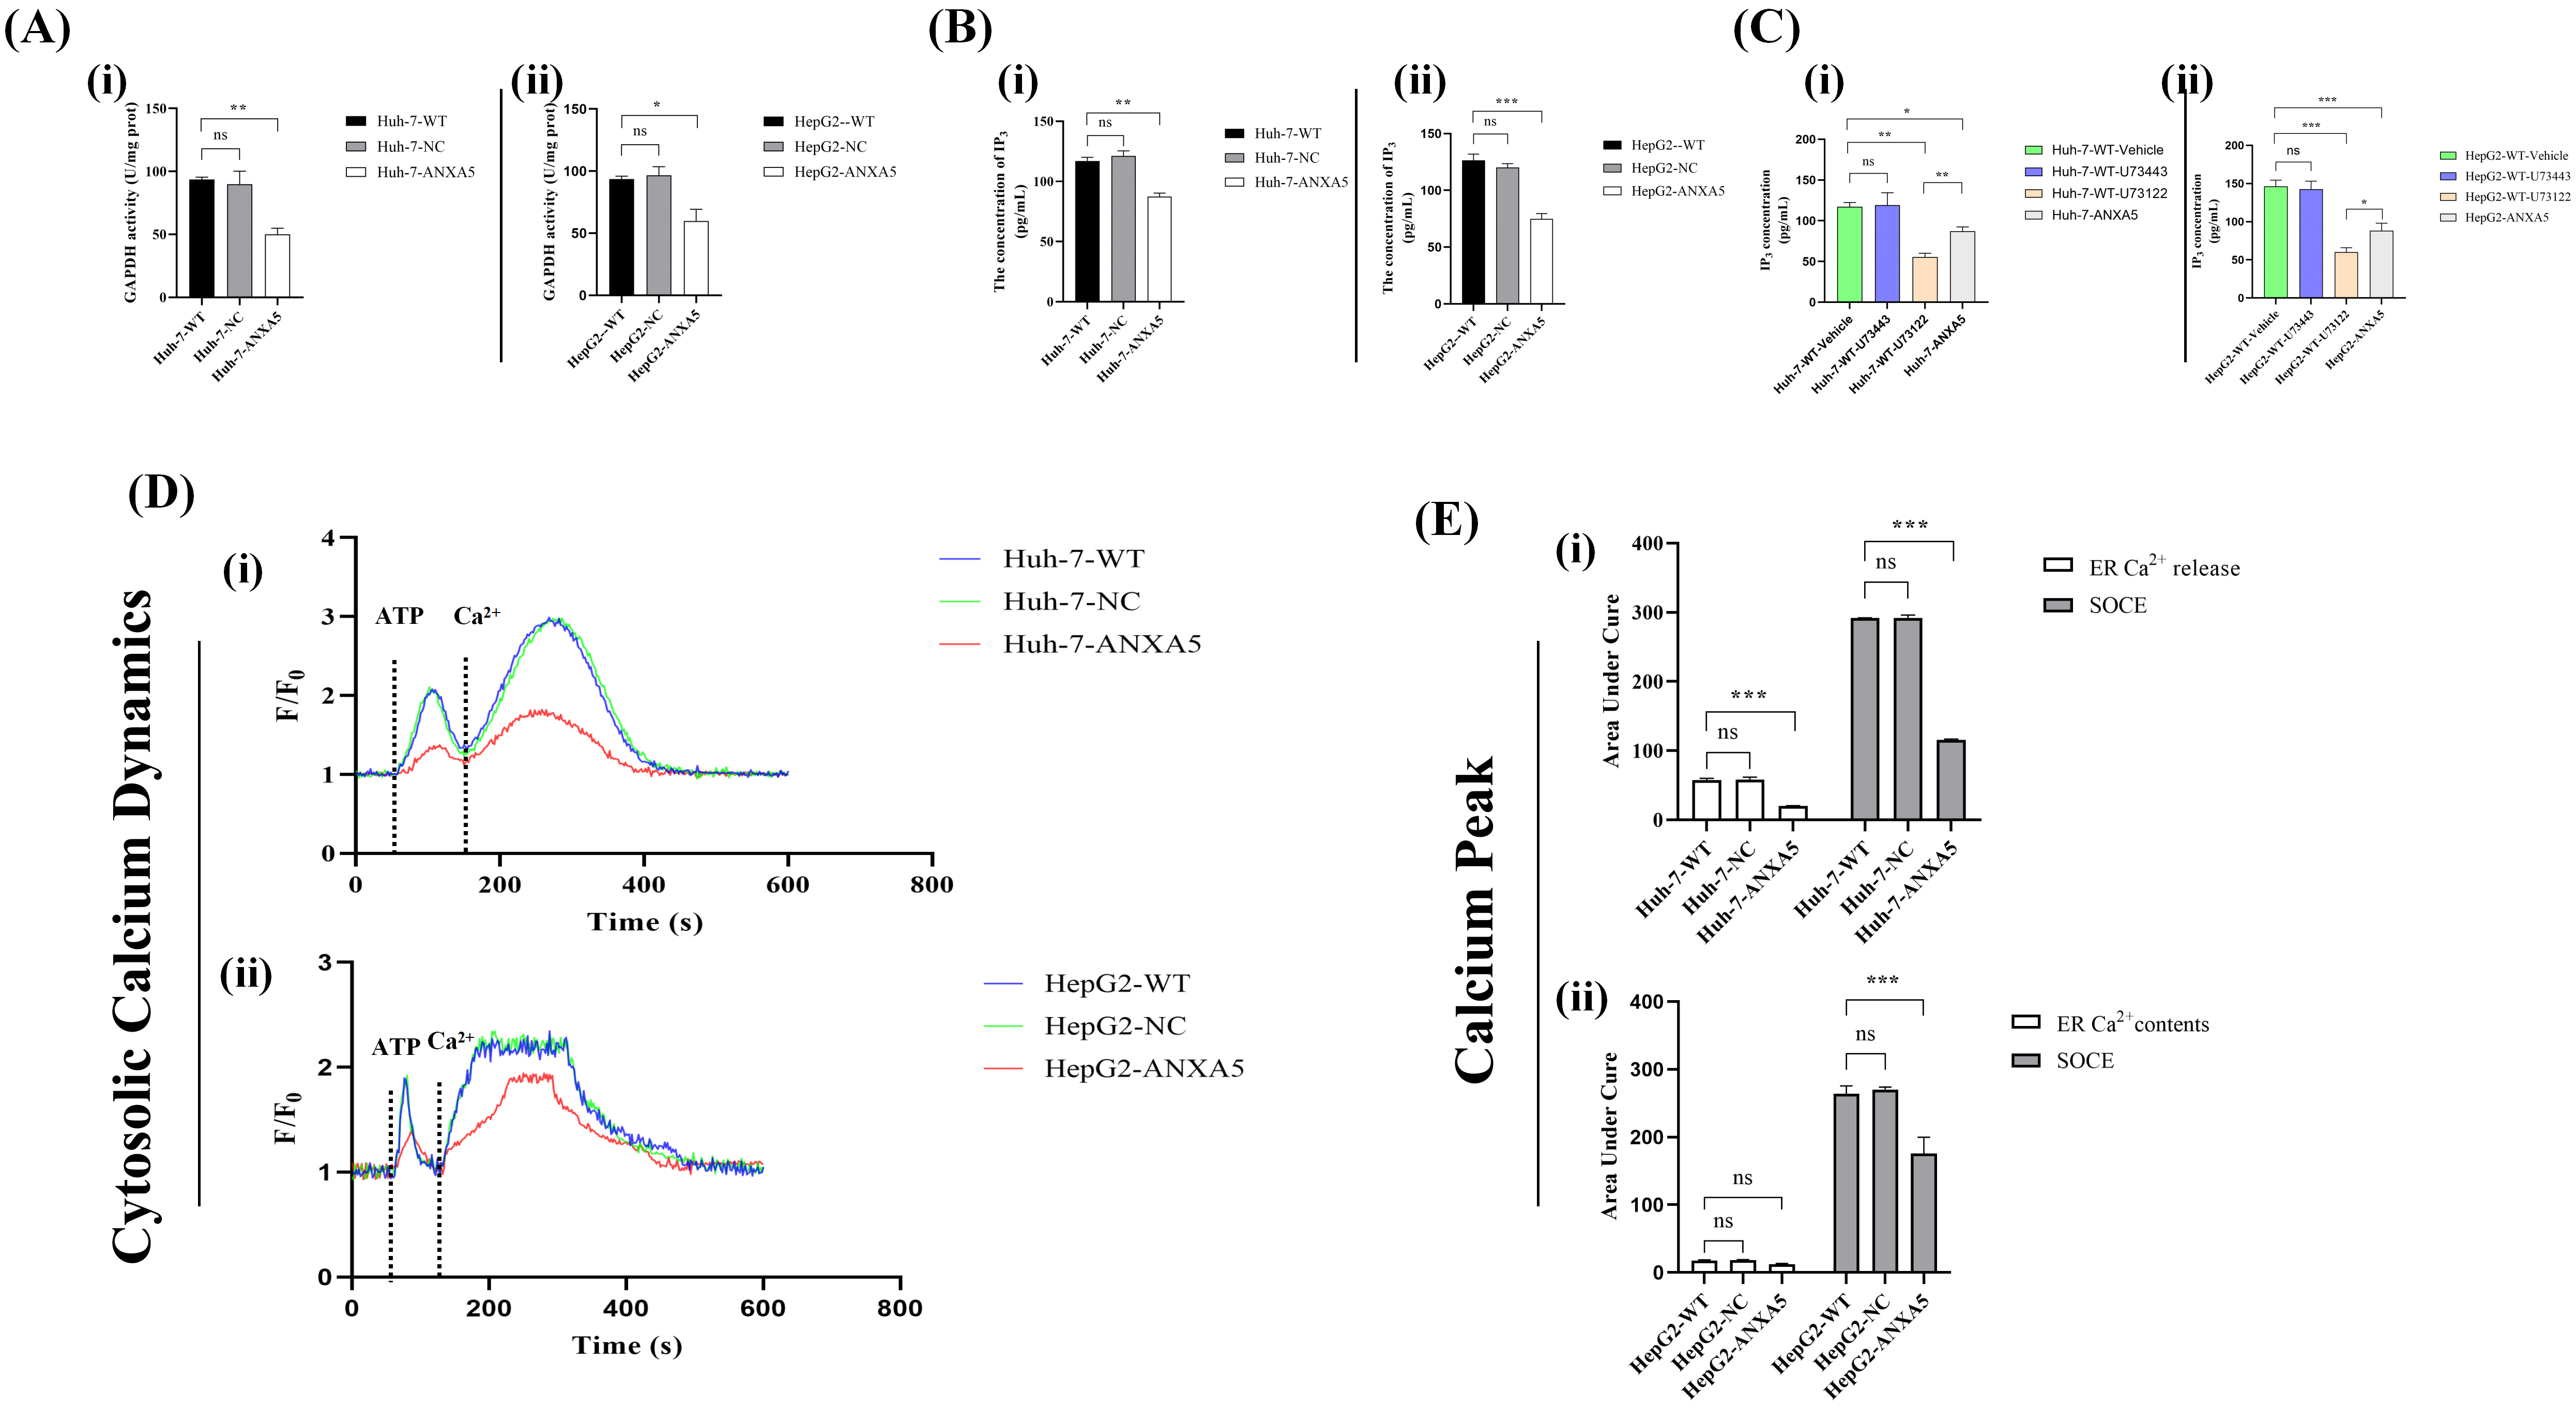 Fig. 10.
ANXA5 modulates Ca2+ signaling through the GAPDH/IP3
pathway. (A) GAPDH enzyme activity was determined by spectrophotometrically
monitoring the rate of NADH consumption during the reaction. (B) Measurement of
IP3 level. (C) IP3 rescue experiment. There were no significant
differences between the vehicle and U73443 groups (p
To investigate the potential mechanism, we examined whether ANXA5 may influence
PIP2 metabolism through GAPDH enzymatic activity. Since direct
quantification of PIP2 was technically challenging, we measured the levels
of its downstream metabolite, IP3, as an indirect indicator of PIP2
hydrolysis. ELISA analysis showed a significant decrease in IP3
concentration following ANXA5 knockdown (p
To investigate whether ANXA5 regulates intracellular IP3 levels via the PLC
pathway, we performed pharmacological inhibition and genetic KD experiments.
Cells were divided into four groups: vehicle control, ANXA5-KD, U73122, and
U73343 (Fig. 10C). Measurement of intracellular IP3 revealed that U73122
treatment and ANXA5-KD both significantly reduced IP3 levels compared with
vehicle control (p
To further examine the functional impact, cytosolic Ca2+ dynamics were
assessed using a fluorescent Ca2+ indicator in Huh-7 and HepG2 cells with
ANXA5-KD. Ca2+ oscillation curves showed that ANXA5-KD attenuated both ER
Ca2+ release and the SOCE peak compared with WT and NC groups (Fig. 10D).
The AUC for ER release and SOCE peak was quantified from the Ca2+
oscillation curves (Fig. 10E), confirming that decreased ANXA5 expression
compromised ER Ca2+ release and consequently diminished SOCE (p
In summary, our findings suggest that ANXA5 may positively influence GAPDH enzymatic activity without affecting its expression levels. Moreover, ANXA5 knockdown was associated with a marked reduction in the downstream metabolite IP3, which may reflect indirect alterations in PIP2 metabolism. Pharmacological inhibition of PLC with U73122 mimicked the effects of ANXA5 depletion, supporting the involvement of the PLC pathway in ANXA5-mediated IP3 generation. Functionally, ANXA5 deficiency impaired intracellular Ca2+ signaling, as evidenced by diminished ER Ca2+ release and reduced SOCE in Huh-7 and HepG2 cells. Collectively, these results suggest that ANXA5 regulates HCC cell Ca2+ dynamics through GAPDH-dependent modulation of the PLC/IP3 axis, consistent with the proposed ANXA5/GAPDH/IP3/SOCE working model.
To evaluate the in vivo function of ANXA5, nude mice were subcutaneously inoculated with WT, NC, or ANXA5-KD cells (Huh-7) in the right flank. Measurement of resected tumors showed that knocking down ANXA5 significantly reduced tumor volumes compared to the WT and NC groups (Fig. 11A,B). Quantitative analysis further demonstrated that ANXA5 KD markedly reduced the rate of tumor progression (Fig. 11C) and tumor burden at sacrifice (Fig. 11D), and was associated with a slower decline in mouse body weight (Fig. 11E), suggesting a less aggressive tumor burden.
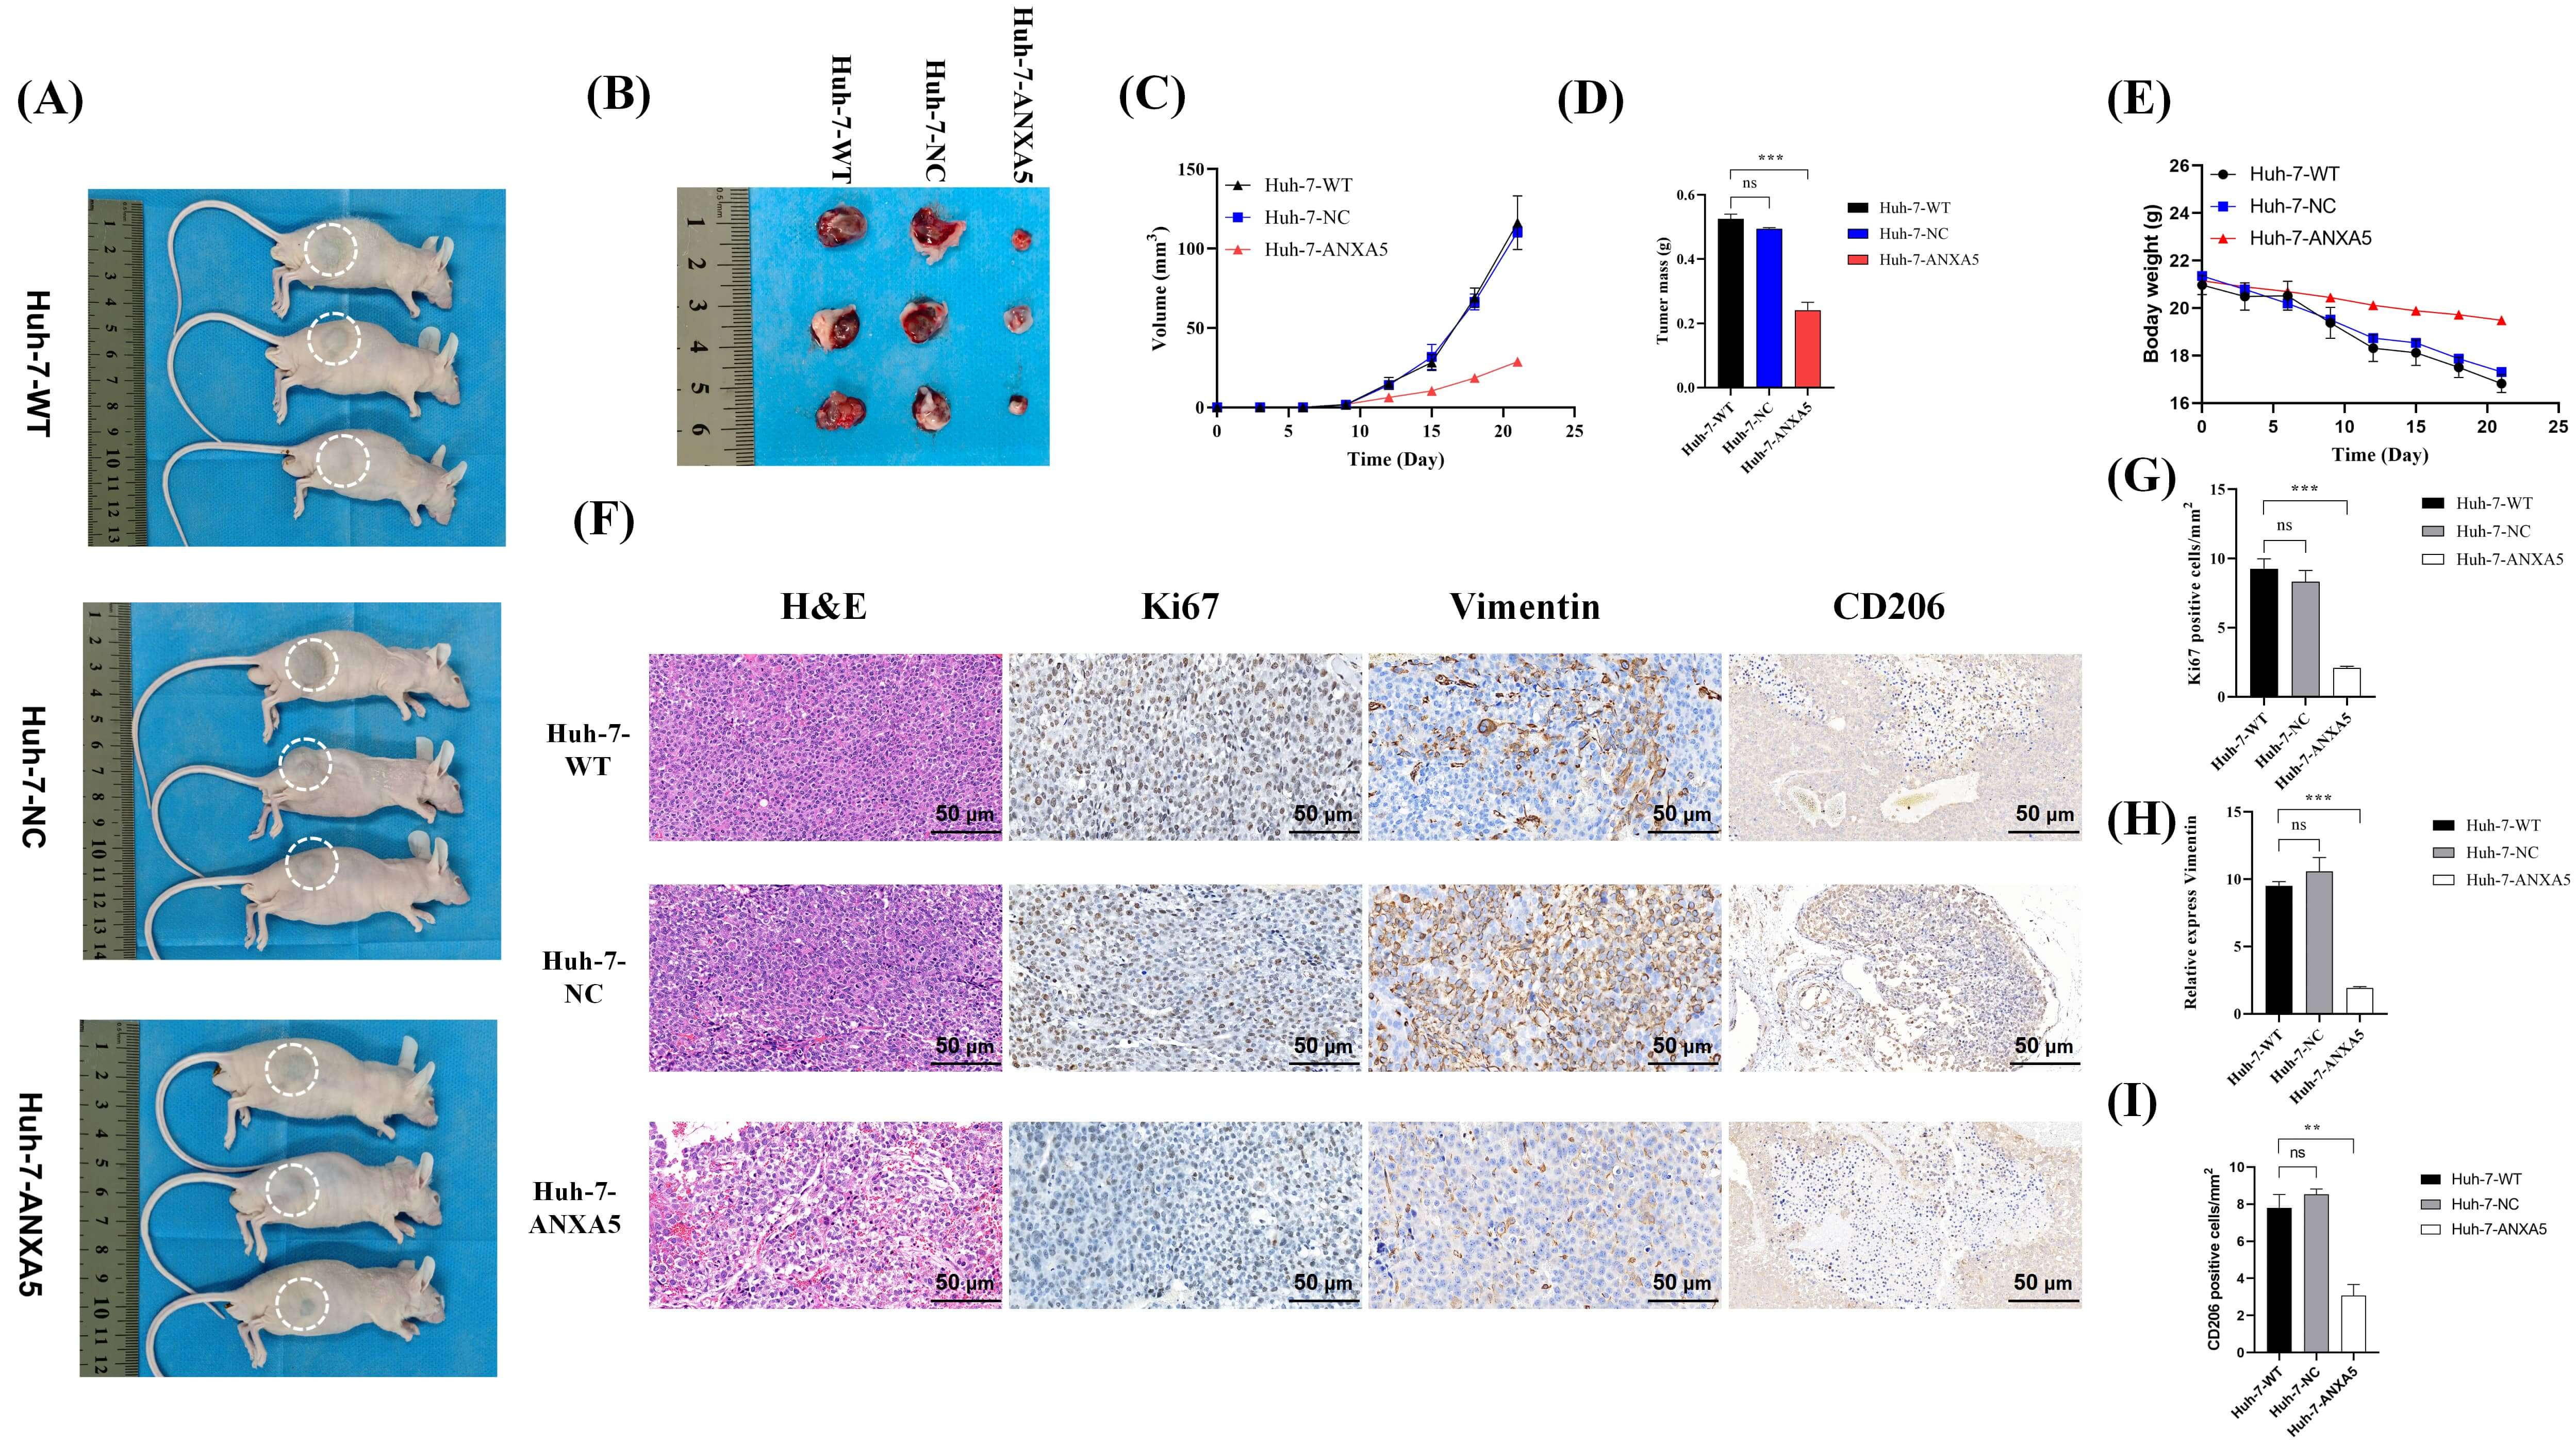 Fig. 11.
ANXA5 promotes tumor growth and malignancy in vivo.
(A) Images of tumors in situ. (B) Excised tumor specimens from each
group. (C) Tumor growth curves over time. (D) Bar graph showing final tumor mass.
(E) Body weight changes of mice during the study. (F) Histological,
cross-sectional analysis (top to bottom respectively) of Huh-7-WT, Huh-7-NC, and
Huh-7-ANXA5 cells; (left to right respectively) H&E staining of Ki-67, vimentin,
and CD206. Scale bar = 50 µm. (G) Quantification of Ki-67-positive cells.
(H) Quantification of vimentin expression. (I) Quantification of CD206-positive
cells. H&E, hematoxylin and eosin. Statistical significance is indicated as
follows: **, p
Histological examination using H&E staining showed that tumors from the control
groups exhibited more compact and dense architecture compared with the more
loosened structure observed in ANXA5-KD tumors (Fig. 11F). Immunohistochemical
analysis of Ki-67, a proliferation marker, and vimentin, a marker of
epithelial–mesenchymal transition (EMT), revealed substantially higher
expression levels in the WT and NC groups than in the ANXA5-KD group.
Additionally, staining for the M2 macrophage marker CD206 showed denser positive
signals in control tumors. These findings suggest a potential association between
ANXA5 expression and M2 macrophage–related signals within the tumor
microenvironment (Fig. 11F). Quantitative analysis of staining intensity
confirmed significant reductions in proliferation, malignancy, and M2 marker
expression upon ANXA5 KD (p
In summary, the in vivo experiments demonstrated that ANXA5 depletion significantly suppressed tumor growth and progression. Tumors derived from ANXA5-KD cells exhibited smaller volumes, slower growth kinetics, and reduced tumor burden at the endpoint compared with WT and NC controls. Histological assessment revealed a less compact tumor architecture in ANXA5-KD tumors, accompanied by decreased Ki-67 and vimentin expression, indicating diminished proliferation and EMT activity. Furthermore, reduced CD206 staining suggested a decrease in M2-associated macrophage signals within the tumor tissue. Taken together, these findings indicate that ANXA5 expression is associated with tumor growth, malignant phenotypes, and changes in immune-related markers in vivo.
The development and progression of HCC involves a complex interplay of diverse biological and environmental factors, including genetic alterations, viral infections, and aflatoxin exposure, among others.
Tumor metastasis and postoperative recurrence are widely acknowledged as key determinants of unfavorable outcomes in patients with HCC. HCC therefore remains a formidable global health challenge due to its strong propensity for recurrence and metastasis [50, 51, 52, 53, 54, 55].
We identified a working model in which ANXA5 drives HCC progression through functional engagement of the SOCE signaling pathway. Our findings suggest a potential association between ANXA5-related changes in GAPDH activity and alterations in PPI metabolism, including PIP2. Although PIP2 was not directly quantified, the observed changes in downstream signaling are consistent with indirect modulation of PPI hydrolysis. These alterations were accompanied by changes in SOCE-dependent Ca2+ influx, which may contribute to the regulation of malignant phenotypes of HCC cells, such as proliferation, migration, and survival.
The most significant and novel finding of our study was the identification of a functional link between ANXA5 and GAPDH. While GAPDH has long been recognized as a central mediator of the Warburg effect, a key metabolic reprogramming event in cancer, its regulation by annexin family proteins, particularly ANXA5, remained largely unexplored. Through integrated approaches including Western blotting, qPCR, ELISA, and co-IP, we provided initial evidence of a robust interaction between ANXA5 and GAPDH. Interestingly, while ANXA5 depletion did not affect GAPDH expression at either the transcriptional or protein level, it significantly reduced its enzymatic activity. Consistently, Co-IP assays revealed a physical association between ANXA5 and GAPDH, supporting the notion that ANXA5 modulates GAPDH function through protein–protein interaction rather than expression control. Together, these findings suggest that ANXA5 influences glycolysis and adds a metabolic regulatory layer by controlling GAPDH through post-translational mechanisms.
Given that PPI synthesis (including PIP2) relies on GAPDH-dependent glycolytic pathways [33, 34, 35, 36, 56], the reduced IP3 levels observed after ANXA5 KD likely stem from compromised GAPDH activity.
Our results indicate that ANXA5 positively regulates GAPDH enzymatic activity without altering its expression level. Depletion of ANXA5 led to a marked reduction in the downstream metabolite IP3, suggesting a potential role for ANXA5 in PIP2 metabolism. Pharmacological inhibition of PLC using U73122 recapitulated the effects of ANXA5 loss, supporting the involvement of the PLC pathway in ANXA5-mediated IP3 generation. Collectively, these findings suggest that ANXA5 modulates Ca2+ dynamics in HCC cells through a GAPDH-dependent regulation of the PLC/IP3 axis, consistent with the proposed ANXA5/GAPDH/IP3/SOCE working model.
Taken together, our data suggest a potential signaling framework in which ANXA5 may be associated with enhanced GAPDH-related glycolytic activity, potentially influencing PPI metabolism, including PIP2 [57]. Although PIP2 was not directly measured, the observed changes in IP3 levels are consistent with indirect modulation of PLC-dependent PIP2 hydrolysis. These alterations were accompanied by changes in ER Ca2+ release and subsequent SOCE activation.
Moreover, through its interaction with PIPKI
SOCE is the principal pathway for Ca2+ influx in non-excitable cells, including HCC cells [58, 59, 60]. Disruption of this pathway through ANXA5 KD produced profound phenotypic consequences, as evidenced by suppressed proliferation and migration, alongside increased apoptosis. The induction of apoptosis upon ANXA5 depletion revealed an additional dimension of its pro-tumorigenic function. Beyond its role in the GAPDH/IP3/SOCE axis, we hypothesize that ANXA5 may directly enhance the expression of cell survival-promoting proteins such as B-cell lymphoma 2 (Bcl-2), a hypothesis supported by preliminary data.
This hypothesis is consistent with ANXA5’s established ability to bind phosphatidylserine on the apoptotic cell surface, thereby masking “eat-me” signals and conferring a survival advantage [61, 62]. Bcl-2, a well-characterized anti-apoptotic protein, promotes cell survival by directly targeting Bcl-2-associated X protein (BAX) and Bcl-2 homologous antagonist/killer (BAK) to antagonize their pro-apoptotic roles [62, 63]. This interaction prevents BAX/BAK oligomerization, preserves mitochondrial membrane integrity, and suppresses the initiation of intrinsic apoptosis [64, 65, 66]. Thus, ANXA5 likely promotes HCC cell survival through a dual mechanism: first, by sustaining pro-survival Ca2+ signaling via SOCE; and second, by potentially upregulating anti-apoptotic proteins.
These mechanistic insights were strongly corroborated by our in vivo experiments. Significant reductions in tumor volume, weight, and expression of the proliferation marker Ki-67 and the mesenchymal marker vimentin upon ANXA5 KD, highlight its critical role in driving tumor growth and malignancy. Moreover, the attenuated decline in body weight among mice bearing ANXA5-deficient tumors suggested a reduced overall tumor burden, highlighting the therapeutic potential of targeting ANXA5 in HCC.
Our bioinformatic analyses suggested a potential immunomodulatory role for ANXA5 in shaping the tumor microenvironment. Numerous studies have reported that metabolic processes within the tumor microenvironment are extensively reprogrammed to support cancer cell survival and progression [67, 68]. Cancer cells frequently shift toward the Warburg effect, a metabolic adaptation characterized by increased glucose uptake and elevated lactate production [69, 70, 71]. This reprogramming enables tumor cells to thrive under nutrient-limited and hypoxic conditions, thereby facilitating tumor progression [72].
Significant overrepresentation of ANXA5 was detected in dendritic cells and macrophages, two pivotal antigen-presenting cell populations that constitute the immune system’s first line of defense [73]. This cellular distribution indicates that ANXA5 might interfere with the early steps of cancer cell recognition, potentially contributing to immune evasion. More intriguingly, our preliminary data suggest that ANXA5 expression may be associated with increased markers of M2-like macrophage polarization. Given that M2 macrophages are well-established mediators of immunosuppression, angiogenesis, and tumor-supportive tissue remodeling [74], this observation raises the possibility that ANXA5 could contribute to shaping an immunosuppressive tumor microenvironment.
Taken together, these findings support the hypothesis that ANXA5 may contribute to HCC progression not only through tumor-intrinsic mechanisms—namely the GAPDH/SOCE axis—but also through tumor-extrinsic pathways. ANXA5 expression was associated with increased markers of M2-like macrophages, suggesting a potential link to features of an immunosuppressive tumor microenvironment. These observations may correlate with reduced anti-tumor immune activity, which could contribute to tumor growth and survival, although direct functional validation is needed. Based on current literature and our experimental results [75, 76, 77, 78], We preliminarily propose that ANXA5 expression may be associated with M2-like macrophage characteristics and may contribute to features of the tumor microenvironment, a hypothesis that will be further explored in future studies [79].
In conclusion, our work supports a model wherein the ANXA5/GAPDH/IP3/SOCE pathway drives HCC progression by linking metabolic reprogramming with sustained oncogenic Ca2+ signaling. Moving beyond correlative observations, we established a definitive mechanistic cascade linking a membrane-associated protein (ANXA5) to a key glycolytic enzyme (GAPDH) and ultimately to a fundamental second-messenger system (Ca2+).
Furthermore, our computational analyses suggest that ANXA5 expression may be associated with features of an immunosuppressive tumor microenvironment, potentially linked to M2-like macrophage characteristics. These multifaceted findings not only advance our understanding of HCC pathogenesis but also position ANXA5 as a promising therapeutic target.
Future research should focus on developing specific ANXA5 inhibitors to assess their impact on immune regulation and tumor microenvironment remodeling in vivo. In addition, exploring combination strategies that target this newly identified signaling axis alongside current standard therapies may ultimately offer innovative and more effective treatment options for this aggressive malignancy.
This study has several limitations that should be acknowledged. First, although our findings suggest a potential mechanistic link between ANXA5, GAPDH activity, and the IP3/SOCE signaling axis, the direct causal relationship and detailed molecular interactions remain to be further elucidated. Second, while both Huh-7 and HepG2 cell lines were used for in vitro validation, the in vivo experiments were conducted using only one cell line, which may limit the generalizability of the findings. Third, the regulatory effects of ANXA5 on phosphoinositide metabolism were inferred based on functional assays, and more direct evidence, such as lipidomics or metabolic flux analysis, is still needed. In addition, the sample size in animal experiments was relatively limited, and further studies with larger cohorts are required to strengthen the conclusions. Finally, the clinical relevance of the ANXA5/GAPDH/IP3/SOCE axis warrants further validation in patient-derived samples and prospective studies.
ANXA5 may enhance HCC malignancy by promoting GAPDH activity, leading to increased IP3 production and strengthened SOCE-mediated Ca2+ influx. Our results support a working model in which the ANXA5/GAPDH/IP3/SOCE axis contributes to HCC progression, highlighting ANXA5 as a potential therapeutic target.
The datasets used and analyzed during the current study are available from the corresponding author or first author upon reasonable request.
XGZ, FYW: conceived and designed this study. WCG, XCZ, SM: conducted experiments and analyzed data. WCG, XCZ, SM: constructed animal models. WCG, SM: interpreted data. WCG: drafted the manuscript. XGZ, FYW: reviewed data and proofread manuscripts. All authors contributed to editorial changes in the manuscript. All authors read and approved the final manuscript. All authors have participated sufficiently in the work and agreed to be accountable for all aspects of the work.
All animal experiments were approved by the Animal Care and Use Committee of Bengbu Medical University (Approval No. [2025]514), and were conducted in accordance with the ARRIVE guidelines and the institutional guidelines for the care and use of laboratory animals.
The authors thank Graduate School, Bengbu Medical University, Anhui No. 2 Provincial People’s Hospital and the Anhui Provincial Key Laboratory of Occupational Health for support.
This study was supported by the University Research Project Education Department of Anhui Province (2024AH050554), Research Innovation Plan Project for Postgraduates of Bengbu Medical University in the 2024 Academic Year (Byycx24084) and the Scientific Research Project of Anhui Provincial Healthcare Commission (AHWJ2022a003).
The authors declare no conflict of interest.
References
Publisher’s Note: IMR Press stays neutral with regard to jurisdictional claims in published maps and institutional affiliations.