


 , Jie Wang 1,†, Shuaixin Lu 1, Xinmiao Zhou 1, Min Zhou 1, Peiyao Huang 1, Simo Pan 1, Xiaohua Zhang 1, Kai Wen 1,*
 , Jing Sun 1,*
1 Tianjin Key Laboratory of Retinal Functions and Diseases, Tianjin Branch of National Clinical Research Center for Ocular Disease, Eye Institute and School of Optometry, Tianjin Medical University Eye Hospital, 300380 Tianjin, China
†These authors contributed equally.
Abstract
The progression of myopia is typically accompanied by hypoxia-induced remodeling of the scleral extracellular matrix (ECM). In this study, we focused on the regulatory mechanisms underlying Notch signaling pathway activation of mitochondrial dynamics under conditions of scleral hypoxia, along with its effects on the scleral ECM.
Three-week-old male guinea pigs were used to establish form-deprived myopia (FDM) models, and human scleral fibroblasts (HSFs) were cultured in a hypoxic environment. To examine the intrinsic associations among factors, we used short hairpin RNAs (shRNAs) to independently knock down hypoxia-inducible factor alpha (HIF-1α) and Notch1. Expression of key molecules was assessed by western blotting, quantitative real-time polymerase chain reaction (qPCR), and immunofluorescence (IF) analyses. Additionally, mitochondrial morphology, membrane potential (ΔΨm), and reactive oxygen species (ROS) levels were assessed, and the specific dynamin-related protein 1 (DRP1) inhibitor Mdivi-1 was used to determine its regulatory effects on scleral ECM.
In the FDM model, we detected a marked upregulation of scleral HIF-1α and Notch1, along with abnormal mitochondrial fission and ECM remodeling. Hypoxia-cultured HSFs were found to be characterized by mitochondrial fragmentation, a reduction in ΔΨm, elevated levels of ROS and α-smooth muscle actin (α-SMA), and a reduction in type I collagen [markers indicative of fibroblast-myofibroblast transition (FMT) and ECM remodeling]. Notably, we observed that knockdown of HIF-1α was associated with a reduction in Notch1 levels, and a subsequent knockdown of Notch1 inhibited the expression of DRP1 and attenuated abnormal mitochondrial fission. Furthermore, pharmacological inhibition of mitochondrial fission using Mdivi-1 contributed to an amelioration of the aberrant mitochondrial morphology and reduced the expression of FMT markers in vitro.
Collectively, our findings indicate a potential link between scleral hypoxia and mitochondrial fragmentation, which may involve activation of Notch1 signaling and subsequent changes in the composition of the scleral ECM. In vitro, inhibition of mitochondrial fission appeared to mitigate the transformation of human scleral fibroblasts toward a myofibroblast-like phenotype. These findings provide evidence of a novel hypoxia-associated cellular pathway that warrants further investigation to establish its causal role and therapeutic relevance in myopic scleral remodeling.
Keywords
- myopia
- scleral
- notch
- mitochondrial
- hypoxia
The prevalence of myopia continues to increase globally. According to the report released by the World Health Organization, the prevalence of myopia among adolescents the incidence of myopia exceeds 60%, and is projected to affect 10% of the global population [1, 2]. Notably, high myopia-induced visual impairment accordingly represents a major public health challenge. The core pathological change is the excessive elongation of the axial length, while the sclera in high myopic individuals typically presents structural anomalies [3]. However, despite extensive research on the pathogenesis of high myopia, the precise underlying molecular mechanisms have yet to be sufficiently determined.
Clinical investigations have revealed that the choroidal thickness in patients with high myopia is approximately 50% less than that in healthy individuals [4, 5, 6]. This substantial choroidal thinning leads to an insufficient oxygen supply to the sclera through the choroidal blood vessels, with subsequent establishment of a hypoxic microenvironment [7]. This process contributes to the thinning of the sclera and ultimately promotes the progressive elongation of the eye axis [8]. The core components of the sclera are the extracellular matrix (ECM), comprising large amounts of type I collagen and the fibroblasts responsible for secreting the ECM, the latter being the primary cell type maintaining tissue homeostasis [9, 10]. Key changes in high myopia development involve a reduction in the contents of type I collagen and an accelerated transition from fibroblasts to myofibroblasts (FMT). These changes contribute to a disruption of scleral homeostasis, leading to abnormal ECM remodeling, scleral thinning, and excessive axial elongation, thereby accelerating the progression of myopia [11]. Given the high energy dependence of these processes, the mitochondria are assumed to play a pivotal role in the pathogenesis, although the association between scleral mitochondrial dysfunction and the development of myopia has yet to be sufficiently established.
The morphology and intracellular distribution of the mitochondria are dynamically regulated via continuous fusion and fission processes, which are regulated by mitochondrial fusion proteins (MFNs) and dynamin-related protein 1 (DRP1) [12, 13]. Notably, excessive mitochondrial fission significantly promotes the accumulation of reactive oxygen species (ROS) within cells [14], and can lead to cellular dysfunction, abnormal differentiation, and other issues [12, 15, 16]. The findings of previous studies have indicated that the Notch signaling pathway actively regulates cellular energy homeostasis [17]. Also modulates mitochondrial energy metabolism in different diseases. For instance, the activation of Notch has been shown to stimulates mitochondrial fission in gastric and breast cancer cells [18, 19]. In addition to Notch signaling, hypoxia plays a pivotal role in the occurrence of mitochondrial dysfunction [20].
In this study, we demonstrated that mitochondrial fission plays a key role in scleral remodeling during myopia. Our findings indicate that by activating the Notch1 signaling pathway, scleral hypoxia induces mitochondrial fragmentation, thereby promoting a remodeling of the scleral ECM. In addition, we established that inhibition of mitochondrial fission suppresses the transformation of human scleral fibroblasts (HSFs) to myofibroblasts. By revealing the role of mitochondrial dynamics in remodeling of the scleral ECM, these findings contribute to a more comprehensive understanding of scleral energy metabolism in myopia and thereby provide valuable insights into the mechanisms underlying the development of this visual disorder.
The guinea pigs used in this study were obtained from Keda (Tianjin, China) and housed in a standard laboratory setting under a 12-hour light/dark cycle and provided with a standard diet. All experimental procedures were conducted with strict adherence to international ethical guidelines for the use of laboratory animals, and the study also received approval from the Medical Laboratory Animal Ethics Committee of Tianjin Medical University Eye Hospital (TJYY2024120244).
For the purposes of this study, we used healthy 3-week-old male guinea pigs.
Pre-experimentally, those with ocular diseases or anisometropia
Axial length, defined as the distance from the anterior corneal apex to the anterior retinal surface, was measured using an A-mode ultrasonic ophthalmoscope (A-scan, ODM-1000A; Tianjin Medatech Co., Ltd., Tianjin, China). Prior to measurement, a drop of 0.5% Proparacaine Hydrochloride Eye Drops (Alcon, Mechelen, Belgium) was instilled into the conjunctival sac of the guinea pigs for topical anesthesia. Subsequently, the probe of the ophthalmoscope was placed vertically on the apex of the guinea pig cornea and aligned with the center of the pupil for measurement, thereby obtaining stable waveform data. For each eye, we performed five measurements, with average values being recorded.
Refractive error was measured using an infrared auto-refractometer (Photorefractor; Global Biotech Inc., Suzhou, Jiangsu, China). In a dark room, 0.5% Compound Tropicamide Eye Drops (Santen Pharmaceutical (China) Co., Ltd., Suzhou, Jiangsu, China) were administered to both eyes of the guinea pigs for mydriasis four times at 5-min intervals to paralyze the ciliary muscle. After 30 min of dark adaptation, by which time the pupils had become fully dilated, the refractive status of guinea pig eyeballs was determined using an infrared eccentric refractometer, with three measurements being performed for each eye and average values recorded.
Euthanasia was performed via an anesthetic overdose. Guinea pigs were placed in an induction chamber and anesthetized with 5% isoflurane in oxygen until losing consciousness. A deep plane of anesthesia was confirmed by the absence of a response to a firm toe pinch. Subsequently, euthanasia was achieved by the intraperitoneal administration of pentobarbital sodium (150 mg/kg) at a concentration of 30 mg/mL (3%) or continuous exposure to 5% isoflurane for at least 10 min after a cessation of breathing. Death was confirmed by the absence of spontaneous respiration, loss of the corneal reflex, or asystole upon cardiac monitoring.
To assess pathological scleral changes in response to form deprivation, we performed staining using hematoxylin and eosin (H&E). On the 42nd day of the experiment, the guinea pigs had been rendered unconscious, and having immediately excised the eyeballs, these were fixed in FAS fixative (Servicebio, Proteintech, Wuhan, Hubei, China) for 48 h. The fixed tissues were paraffin-embedded, serially sectioned (4 µm), deparaffinized with xylene, and stained with H&E for pathological evaluation.
To assess the morphology of mitochondria in scleral tissue, we performed transmission electron microscopy (TEM). Scleral tissue were fixed in 2.5% glutaraldehyde for 18–20 h, followed by fixation with 1% osmium tetroxide fixation for 1 hour dehydration, and embedding in epoxy resin. Ultra-thin sections (60 nm thick) were cut, stained with 2% uranyl acetate and lead citrate, and examined using a transmission electron microscope (Hitachi, Minato-ku, Tokyo, Japan).
To assess changes in the expression of molecular markers associated with mitochondrial division, we conducted immunofluorescence (IF) analysis. Eye tissue sections (prepared as described) were blocked with 10% goat serum (50 min, room temperature), and incubated overnight at 4 °C with rabbit anti-DRP1 primary antibody (1:250 dilution: 12957-1-AP, Proteintech, China). Following incubation, the sections were treated with peroxidase-conjugated secondary antibodies (1 h at room temperature) for complete immunolabeling.
Human scleral fibroblast (HSFs) were obtained from Guangzhou Keyun Selection Biotechnology Co., Ltd. (Guangzhou, China) and cultured in DMEM (Gibco, Grand Island, NY, USA) supplemented with 10% FBS (A5669701, Gibco) and 1% penicillin-streptomycin (Gibco) at 37 °C with 5% CO2. Logarithmic-phase cells (passages 3–4) were used for subsequent experiments. The cell line used was validated based on STR profiling and tested negative for Mycoplasma.
Cells at 70%–80% confluence were exposed to hypoxic conditions for 24
consecutive hours in sealed culture bags (Cat. No. C-41, Chiyoda-ku, Tokyo,
Japan) with Mitsubishi anaerobic gas-generating packs (cat. No. C-11; Japan) to
ensure that oxygen concentrations within the bags were maintained at a level
below 1%. An anaerobic indicator (Cat. No. C-22, Japan) was used to monitor the
oxygen concentration, with the colorimetric criteria defined as pink for
Cells were seeded at an appropriate density in the wells of 96-well plates. Upon
reaching 70% to 80% confluence, the cell were pre-treated with different
concentrations of Mdivi-1 (cat. No.: HY-15767; MCE, Monmouth Junction, NJ, USA).
A 1 mM stock solution of Mdivi-1 in dimethyl sulfoxide (DMSO) was stored at –20
°C and serially diluted in medium to final concentrations of 1, 5, 10, and 15
µM. As a solvent control, we used DMSO at a final concentration
For short-hairpin RNA (shRNA) treatment, HSFs at 60%–70% confluence were
transfected using FectoGene 100 (Beyonpop, Tianjin, China) per manufacturer’s
instructions. shRNAs included shHIF-1
HSFs were lysed (20 min) in RIPA buffer (R0010, Solarbio) containing 100 mM
phenmethylsulfonyl fluoride (P0100-01; Solarbio), a phosphatase inhibitor
(100
Total RNA was isolated from HSFs using the EZ-press RNA purification kit
(EZBioscience, cat. B0004DP, Roseville, CA, USA), reverse-transcribed into cDNA
with the Color Reverse Transcription kit (EZBioscience, CA, USA), and quantified
using a Nanodrop2000 spectrophotometer. As a reference gene for normalization of
mRNA levels, we used
Cells were fixed in 4% PFA for 10 min, permeabilized with 0.1% Triton X-100
(T8200, Solarbio) for 10 min, then blocked with 1% BSA (SW3015, Solarbio) +
0.1% Tween-20 (T8220, Solarbio) for 30 min. Cells were incubated overnight at 4
°C with primary antibody (
For mitochondrial morphology analysis, cells were stained with MitoTracker (Thermo Scientific, Waltham, MA, USA) and imaged via confocal microscopy. After selecting cell regions and basic preprocessing, ImageJ was used to calculate mitochondrial morphology parameters (average branch length and standard deviation).
The levels of intracellular ROS were determined using a DCFH-DA fluorescent probe (S0033S; Beyotime, Shanghai, China). Following incubation with 10 µM DCFH-DA, cells were washed three times with serum-free medium to remove residual probe, then counterstained with Hoechst for 1 min. Fluorescence images were obtained using a Zeiss confocal microscope (LSM800, Oberkochen, Germany), and intensity was quantified with ImageJ.
HSF mitochondrial membrane potentials (
All statistical analyses were performed using GraphPad Prism software (version
9.0; GraphPad Software, USA). The normality of data distribution was initially
assessed using the Shapiro–Wilk test. For comparisons between two groups, we
used an unpaired two-tailed Student’s t-test. Comparisons among three or
more groups were conducted using a one-way analysis of variance (ANOVA), followed
by appropriate post hoc tests, as indicated in the respective figure legends.
Unless otherwise specified, data are presented as the means
To investigate changes in scleral mitochondria during myopic progression, we successfully established an FDM guinea pig model. Compared with the control group, those in the FDM group were found to be characterized by pronounced myopia-associated symptoms, including an elongated axial length and a shift in refractive power towards myopia (Fig. 1A,B), along with marked thinning of the scleral tissue and a looser arrangement of collagen fibers (Fig. 1C). Further TEM examination revealed a pronounced fission of mitochondria in the sclera of the FDM group predominantly exhibited an active fission state (Fig. 1D, Supplementary Fig. 1G). Moreover, DRP1 expression was markedly elevated in the FDM group compared to the CON group (Fig. 1E,F). Comparatively, we detected no significant differences between the two groups with respect to levels of the mitochondrial fusion proteins MFN1 and MFN2, are which taken to be representative of the status of mitochondrial fusion. Contrastingly, mRNA expression levels in the FDM group were significantly lower levels of these proteins in FDM group guinea pigs than in the CON group (Fig. 1G), indicating corresponding changes at the transcriptomic level. Collectively, these findings indicate an increase in mitochondrial fission in the sclera of myopia.
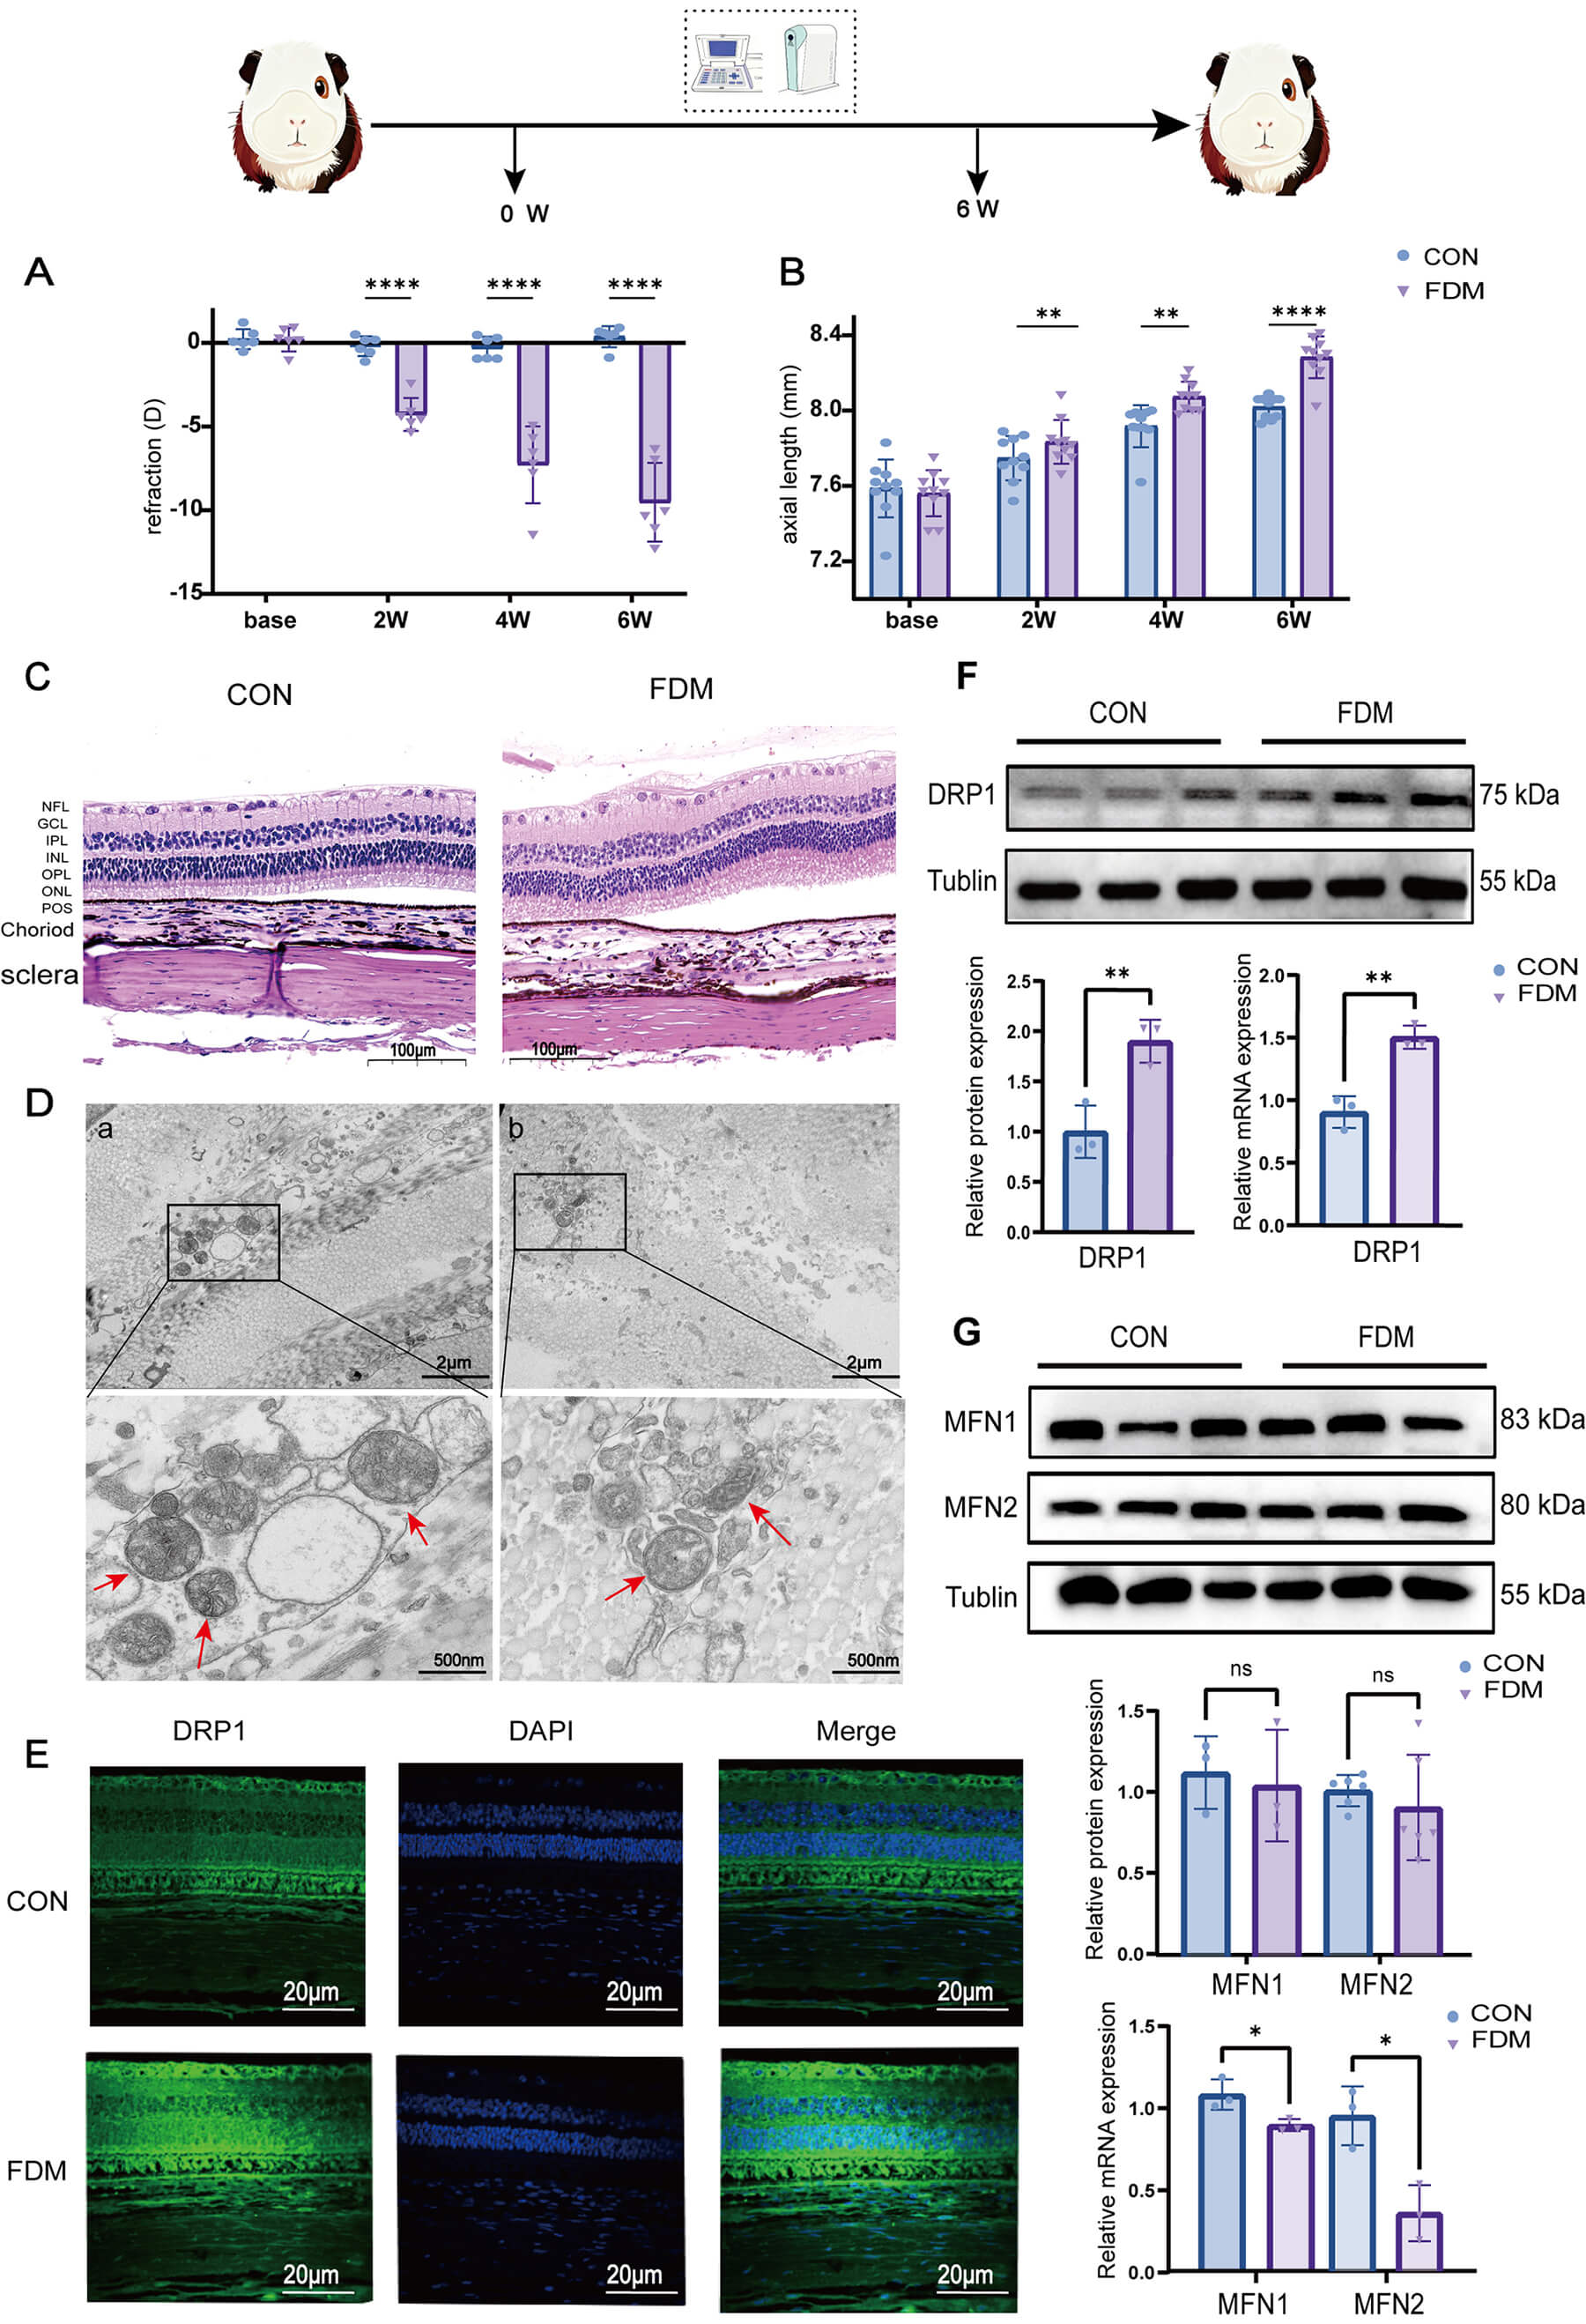 Fig. 1.
Scleral hypoxia and Mitochondrial fission are active in Myopia.
(A,B) Axial length and refractive error of 3-week-old guinea pigs measured at 0,
2, 4, 6 weeks post-form deprivation (n = 10). (C) H&E staining of
scleral tissues after 6 weeks of form deprivation (n = 3), scale bar =
100 µm. (D) Mitochondrial morphology was observed under transmission
electron microscopy (TEM) at magnifications of
To establish the potential causes of mitochondrial fragmentation in myopic
sclera, we examined the expression of HIF-1
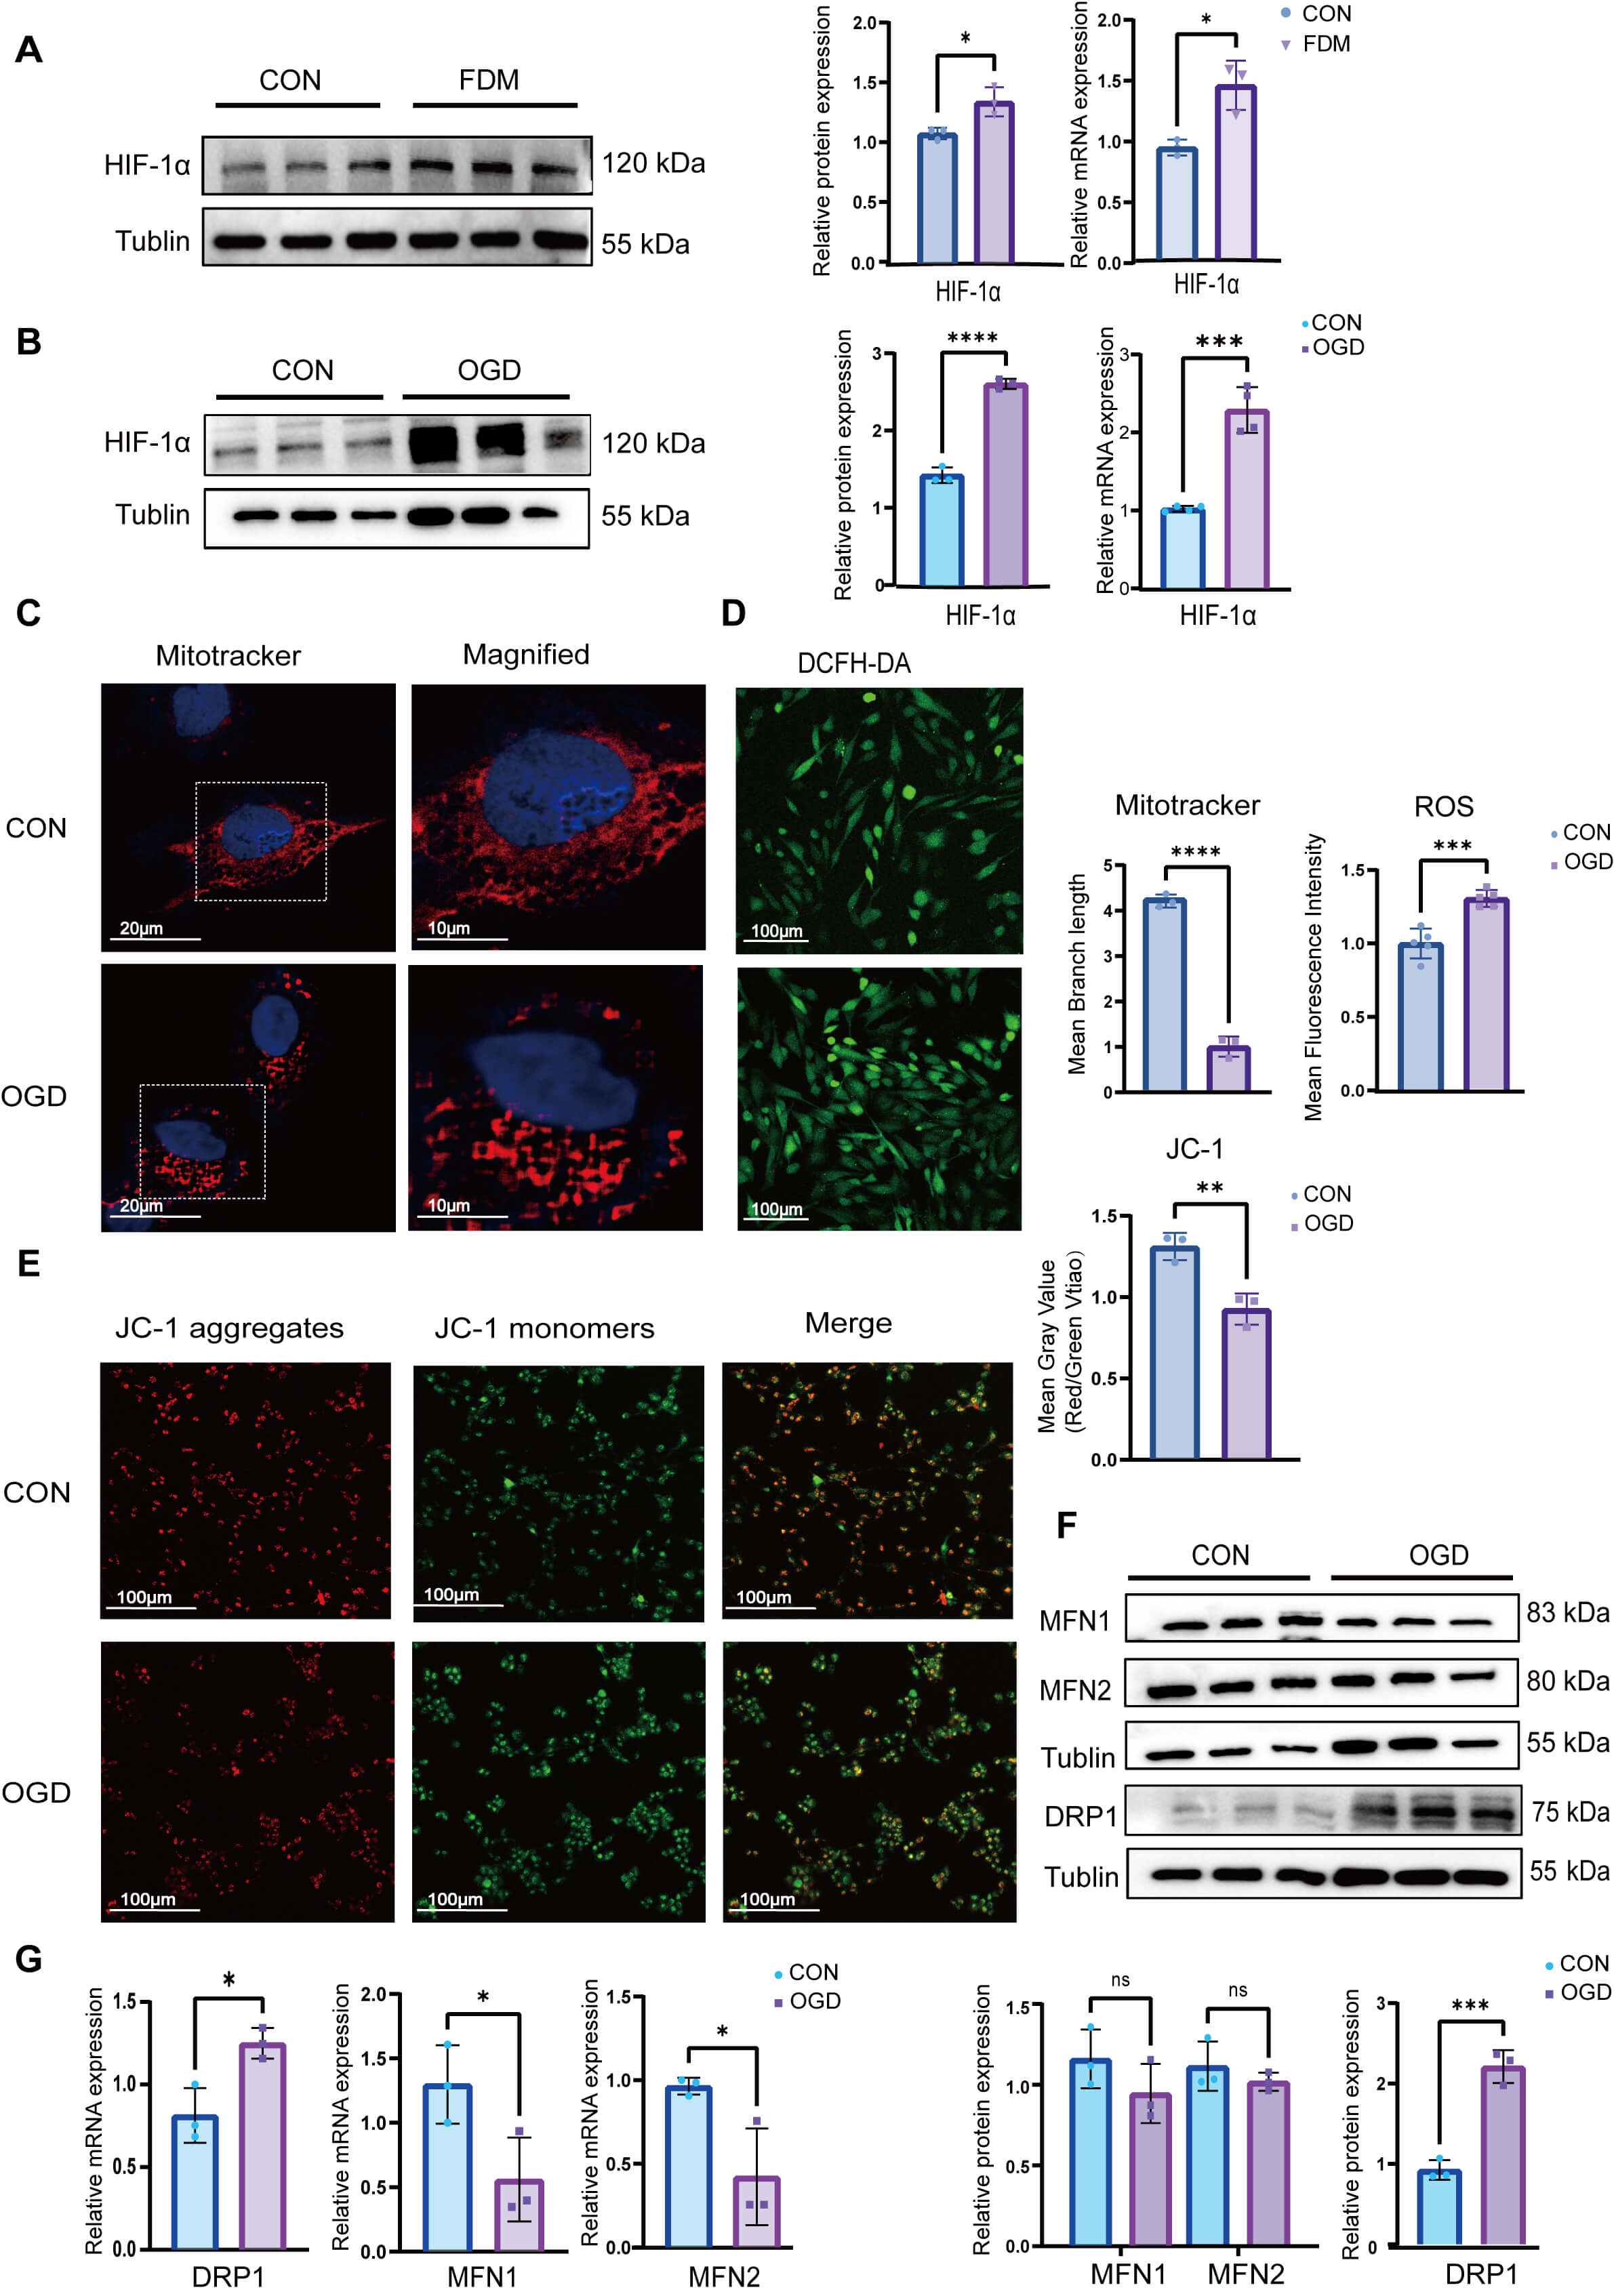 Fig. 2.
Activation of HIF-1
To investigate the effects of scleral hypoxia and mitochondrial fission. In the
FDM group, we observed significant reductions in the expression of type I
collagen, a key component involved in the synthesis of scleral collagen, and
corresponding increases in the expression of
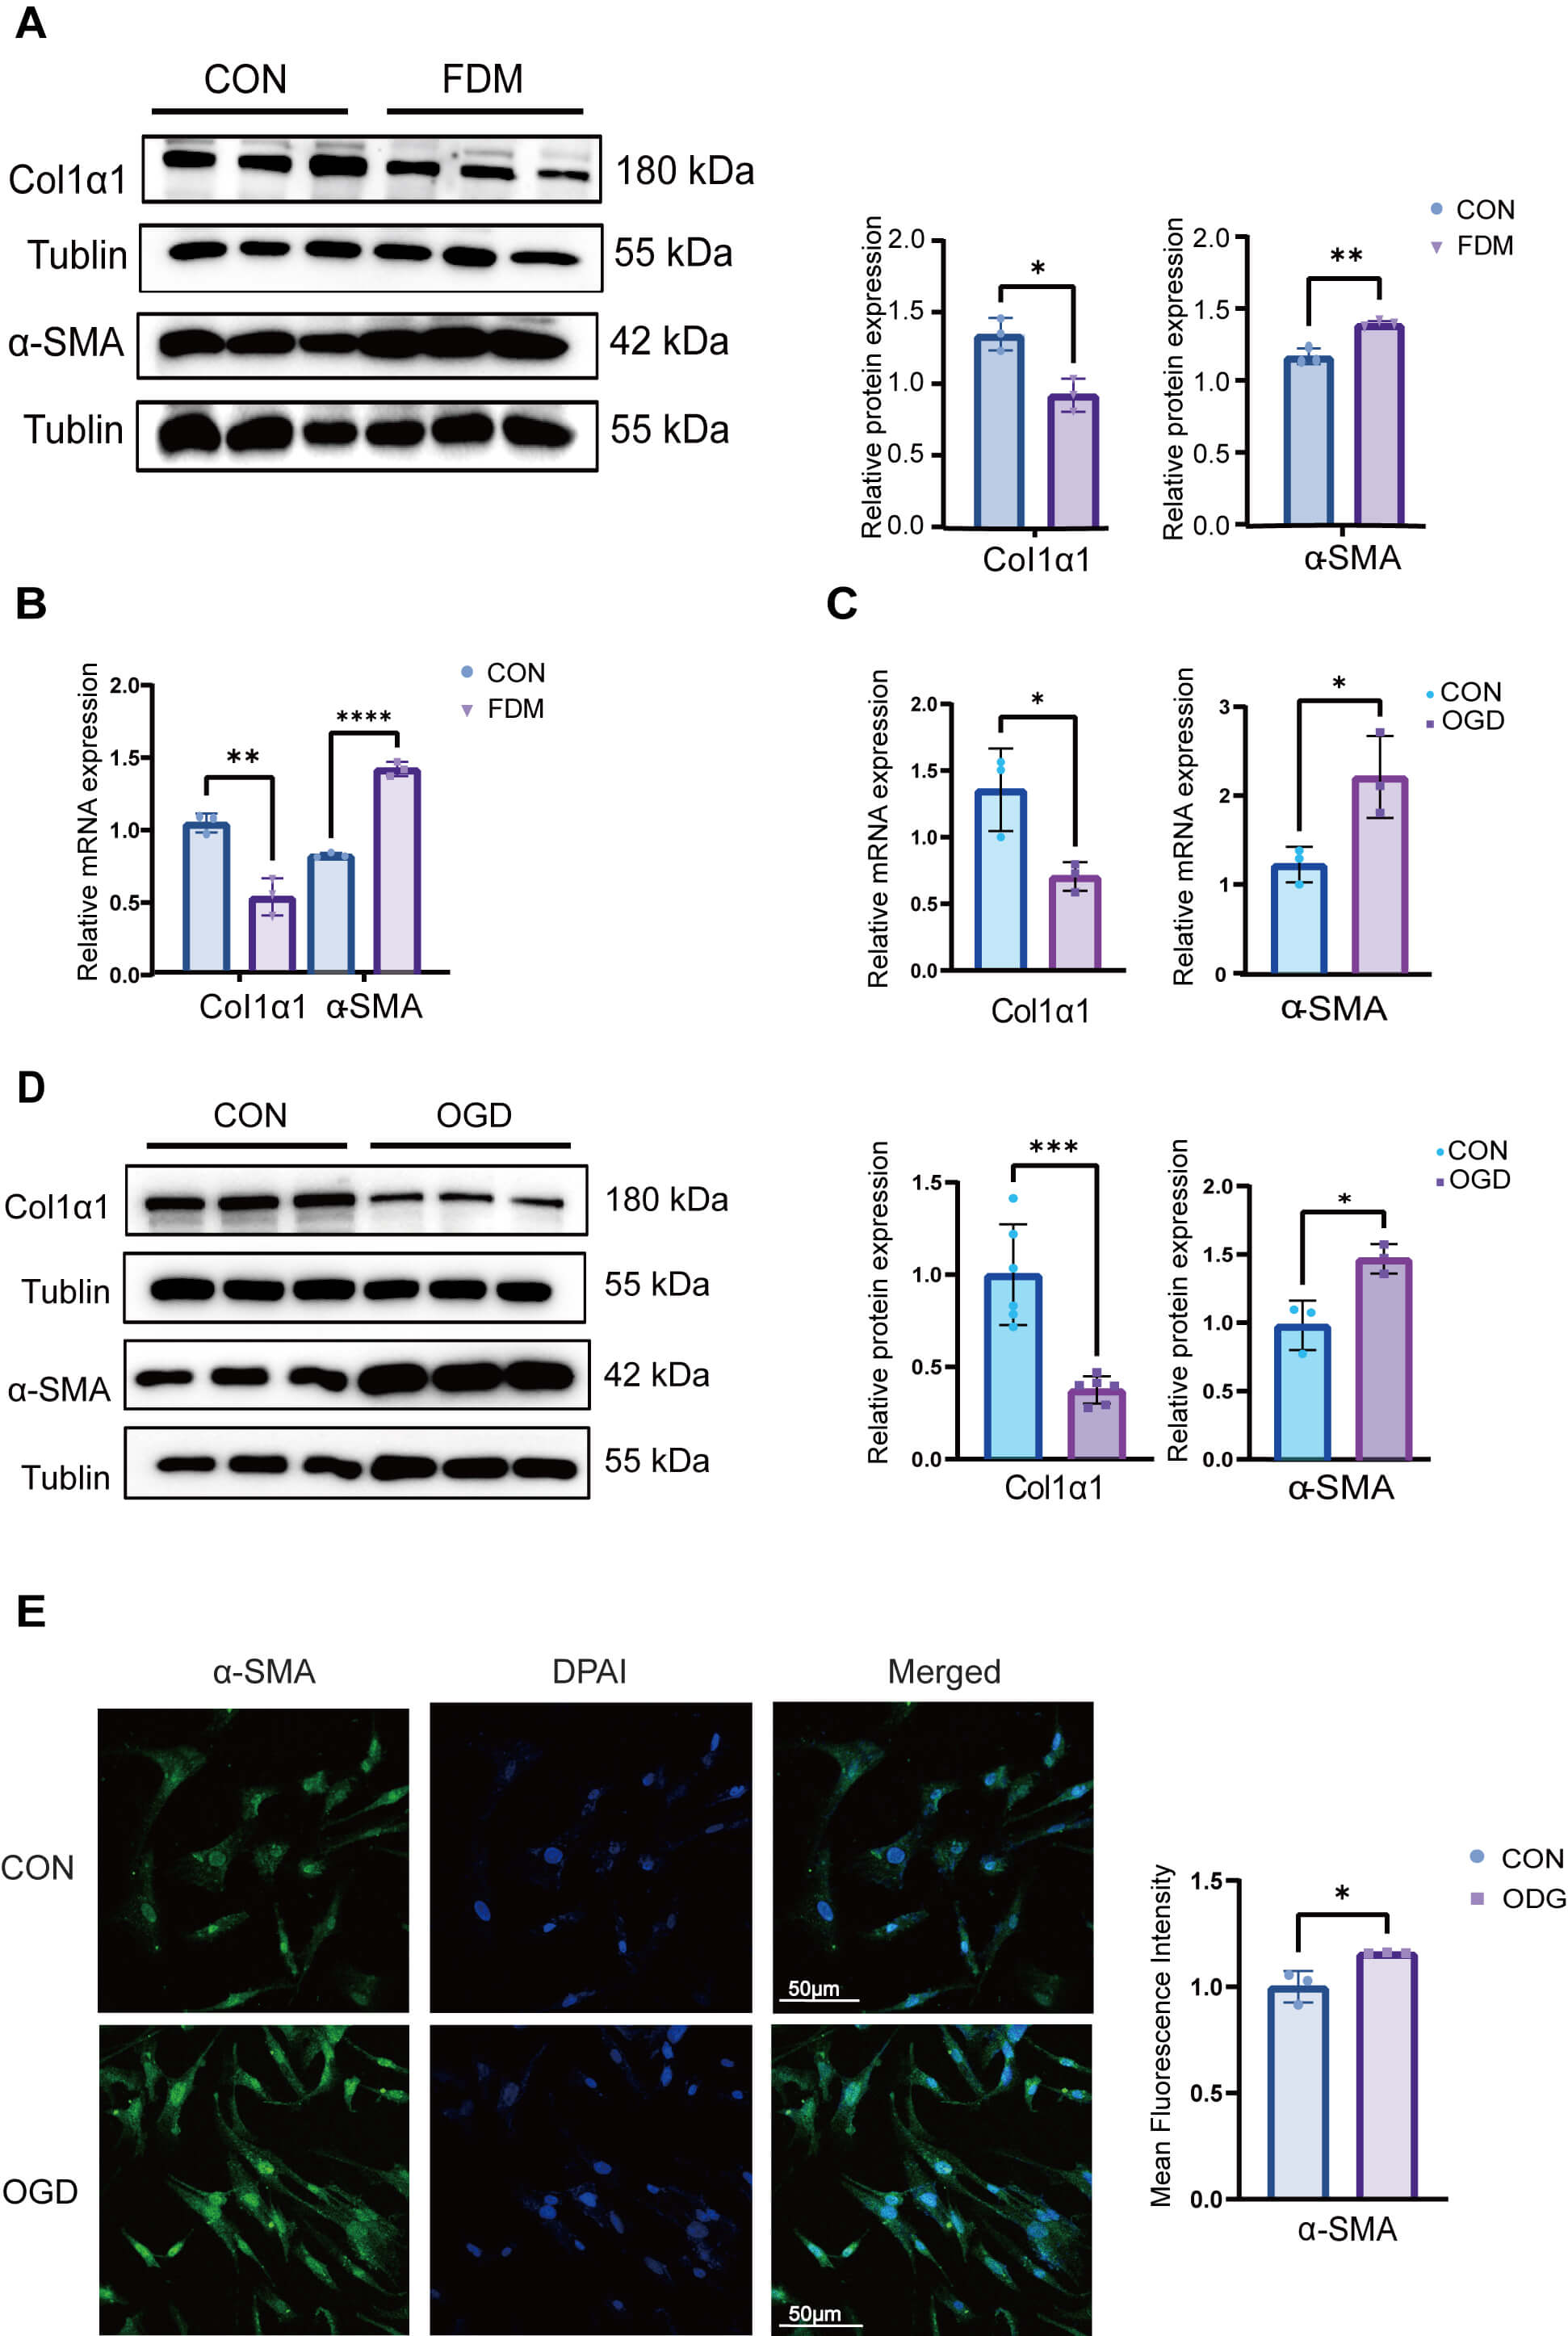 Fig. 3.
Scleral hypoxia-induced FMT increase. (A) Western blot analysis
of Col1
The Notch signaling pathway has been established to play a pivotal role in the
regulation of mitochondrial dynamics, and we accordingly sought to determine
whether Notch1 is implicated in the mitochondrial fission induced by
scleral hypoxia. In the FDM group, we detected elevated levels of Notch1
expression (Fig. 4A), and similar increases in Notch1 expression were
observed in HSFs exposed to hypoxia (Fig. 4B). Contrastingly, reductions in
Notch1 levels were observed following the shRNA transfection-mediated suppression
HIF-1
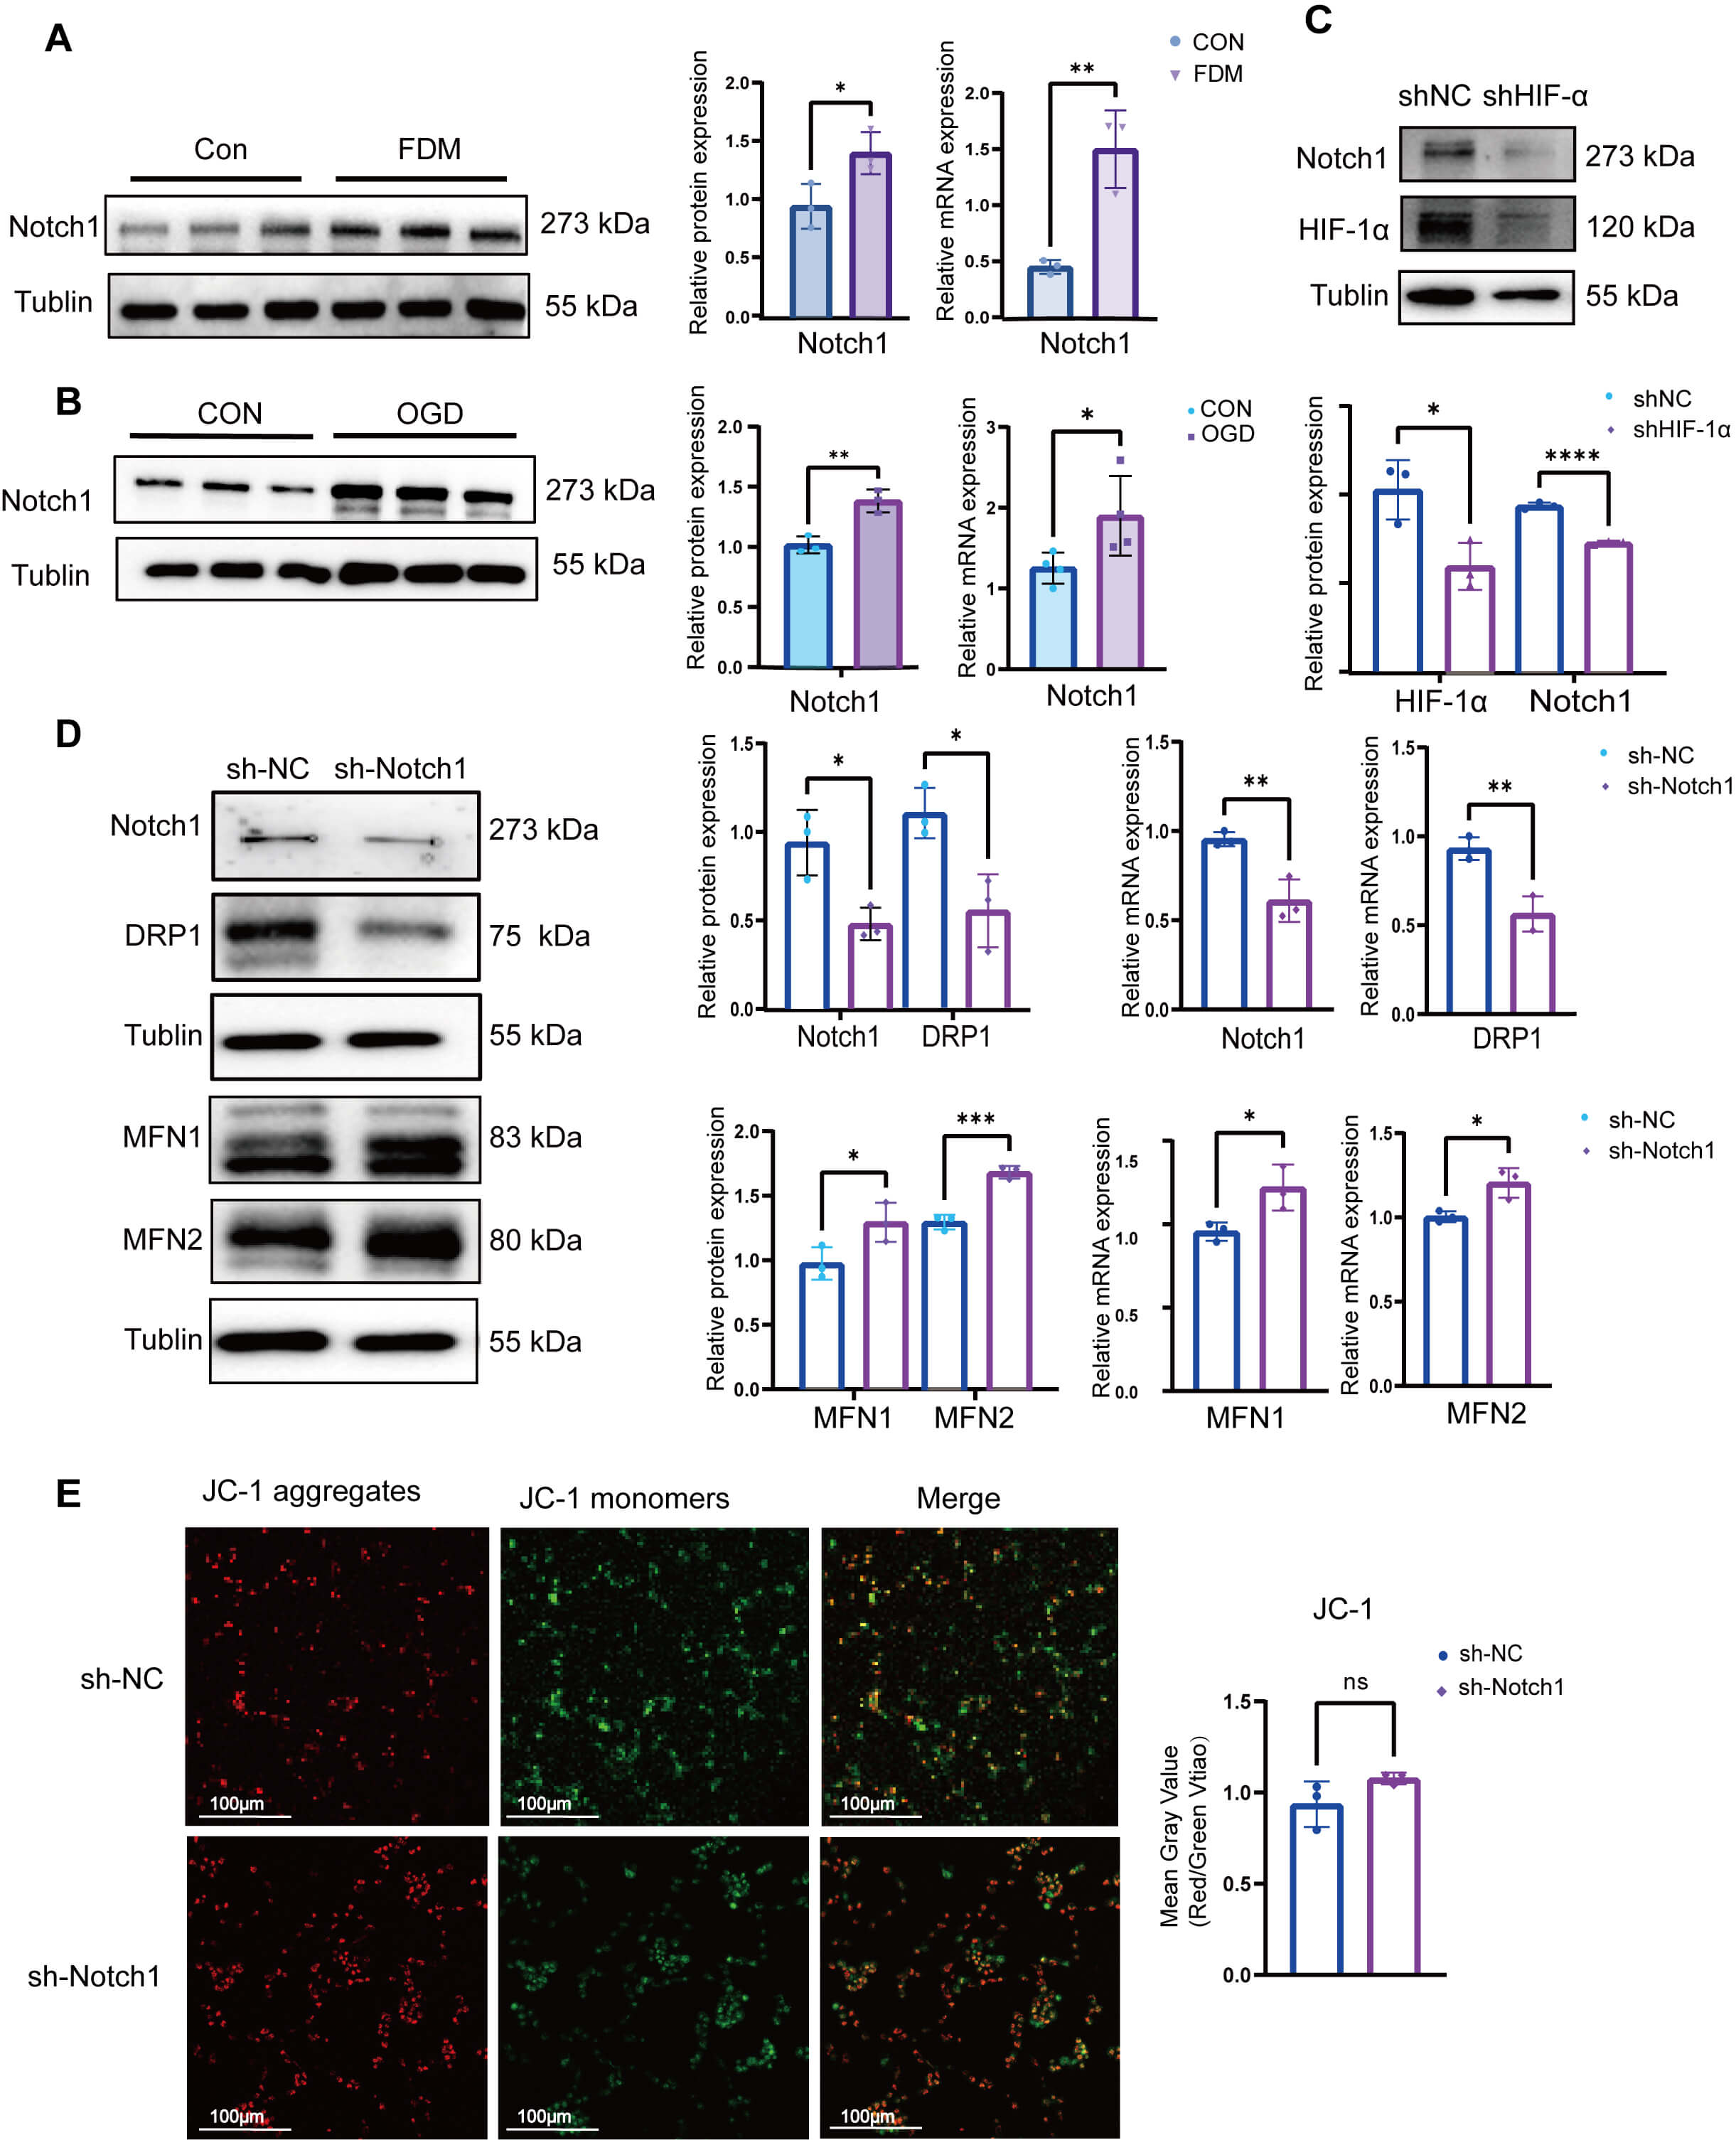 Fig. 4.
HIF-1
As an intervention for myopia, to evaluate the therapeutic potential of
targeting mitochondrial fission to intervene in myopia, we examined the effects
of inhibiting DRP1-dependent mitochondrial fission on extracellular matrix
remodeling in HSFs. The results demonstrated that treatment with mitochondrial
fission inhibitor 1 (Mdivi-1) restored mitochondrial morphology in HSFs to a
typical filamentous network structure (Fig. 5A). Consistently, JC-1 fluorescence staining enhanced red fluorescence, indicating restoration of mitochondrial membrane potential (Fig. 5B). Furthermore, the
intracellular levels of ROS showed no significant difference from those detected
in the negative control group (Fig. 5C). Further analysis of ECM-associated
markers revealed that Mdivi-1 treatment contributed to a significant upregulation
of type I collagen expression and markedly suppressed expression of
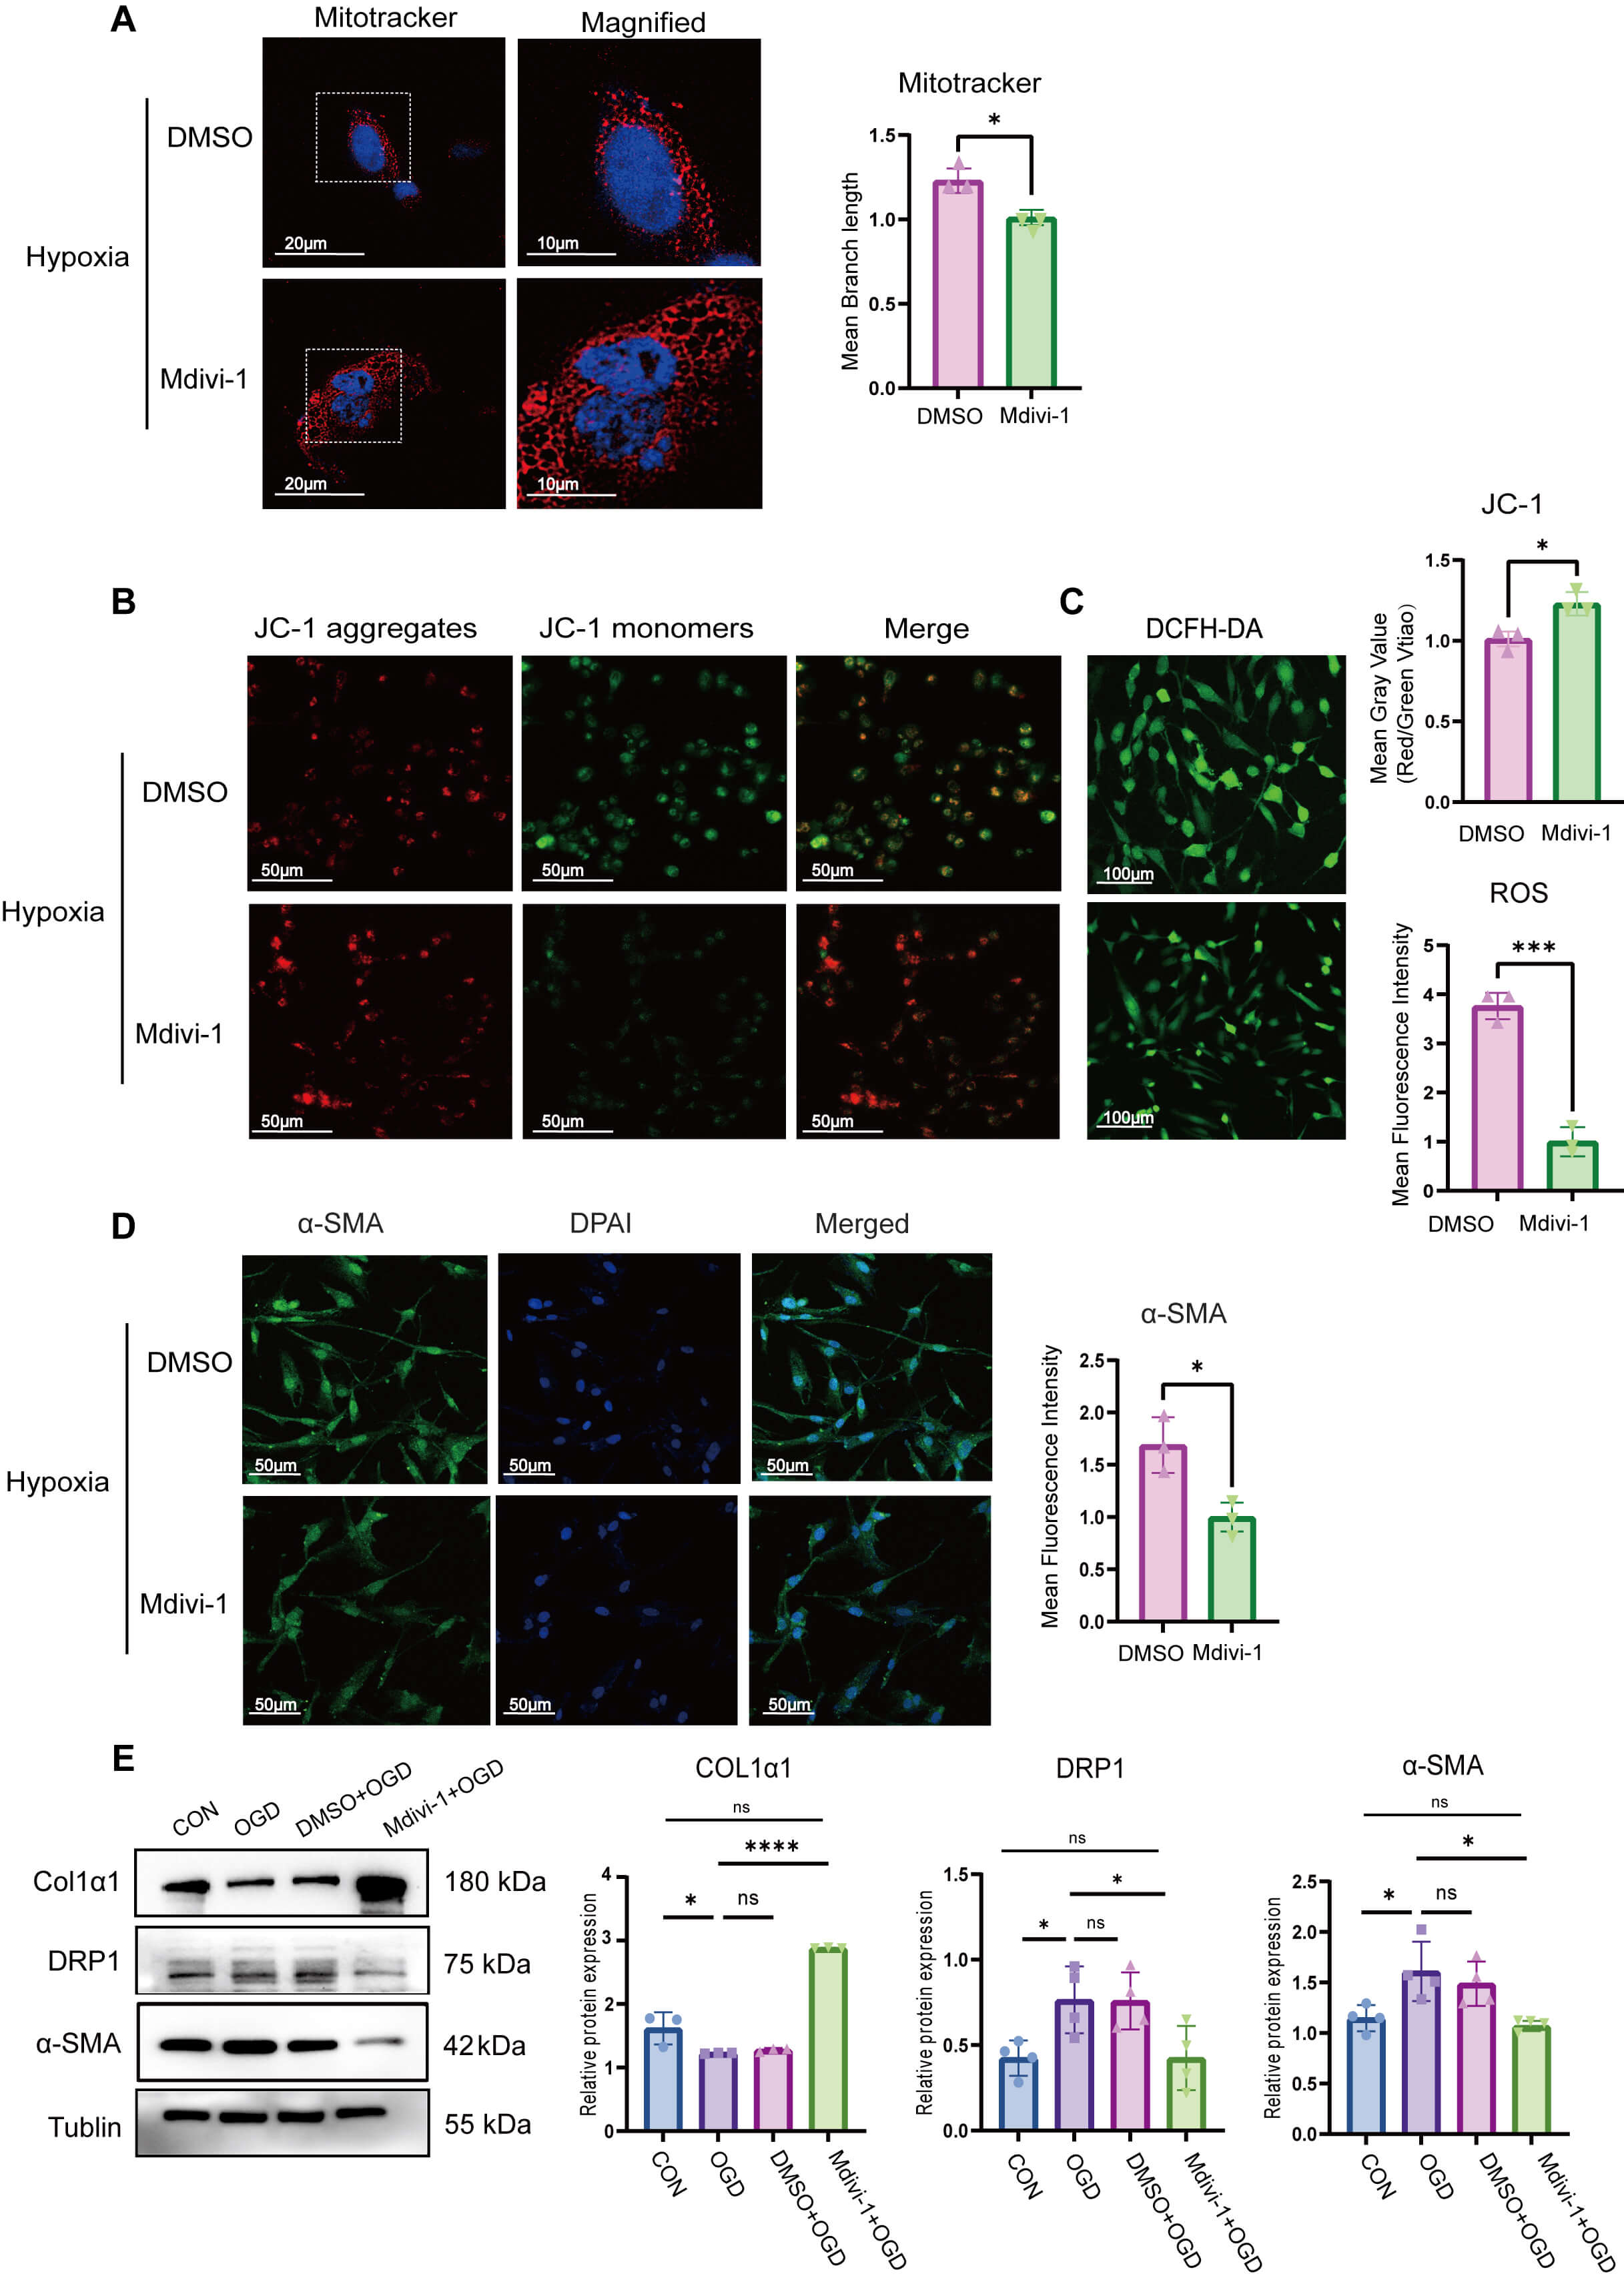 Fig. 5.
Inhibition of mitochondrial fission suppresses FMT. (A) HSFs
treated with negative control or Mdivi-1 (15 µM, Supplementary Fig.
1F) under hypoxia for 24 h; mitochondria labeled with MitoTracker Red, with
length quantified (n = 3), scale bar = 20 µm or 10 µm. (B)
Mitochondrial membrane potential measured via JC-1 staining in HSFs treated with
Mdivi-1 (15 µM) under hypoxia for 24 h (n = 4), scale bar = 50
µm. (C) ROS content detected via DCFH-DA labeling in HSFs treated with
Mdivi-1 (15 µM 24 h) under hypoxia (n = 3), scale bar = 100
µm. (D)
Pathological remodeling of the sclera, a key structure for axial elongation, serves as a core link in the progression of myopia [10, 11], and the hypoxic microenvironment is considered a key inducer of this process. In this study, we investigated the role of mitochondrial fission in scleral remodeling during the progression of myopia. The results showed that hypoxic conditions in scleral tissue are associated with enhanced DRP1 activity and an increase in mitochondrial fission. Shortened, fragmented mitochondria were observed in scleral fibroblasts cultured under hypoxic conditions. Subsequent mechanistic studies suggested that hypoxia may regulate DRP1 expression, at least in part, through activation of the Notch1 signaling pathway, coinciding with increased in mitochondrial fission and an accumulation of ROS. These cellular changes are consistent with those characterizing the FDM model, in which hypoxic stress is assumed to induce processes associated with scleral extracellular matrix remodeling. Notably, pharmacological intervention using the DRP1 inhibitor Mdivi-1 was found to effectively suppress mitochondrial fission and reduce the expression of markers associated with pathological scleral remodeling. However, the translational potential of targeting mitochondrial fission for the treatment of myopia will require further validation in vivo.
Mitochondria are the core organelles orchestrating cellular energy metabolism,
play a crucial role in regulating cell phenotype transformation, signal
transduction, and maintaining redox homeostasis [21]. Notably, however, rather
than functioning as static structures, the mitochondria maintain a dynamic
balance via a continual cycle of fusion and fission, a process referred to as
mitochondrial dynamics [22]. Previous studies have confirmed that mitochondrial
dynamics play a key role in regulating the phenotype and function of a diverse
range of cell types [23]. Qiu YN et al. [24] showed that enhanced
mitochondrial fission is essential for the trans-differentiation of hepatic
stellate cells to myofibroblasts and that targeted inhibition of mitochondrial
fission contributes to a marked inhibition of the progression of liver fibrosis.
Similarly, in lung fibrosis models, transforming growth factor-
The findings of a recent study on mitochondrial dynamics have indicated that mitochondrial fission can be classified into two types based on functional differences: peripheral fission and midzone fission [26, 27]. Midzone fission is more common during normal cellular activities, facilitating the even distribution of mitochondria in the cytoplasm and maintaining energy supply, with stable levels of ROS during this process [16]. In contrast, peripheral fission is often triggered by pathological stress, such as hypoxic and oxidative stress [28, 29], and is frequently accompanied by mitochondrial dysfunction and excessive ROS generation [30], which in turn promotes the formation of pathological cellular phenotypes [31]. We hypothesize that both types of fission may coexist in hypoxia-induced HSFs. Midzone fission is posited to be necessary for the distribution of mitochondria to daughter cells during HSF proliferation to support basal metabolic demands, substantially elevated levels of ROS levels under hypoxic conditions would tend to be indicative of the involvement of peripheral fission.
The Notch signaling pathway has been identified as a key regulator of a diverse
range of cellular processes, including proliferation, differentiation, and
development [32], and the findings of recent studies have indicated that this
pathway is also involved in the redistribution of cellular metabolism, thereby
influencing cell fate. For example, in microglia, the activation of Notch1
instigates the release of NICD, which subsequently undergoes translocation to the
mitochondria in response to hypoxia, and therein promotes an accumulation of ROS
[33]. A recent study reported that post-hypoxic activation of glycolysis in
scleral tissue from myopic animal models increased Notch1 expression [34]. The
present study revealed that the inhibition of Notch1 expression led to a
reduction in DRP1 expression, while concurrently increasing the expression of
MFN1 and MFN2. This finding indicates that Notch may be involved in regulating
mitochondrial fission and fusion processes in HSFs following hypoxia. However,
the underlying crosstalk mechanisms, particularly the direct transcriptional or
post-translational regulation of DRP1 by Notch, warrant further investigation.
Furthermore, Notch1 stability can be modulated by phosphorylation and proteasomal
degradation [35]. Future research should investigate whether kinases known to act
on NOTCH1 influence its levels in hypoxic HSFs, to determine if increases are
solely due to HIF-1
In this study, we demonstrated that pharmacological inhibition of DRP1-induced mitochondrial fission can suppress the expression of hypoxia-induced markers of FMT, a process in which ROS have been hypothesized to play a central role, with concentration-dependent effects. Although physiological levels of ROS are implicated in the regulation of cellular trans-differentiation and tissue remodeling [36] by inducing oxidative damage, an excessive accumulation of ROS has been established to disrupt the functional homeostasis of fibroblasts [37]. Furthermore, mitochondrial fission may influence cellular phenotypes by modulating metabolism (e.g., regulating the tricarboxylic acid cycle and oxidative phosphorylation efficiency) or by releasing damage-associated molecular patterns, such as mitochondrial DNA and cytochrome C [38, 39, 40]. However, the specific role of this mechanism in the myopic sclera requires further investigation.
This study has several limitations that should be considered when interpreting
the results and that define clear directions for future research. Firstly,
although we established an association among hypoxia, Notch1 activation, and
mitochondrial fission, the precise molecular interactions and core regulatory
nodes involved to be elucidated. Further, studies employing techniques such as
chromatin immunoprecipitation and genetic rescue experiments are needed to
establish causality within the HIF-1
Collectively, our findings in this study indicate that during the progression of myopia, scleral hypoxia is associated with an activation of the Notch1 pathway and subsequent disruption of mitochondrial dynamics, events that coincide with changes in the markers of FMT and remodeling of the scleral extracellular matrix. These findings provide evidence for a novel conceptual link between mitochondrial dynamics and hypoxic scleral remodeling in myopia, and will provide a valuable basis for further investigations examining the molecular and cellular mechanisms underlying the development of myopia, as well as a rationale for assessing mitochondrial dynamics as a potential target for strategies that could be adopted to control myopia.
The datasets used or analyzed during the current study are available from the corresponding authors on reasonable request.
JS, KW, LLB, and JW designed the experiments. LLB, JW, and SXL carried out the experiments, MZ and SXL analyzed the experimental data, XMZ and PYH prepared the figures and tables, SMP and XHZ conducted the literature search. Funding acquisition, JS, KW; Writing — original draft, LLB, SXL, and KW; Writing — review & editing, JS, KW, and JW. All authors have read and endorsed the final version of the manuscript. All authors contributed to editorial changes in the manuscript. All authors read and approved the final manuscript. All authors have participated sufficiently in the work and agreed to be accountable for all aspects of the work.
All animal procedures were performed in accordance with the Guide for the Care and Use of Laboratory Animals (8th Edition) published by the National Research Council (US) Institute for Laboratory Animal Research (2011) and approved by the Medical Laboratory Animal Ethics Committee of Tianjin Medical University Eye Hospital (approval No. TJYY2024120244).
Thanks to all the peer reviewers for their opinions and suggestions.
This work was supported by [Tianjin Binhai New Area Health Research Project (Grant No. 2023BWKQ019 and No. 2023BWKZ007); Tianjin Medical University Eye Hospital High-level Innovative Talent Programme (Grant No. YDYYRCXM-E2023-04); and Tianjin Key Medical Discipline Construction Project (Grant No. TJYXZDXK-3-004A-2)].
The authors declare no conflict of interest.
Supplementary material associated with this article can be found, in the online version, at https://doi.org/10.31083/FBL49381.
References
Publisher’s Note: IMR Press stays neutral with regard to jurisdictional claims in published maps and institutional affiliations.