


 , Yulong Deng 1,†, Yuxing Tang 1, Ruiling Su 2, Kesong Nong 1, Wei Qin 3, Zhendong Chen 1, Li Xiao 1, Dandan Xiong 1,*
 , Zhenbo Feng 1,*
1 Department of Pathology, The First Affiliated Hospital of Guangxi Medical University, 530021 Nanning, Guangxi Zhuang Autonomous Region, China
2 Department of Organ Transplantation, The First Affiliated Hospital of Guangxi Medical University, 530021 Nanning, Guangxi Zhuang Autonomous Region, China
3 Department of Hepatobiliary Surgery, The First Affiliated Hospital of Guangxi Medical University, 530021 Nanning, Guangxi Zhuang Autonomous Region, China
†These authors contributed equally.
Abstract
To investigate the impact of low expression of asparaginase (ASPG) in hepatocellular carcinoma (HCC) on tumor metabolic reprogramming, tumor microenvironment interactions, and drug sensitivity, and to assess the potential of ASPG as a tumor suppressor gene through multi-dimensional functional mechanisms.
Thus, ASPG expression in HCC was systemically evaluated by integrating global multi-center mRNA datasets, including RNA-seq and microarray data from 3967 HCCs and 2645 non-HCC samples, single-cell RNA sequencing (scRNA-seq) data from 10 HCCs and 8 adjacent normal tissues, spatial transcriptomics (STs), and internal immunohistochemistry data from 301 HCCs and matched adjacent liver tissues. A CRISPR-mediated gene knockout model was employed to examine the effects of ASPG deletion on HCC cell proliferation. ASPG-associated regulatory pathways were analyzed using Gene Set Enrichment Analysis (GSEA), GeneMANIA, Gene Ontology (GO), and Kyoto Encyclopedia of Genes and Genomes (KEGG) pathway enrichment. Changes in ligand–receptor interactions between low-expression ASPG (ASPG-low) and the tumor microenvironment were examined using CellChat, based on scRNA-seq data. Single-cell metabolism (scmetabolism) and single-cell flux estimation analysis (scFEA) were applied to infer metabolic activity and metabolite conversion pathways under ASPG-low conditions. Finally, correlations between ASPG expression and the IC50 values of anticancer drugs were assessed using OncoPredict.
Multi-dimensional analyses consistently showed that both ASPG mRNA and protein levels were significantly downregulated in HCC. CRISPR-mediated ASPG knockout was associated with significantly increased cell proliferation. Mechanistically, HCC cells with low ASPG expression were enriched in pathways related to alanine, aspartate, and glutamate metabolism, as well as amino acid biosynthesis, gluconeogenesis, and lipid metabolism. Cell–cell communication analysis revealed strong interactions between ASPG-low malignant hepatocytes and myeloid cells, with significant activation of the MIF–(CD74+CXCR4) and MIF–(CD74+CD44) signaling axes. Metabolic analysis demonstrated that the ASPG-low state was associated with alanine, aspartate, and glutamate metabolism, as well as the citric acid (TCA) cycle, thereby regulating the conversion of the aspartate–asparagine and glutamate–2OG metabolites. ASPG-low HCC was associated with resistance to drugs such as cisplatin, oxaliplatin, and gemcitabine, but increased sensitivity to lapatinib and paclitaxel.
Low ASPG expression in HCC may drive aspartate metabolism and reprogramming of the TCA cycle, thereby influencing sensitivity to drug treatment.
Keywords
- hepatocellular carcinoma
- asparaginase
- single-cell analysis
- spatial transcriptomics
- immunohistochemistry
- metabolic reprogramming
Hepatocellular carcinoma (HCC) is the sixth most common cancer type globally and one of the leading causes of cancer-related mortality [1]. HCC arises from hepatocytes and accounts for 75%–85% of primary liver cancer cases [2]. Known risk factors for HCC include alcohol consumption, metabolic diseases, and infections with the hepatitis B virus (HBV) and the hepatitis C virus (HCV) [3]. Treatment options for early–stage HCC are surgical resection, liver transplant, and percutaneous image–guided ablation [4], while chemotherapy and immunotherapy are the best treatment strategies for advanced and unresectable disease [5]. More than 70% of HCC patients are diagnosed at intermediate or advanced stages, and only about 30% are deemed eligible for curative treatment. Due to the frequent recurrence and metastasis of HCC, the five-year survival rate is only 18% [6, 7, 8]. To improve the prognosis and treatment of HCC patients, novel biomarkers with high specificity and sensitivity are required, together with an understanding of their molecular regulatory mechanisms.
Metabolic reprogramming is one of the hallmarks of tumor cells, supporting their rapid proliferation and survival advantage through alterations in energy metabolism, enhanced biosynthesis, and maintenance of redox balance [9]. Aspartic acid, a key non-essential amino acid, plays a critical role in cell proliferation. It serves not only as a precursor for pyrimidine and purine nucleotide synthesis, but also helps in maintaining mitochondrial metabolism and redox balance via the malate-aspartate shuttle [10]. Its amide derivative, asparagine, also plays a pivotal role in tumor metabolism. The enzyme asparaginase (ASPG) catalyzes the hydrolysis of asparagine and demonstrates anti-tumor activity, indicating a significant role in regulating asparagine levels and related metabolic pathways [11]. Recent studies have shed light on the potential role of ASPG in different cancer types. ASPG was incorporated into a 13-inflammation-associated gene prognostic model for colorectal cancer (CRC), where its expression was found to correlate with expression of the PD-1 and PD-L1 immune checkpoint molecules, indicating that high-risk patients may be more sensitive to immunotherapy [12]. In colon adenocarcinoma, ASPG was identified as a key gene in a prognostic model based on 10 amino acid metabolism-related genes, which was further validated to predict patient responses to PD-1/CTLA-4 immune therapy [13]. These findings suggest that ASPG not only participates in the regulation of amino acid metabolism, but may also influence the tumor immune microenvironment and treatment response. Although ASPG was identified by machine learning methods as a potential diagnostic biomarker in HCC [14], the role of ASPG in HCC has not been specifically addressed, with most studies mentioning ASPG only in the context of a candidate diagnostic biomarker.
Consequently, this study systematically investigated the metabolism-related functional mechanisms of ASPG in HCC through multi-level expression characteristics. The ASPG expression pattern in HCC was analyzed using data obtained by different experimental approaches, including bulk RNA data (generated from global multi-center microarrays and RNA-seq), single-cell RNA sequencing (scRNA-seq), spatial transcriptomics (ST), and experimentally validated protein expression determined by immunohistochemistry (IHC). The results show that ASPG expression can alter the composition of various cell populations within the tumor microenvironment (TME), as well as the strength of ligand-receptor interactions. We also examined the regulatory role of ASPG in various signaling pathways related to metabolism, and the association between ASPG expression and sensitivity to anti-tumor drugs. The overall aim of this study was to clarify the biological significance of ASPG in HCC and to elucidate its role in metabolic reprogramming, thus providing a theoretical basis for the development of ASPG as a novel molecular biomarker and therapeutic target. A summary of the main findings is shown in Fig. 1.
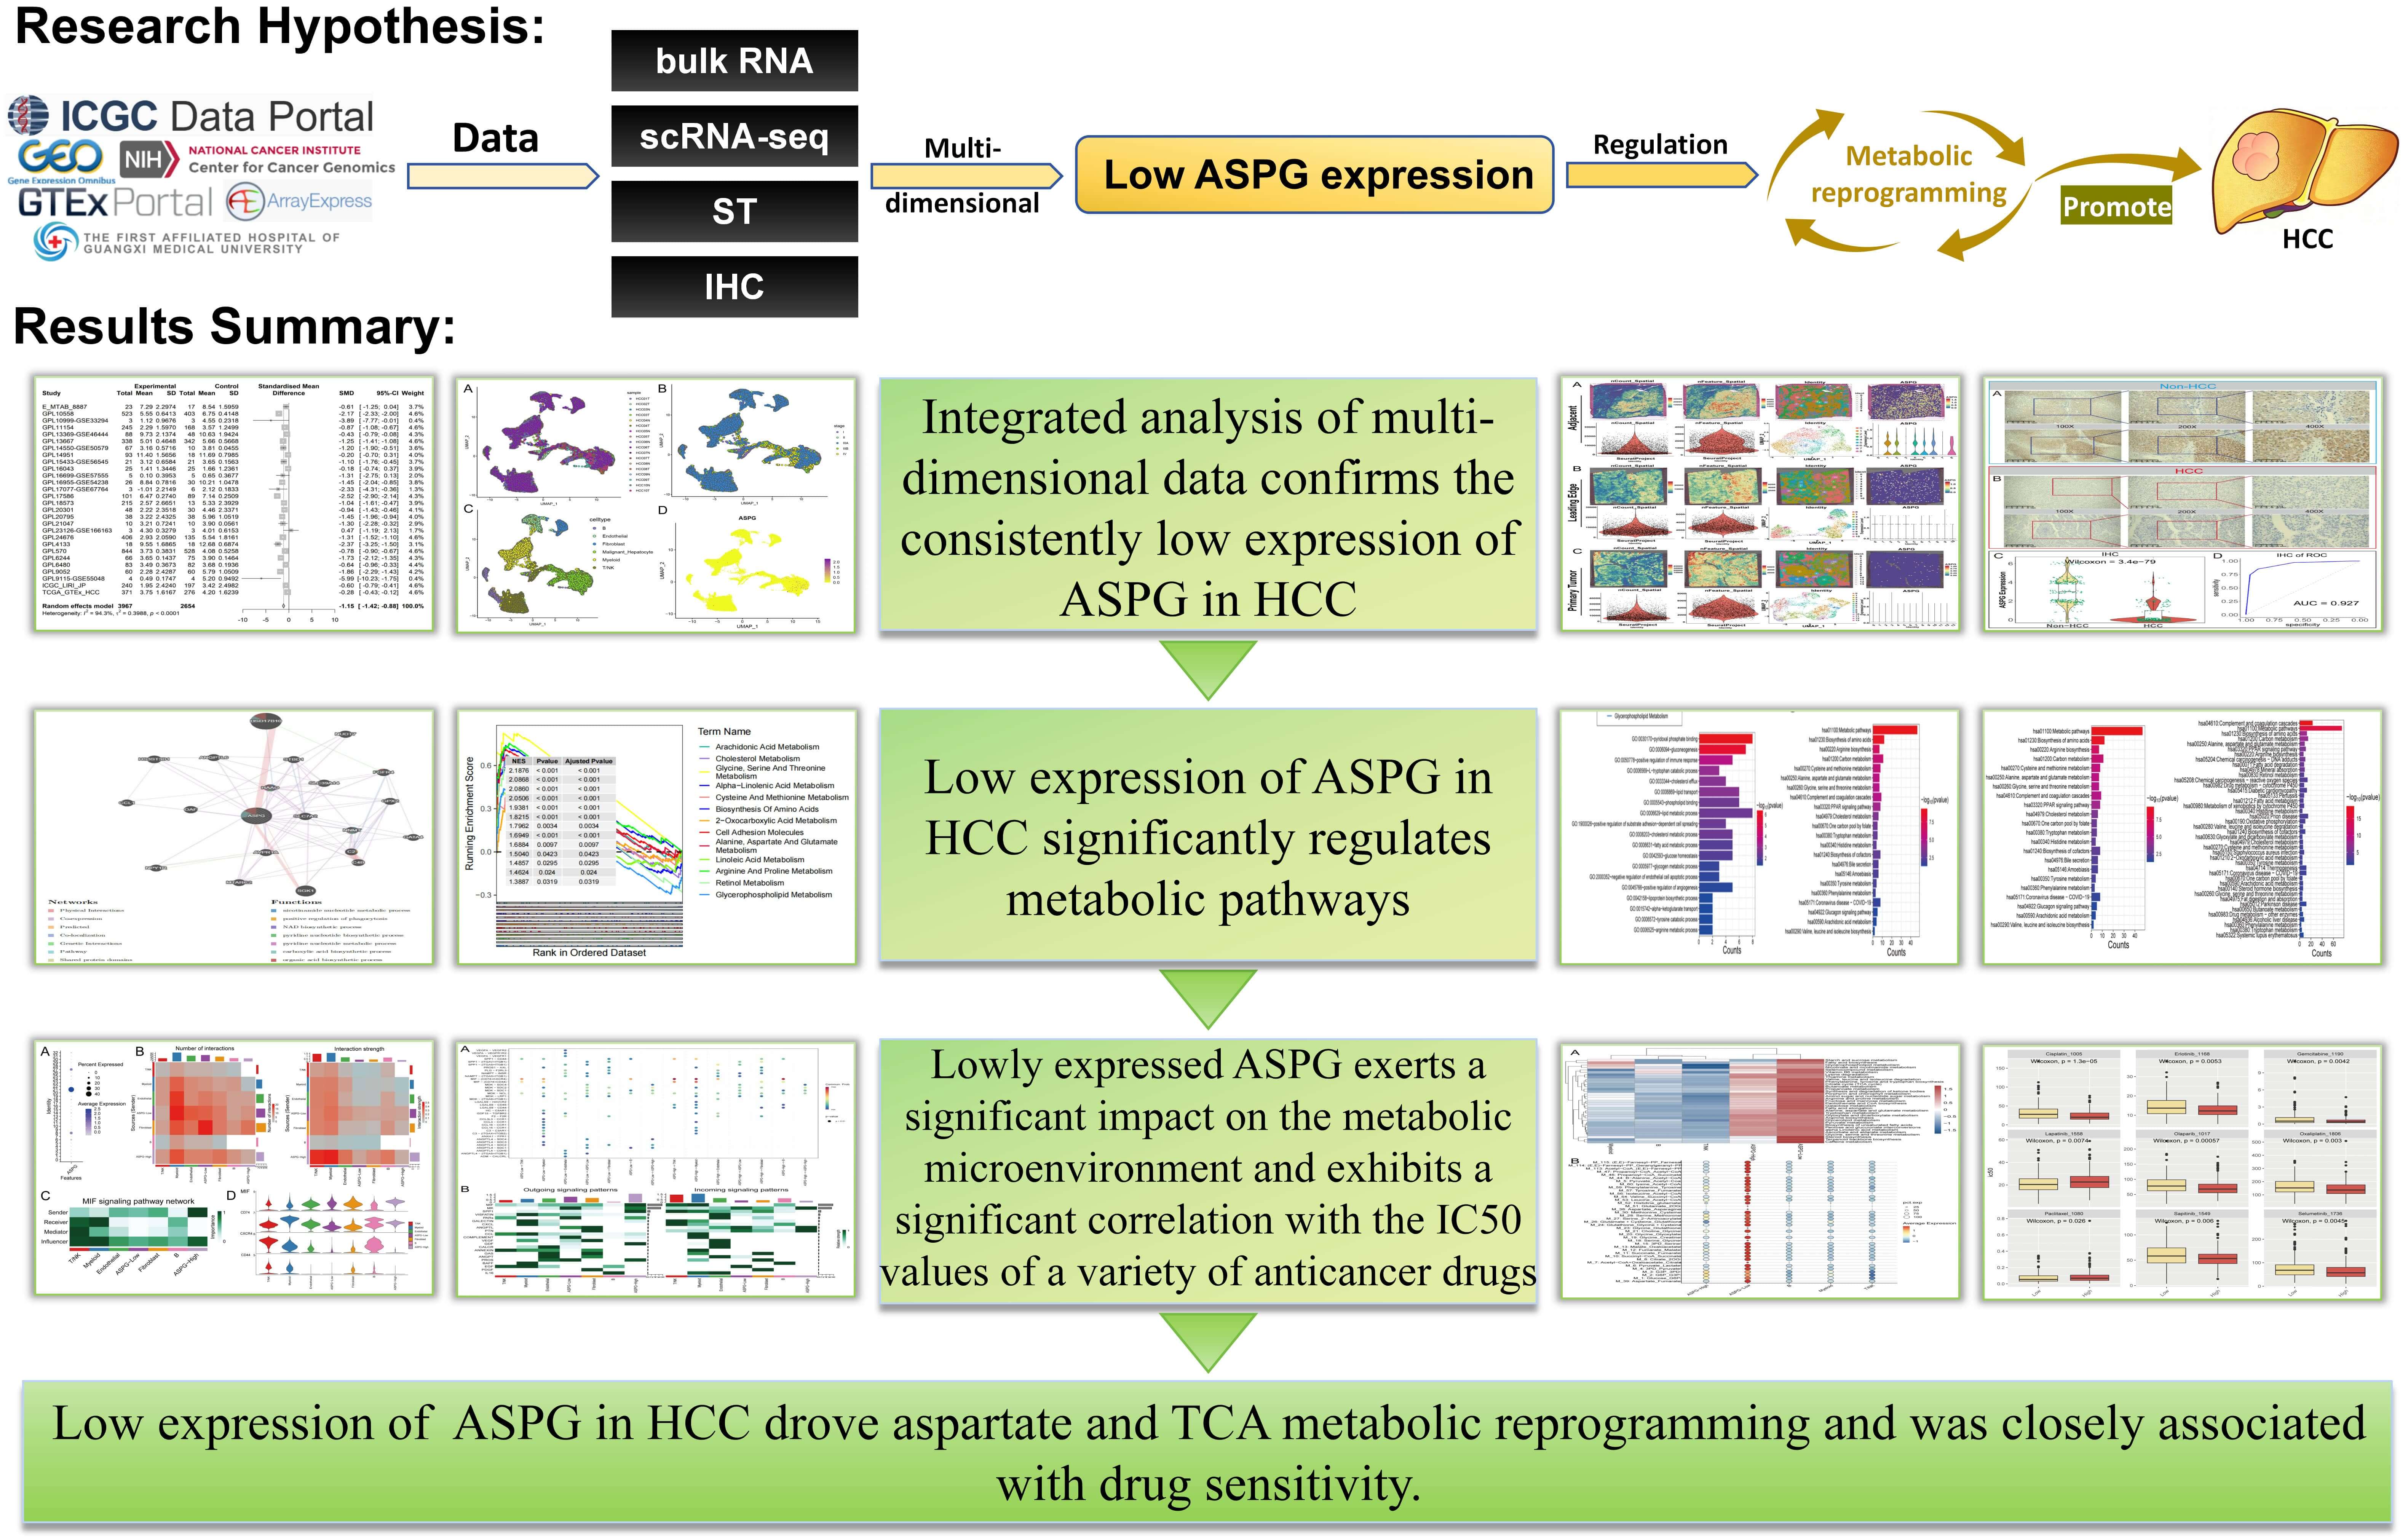 Fig. 1.
Overview of key findings in the present study (Microsoft Corporation, Redmond, WA, USA). ST, spatial transcriptomics; IHC, immunohistochemistry; ASPG, asparaginase; HCC, hepatocellular carcinoma; TCA, the citric acid cycle.
The expression of ASPG mRNA in HCC tissues was assessed by collecting bulk RNA
data from several high-throughput datasets, including The Cancer Genome Atlas
(TCGA, https://portal.gdc.cancer.gov/), Gene Expression Omnibus (GEO,
https://www.ncbi.nlm.nih.gov/geo/), Sequence Read Archive (SRA,
https://www.ncbi.nlm.nih.gov/sra/), and Genotype-Tissue Expression (GTEx,
https://gtexportal.org/) databases. The inclusion and exclusion criteria were as
follows: (1) datasets containing both HCC and control groups (normal liver tissue
or adjacent non-cancerous tissue), with exclusion of metastatic cancer samples;
(2) datasets with a sample size of
The expression, distribution, and functional profile of ASPG within the HCC
microenvironment were characterized using scRNA-seq data from GSE149614,
consisting of 10 HCC samples and 8 adjacent samples. Cells were filtered based on
the criteria of 200
A total of 301 HCC tissue samples and corresponding adjacent non-tumor liver
tissues were collected from patients at the First Affiliated Hospital of Guangxi
Medical University. The samples were fixed in formalin, embedded in paraffin, and
deparaffinized with ethylenediaminetetraacetic acid (EDTA) buffer. Endogenous
peroxidase activity was then blocked, and the tissues subsequently incubated at
room temperature for 90 minutes with an anti-ASPG polyclonal antibody (Thermo
Fisher Scientific, Waltham, MA, USA; Cat. No. PA5-64429; dilution 1:500). This
was followed by incubation with HRP-labeled Poly-HRP anti-Mouse/Rabbit IgG
antibody mixture (Shanghai Changdao Antibody Diagnostic Reagent Co., Ltd.,
Shanghai, China; Cat. No. D-3004-15) for 30 minutes and DAB staining at room
temperature. During the process.phosphate-buffered saline was used to wash the
slides in order to eliminate any unbound primary and secondaryantibodies. After
the staining procedure, the tissue microarrays underwent dehydration and were
then covered with neutral resin before storage at room temperature. IHC scoring
was independently assessed by two senior pathologists based on staining
intensity, using the following scoring criteria: 0 (no staining), 1 (light
yellow), 2 (light brown), and 3 (dark brown). The percentage of positive cells
was scored as follows: 0 (
ST data concerning adjacent, leading edge, and primary tumor tissues (HCC2N, HCC2L, and HCC2T) were sourced from a patient sample through the following website: http://lifeome.net/supp/livercancer-st/data.htm [18]. Data normalization, log transformation, centering, and scaling were performed using the SCTransform method and the Seurat package in R, with the parameter dim set to 1:15. Dimensionality reduction and clustering were carried out using the Seurat functions RunPCA, FindNeighbors, FindClusters, and RunUMAP. Spatial data was visualized using the SpatialDimPlot function.
The expression level of ASPG mRNA in different HCC cell lines was evaluated based on data from the Cancer Cell Line Encyclopedia (CCLE). Additionally, knockout data for ASPG based on CRISPR were downloaded from the DepMap portal. Chronos scoring was utilized to evaluate the effects of gene knockout on cell proliferation. The higher the Chronos score, the stronger the proliferative effect of ASPG knockout.
Patients from the TCGA-LIHC dataset were divided into ASPG-high and ASPG-low expression groups based on the median value. Genes with differential expression between these two groups were then identified, and GSEA enrichment analysis was subsequently performed. A preliminary investigation was conducted on the molecular network regulatory mechanisms of ASPG by integrating GeneMANIA, shedding light on the potential role of ASPG as a modulator in HCC.
In the bulk RNA dataset, Pearson correlation analysis was conducted to identify
genes that showed a positive correlation with ASPG expression. Genes were
selected based on the following criteria: correlation coefficient R
To further analyze the potential mechanisms of ASPG in HCC at the scRNA-seq
level, we screened the correlated genes related to ASPG in malignant hepatocytes
(R
In order to explore the role of ASPG in cell-to-cell communication within the HCC microenvironment, we re-clustered malignant hepatocytes according to their ASPG expression level (ASPG-high and ASPG-low). Using the “CellChat” package, we analyzed the interactions between ASPG-low malignant hepatocytes and other cell types, focusing on changes in ligand-receptor interactions between cells. This analysis provided insights into how low expression of ASPG influences intercellular communication and interactions in the HCC microenvironment [20].
In order to investigate the cellular metabolic flux and metabolite abundance, the scMetabolism tool was used to score individual cells from scRNA-seq data. This provides a means to further investigate the metabolic activity of different cell types [21]. Flux data analysis was performed using Single-Cell Flux Estimation Analysis (scFEA v1.1.2). This new probabilistic model incorporates a balance of fluxes and a graph neural network-based optimization solver. The method uses neural networks to extract complex information flow from the transcriptome to the metabolome. It also uses scRNA-seq data to infer cellular metabolic flux profiles and metabolite quantities [22, 23, 24, 25].
In order to evaluate the therapeutic potential of ASPG in HCC, we analyzed transcriptomic data from the TCGA LIHC and utilized the oncoPredict algorithm to systematically assess the correlation between ASPG expression level and the IC50 value of various anticancer drugs [26].
Except where otherwise specified, all statistical analyses and computational
algorithms were performed using R software (version 4.3.1; R Foundation for
Statistical Computing, Vienna, Austria). Differences in ASPG expression at both
the mRNA and protein levels between HCC and non-tumor tissues were assessed using
the Wilcoxon rank-sum test. To calculate the expression of bulk RNA ASPG, a
fixed-effects model (I2
In this study, 85 datasets were collected and merged into 28 platform datasets.
The analysis of ASPG mRNA expression across these platform datasets found that 19
datasets showed significantly lower ASPG mRNA expression in HCC samples compared
to non-HCC samples (AUC
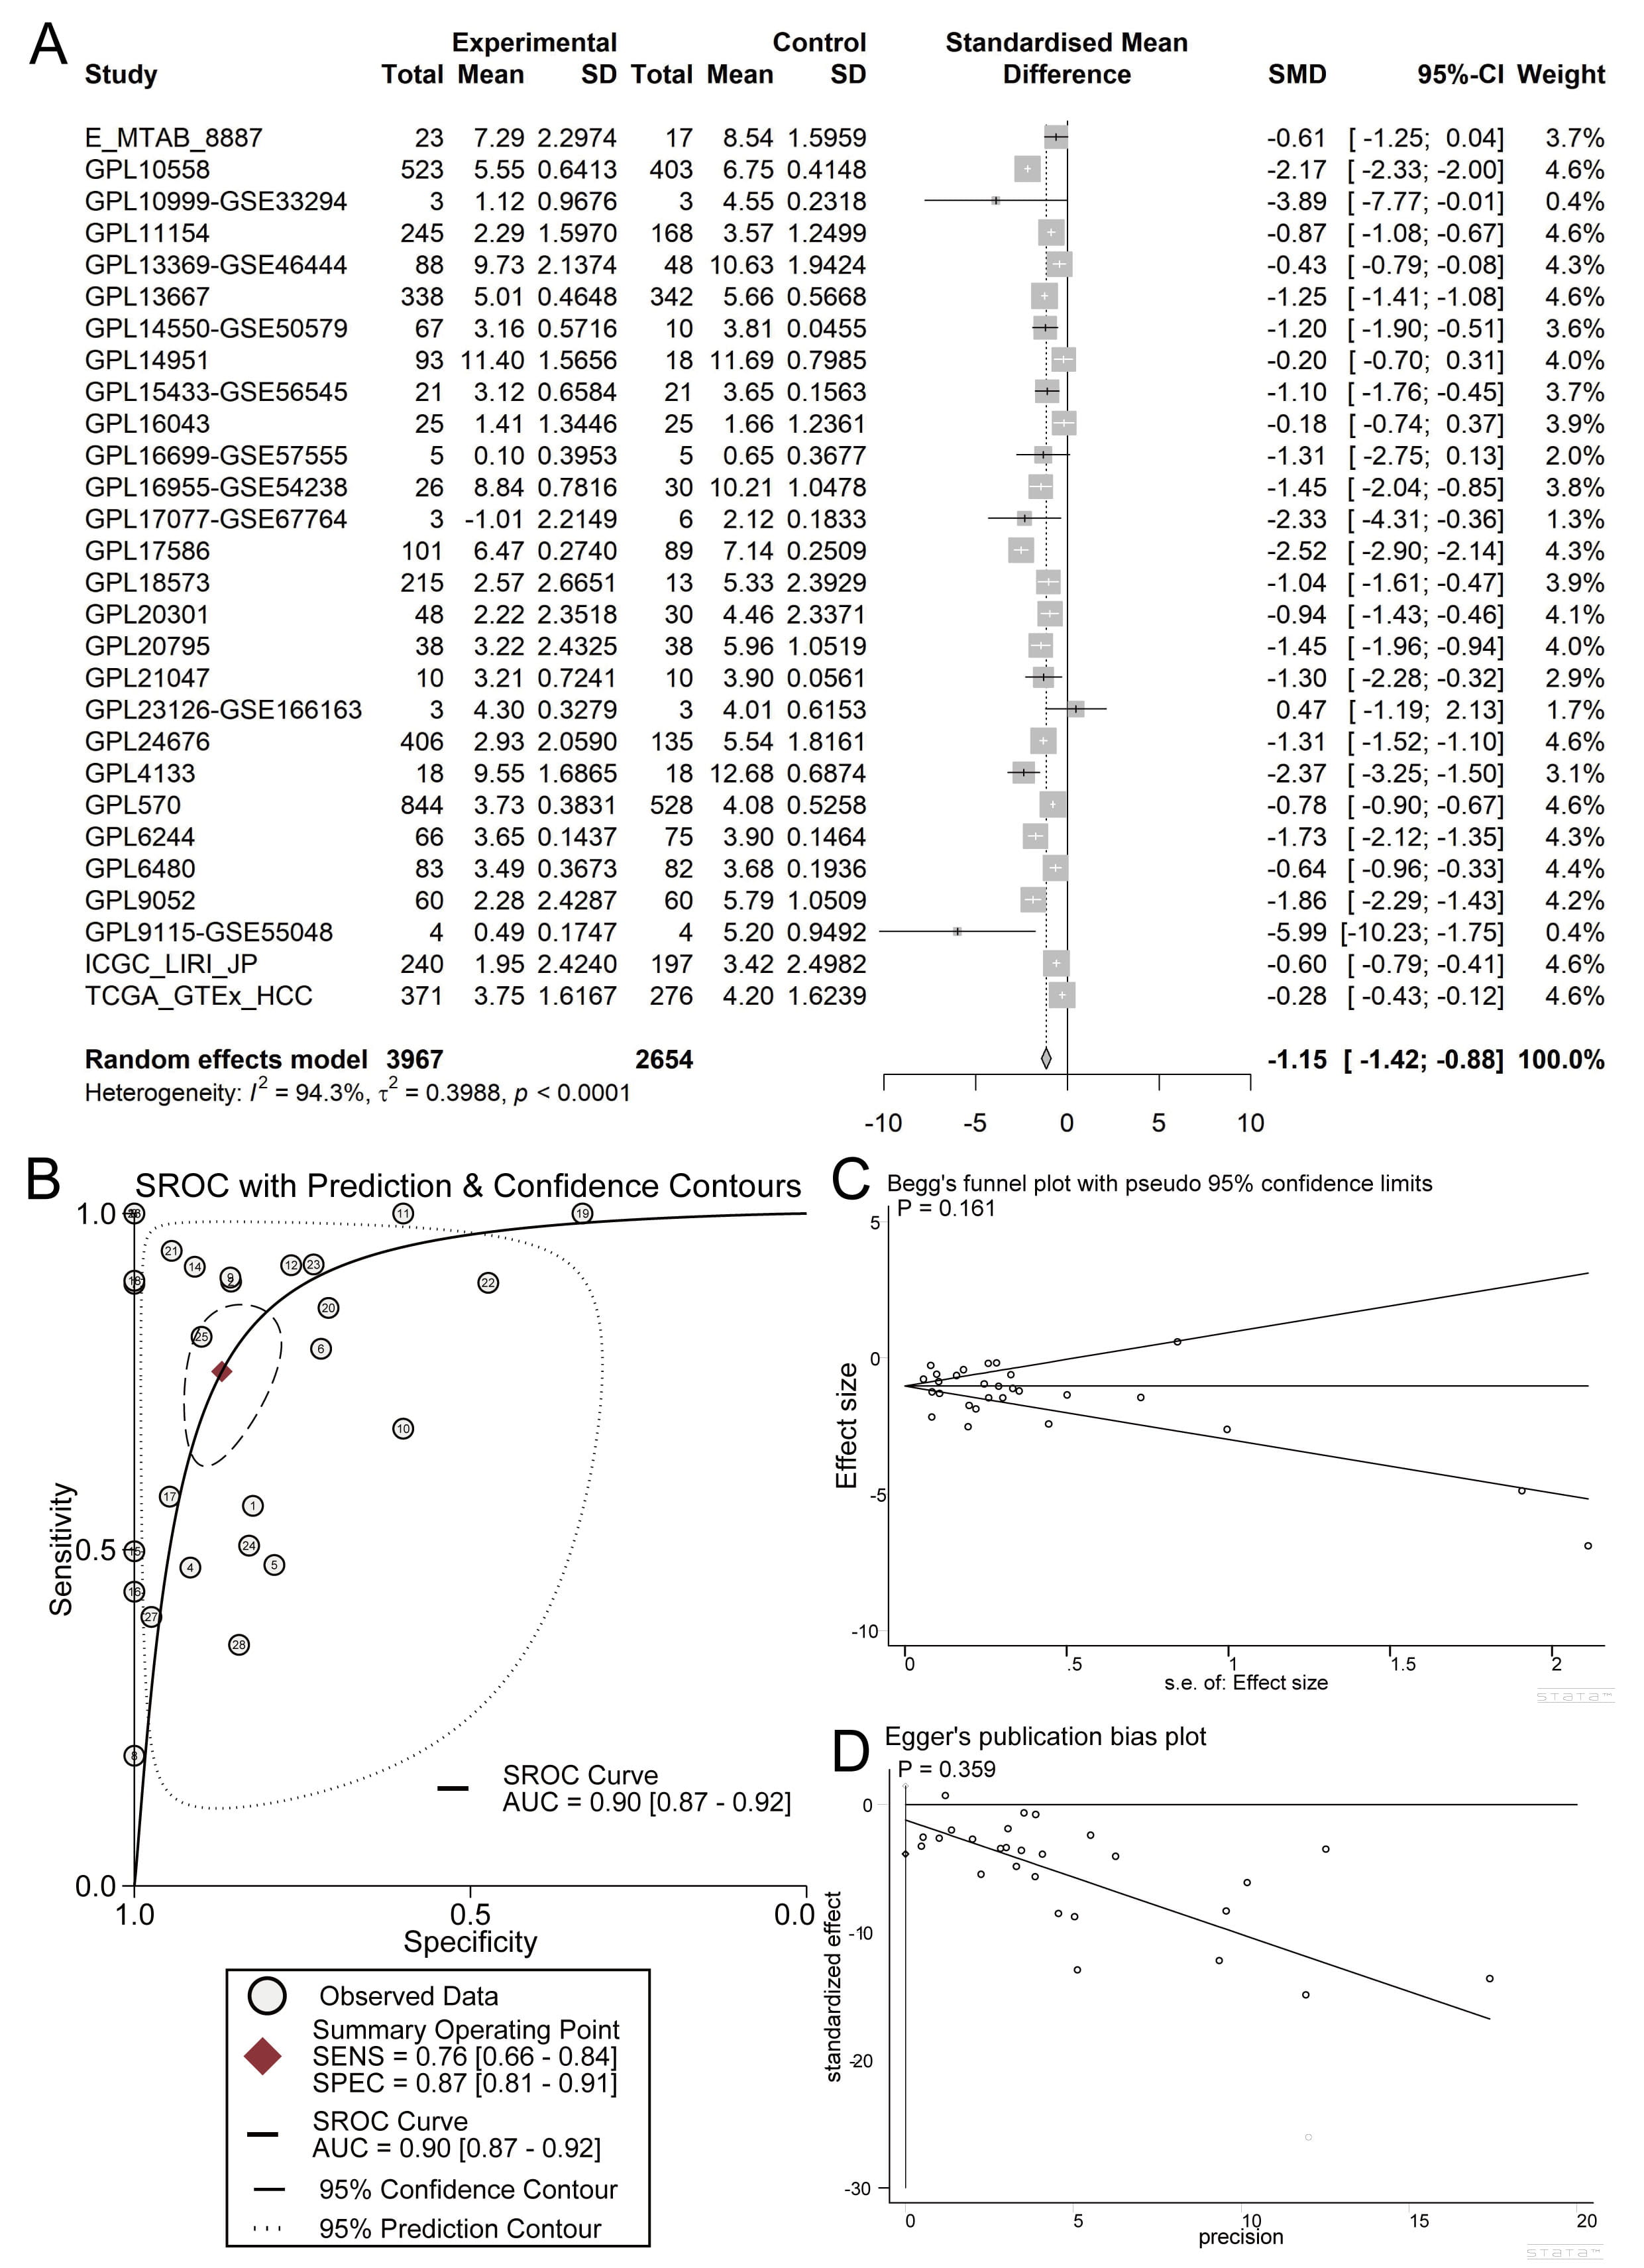 Fig. 2.
Overall expression levels of ASPG mRNA in global HCC samples. (A) Forest plot of ASPG mRNA expression. (B) sROC curve. (C) Begg’s test. (D) Egger’s test.
This study used scRNA-seq data from 8 non-HCC and 10 HCC samples (Fig. 3A). The HCC samples included clinical stages I, II, IIIA, IIIB, and IV (Fig. 3B). Following the processes of clustering and annotation, the samples were categorized into six cell types: B cells, endothelial cells, fibroblasts, malignant hepatocytes, myeloid cells, and T/NK cells (Fig. 3C). Notably, significant downregulation of ASPG was observed in malignant hepatocytes (Fig. 3D).
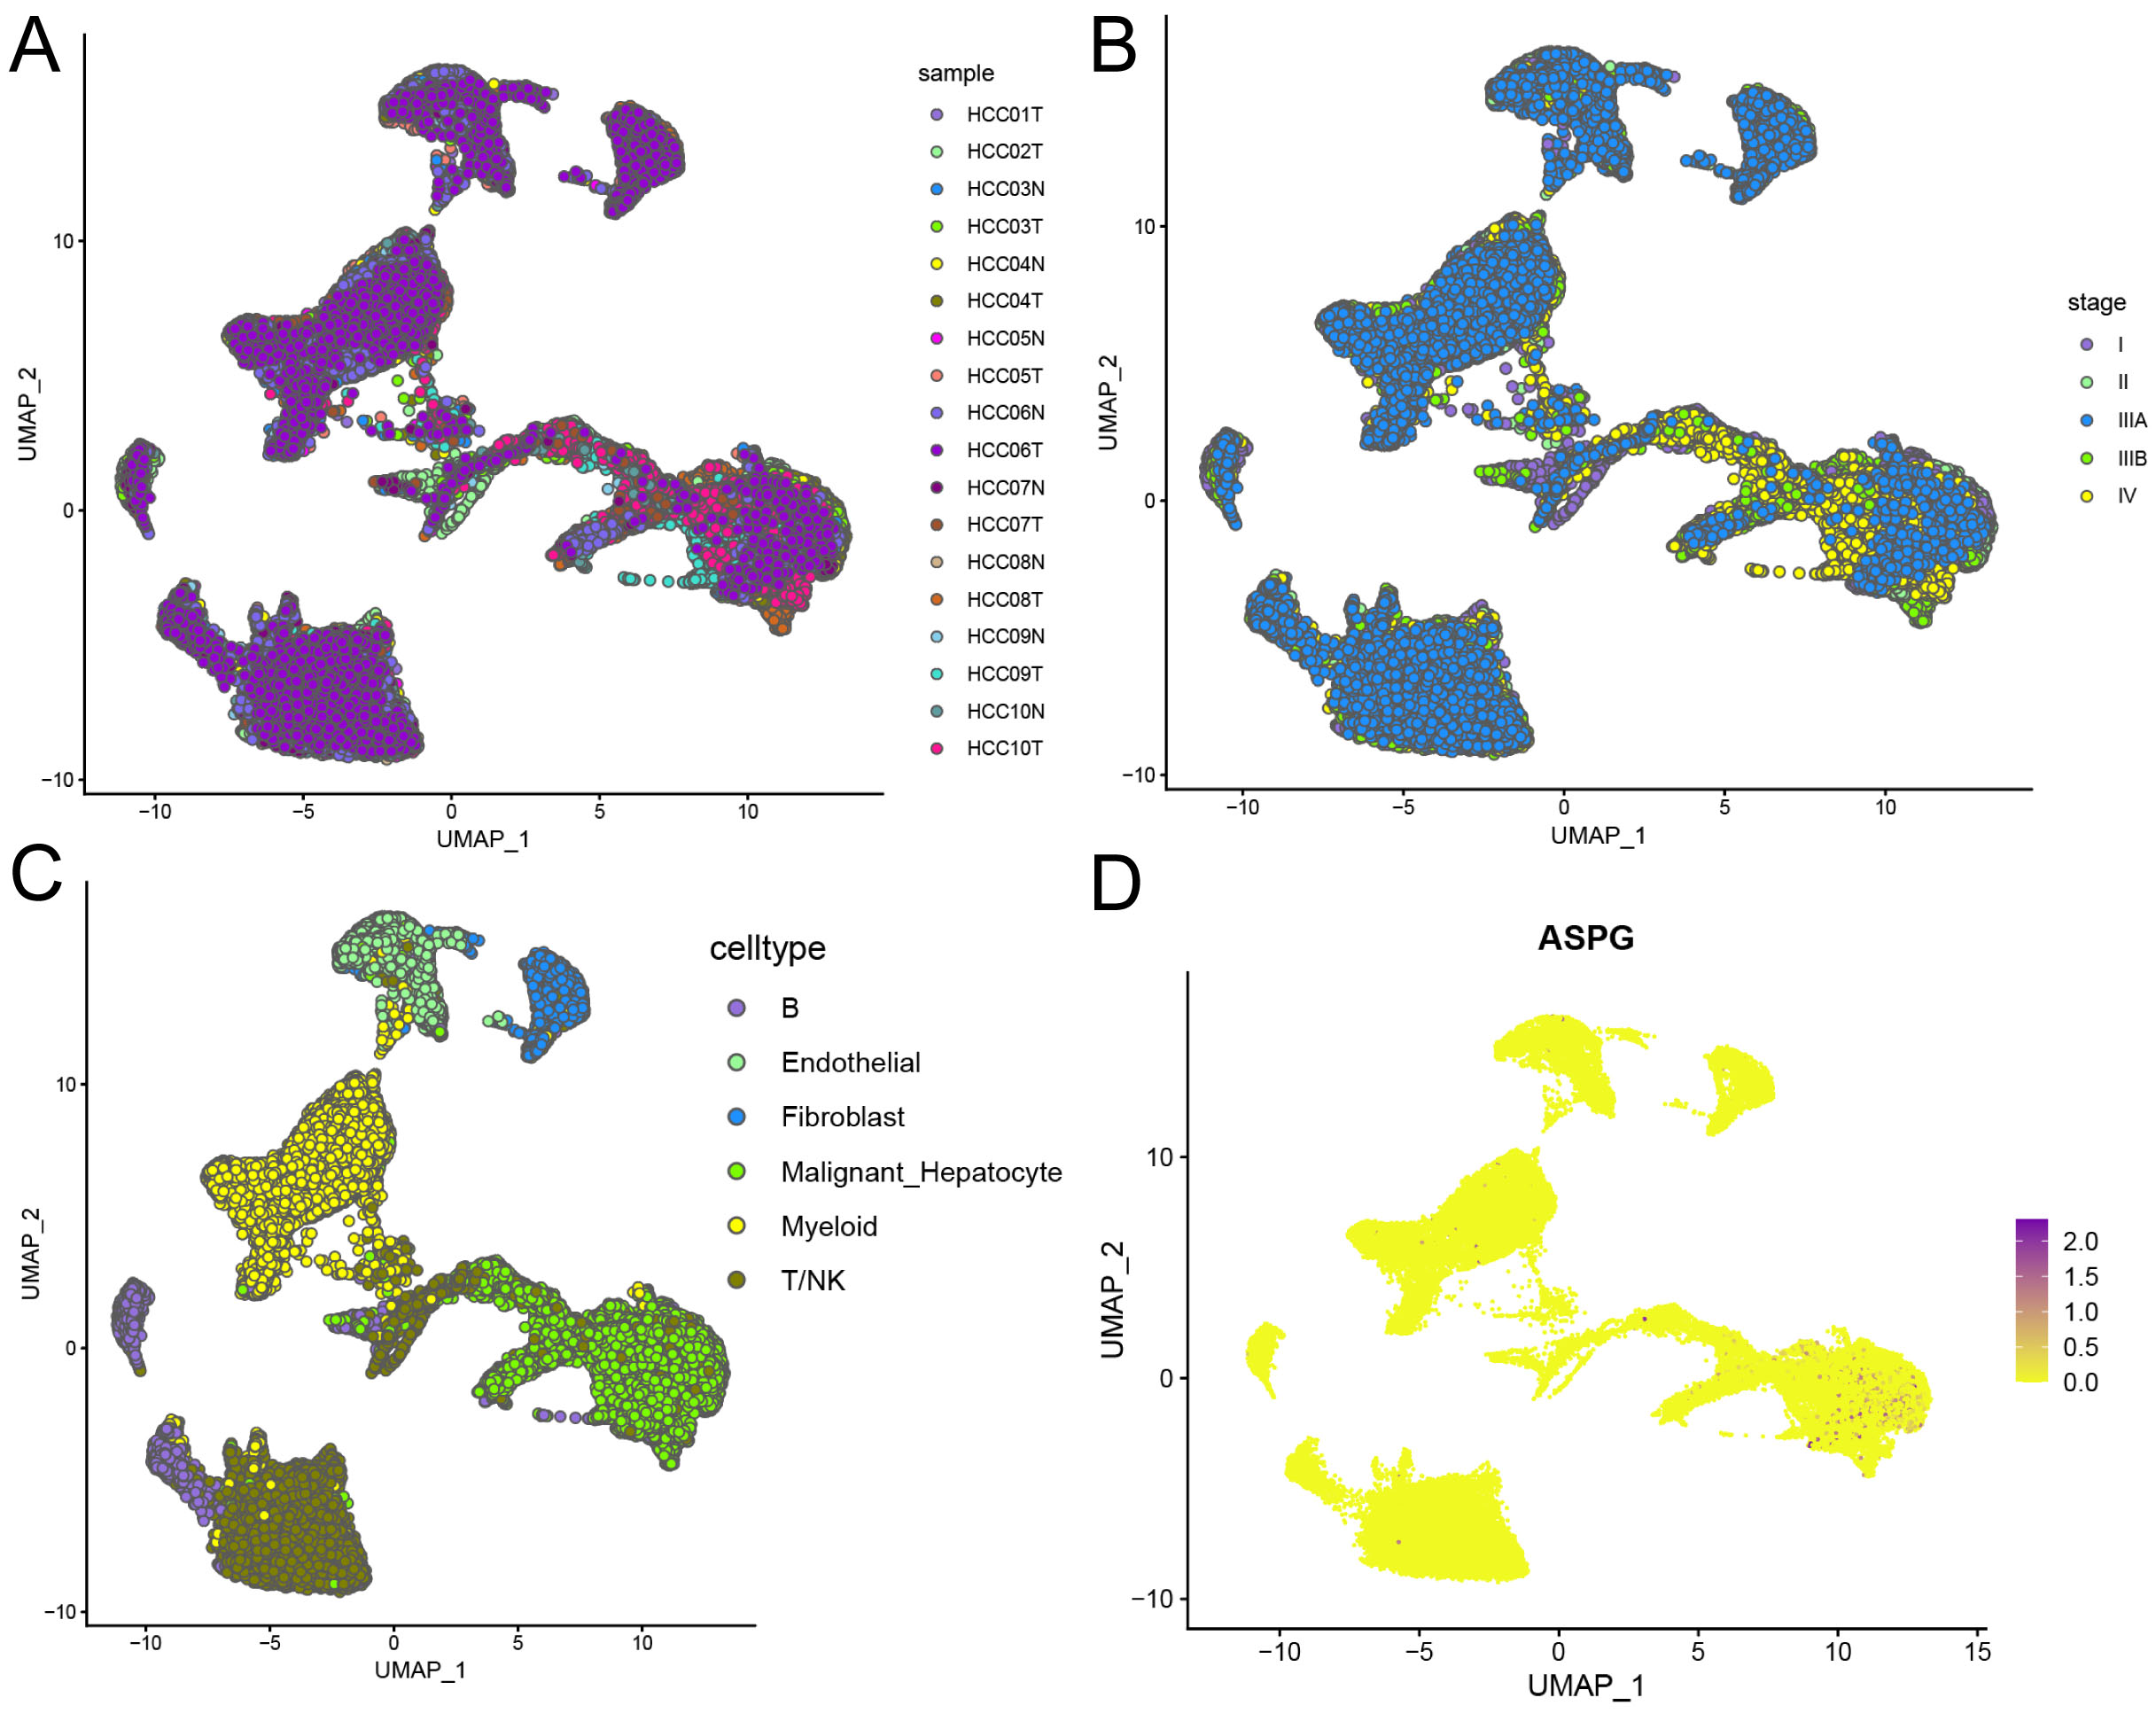 Fig. 3.
Distribution of ASPG expression at the scRNA-seq level. (A) Clustering of HCC and non-HCC samples. (B) Distribution of samples across different clinical stages. (C) Distribution of annotated cell types. (D) Expression distribution of ASPG.
Further exploration of the HCC expression characteristics using ST data revealed that ASPG was significantly downregulated in both the leading edge and primary tumor regions compared with adjacent tissues (Fig. 4A–C).
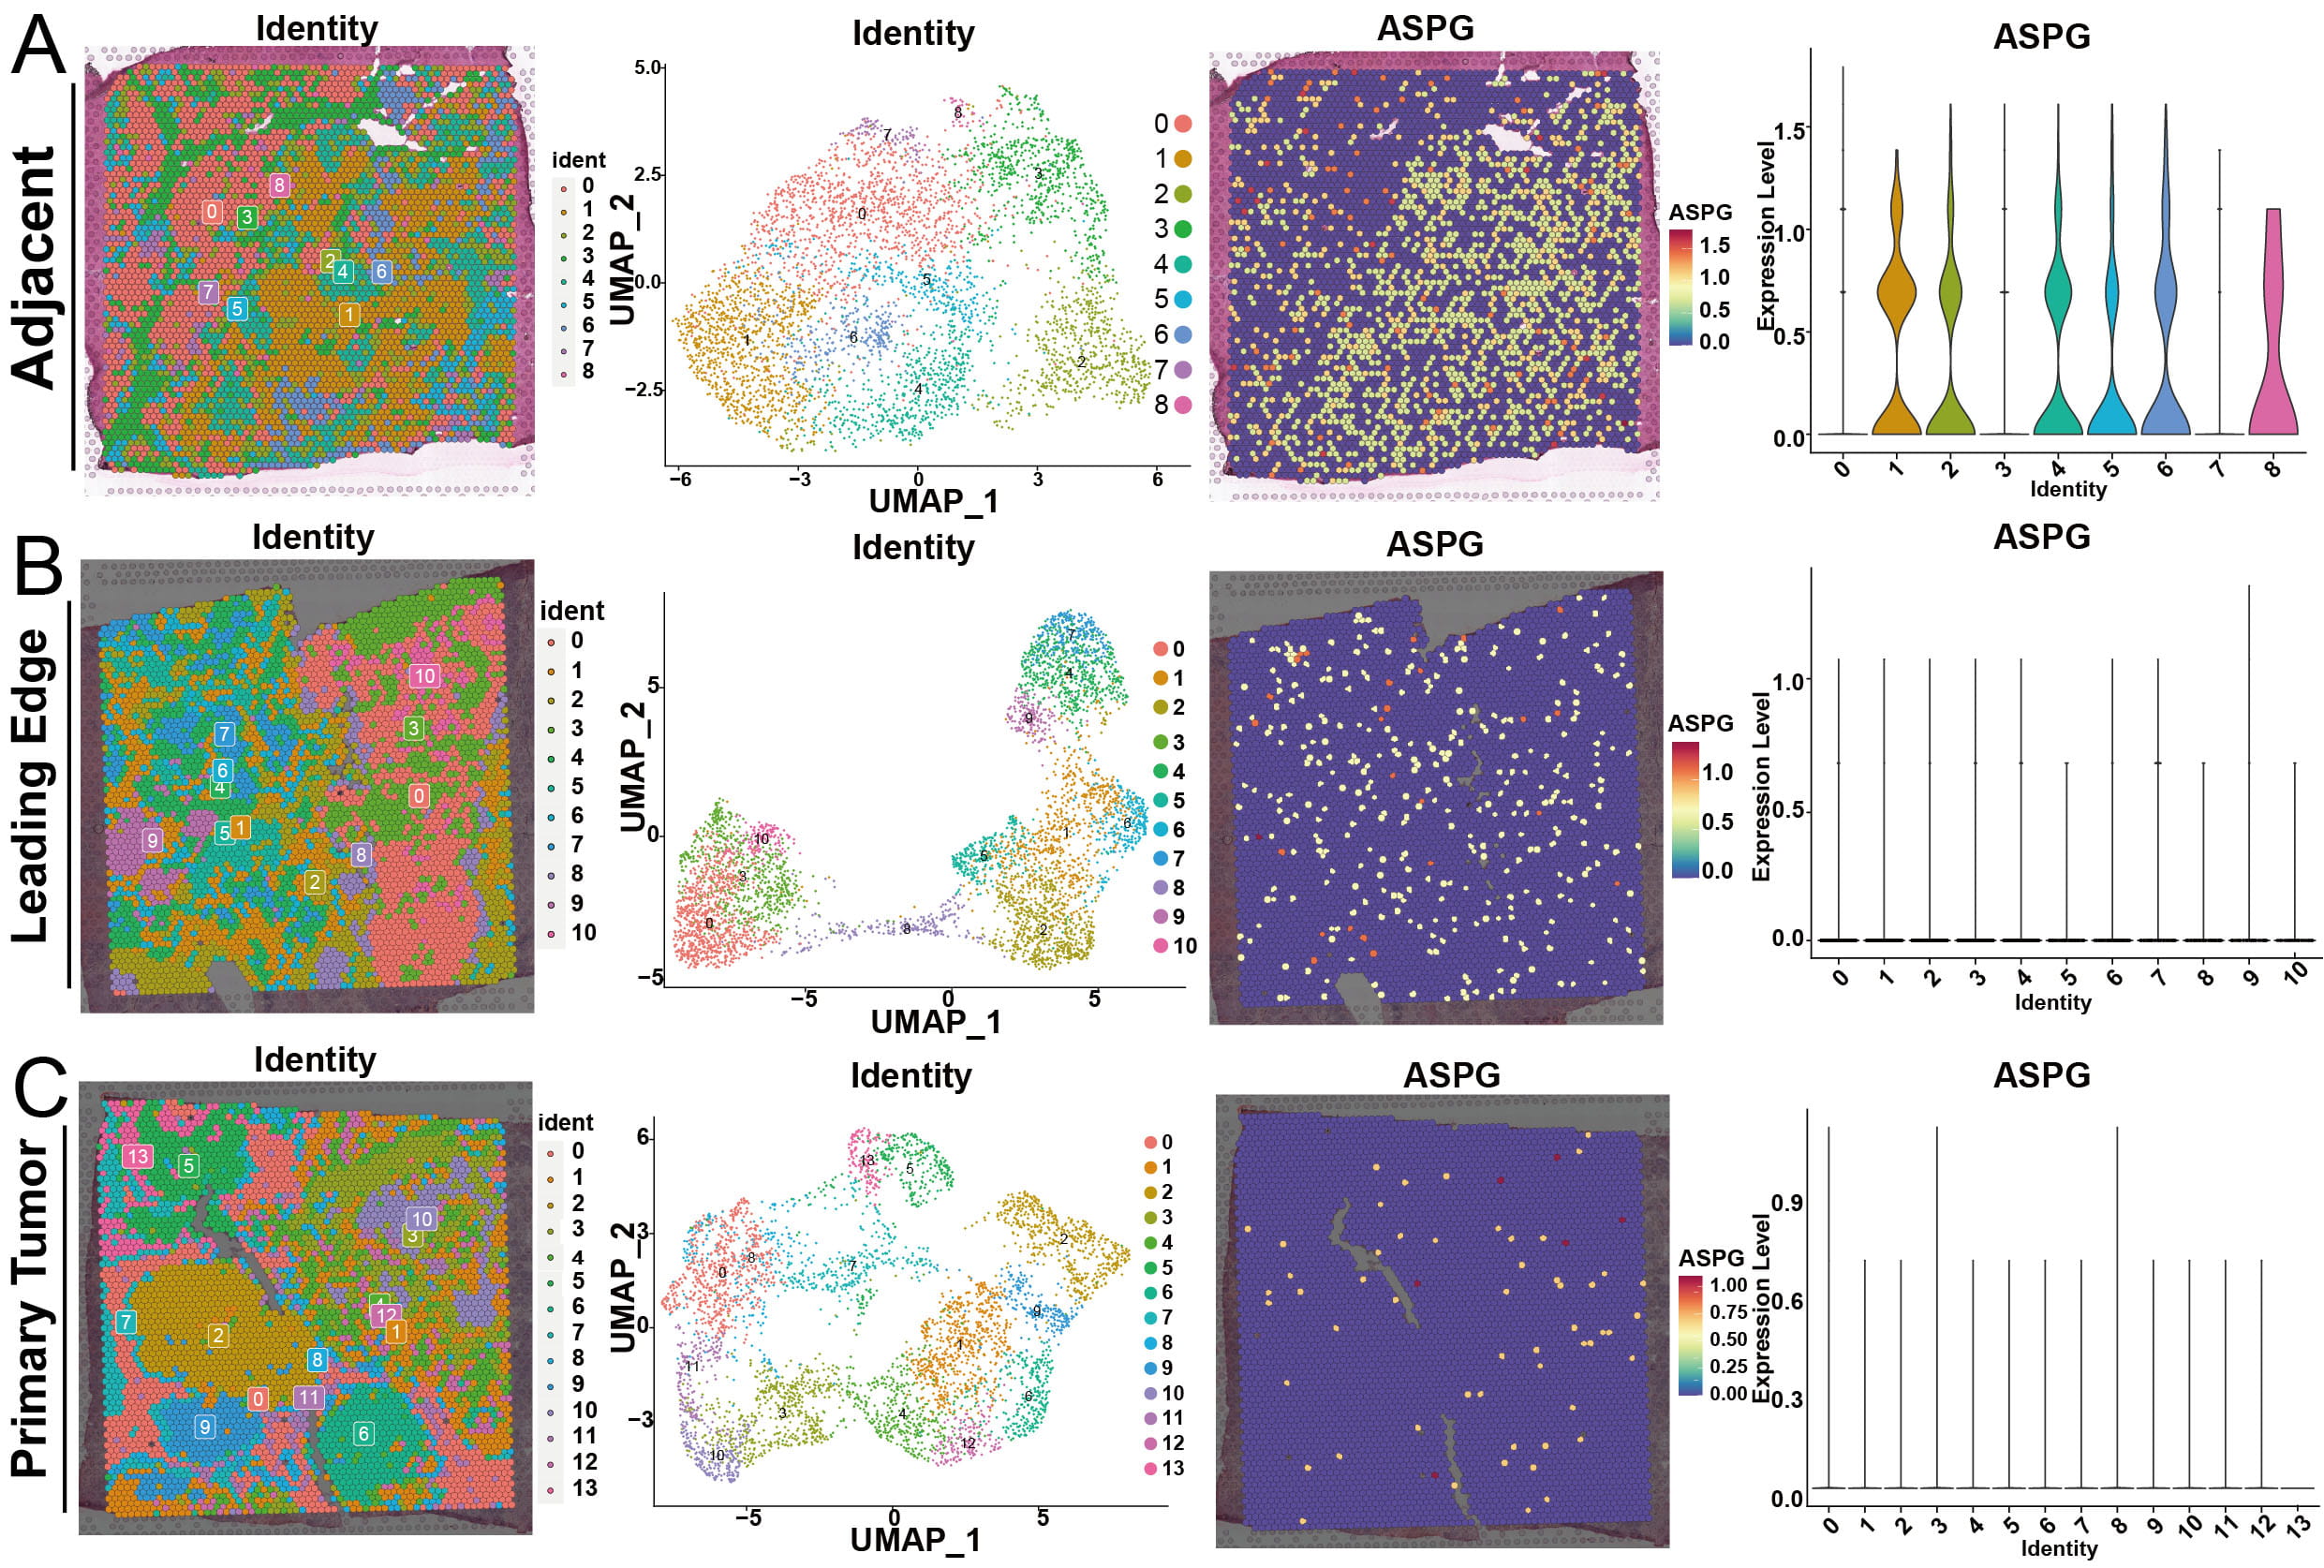 Fig. 4.
Expression distribution of ASPG in ST samples (HCC-2 patient ST data). (A) ASPG expression distribution in Adjacent ST samples. (B) ASPG expression distribution in Leading Edge ST samples. (C) ASPG expression distribution in Primary Tumor ST samples.
IHC staining and scoring analysis of ASPG was performed on 301 HCC tissues and
the corresponding adjacent non-HCC tissues. The staining in HCC was significantly
lighter than that observed in non-HCC tissues, suggesting a lower expression
level. The expression of ASPG in non-HCC and HCC tissues showed strong
discriminatory power between the two tissue types (p
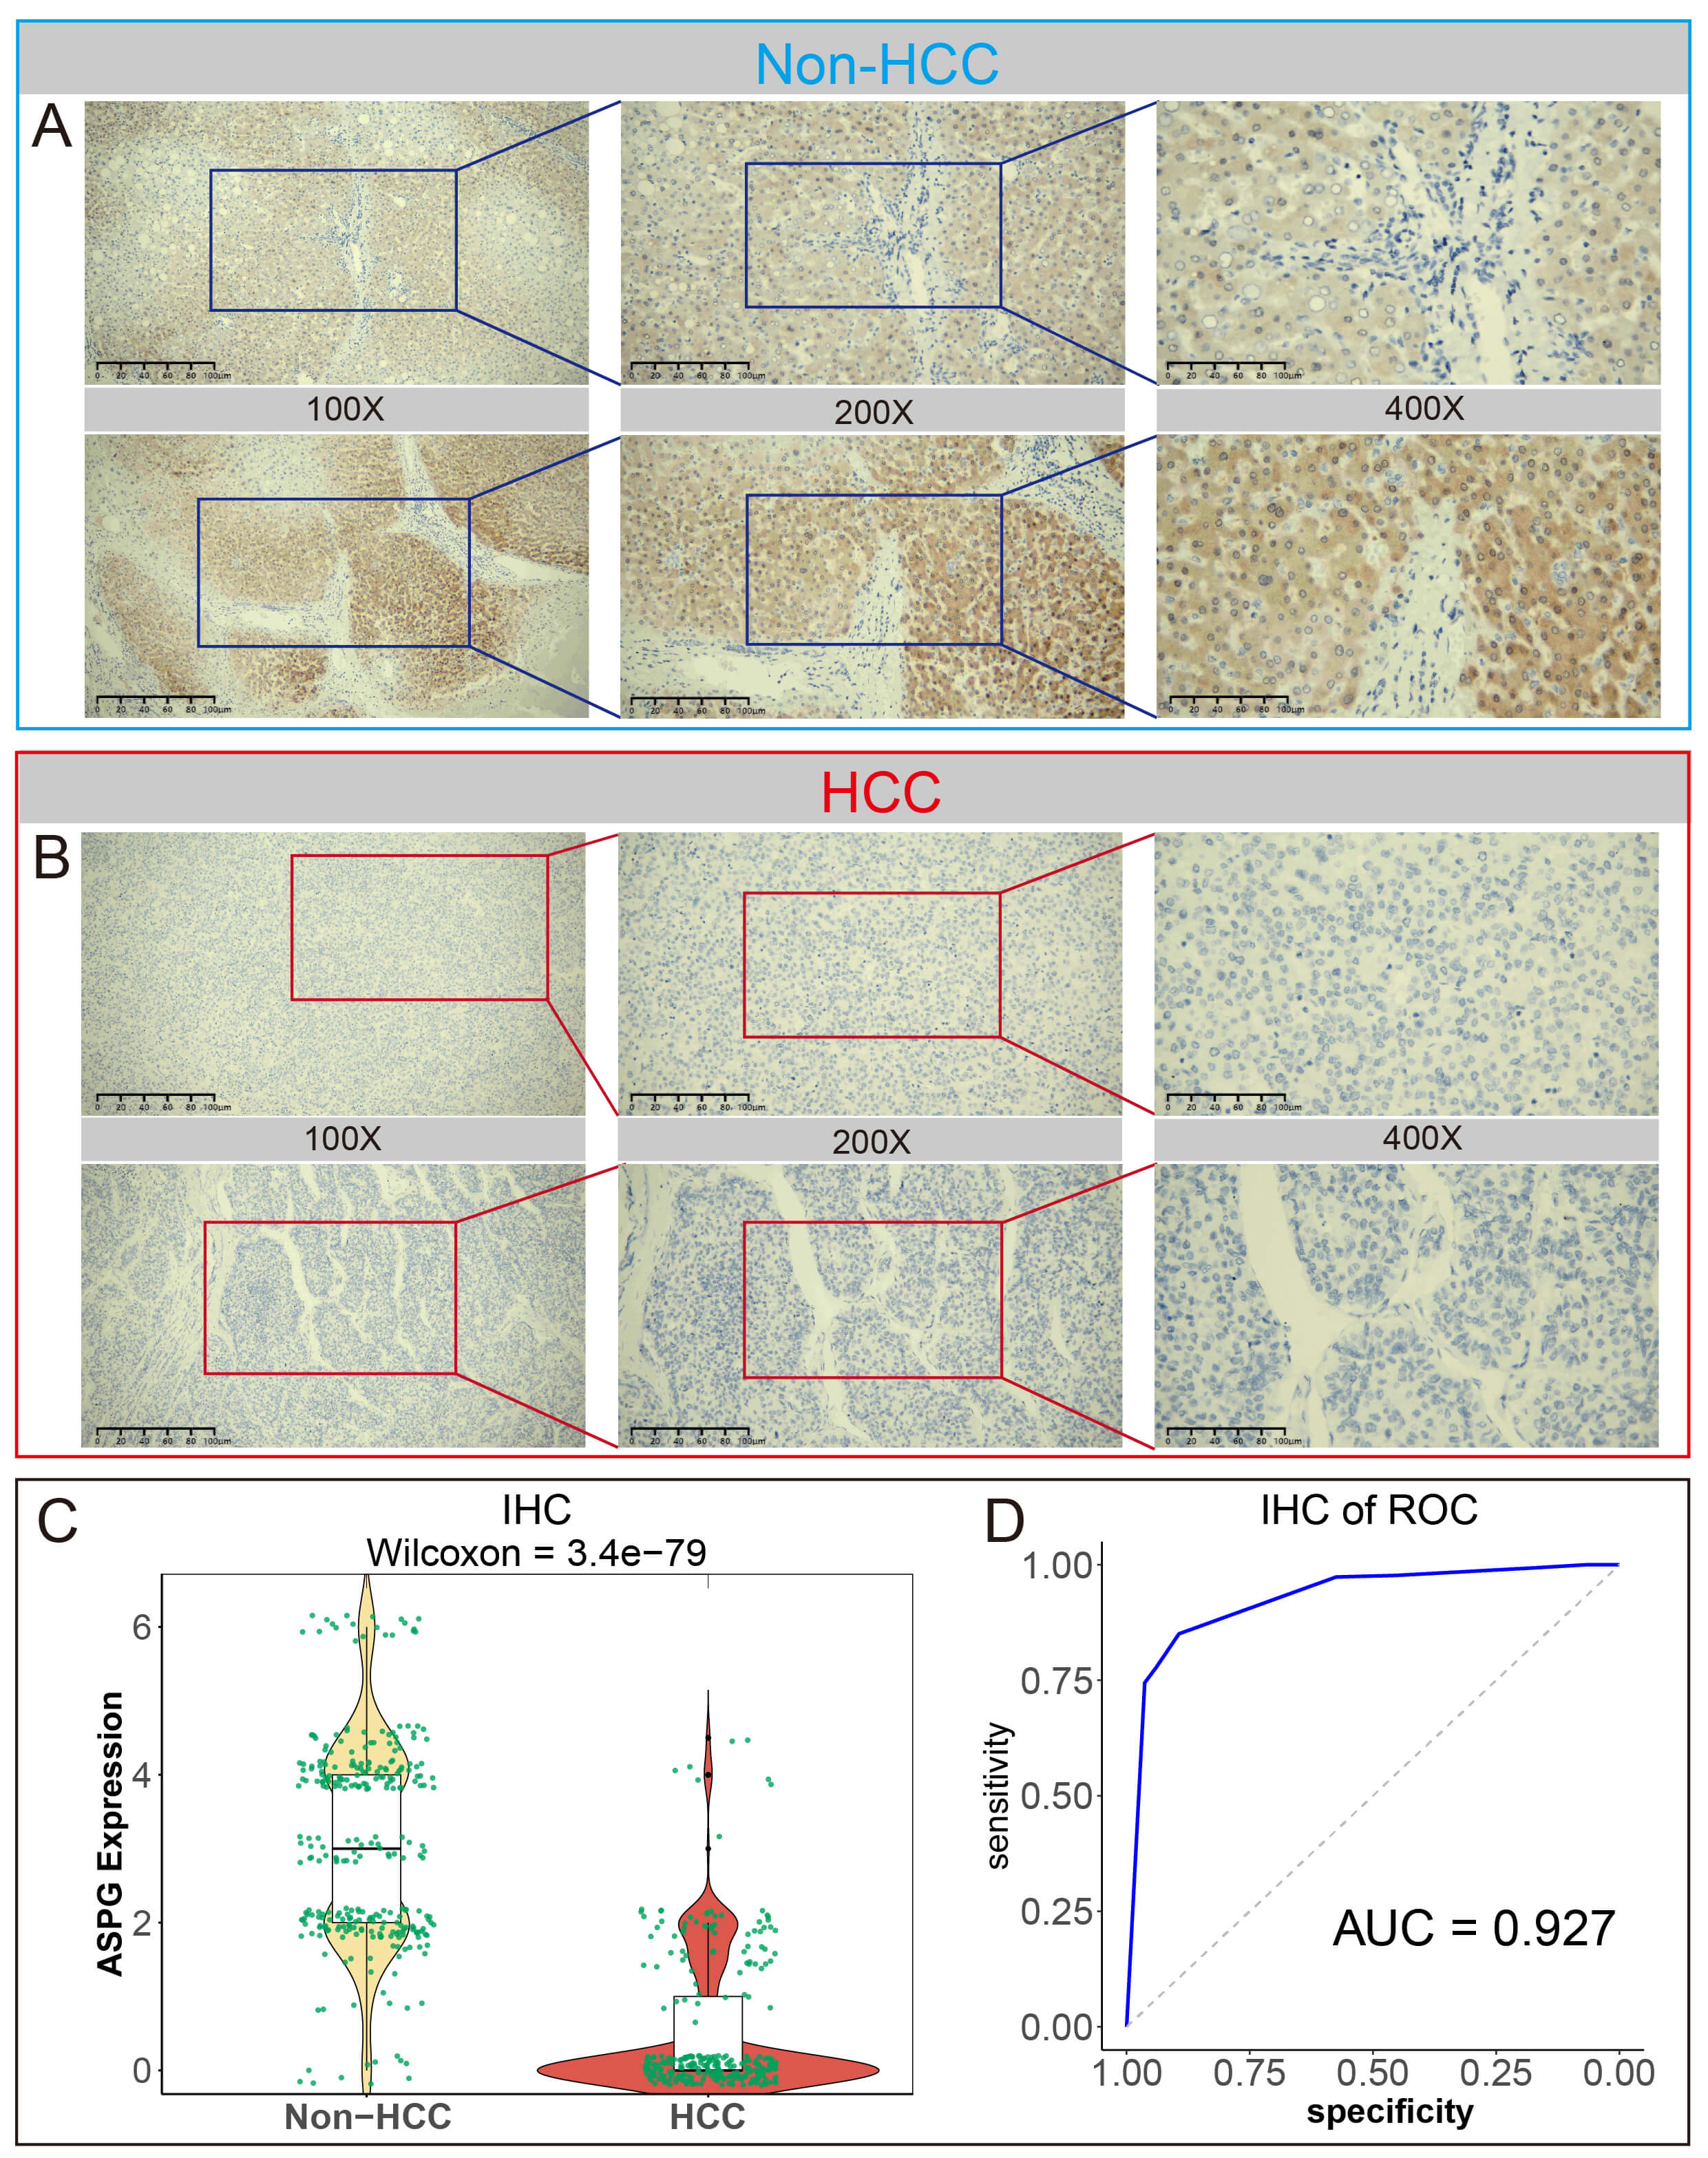 Fig. 5.
IHC scoring analysis of ASPG protein expression. (A) IHC observation of ASPG expression in Non-HCC tissues (scale bar = 50 µm, 100 µm, 200 µm). (B) IHC observation of ASPG expression in HCC tissues (scale bar = 50 µm, 100 µm, 200 µm). (C) ASPG protein expression scoring in Non-HCC vs. HCC tissues by Wilcoxon test. (D) ROC analysis of ASPG protein expression scoring in Non-HCC vs. HCC tissues.
The expression of ASPG was evaluated in 8 different HCC cell lines, with the
highest expression found in the Huh1 cell line (Supplementary Fig. 4A).
Analysis of CRISPR knockout data from 21 HCC cell lines showed that ASPG knockout
enhanced cell growth and proliferation in 17 of the cell lines (Chronos Score
This study employed GSEA enrichment analysis, GeneMANIA network analysis, along with GO and KEGG pathway analyses to investigate the regulatory pathways associated with low ASPG expression. Key pathways identified by GSEA include Glycine, Serine, and Threonine Metabolism, Alanine, Aspartate, and Glutamate Metabolism, and Biosynthesis of Amino Acids (Fig. 6A). GeneMANIA analysis suggested that functionally associated genes were primarily concentrated in biological processes such as nicotinamide nucleotide metabolic process, NAD biosynthetic process, and pyridine nucleotide metabolic process (Fig. 6B).
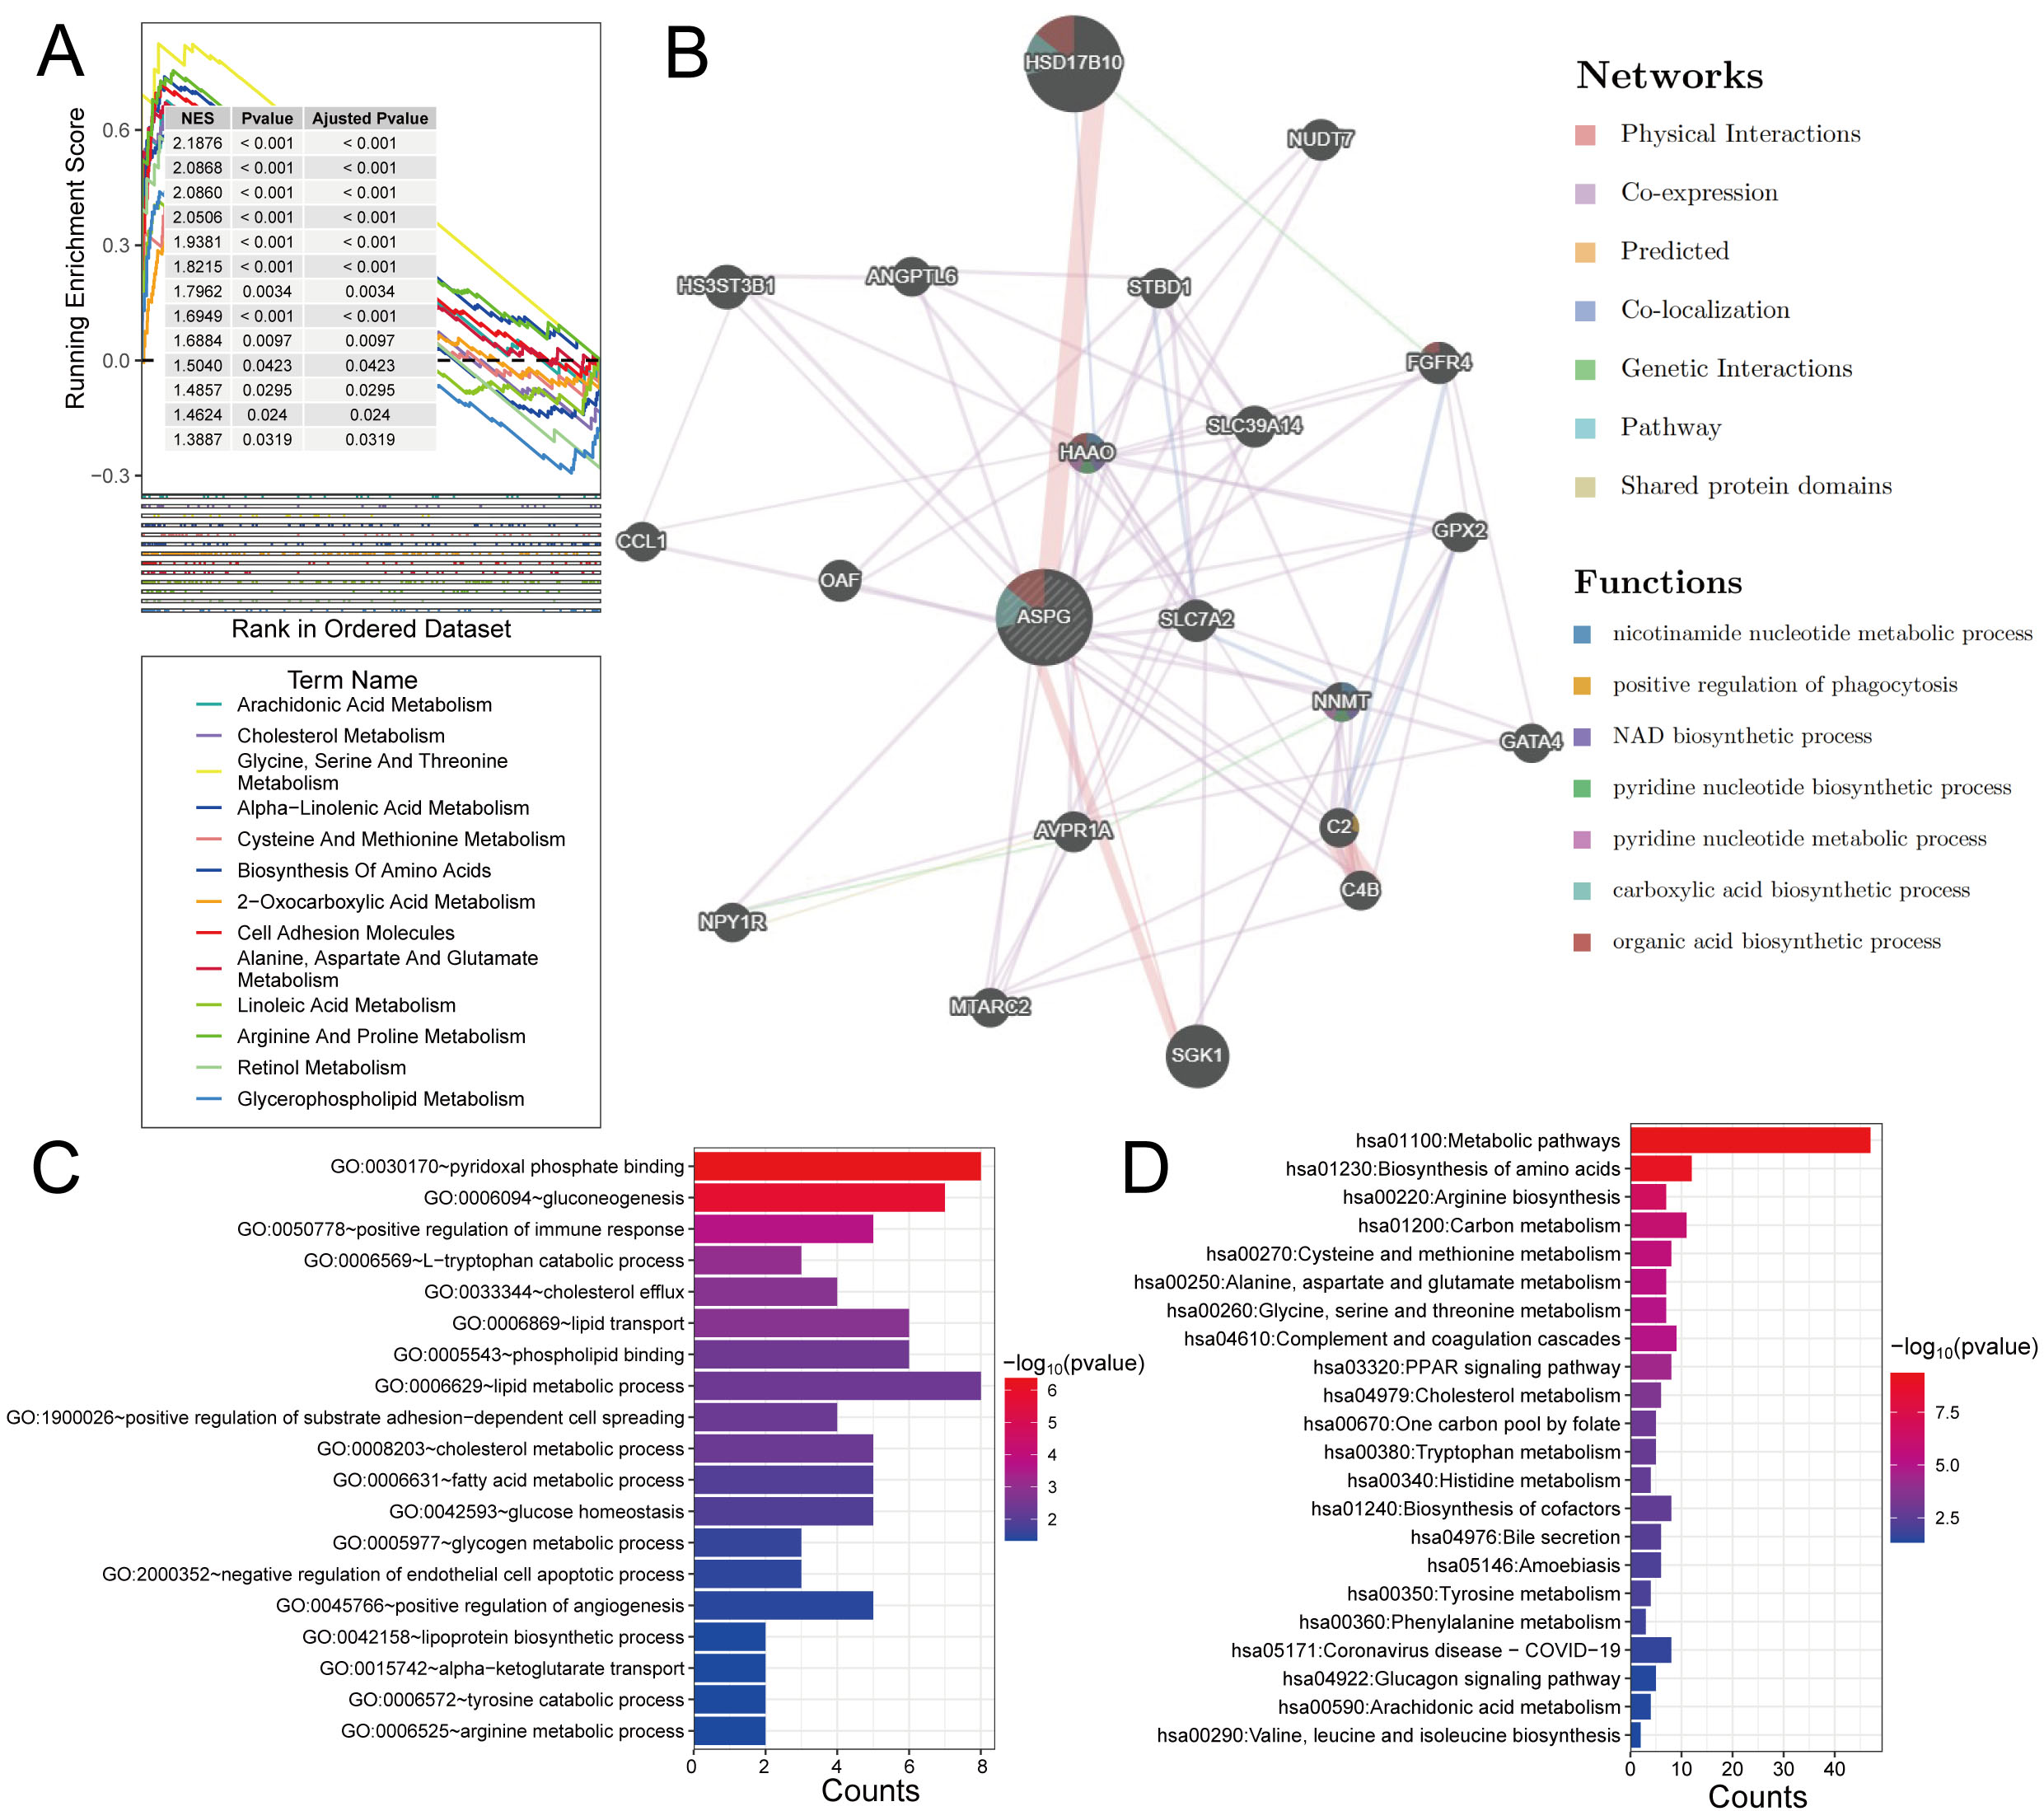 Fig. 6.
Potential regulatory mechanisms of ASPG in HCC. (A) GSEA. (B) GeneMANIA analysis results. (C) GO enrichment. (D) KEGG pathway analysis.
GO enrichment analysis showed significant associations with pyridoxal phosphate binding, gluconeogenesis, and lipid metabolic process (Fig. 6C). Furthermore, KEGG pathway analysis indicated that ASPG regulated several core metabolic hubs, including Metabolic Pathways, Biosynthesis of Amino Acids, Carbon Metabolism, and Arginine Biosynthesis (Fig. 6D).
Therefore, aberrant ASPG expression primarily regulates core pathways of metabolic reprogramming, including gluconeogenesis, amino acid metabolism, lipid metabolism, and carbon metabolism.
With regard to the specific regulatory role of ASPG in malignant hepatocytes, GO analysis revealed that the process of gluconeogenesis remained significantly enriched in these cells. This was accompanied by the regulation of energy metabolism-related processes, such as long-chain fatty acid metabolic process, aerobic respiration, and 2-oxoglutarate metabolic process (Supplementary Fig. 5A). KEGG pathway analysis further identified that ASPG regulated metabolic pathways, biosynthesis of amino acids, cholesterol metabolism, and one-carbon pool by folate, among others (Supplementary Fig. 5B).
Secondary clustering of the malignant hepatocytes resulted in 33 clusters. Based on the quantitative evaluation of ASPG expression levels, clusters with significantly high ASPG expression (clusters 8, 21, and 27) were classified as ASPG-high, while the remaining clusters were designated as ASPG-low (Fig. 7A). Analysis of cell–cell communication revealed that, in terms of the number of interactions, ASPG-Low cells (as ligand-sending cells) exhibited a greater number of interactions with myeloid cells. In contrast, the interaction strength was stronger when ASPG-High cells (rather than ASPG-Low cells) acted as ligand senders to myeloid cells (Fig. 7B). Analysis of ligand–receptor interactions further revealed the MIF–(CD74+CXCR4) and MIF–(CD74+CD44) pathways exhibited significantly stronger interaction signals compared with other signaling pathways, with ASPG-low acting predominantly as the ligand (Fig. 8A). Comprehensive analysis of total signal input and output confirmed the pronounced activity of ASPG-low in the MIF signaling pathway (Fig. 8B). Expression levels of the MIF gene were significantly higher in the ASPG-low group (Fig. 7C,D).
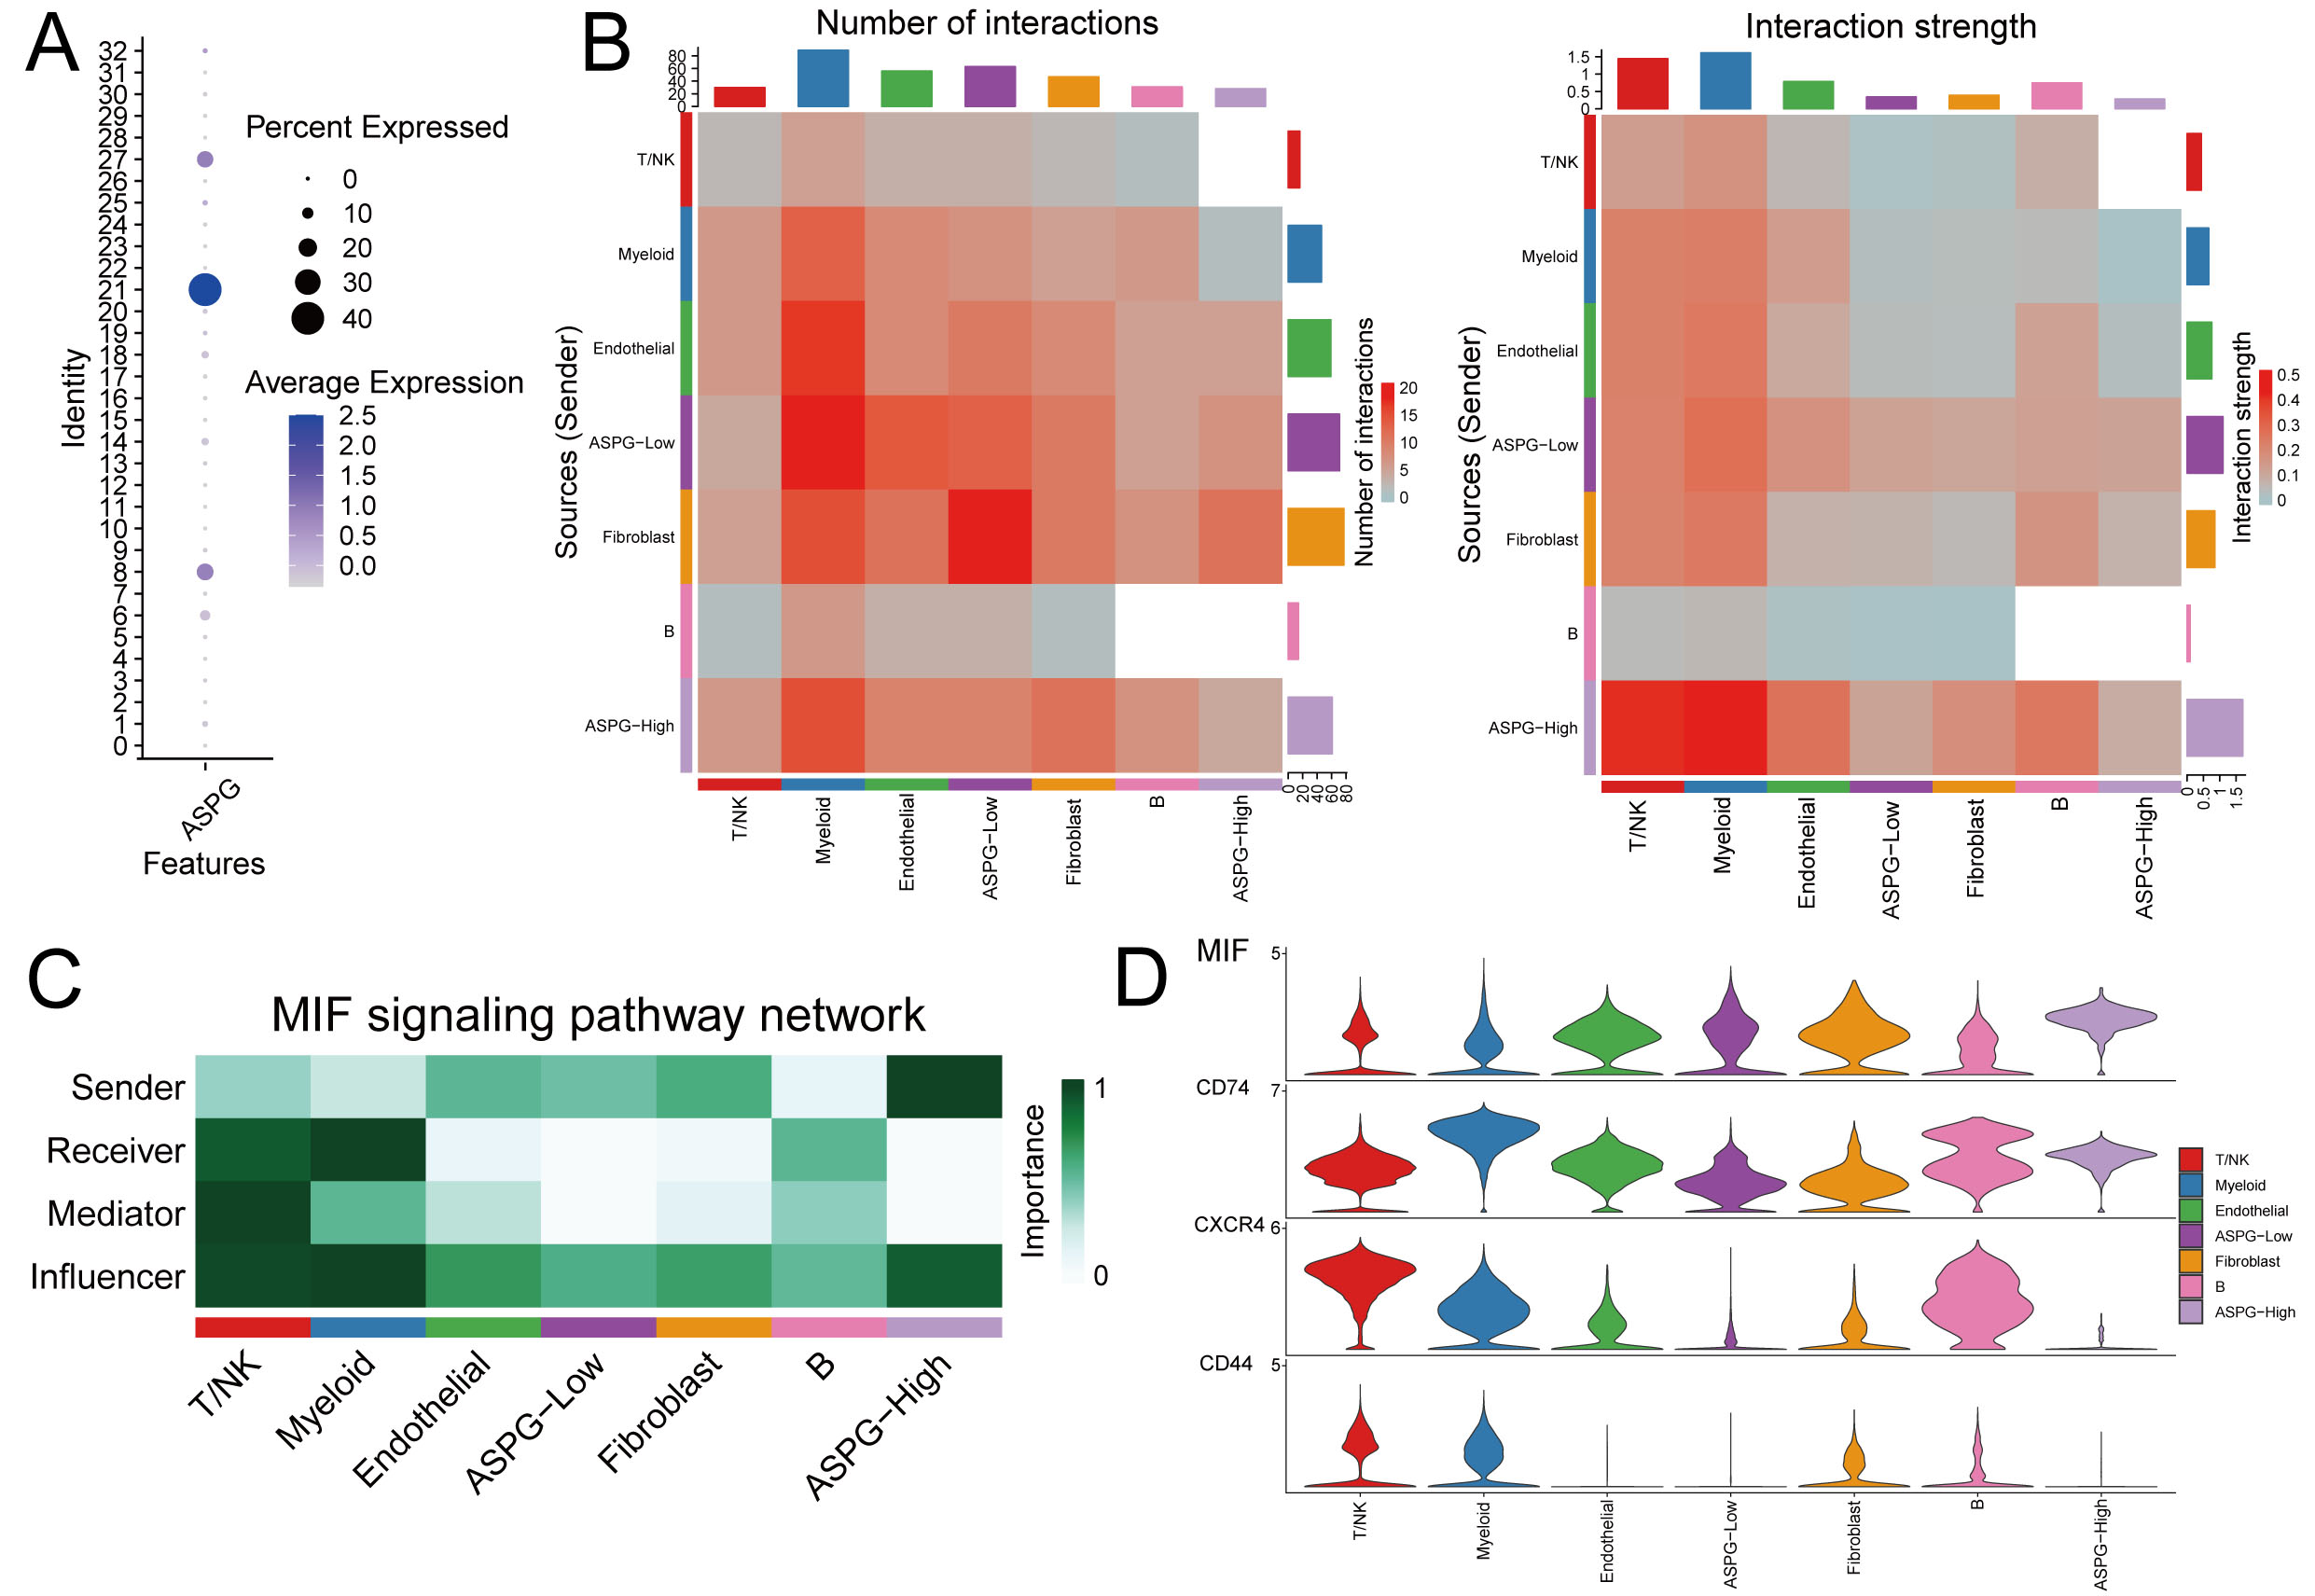 Fig. 7.
Interactions between ASPG-Low and various cell types. (A) Secondary clustering of malignant hepatocytes. (B) Interaction quantity and intensity between different cell subgroups. (C) Role of cell subgroups in the MIF pathway. (D) Gene expression levels in the MIF pathway.
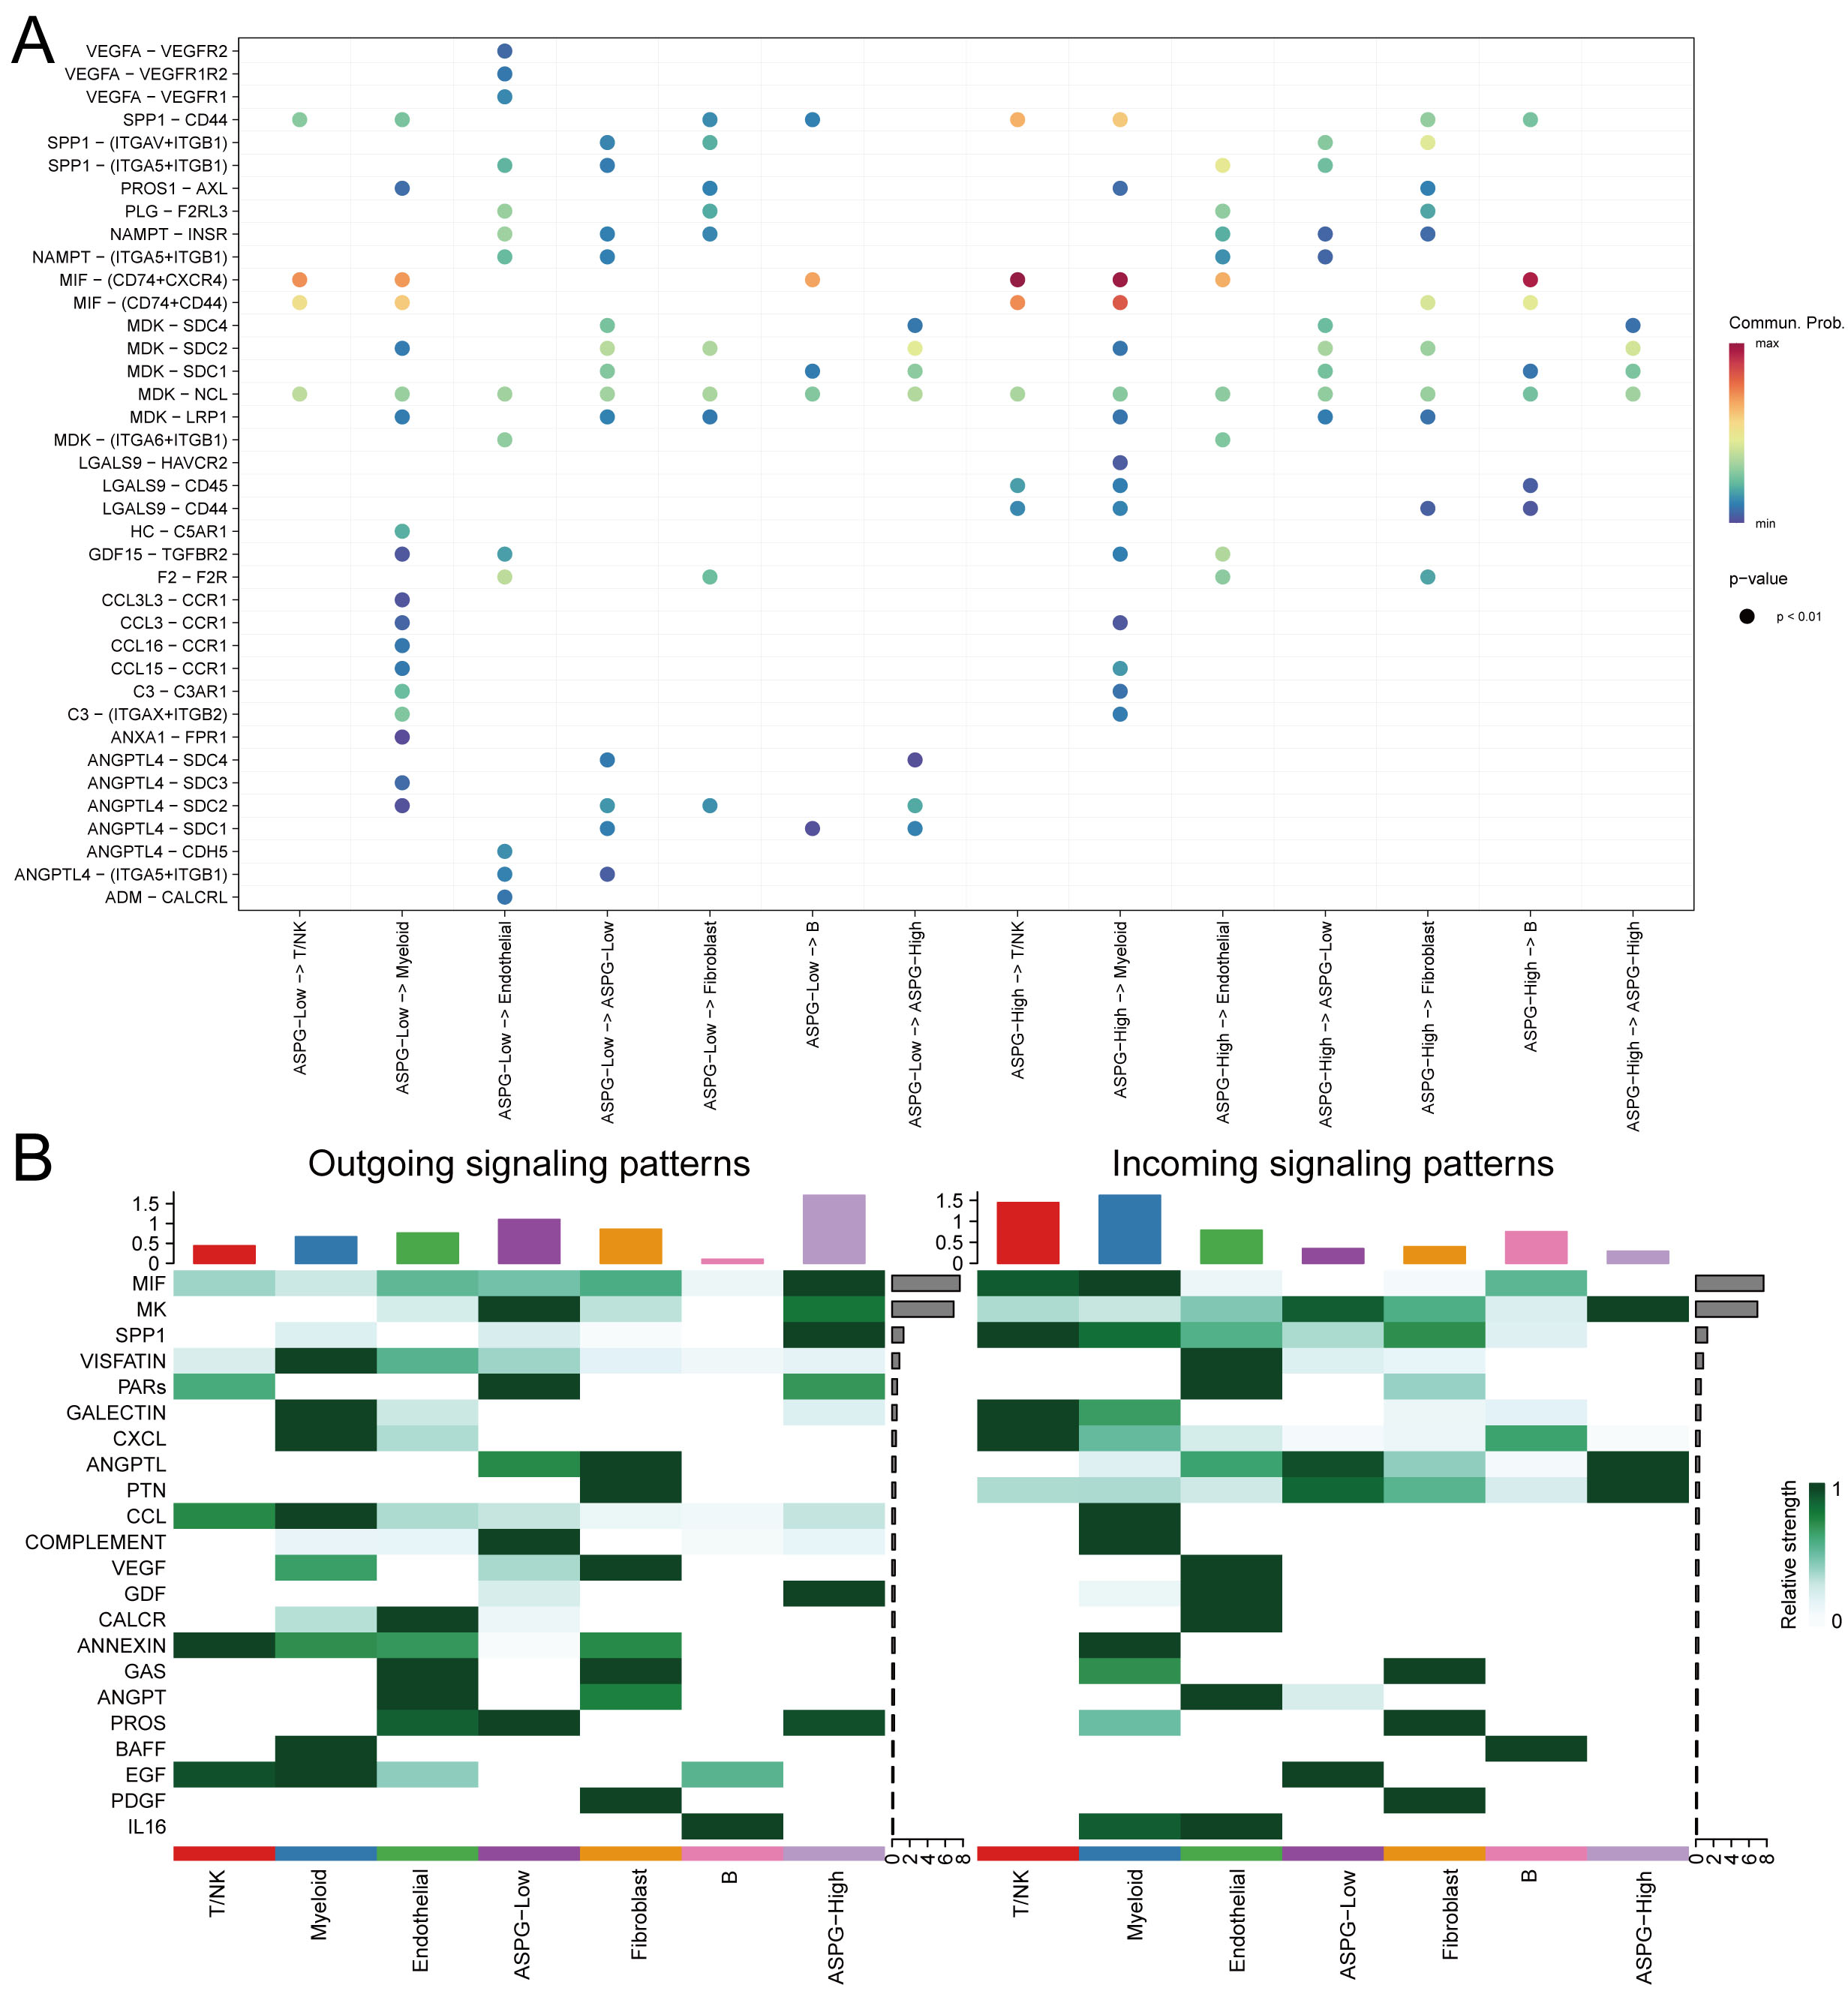 Fig. 8.
Interactions in cell communication in ASPG-Low. (A) The overall interaction network between ASPG-Low and ASPG-High. (B) The overall signal strength of inputs and outputs.
Metabolic scoring and flux analysis were performed on B cells, myeloid cells, T/NK cells, as well as on ASPG-high and ASPG-low populations, based on their interaction strengths with various cell types in the MIF pathway. Results from scMetabolism revealed that ASPG-low was significantly active in metabolic pathways, including Alanine, Aspartate, and Glutamate Metabolism, Arginine and Proline Metabolism, Pyruvate Metabolism, and the Citrate Cycle (TCA cycle) (Fig. 9A). Further analysis using scFEA suggested that ASPG-low may influence the conversion of metabolites such as Aspartate_Asparagine and Glutamate_2OG (Fig. 9B).
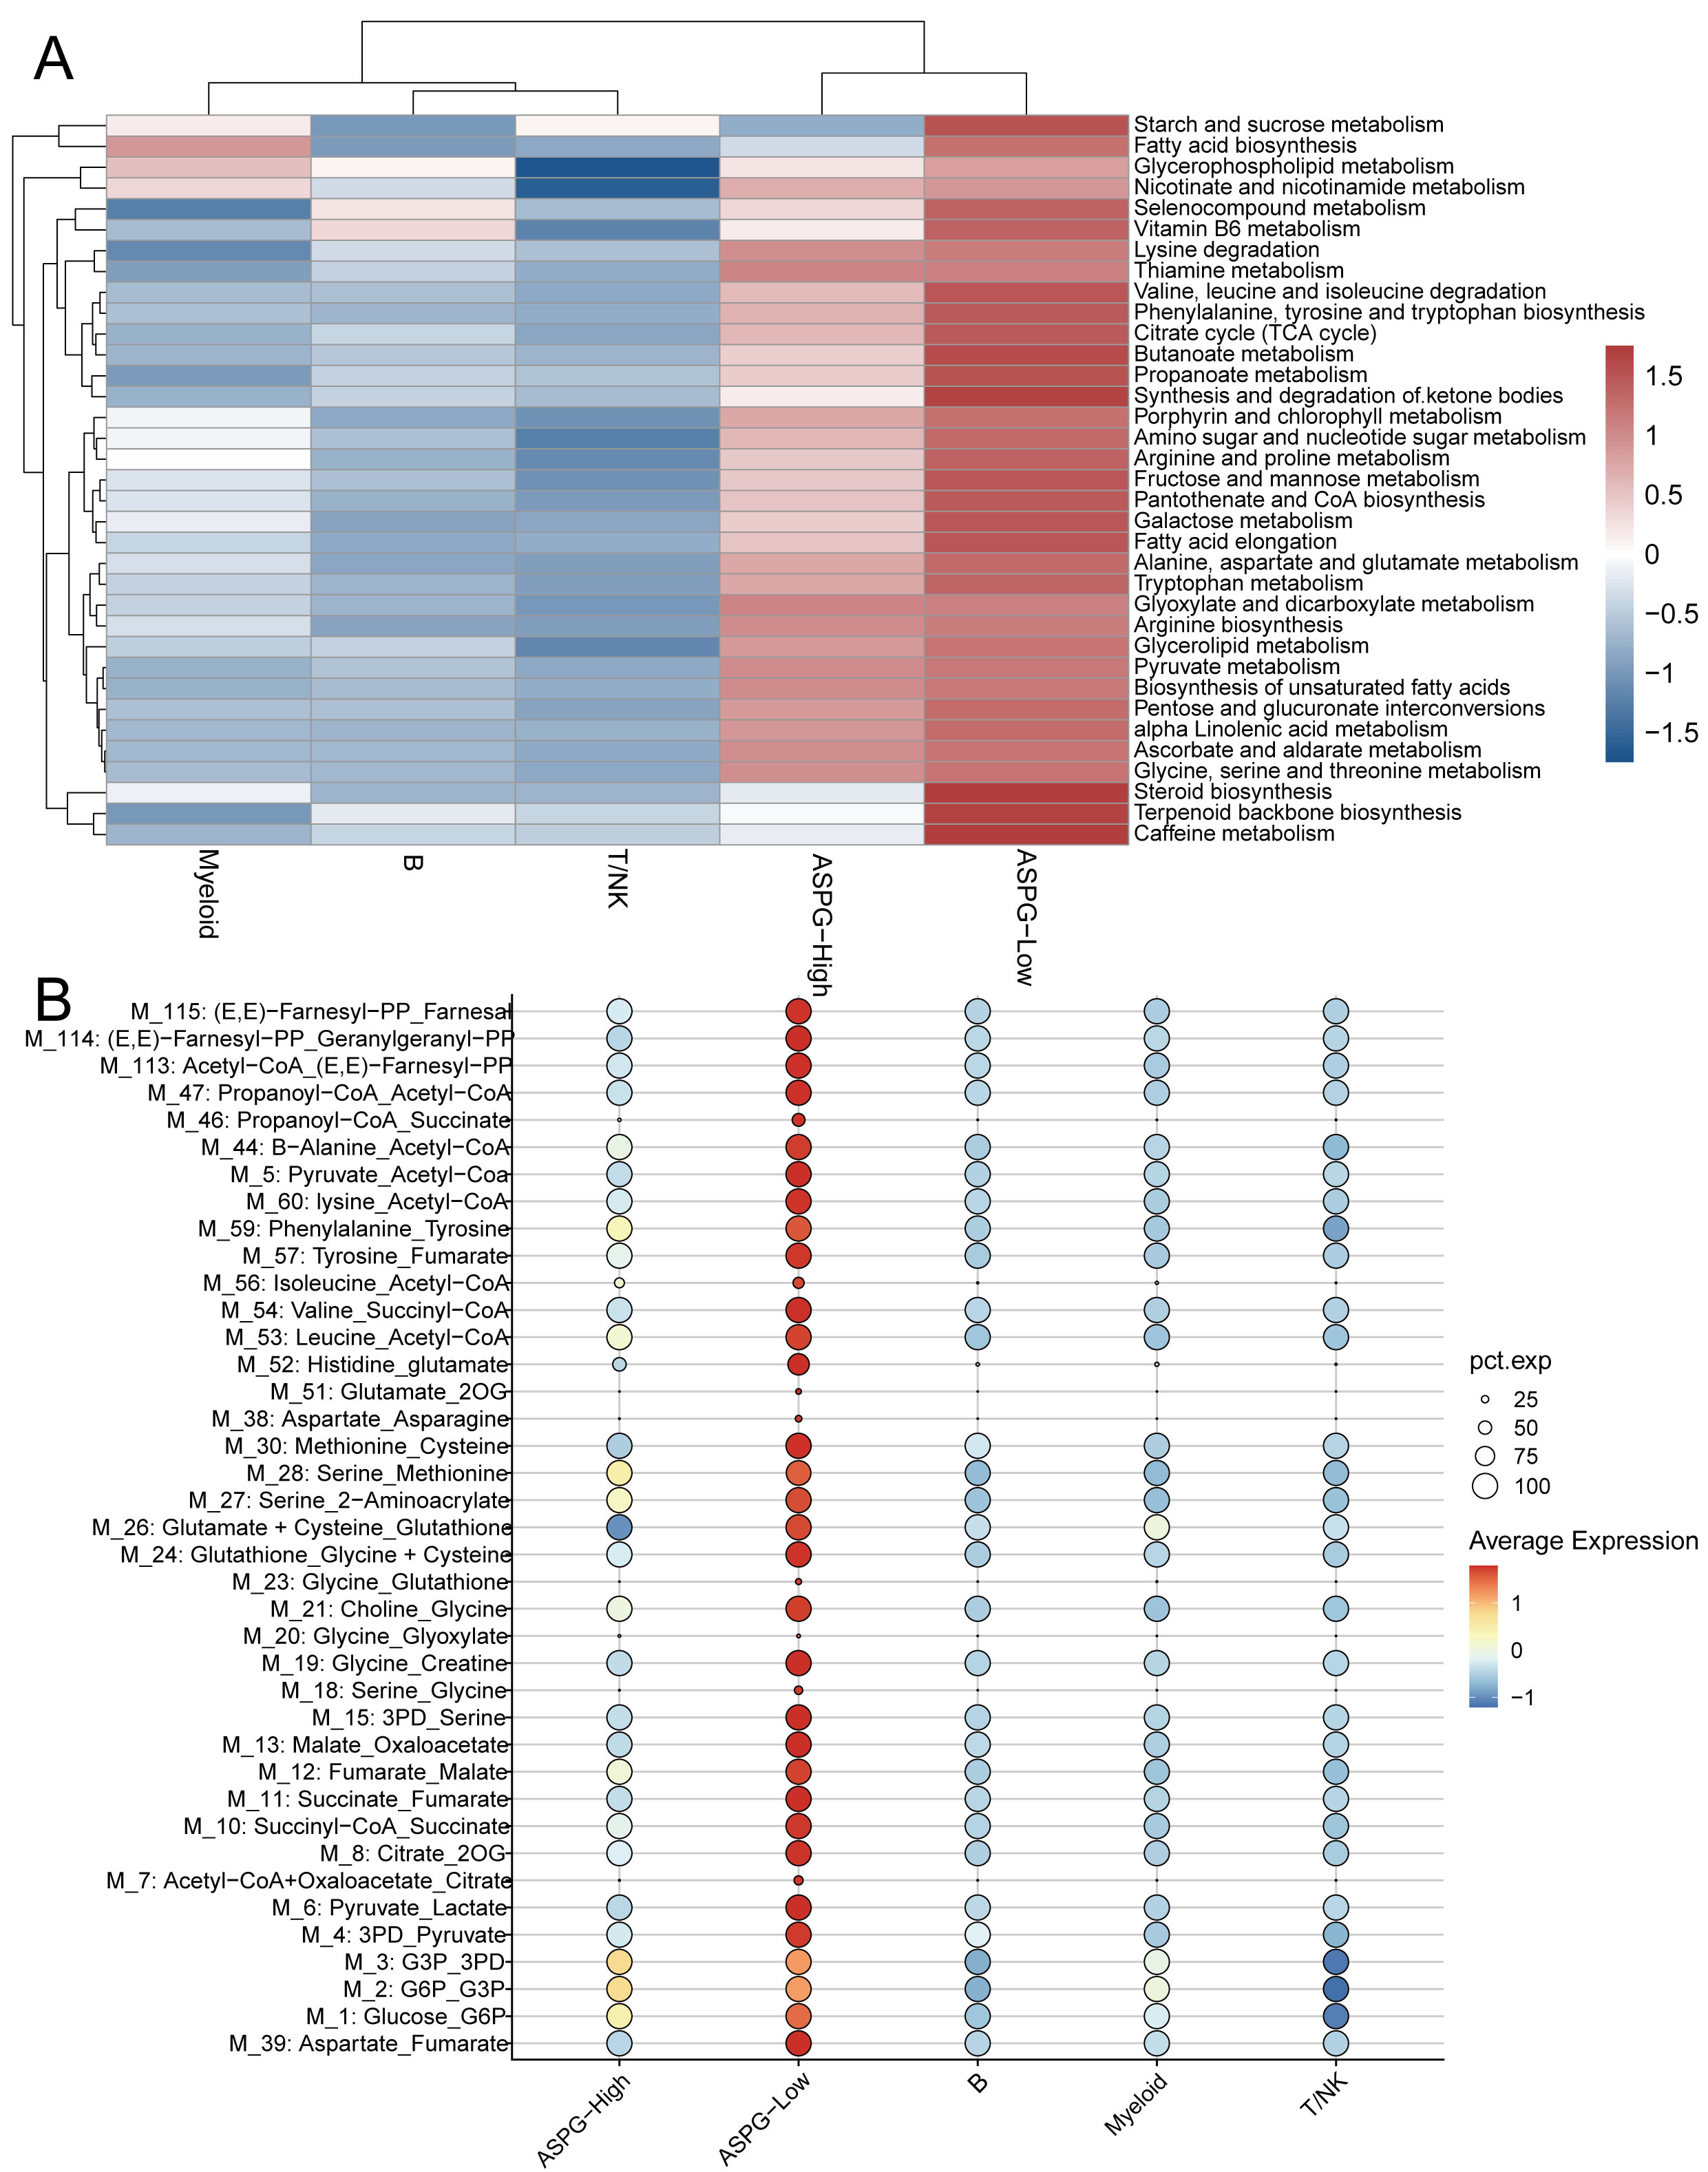 Fig. 9.
Metabolic pathway analysis of ASPG-Low. (A) Metabolic pathway scores of ASPG-Low from scMetabolism. (B) Scatter plot of metabolite conversions of ASPG-Low from scFEA.
According to drug sensitivity analysis, the IC50 values for cisplatin, erlotinib, gemcitabine, olaparib, oxaliplatin, sapitinib, and selumetinib were significantly lower in the ASPG-high expression group compared with the ASPG-low expression group. In contrast, the ASPG-low expression group showed lower IC50 values for lapatinib and paclitaxel (Fig. 10).
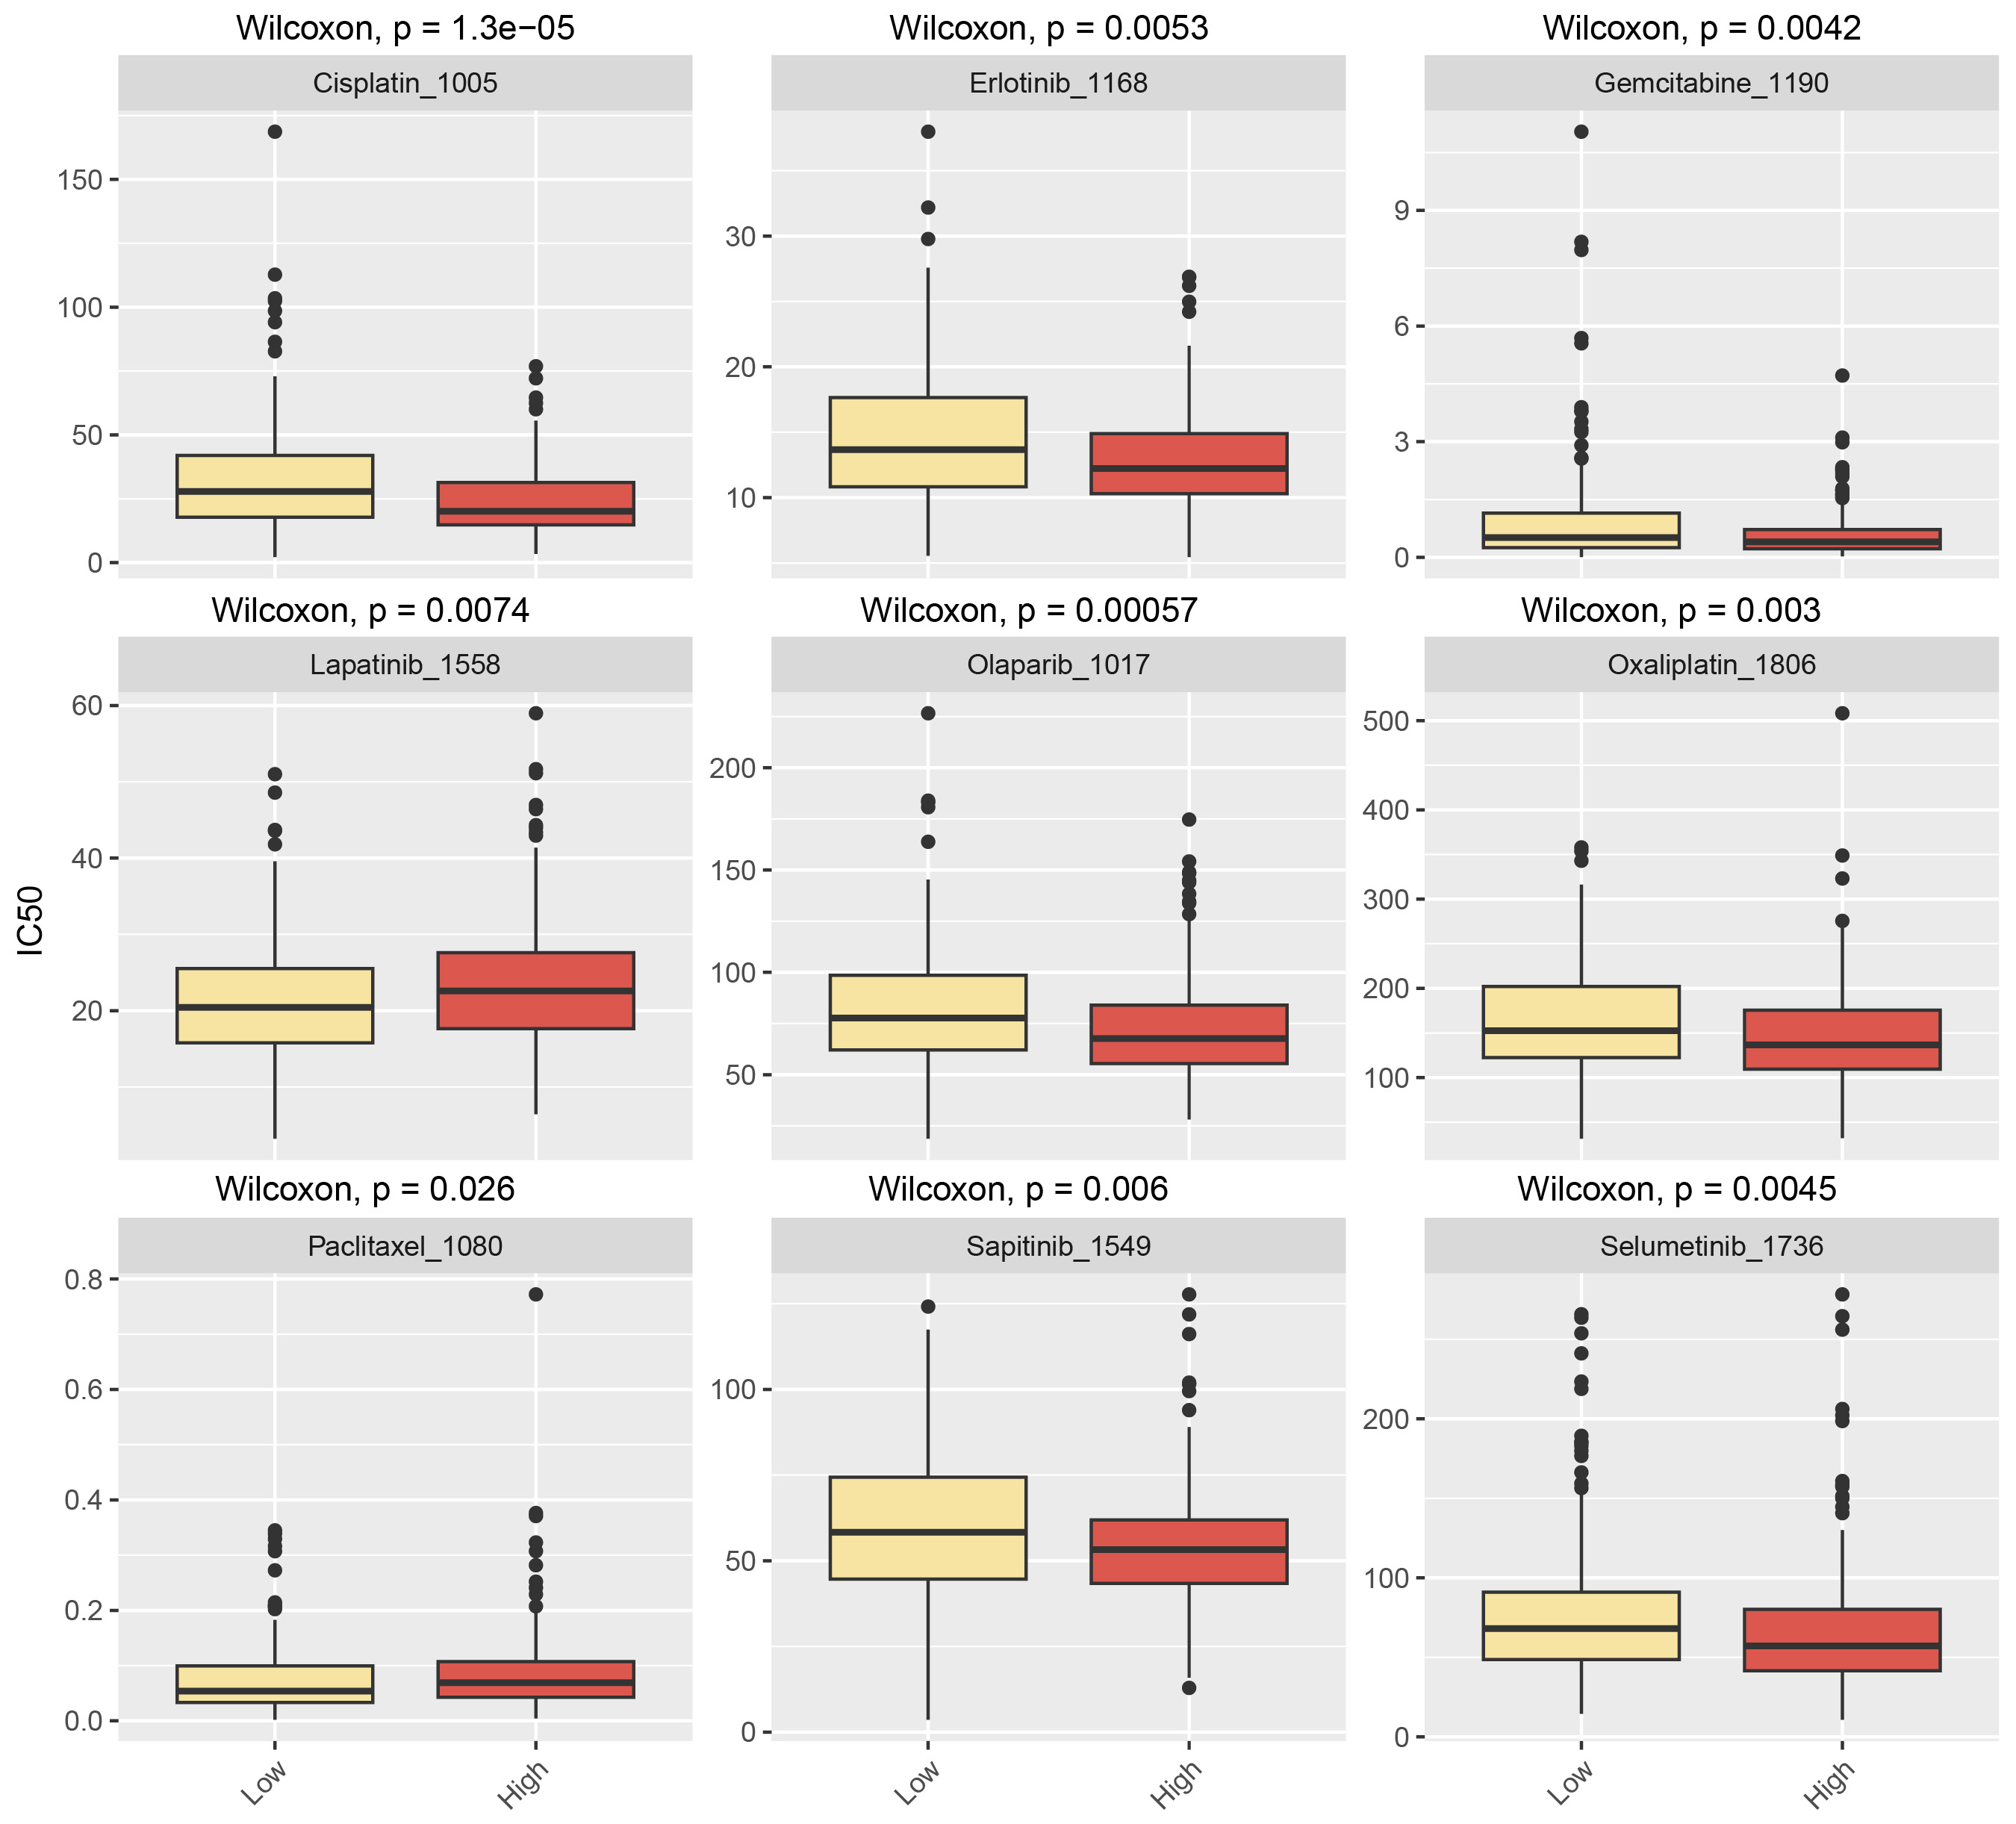 Fig. 10.
Drug sensitivity analysis of ASPG low expression.
HCC is one of the most aggressive cancer types [27], and its malignant progression is strongly dependent on metabolic reprogramming [28]. As a key gene involved in metabolic regulation, the specific role and mechanism of ASPG in HCC remain poorly understood. The current study integrated bulk RNA, scRNA-seq, ST, and IHC multi-dimensional datasets to demonstrate the aberrant downregulation of ASPG mRNA and protein in HCC, along with associated impacts on the TME. CRISPR data revealed that ASPG knockout accelerated the growth of cells, while further mechanistic studies suggested that ASPG may potentially regulate biological behaviors related to metabolic reprogramming. Low expression of ASPG specifically affects the MIF pathway and enhances interaction with B cells, T/NK cells, and myeloid cells. Cancerous liver cells with low ASPG expression may be linked to altered amino acid metabolism, TCA cycle, and lipid metabolism. These processes are strongly involved in the metabolic conversion of malate to oxaloacetate, and of aspartate to asparagine. We also investigated whether low ASPG expression may be involved with drug resistance to cisplatin and gemcitabine, and sensitivity to lapatinib and paclitaxel. By applying a multi-platform analysis, we conducted a novel integrative study of ASPG in HCC. ASPG was found to have roles as a crucial metabolic regulator and as a driver of tumor progression. In addition, this work revealed the mechanism through which low ASPG expression induces metabolic reprogramming and oncogenesis, thus providing a novel theoretical basis for metabolic alteration in HCC.
The aberrant expression of ASPG may promote tumor progression. In addition to serving as a diagnostic molecular marker for treatment-related assessments in CRC, dysregulated expression of ASPG was associated with inhibitory effects in leukemia, possibly by directly exerting cytotoxic effects [11, 12]. Furthermore, studies using machine learning have confirmed the significant diagnostic value of ASPG expression in HCC, thus hinting at a universal marker across different cancer types [14]. However, a complete picture of the role of ASPG in HCC is still lacking. The current research on HCC was performed using bulk RNA, scRNA-seq, spatial ST, and IHC to study the reduced expression of ASPG at the mRNA and protein levels, as well as the single-cell level. According to CRISPR data, ASPG knockout significantly promoted HCC cell proliferation, indicating that reduced ASPG expression leads to loss of its tumor-suppressive function and acquisition of a malignant phenotype. Notably, ST analysis demonstrated that ASPG expression is not only markedly reduced in the primary tumor mass, but also undergoes further downregulation at the tumor–stroma interface compared to adjacent non-tumor tissue. Accumulating evidence from multi-cancer spatial omics studies has shown that the invasive front is a critical functional boundary where tumor cells dynamically interact with their microenvironment. This is characterized by increased proliferative activity, enhanced invasive capacity, and profound metabolic reprogramming [29, 30]. The spatially restricted low expression of ASPG at this interface strongly suggests involvement with the unique histopathological features and pro-invasive biological behaviors of the invasive niche. Collectively, our findings position ASPG as a significant tumor suppressor in HCC. Its inactivation—likely driven by underlying metabolic alterations—represents a key molecular event in hepatocarcinogenesis.
Metabolic reprogramming is one of the core features supporting the malignant progression of tumors. Such changes can promote tumor progression through dysregulation of the pathways involved in glucose metabolism, lipid metabolism, amino acid metabolism, pyrimidine metabolism, and oxidative metabolism [31]. As a metabolic regulatory factor, ASPG catalyzes the release of asparagine residues via specific reactions. The amino group of asparagine is also released by asparagine transaminase (AsnAT) for amino acid biosynthesis, thereby potentially regulating asparagine metabolism [32]. As a metabolic gene, ASPG is also implicated in the development of cancer, and has been identified as a key gene related to amino acid metabolism in CRC [33, 34]. Furthermore, ASPG was shown to coordinate a unique CAR-T cell phenotype skewed toward central memory T cells and asparagine metabolic reprogramming, thereby enhancing anti-tumor immunity [35]. Mechanistic analyses in the present study revealed that low ASPG expression affected broad metabolic pathways, including the regulation of amino acid biosynthesis, and specifically the metabolism of alanine, aspartate, and glutamate. Interestingly, scFEA results also indicated that low ASPG expression promoted the conversion of aspartate to asparagine. This suggests that ASPG deficiency leads to the abnormal accumulation of asparagine in tumor cells, contributing to core tumor metabolic reprogramming and promoting protein translation and tumor proliferation.
As a key regulatory factor in energy metabolism, ASPG has been confirmed as a potential hub for glucose metabolism. Studies have shown that liver ASPG levels are negatively correlated with human insulin sensitivity. In a mouse model of metabolic dysfunction-related fatty liver disease, knockout of the Aspg gene was shown to remodel the liver factor secretion profile, systematically increasing insulin sensitivity and maintaining glucose homeostasis in the body [36]. The present study further explored the metabolic regulatory function of ASPG from the perspective of metabolic flux, linking its role from the macroscopic glycogen metabolic process to specific intracellular pathways. Our findings revealed that the effects of low ASPG expression in HCC were not merely linear changes, but instead involved a process of coordinated metabolic reprogramming. These effects regulated the glycogen metabolic process, potentially via the TCA cycle, thereby altering the storage-release balance of glucose in the liver, while concurrently enhancing the conversion of glutamate to 2-oxoglutarate (2OG). As a key intermediate of the TCA cycle, the increased level of 2OG directly promotes mitochondrial energy metabolism [37, 38, 39]. Our study confirmed the macro-level role of ASPG in glycogen metabolism, and more importantly also delineated a precise axis from “low ASPG expression” to “enhanced glutamate-2OG metabolic flux”, which drove “TCA cycle activation and optimized energy metabolism”. Our discovery of this axis shifts the understanding of ASPG function from associative to mechanistic, offering potential new strategies for HCC treatment.
In the context of cell–cell interactions, hepatocytes with low ASPG expression
were found to promote signaling through the MIF (CD74/CXCR4/CD44) axis. This
intensifies their crosstalk with myeloid cells, activating mTORC1 and
subsequently increasing the expression of MIF [40]. Furthermore, our scFEA
analysis revealed an increase in the glutamate metabolic flux in ASPG-low
hepatocytes. Glutamate can be converted to
The notion of low ASPG expression as a potential therapeutic target for HCC
aligns with the emerging paradigm of “metabolic intervention” in cancer
treatment. Indeed, a variety of drugs currently included in the spectrum of
oncological therapies are known to exert their effects through direct or indirect
modulation of tumor cell energy metabolism. Several studies have reported on the
intrinsic relationship between metabolic reprogramming and chemotherapy
responses. In cholangiocarcinoma, higher
This study has several limitations that should be acknowledged. Although significant associations were identified between ASPG expression and metabolic phenotypes in the current analysis, the precise molecular mechanisms underlying these relationships remain to be fully elucidated. As the present research is based on observational and correlational analyses, no causal inferences can be drawn, which may restrict the interpretability of the observed associations. These findings therefore require further verification through well-designed functional experiments, including in vitro cellular models and in vivo animal studies, to clarify potential causal links. In addition, this study did not explore the subcellular localization of the ASPG protein, the biological functions of its specific transcript isoforms, or its potential post-translational modifications and interaction networks. These omissions may limit a comprehensive understanding of ASPG’s regulatory roles in hepatocellular carcinoma. Furthermore, the study did not establish feasible approaches to specifically activate ASPG in HCC subtypes with low ASPG expression, which constrains immediate translational implications for precision therapy of HCC.
This is the first comprehensive study on the phenotype of HCC with low ASPG expression. Our findings can inform future research into the rewiring of aspartate and TCA flux as a therapeutic approach. Moreover, our study revealed a strong correlation between ASPG expression and drug sensitivity in HCC.
The datasets supporting the conclusions of this article can be found at multiple public databases. The single - cell dataset is available from GEO (https://www.ncbi.nlm.nih.gov/gds/). The ST dataset can be accessed from the following database (http://lifeome.net/supp/livercancer-st/data.htm; HCC2N, HCC2L, and HCC2T). The bulk RNA datasets are accessible from the following sources: TCGA (https://portal.gdc.cancer.gov/); GEO (https://www.ncbi.nlm.nih.gov/gds/); GTEx (https://www.gtexportal.org/home/); ICGC_LIRI_JP (https://platform.icgc-argo.org/); ArrayExpress (https://www.ebi.ac.uk/biostudies/arrayexpress). The datasets used and analyzed during the current study are available from the corresponding author on reasonable request.
YWD and YLD were responsible for the execution of the experiments, systematic analysis of the data, and drafting the initial manuscript. YXT, RLS, KSN, WQ, ZDC and LX provided key assistance in optimizing the experimental design and were responsible for the rigorous implementation of data collection and statistical analysis. YWD and YLD focused on deepening the data analysis and made detailed revisions and improvements to the manuscript. ZBF and DDX as the core planners of the research, not only proposed the overall research concept but also guided the preparation and revision of the paper throughout, providing comprehensive oversight of the entire research process. Finally, all authors reviewed the manuscript and unanimously approved the final version. All authors contributed to editorial changes in the manuscript. All authors have participated sufficiently in the work and agreed to be accountable for all aspects of the work.
This study was carried out in accordance with the guidelines of the Declaration of Helsinki. Ethical approval was obtained from the Ethical Review Committee of the First Affiliated Hospital of Guangxi Medical University (Approval Number: 2025-E0967). Written informed consent was obtained from all participants included in the study.
Not applicable.
This work was supported by the Advanced Innovation Teams and Xinghu Scholars Program of Guangxi Medical University (2022); the General Program of Guangxi Natural Science Foundation (2024GXNSFAA010085).
The authors declare no conflict of interest.
Supplementary material associated with this article can be found, in the online version, at https://doi.org/10.31083/FBL49215.
References
Publisher’s Note: IMR Press stays neutral with regard to jurisdictional claims in published maps and institutional affiliations.