


 , Hao Wang 1,†, Lin Yao 1, Guozheng Zhao 1, Liyan Tang 1, Xiao Zhang 1, Jialiang Qian 1, Xiyang Weng 1, Youxin Zhou 1,*
1 Neurosurgery & Brain and Nerve Research Laboratory, The First Affiliated Hospital of Soochow University, 215000 Suzhou, Jiangsu, China
†These authors contributed equally.
Abstract
Glioblastoma (GBM) is the most aggressive primary malignant brain tumor and is associated with limited treatment options and poor prognosis. Conventional GBM cell lines undergo genetic drift and progressive divergence from patient-relevant molecular features over long-term culture, limiting their translational relevance. This study aimed to establish and characterize a novel isocitrate dehydrogenase 1 (IDH1)-wildtype GBM cell line, SHG142, along with its associated glioma stem-like cells (GSCs) and organoid models, to advance GBM biology and therapeutic research.
Primary tumor tissue from a 70-year-old female patient was cultured under standard conditions to generate the SHG142 cell line, which was authenticated by short tandem repeat (STR) profiling. Phenotypic and genetic features were evaluated using immunofluorescence (IF), karyotyping, and whole-exome sequencing (WES) including a concordance analysis between an early bulk primary culture (P2) and late-passage SHG142 (P50). GSCs were isolated via serum-free culture and magnetic-activated cell sorting (MACS). Tumorigenicity and invasiveness were assessed through intracranial xenografts in nude mice (n = 6/group) and coculture with brain organoids derived from human embryonic stem cells (n = 4 independent organoids).
SHG142 cells exhibited stable morphology and proliferation over more than 50 passages, retained key GBM markers (e.g., Nestin, Glial Fibrillary Acidic Protein (GFAP), O6-methylguanine-DNA methyltransferase (MGMT), Ki-67, P53, S-100, CD34), and exhibited chromosomal instability (+7, –10, and t(9;13)). WES revealed mutations in the TERT promoter, TP53 and NF1 and supported lineage continuity from P2 to P50 through shared SNVs and conserved driver events. CD133+ SHG142 GSCs demonstrated stem-like properties and invasive behavior in vivo and in organoid coculture. Compared with xenografts derived from SHG142 cells, GSC-derived xenografts were associated with increased malignancy and shorter survival (median survival 25 vs. 31.5 days, p = 0.025). The organoid coculture model confirmed deep infiltration by proliferative, stem-like tumor cells.
SHG142 and its GSCs represent a phenotypically stable, genetically defined GBM model with evidence of lineage continuity and retention of key driver events during in vitro propagation. Their tumorigenic and invasive properties make them valuable tools for mechanistic studies and preclinical therapeutic screening, supported by initial two-dimensional and three-dimensional drug response readouts that enable first-pass evaluation of therapeutic response.
Keywords
- glioblastoma
- cell line, tumor
- neoplastic stem cells
- organoids
- exome sequencing
Glioma is the most common primary malignant tumor of the central nervous system
(CNS), accounting for approximately 80% of all primary CNS malignancies [1].
Among them, glioblastoma multiforme (GBM) represents the highest-grade entity and
is classified as World Health Organization (WHO) grade 4 in the 2021 fifth
edition of the WHO classification of CNS tumors [2]. GBM is highly invasive,
rapidly progressive and therapy resistant; even with the standard Stupp
protocol—maximal surgical resection followed by concomitant local radiotherapy
and temozolomide (TMZ) chemotherapy—the median overall survival is
Commercially available GBM cell lines (e.g., U87, U251, LN229, T98G, and A172) have been established over three decades and have greatly facilitated mechanistic studies and drug screening. However, prolonged in vitro passaging has introduced several limitations: (i) genetic drift due to genomic instability, causing progressive deviation from original tumor genetics [5]; (ii) reduced heterogeneity from selective pressure favoring dominant subclones; and (iii) cross-contamination risks and misidentification issues. For example, short tandem repeat (STR) profiling revealed that the U87 line obtained from the ATCC diverges genetically from the original Uppsala University-derived cells [6]; U251 and U373 were once assumed to be independent but were later proven to be identical by STR analysis [7]. These flaws compromise the experimental reproducibility and clinical translatability of drug sensitivity data, underscoring the urgent need for novel cell line models.
Our laboratory previously established a human glioma cell line, SHG-44, in 1984 [8], which has been described as one of the earliest established glioma cell lines in China [9]. Subsequently, we established additional glioma cell lines, including SHG-139 [10] and SHG-140 [11], thereby expanding our glioma model panel. Nevertheless, different cell lines exhibit distinct proliferative characteristics, key genetic alterations, and drug sensitivities; thus, additional well-characterized GBM models remain needed to better capture inter-tumoral heterogeneity and improve translational relevance [12, 13]. Therefore, in this study, we established a novel glioblastoma cell line, SHG142, derived from a surgical specimen of a 70-year-old female patient with isocitrate dehydrogenase 1 (IDH1)-wildtype GBM and validated its identity and authenticity by STR profiling. We further defined its molecular phenotype and genetic background, isolated and characterized the corresponding glioma stem-like cells, and evaluated their tumorigenicity and invasive behavior in both intracranial xenograft and brain organoid coculture models. SHG142 thus enhances the molecular and phenotypic diversity of GBM cell line resources and provides a robust platform for in vitro and in vivo studies of GBM biology and translational research.
Fresh glioblastoma tissue was obtained from a surgical specimen of a 70-year-old female patient treated at the Department of Neurosurgery of our institution in 2022. Integrated diagnosis based on the 2021 fifth edition of the WHO Classification of Central Nervous System Tumors confirmed an IDH1-wildtype glioblastoma. The tissue was registered in our institutional glioma biobank as sample No. 142 and designated as SHG142. Specimen collection was approved in advance by the Ethics Committee of Soochow University (Approval No. SUDA20221206H03, 2022), and the expanded scope of the current project, including organoid establishment and related procedures, was approved under protocol code SUDA20240913H04 (September 2024). All procedures involving human tissue adhered to the 1964 Declaration of Helsinki and its later amendments or comparable ethical standards.
Fresh tumor tissue was rinsed twice in phosphate-buffered saline (PBS), minced with sterile scissors, and enzymatically digested with 0.05% trypsin-EDTA (0.2 mM EDTA) at 37 °C for 20–30 min. Dissociated cells were resuspended in complete medium (DMEM/F12 supplemented with 10% fetal bovine serum (FBS) and 1% penicillin/streptomycin) and seeded into 25 cm2 flasks. Cultures were maintained at 37 °C in a humidified 5% CO₂ incubator (Thermo Fisher Scientific, Model 3110), with the medium replenished every 48 h. Upon reaching 80% confluency, the cells were subcultured at a split ratio of 1:3–1:4 using trypsin-EDTA. The cells that maintained stable passage were preserved in freezing medium containing 10% DMSO, initially stored at –80 °C in a step-down freezing container and later transferred to long-term storage. Cells at passage 50 were used for downstream characterization. STR profiling of 21 loci and the amelogenin gene was performed using the SiFaSTR™ 23 Plex Kit to authenticate cell line identity and exclude cross-contamination. Bacterial and mycoplasma contamination were excluded. Manufacturer/supplier information (including catalog numbers) for all commercial reagents, antibodies, and software used in this study is summarized in Supplementary Reagents & Software.
SHG142 cells were seeded in ultralow attachment plates in serum-free GSC medium (DMEM/F12 supplemented with 2% B27 supplement, 20 ng/mL recombinant human epidermal growth factor (EGF), 20 ng/mL basic fibroblast growth factor (bFGF), and 2 µg/mL heparin) supplemented with 1% penicillin‒streptomycin (PS). The cultures were maintained at 37 °C/5% CO₂, with half of the medium changed every 2–3 days. After the formation of tumor spheres, the cells were dissociated into single-cell suspensions. CD133+ cells were isolated using anti-CD133 microbeads (Miltenyi Biotec) according to the manufacturer’s protocol, followed by magnetic-activated cell sorting (MACS). Sorted CD133+ GSCs were expanded in stem cell medium. For passaging, GSCs were centrifuged, washed with PBS, resuspended in fresh medium, and transferred to new flasks. Stem-like properties were validated by immunofluorescence staining of known stem cell markers and in vivo tumorigenicity assays.
For the SHG142 cells, sterile circular coverslips were placed in 24-well plates and seeded with single-cell suspensions. After 24 h of incubation under standard conditions (e.g., 37 °C, 5% CO₂), the cells were fixed in 4% paraformaldehyde (PFA) for 20 min at room temperature. The cells were subsequently washed three times with IF-PBST and permeabilized with 0.5% Triton X-100 for 30 min. After additional washing, the cells were blocked with 5% bovine serum albumin (BSA) for 30 min and incubated overnight at 4 °C with primary antibodies and then with fluorophore-conjugated secondary antibodies for 1 h at room temperature in the dark. After nuclear staining with 4′,6-diamidino-2-phenylindole (DAPI) (1 µg/mL, 10 min), the cells were mounted using anti-fade mounting medium and imaged with an Olympus fluorescence microscope.
For the SHG142 GSCs, suspended cells were centrifuged at 1000 rpm for 5 min, washed with PBS, fixed with 4% PFA for 20 min, and smeared on slides (20 µL/slide). After air drying, the cells were permeabilized with 0.5% Triton X-100, blocked with 5% BSA, and incubated with primary antibodies overnight at 4 °C. After the samples were washed, secondary antibodies were applied for 1 h in the dark. DAPI staining and imaging were performed as described above. For SHG142 cells, the primary antibodies used were anti-Nestin (Proteintech, Cat. No. 19483-1-AP), anti-GFAP (Proteintech, Cat. No. 16825-1-AP), and anti-Ki-67 (Abcam, Cat. No. ab15580). For SHG142 GSCs, the primary antibodies used were anti-Nestin (Proteintech, Cat. No. 19483-1-AP), anti-CD133 (Proteintech, Cat. No. 18470-1-AP), and anti-A2B5 (Abcam, Cat. No. ab53521). Fluorophore-conjugated secondary antibodies were purchased from Invitrogen (Cat. Nos. A-11008 and A-11005).
Exponentially growing SHG142 cells were seeded into 96-well plates at 1
Cells in the logarithmic growth phase were treated with colchicine (0.25 µg/mL) for 3 h to arrest the cells in metaphase. After enzymatic dissociation and centrifugation, the cells were subjected to hypotonic treatment with 75 mM KCl at 37 °C for 15 min, followed by two rounds of fixation in methanol: acetic acid (3:1). The suspension was dropped onto precooled slides and incubated at 80 °C. Chromosomes were stained with Giemsa and examined under a microscope. Karyotypes were classified according to the International System for Human Cytogenetic Nomenclature (ISCN).
Twelve BALB/c nude mice were purchased from the Model Animal Research Center of Nanjing University and housed in the SPF animal facility at our institution. The mice had free access to autoclaved water and standard rodent chow and were acclimatized for at least one week prior to experimentation. Ethical approval for this study was obtained from the Ethics Committee of Soochow University (Approval No. SUDA20240913A03).
Luciferase-expressing SHG142 cells or SHG142 GSCs were resuspended in PBS (4
Statistical analysis of survival data was performed using GraphPad Prism
(version 10.1.2; GraphPad Software, San Diego, CA, USA). Kaplan–Meier survival
curves were generated for mice implanted with SHG142 cells or SHG142 GSCs (n = 6
per group) and compared using the log-rank (Mantel–Cox) test. Exact p
values are reported, and a p value
Stable luciferase-expressing cells were generated using a lentiviral transfer vector GV281 (GeneChem, China), in which firefly luciferase is driven by the human Ubc promoter (Ubc–firefly luciferase–MCS–IRES–puromycin). Stable GFP-expressing cells were generated using a lentiviral transfer vector GV493 (GeneChem, China), in which EmGFP is driven by the CBh promoter (hU6–MCS–CBh–EmGFP–IRES–puromycin). Cells were transduced with lentiviral particles and subsequently selected with puromycin to establish stable populations (selection conditions were optimized by kill-curve testing).
Human cerebral organoids were generated from H9 embryonic stem cells (hESCs) obtained from the National Collection of Authenticated Cell Cultures (China). Organoid differentiation and maturation were performed with reference to established cerebral organoid protocols [14, 15]. Briefly, 9000 hESCs/well were seeded in 96-well ultralow attachment plates in STEMdiff™ Neural Induction Medium to form embryoid bodies (EBs). EBs were transferred to neural induction medium for neuroectoderm specification. Neuroepithelial tissues were embedded in Matrigel droplets and cultured in IDM-A medium in 24-well plates on an orbital shaker for expansion. IDM-A medium was prepared by mixing 125 mL DMEM/F12 and 125 mL Neurobasal medium (Gibco, 21103-049), supplemented with 1.25 mL N-2 (Gibco, 17502-048), 62.5 µL insulin (Sigma-Aldrich, I9278), 2.5 mL GlutaMAX (Gibco, 35050-061), 1.25 mL MEM-NEAA (Gibco, 11140-050), 2.5 mL penicillin–streptomycin (Gibco, 15140-122), and 5 mL B-27 minus vitamin A (Gibco, 12587-010).
On Day 30 of organoid maturation, 1
To evaluate drug response in a more physiologically relevant 3D context, SHG142 GSCs stably expressing luciferase were cocultured with brain organoids to establish SHG142 organoid-based coculture tumor models. After coculture maturation, organoid cultures were treated with vehicle control or single-dose drug exposures at reference concentrations informed by the in vitro IC50 values: temozolomide (TMZ, 900 µM), lomustine (CCNU, 120 µM), carmustine (BCNU, 60 µM), or SN-38 (20 nM). Bioluminescence was assessed at Day 0 (immediately prior to drug treatment) and at Day 7 post-treatment using plate-based luminescence imaging, and the treatment effect was quantified as luciferase fold change (Day 7/Day 0) for each organoid. Each condition included n = 3 organoids. Statistical analyses were performed in GraphPad Prism using ordinary one-way ANOVA followed by Dunnett’s multiple comparisons test versus the vehicle control; adjusted p values were reported.
Genomic DNA was extracted from parental bulk primary glioma cells (P2) and P50
SHG142 cells and subjected to quality control. The qualified DNA was fragmented
into 150–350 bp fragments. Libraries were constructed via end repair, A-tailing,
and adapter ligation. Libraries were hybridized with biotinylated exon capture
probes (Illumina) and enriched with streptavidin-coated beads. The captured DNA
was amplified via PCR. The final libraries were quantified and sequenced on an
Illumina NovaSeq 6000 platform (PE150 configuration). Variant allele frequency
(VAF) was calculated as Alt/(Ref+Alt) from read counts, and variants were
annotated and summarized for concordance analysis between P2 and P50. For the
SNV-only concordance analysis, variants were filtered using harmonized criteria
in both datasets: exonic variants were retained and the TERT promoter
hotspot–region variant annotated as an upstream/promoter event was included;
synonymous SNVs were excluded; only PASS variants were kept; and common
polymorphisms were removed using gnomAD (allele frequency
Primary tumor tissue was dissociated into single cells and cultured in serum-containing medium. The tumor cells proliferated slowly during the initial five passages, after which their growth rate increased and stabilized. SHG142 cells formed a monolayer and displayed an irregular morphology, with most cells appearing bipolar or spindle shaped (Fig. 1A). The nuclei showed marked pleomorphism, ranging from round to irregular polygonal shapes, and individual cells often contained one or two nuclei. A small proportion of cells exhibited pseudopod-like extensions, whereas most cells lacked prominent projections. These morphological features remained stable during subsequent passages. Immunofluorescence staining of passage 50 cells revealed positive expressions of Nestin, GFAP and Ki-67 (Fig. 1H).
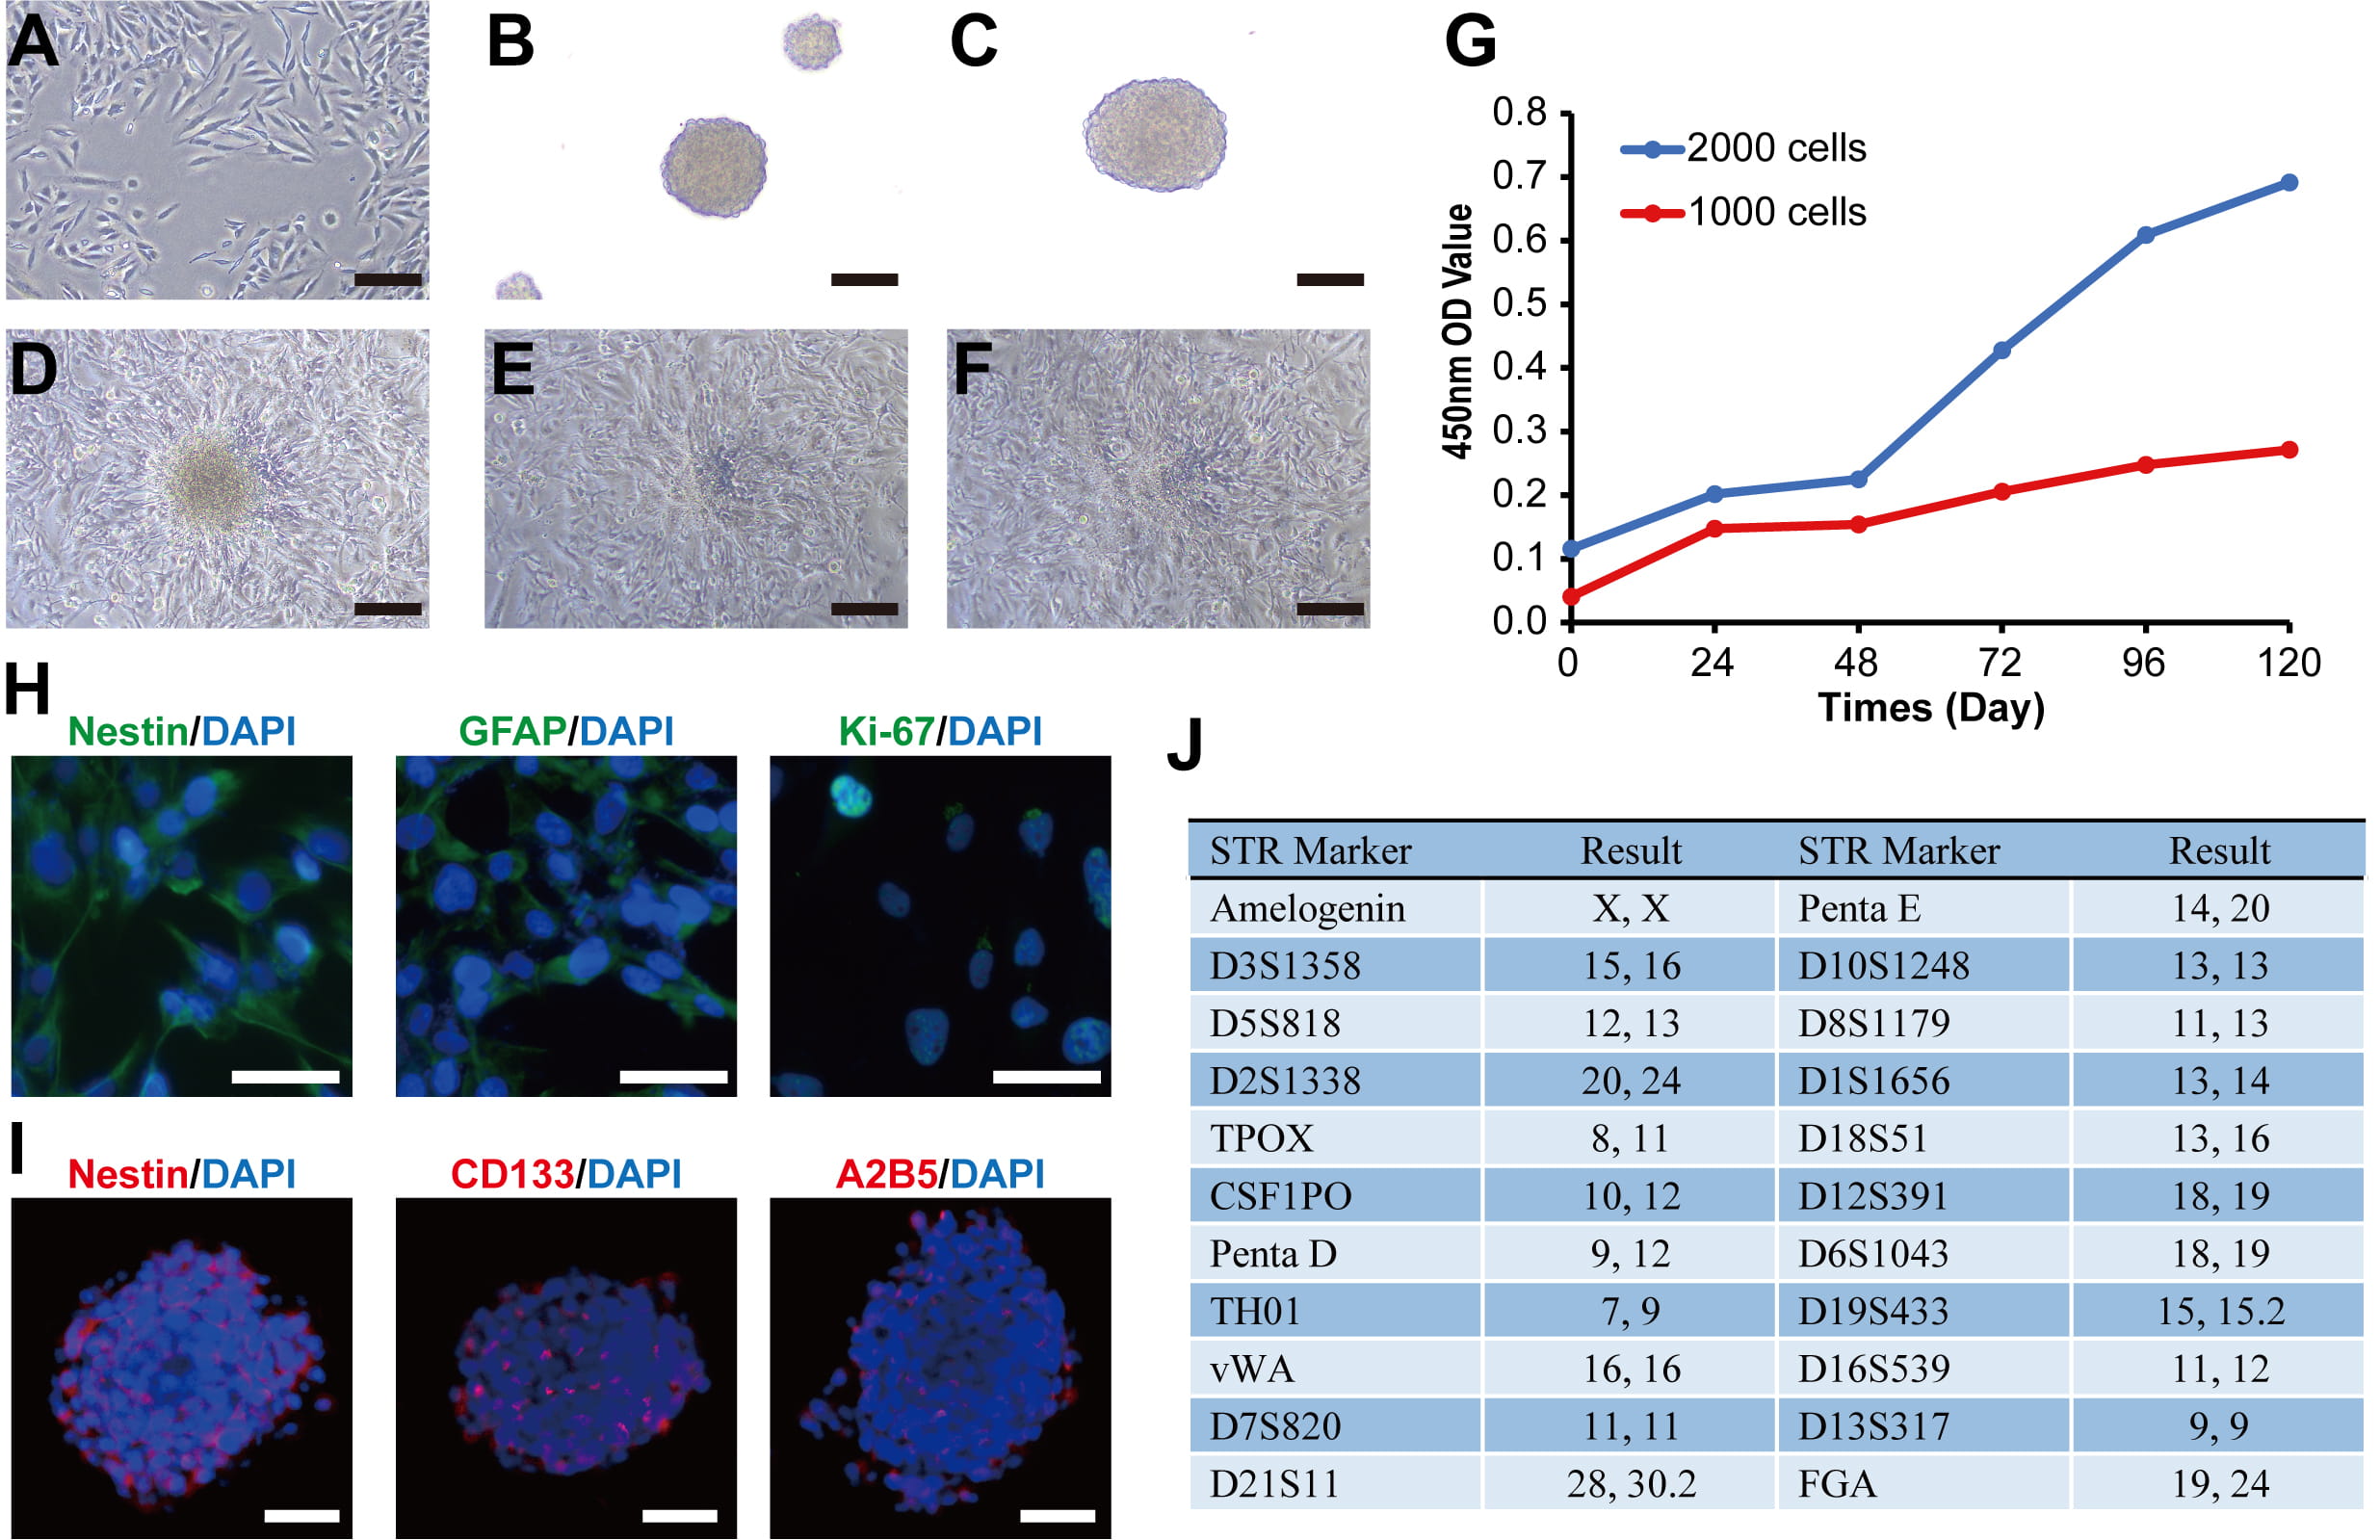 Fig. 1.
Morphological and phenotypic characterization of the SHG142 glioblastoma cell line and its glioma stem-like cells. (A) Bright-field image showing the morphology of SHG142 cells at passage 50 (scale bar: 200 µm). (B) Morphology of SHG142 GSC spheres at passage 1 (scale bar: 200 µm). (C) Morphology of SHG142 GSC spheres at passage 5 (scale bar: 200 µm). (D) Morphological changes of SHG142 GSCs after 6 h of adherent culture in DMEM/F12 supplemented with 10% fetal bovine serum but without EGF or bFGF (scale bar: 200 µm). (E) As in (D) after 24 h (scale bar: 200 µm). (F) As in (D) after 48 h (scale bar: 200 µm). (G) Cell proliferation curve of SHG142 cells; the x-axis indicates time, and the y-axis shows the absorbance at 450 nm. (H) Immunofluorescence staining showing the expressions of key markers in passage 50 SHG142 cells: Nestin (++), GFAP (++), and Ki-67 (50%) (scale bar: 50 µm). (I) Representative immunofluorescence images of CD133, Nestin, and A2B5 expressions in tumor spheres formed by SHG142 GSCs. DAPI was used as a nuclear counterstain for immunofluorescence (scale bar: 50 µm). (J) STR genotyping profile of SHG142 cells at passage 50. Abbreviations: A2B5, Ganglioside Antigen A2B5; DAPI, 4′,6-diamidino-2-phenylindole; GFAP, glial fibrillary acidic protein; GSC, glioma stem-like cell; STR, short tandem repeat; EGF, epidermal growth factor; bFGF, basic fibroblast growth factor.
Passage-50 SHG142 cells were enzymatically dissociated, centrifuged, resuspended in neural stem cell medium (NSCM) and seeded into ultralow-attachment plates for suspension culture. After 5–7 days, numerous floating spheroids with diameters greater than 50 µm were observed and designated as SHG142 GSCs (Fig. 1B,C). During passaging, only the suspended spheroids were collected, and any adherent cells were discarded. Immunofluorescence staining of SHG142 GSCs at passage 5 confirmed the positive expressions of the glioma stem-like cell markers, CD133, Nestin and A2B5 (Fig. 1I). To assess their differentiation capacity, SHG142 GSCs were transferred to DMEM/F12 supplemented with 10% FBS but lacking bFGF and EGF. After 6 h, partial cell attachment was observed, with adherent cells accumulating around the original spheroids; by 48 h, nearly all the cells had adhered to the substrate (Fig. 1D–F).
STR profiling at passage 50 confirmed that SHG142 is a female-derived glioma cell line. The STR pattern did not match that of any existing cell line in the ExPASy STR database, indicating that SHG142 represents a unique cell line (Fig. 1J).
The proliferative capacity of passage 50 SHG142 cells was evaluated using a Cell Counting Kit-8 (CCK-8) assay (Fig. 1G). The optical density (OD) at 450 nm increased modestly over the first 48 hours, followed by a marked increase thereafter. The growth curve of the SHG142 cells exhibited a biphasic pattern: an initial lag phase with limited proliferation within the first 48 hours, followed by a transition into a logarithmic growth phase, ultimately reaching a plateau indicating saturation. For limited benchmarking against a widely used GBM reference line (LN229) under identical conditions, a head-to-head CCK-8 comparison is provided in Supplementary Fig. 1.
The SHG142 glioblastoma cell line exhibited pronounced chromosomal instability (CIN), a hallmark of malignancy characterized by numerical abnormalities (e.g., aneuploidy) and large-scale structural alterations, such as translocations, deletions, and amplifications. On the basis of previous reports, the chromosomal numerical abnormalities in some glioma cell lines are summarized in Table 1 (Ref. [5, 11, 16, 17, 18]).
| Cell line | Number of chromosomes | Number of karyotyped cells | Refs. |
| U251MG | 52–124 | 60 | [5] |
| SHG140 | 55 | 1 | [11] |
| K308 | 54–280 | 100 | [16] |
| GWH04 | 61–125 | 40 | [17] |
| H4 | 50–81 | 25 | [18] |
G-banding karyotype analysis was performed on passage 50 SHG142 cells, with 100 metaphase spreads analyzed. The chromosome numbers ranged from 36 to 94, approximately forming two distinct populations: nearly half of the cells maintained a near-diploid state with 44–47 chromosomes, whereas approximately 20% displayed hyperdiploid or polyploid profiles (Fig. 2B).
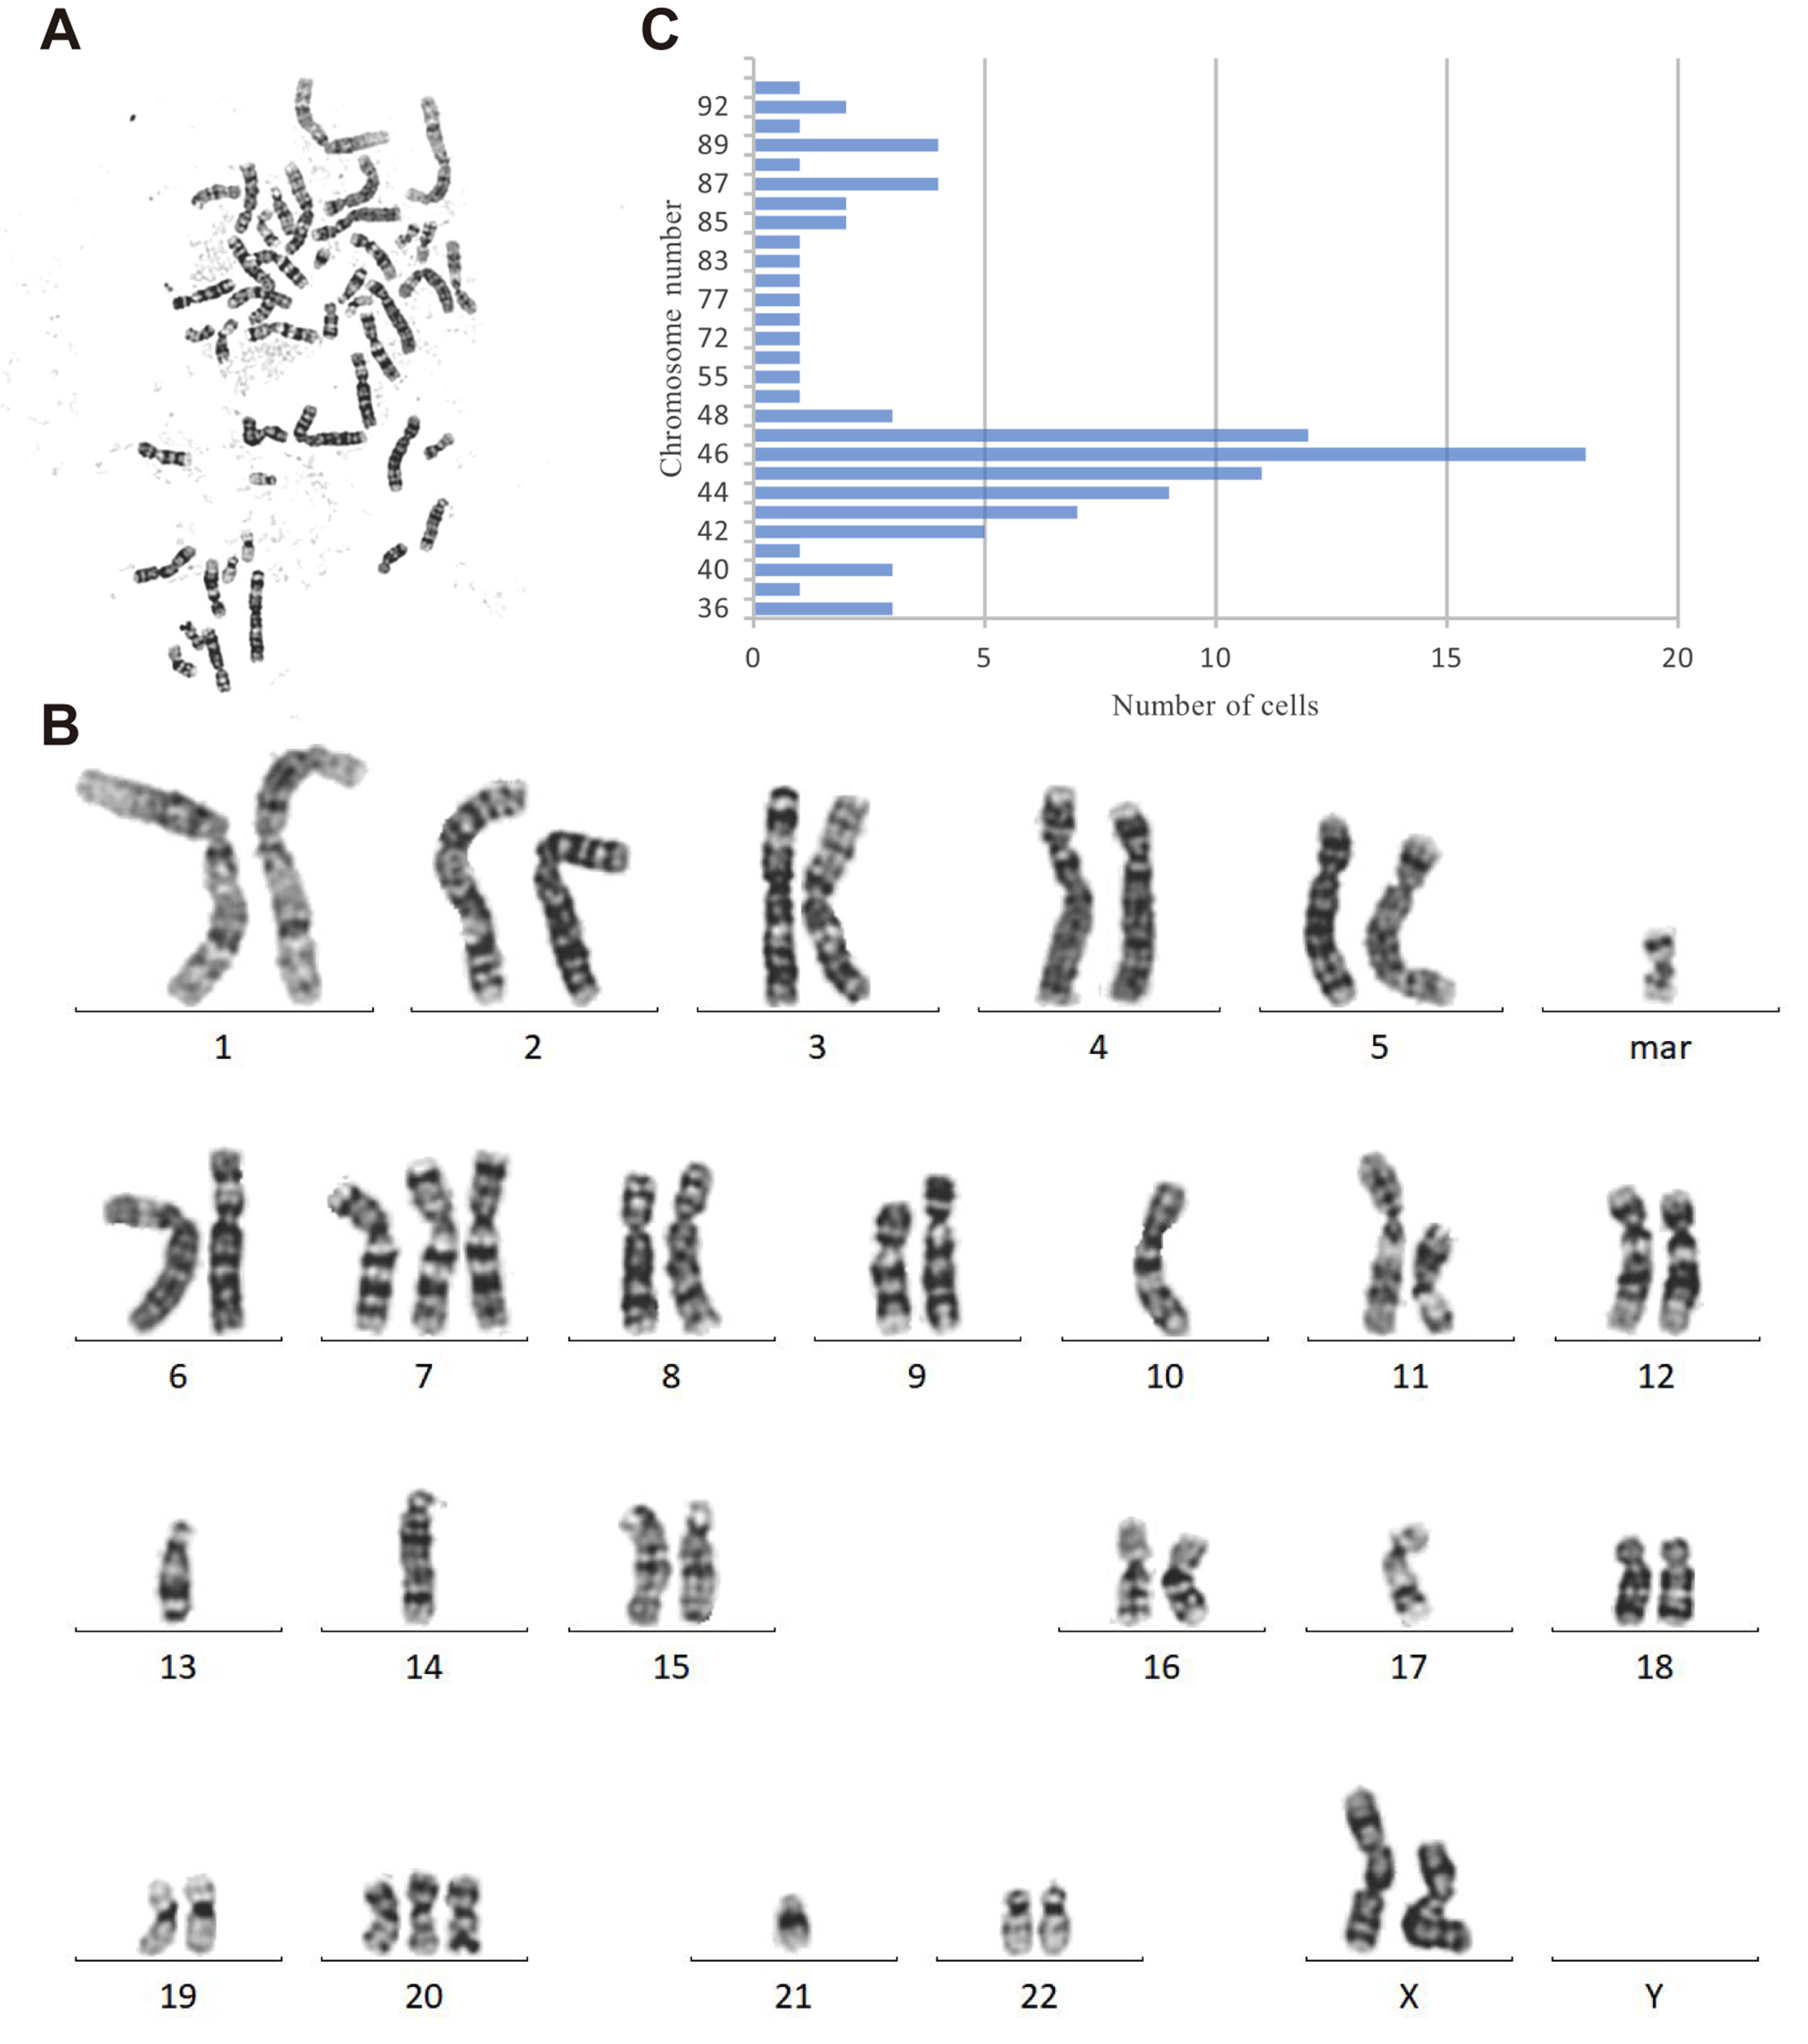 Fig. 2.
Karyotypic analysis of SHG142 glioblastoma cells. (A) Representative metaphase spread of SHG142 cells from a single-karyotype analysis. (B) Distribution of SHG142 cells by chromosomal ploidy category (n = 100). (C) Corresponding karyogram for the metaphase shown in (A).
Clonal numerical aberrations, including trisomy of chromosome 7 and monosomy of chromosome 10, were recurrently observed. Monosomies of chromosomes 13 and 17 were also frequently detected. Structural rearrangements included a breakpoint at 3p13 with a translocation to an unidentified chromosome, a t(9q34;13q22) translocation, a t(13q12;3p12) translocation, and a deletion within 11q14 (Fig. 2A,C). These findings are consistent with the known genomic complexity of high-grade gliomas.
Preoperative magnetic resonance imaging (MRI) revealed a mass in the right temporal lobe. On T1-weighted imaging (T1WI), the lesion exhibited slightly hypointense signals (Fig. 3A), whereas contrast-enhanced scans demonstrated an irregular ring-like enhancement with a nonenhancing central region suggestive of necrosis (Fig. 3B). T2-weighted imaging (T2WI) revealed a mildly hyperintense signal in the solid portion of the tumor, surrounded by a large area of hyperintense peritumoral edema, with evidence of compression of the lateral ventricle (Fig. 3C).
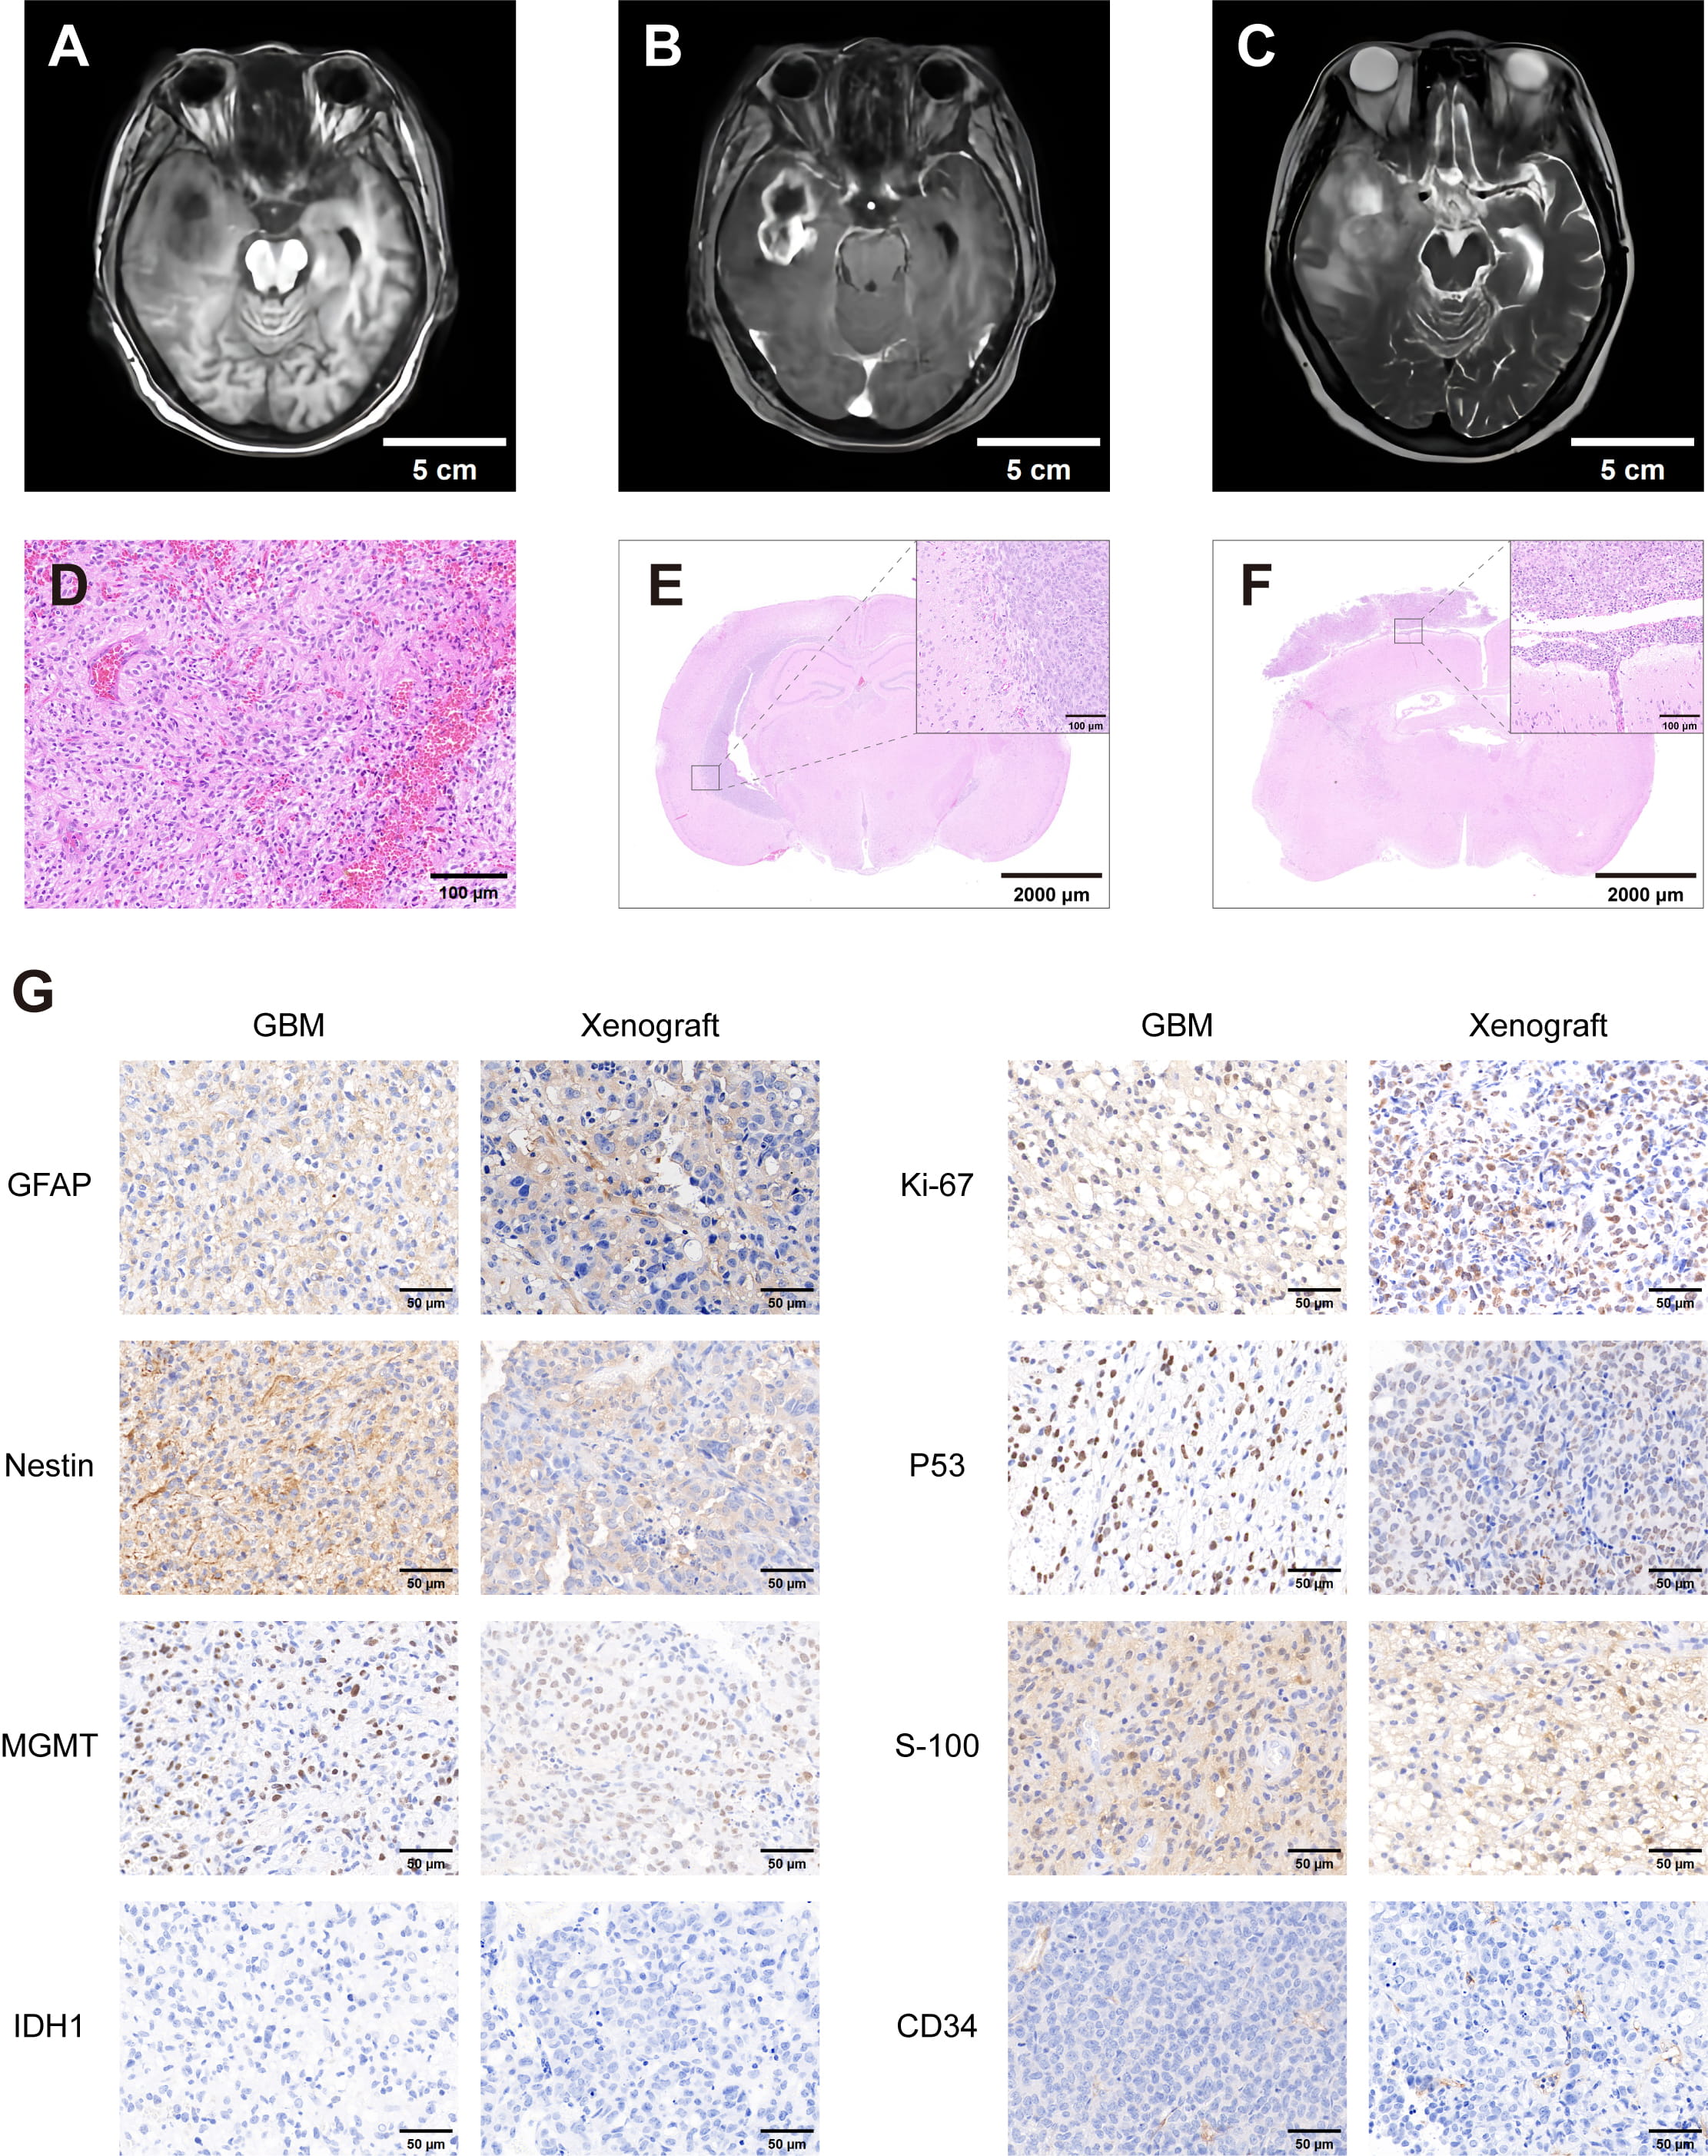 Fig. 3.
MRI, hematoxylin and eosin (H&E) staining, and immunohistochemical of tumor tissues from the patient and intracranial xenografts. (A) Preoperative T1-weighted MRI. (B) Preoperative contrast-enhanced T1-weighted MRI. (C) Preoperative T2-weighted MRI (scale bar: 5 cm). (D) H&E staining of the patient’s primary tumor (scale bar: 100 µm). (E) H&E staining of intracranial xenograft tumor derived from SHG142 cells (scale bar: 2000 µm; inset: 100 µm). (F) H&E staining of intracranial xenograft tumor derived from SHG142 GSCs (scale bar: 2000 µm; inset: 100 µm). (G) Comparative immunohistochemical staining of GFAP, Nestin, MGMT, IDH1, Ki-67 (~50%), P53 (~80%), S-100 and CD34 between the patient’s primary glioblastoma tissue and xenograft tumor tissue in nude mice (scale bar: 50 µm). MRI, magnetic resonance imaging; MGMT, O6-methylguanine-DNA methyltransferase; IDH1, isocitrate dehydrogenase 1.
Histopathological examination of the resected tissue revealed a densely cellular tumor composed of pleomorphic and atypical cells. The tumor nuclei were enlarged, hyperchromatic, and irregular in shape, with frequent mitotic figures observed. The tumor displayed an infiltrative growth pattern with a lack of normal tissue architecture. Neovascularization foci were also noted (Fig. 3D).
Immunohistochemical staining revealed positive expressions of GFAP, Nestin, MGMT, Ki-67, P53, S-100 and CD34, while IDH1 staining was negative. The Ki-67 proliferation index was approximately 50%, indicating a high proliferative capacity of the tumor cells (Fig. 3G).
To evaluate the tumorigenicity of SHG142 and SHG142 GSCs in vivo, we orthotopically implanted each cell population into the brains of immunodeficient mice. Both SHG142 and SHG142 GSCs formed intracranial tumors (Fig. 4A), with SHG142 GSCs demonstrating modestly greater tumorigenic behavior, as evidenced by a shorter median survival in mice bearing SHG142 GSC-derived tumors than in those implanted with SHG142 cells (median survival: 25 vs. 31.5 days, p = 0.025; log-rank test; HR = 3.179; 95% CI 0.845–11.96) (Fig. 4B). Given the limited cohort size (n = 6 per group), this survival difference should be interpreted cautiously.
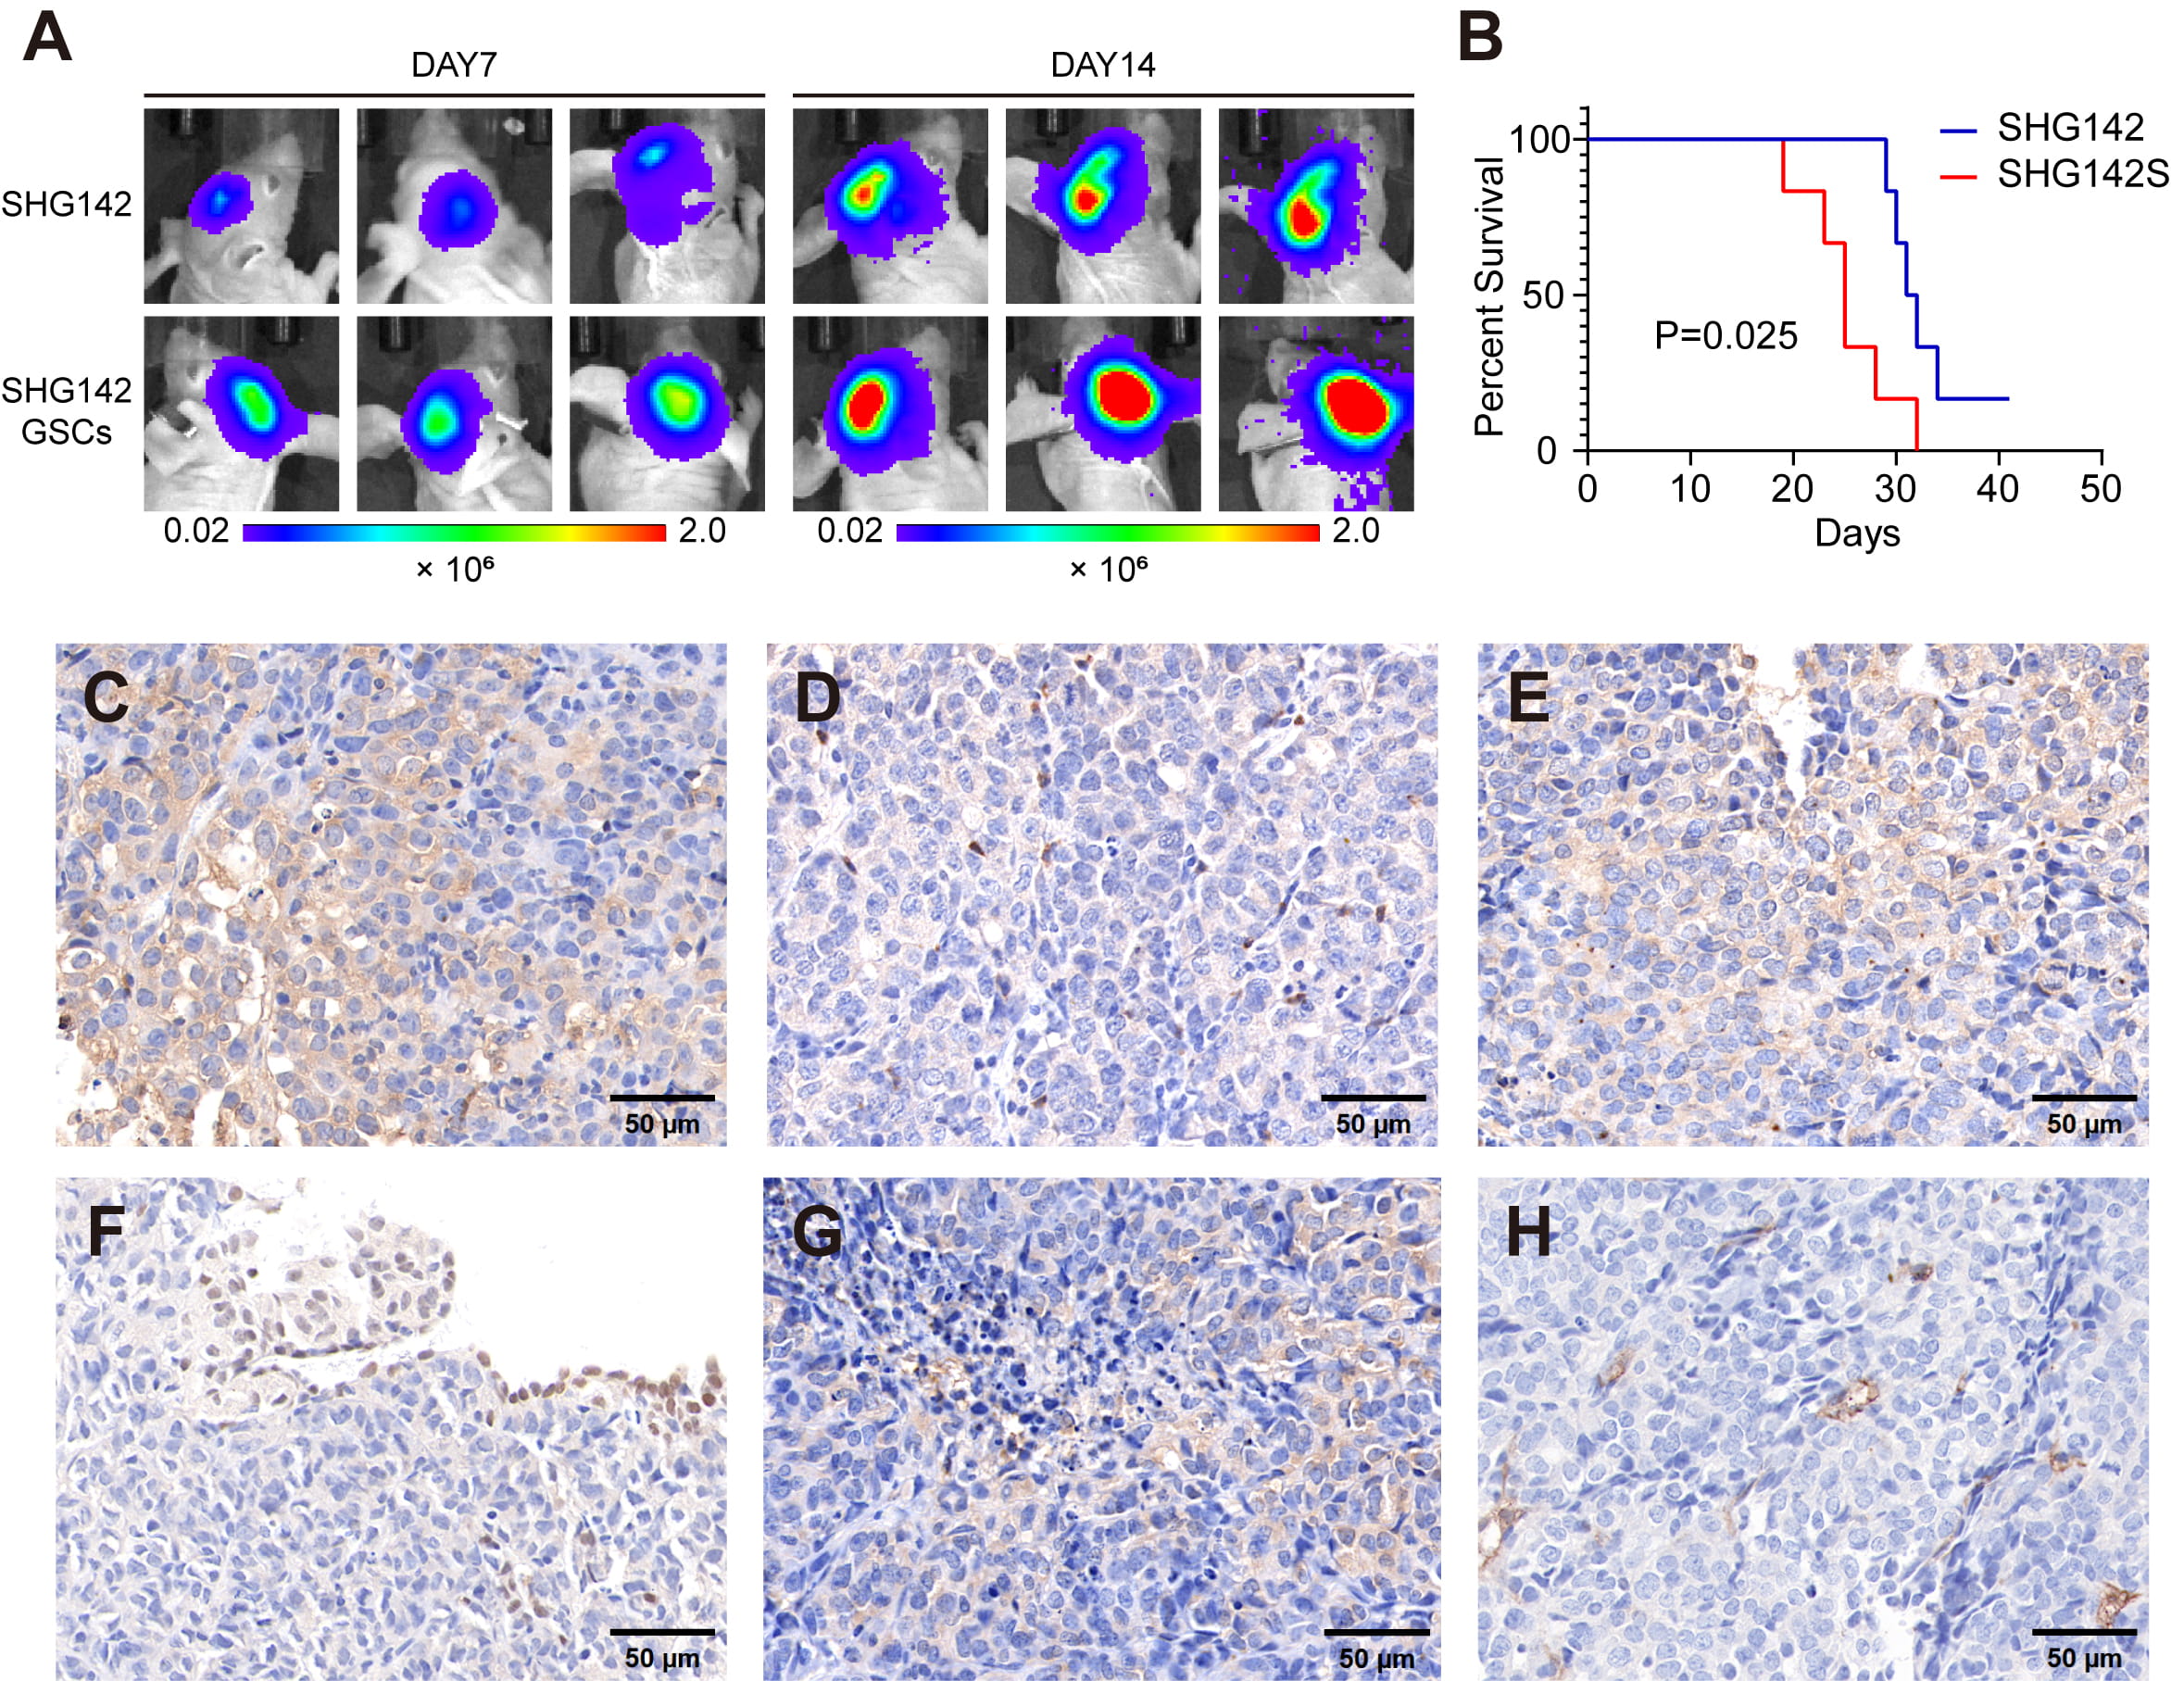 Fig. 4.
Tumorigenic potential of the SHG142 cells and SHG142 GSCs in intracranial xenografts. (A) Bioluminescence imaging of mouse brains at Day 7 and 14 after intracranial implantation of SHG142 cells and SHG142 GSCs. (B) Kaplan–Meier survival curves of mice implanted with SHG142 cells and SHG142 GSCs (n = 6 per group); p = 0.025, log-rank test; HR = 3.179, 95% CI 0.845–11.96. Survival was defined as the time from intracranial implantation to the humane endpoint. (C–H) Immunohistochemical staining of intracranial xenograft tumors derived from SHG142 GSCs, showing positive expressions of (C) Nestin, (D) CD133, (E) A2B5, (F) SOX2, (G) vimentin, and (H) CD34 (scale bar: 50 µm).
Histological analysis of intracranial xenografts derived from SHG142 cells revealed well-defined tumor boundaries and localized growth. The tumors displayed high cell densities, with predominantly spindle- and round-shaped cells (Fig. 3E). Immunohistochemistry demonstrated positive expressions of GFAP, Nestin, MGMT, Ki-67, P53, S-100 and CD34, with a Ki-67 labeling index of approximately 50%, and IDH1 expression was not detected (Fig. 3G). These results are consistent with those observed in the patient’s primary tumor tissue.
In contrast, tumors derived from SHG142 GSCs exhibited a more infiltrative growth pattern with an ill-defined tumor margin and areas of tumor–brain interface disruption. These tumors were highly cellular and displayed greater cytomorphologic heterogeneity, accompanied by prominent tissue clefting near the tumor–brain interface and focal hemorrhage with erythrocyte extravasation, suggestive of a more invasive phenotype (Fig. 3F). Immunohistochemical staining confirmed the positive expressions of stemness and mesenchymal markers, including Nestin, CD133, A2B5, SOX2, vimentin, and CD34 (Fig. 4C–H).
In addition to in vivo models, brain organoids were utilized to simulate the invasion and tumor formation of SHG142 GSCs in a human-relevant 3D environment. H9 human embryonic stem cells (hESCs) were first thawed and cultured. On day 7, the formation of EBs was induced in the hESCs. By day 14, neural induction medium was applied to initiate neuroectodermal differentiation. On day 21, the resulting neuroepithelial tissue was transferred onto Matrigel droplets to promote neuroepithelial expansion. Matrigel-embedded tissues were subsequently cultured in 24-well plates on an orbital shaker to facilitate cerebral tissue growth and expansion. Mature brain organoids were formed after approximately 50 days (Fig. 5A). Stable GFP-expressing SHG142 GSCs were first established via lentiviral transduction to enable visualization and tracking within the organoid system (Fig. 5B). Immunofluorescence analysis on Day 7 after coculture revealed early infiltration and tumorigenic behavior of SHG142 GSCs within the cerebral organoids (Fig. 5C), and the invasion phenotype was further quantified, as shown in Supplementary Fig. 2 (invasion-positive rate, invasion depth, and % infiltrated area). Prior to tumor cell seeding, the developmental fidelity of the hESC-derived cerebral organoids was validated through assessments of tissue architecture, differentiation progression, and cellular composition (Fig. 5D–F). After mature organoids were cocultured with SHG142 GSCs for 7 days, immunofluorescence analysis demonstrated robust expressions of Ki-67, CD133, Nestin, and SOX2, confirming tumor cell proliferation and the retention of stem-like properties within the organoid system (Fig. 5G).
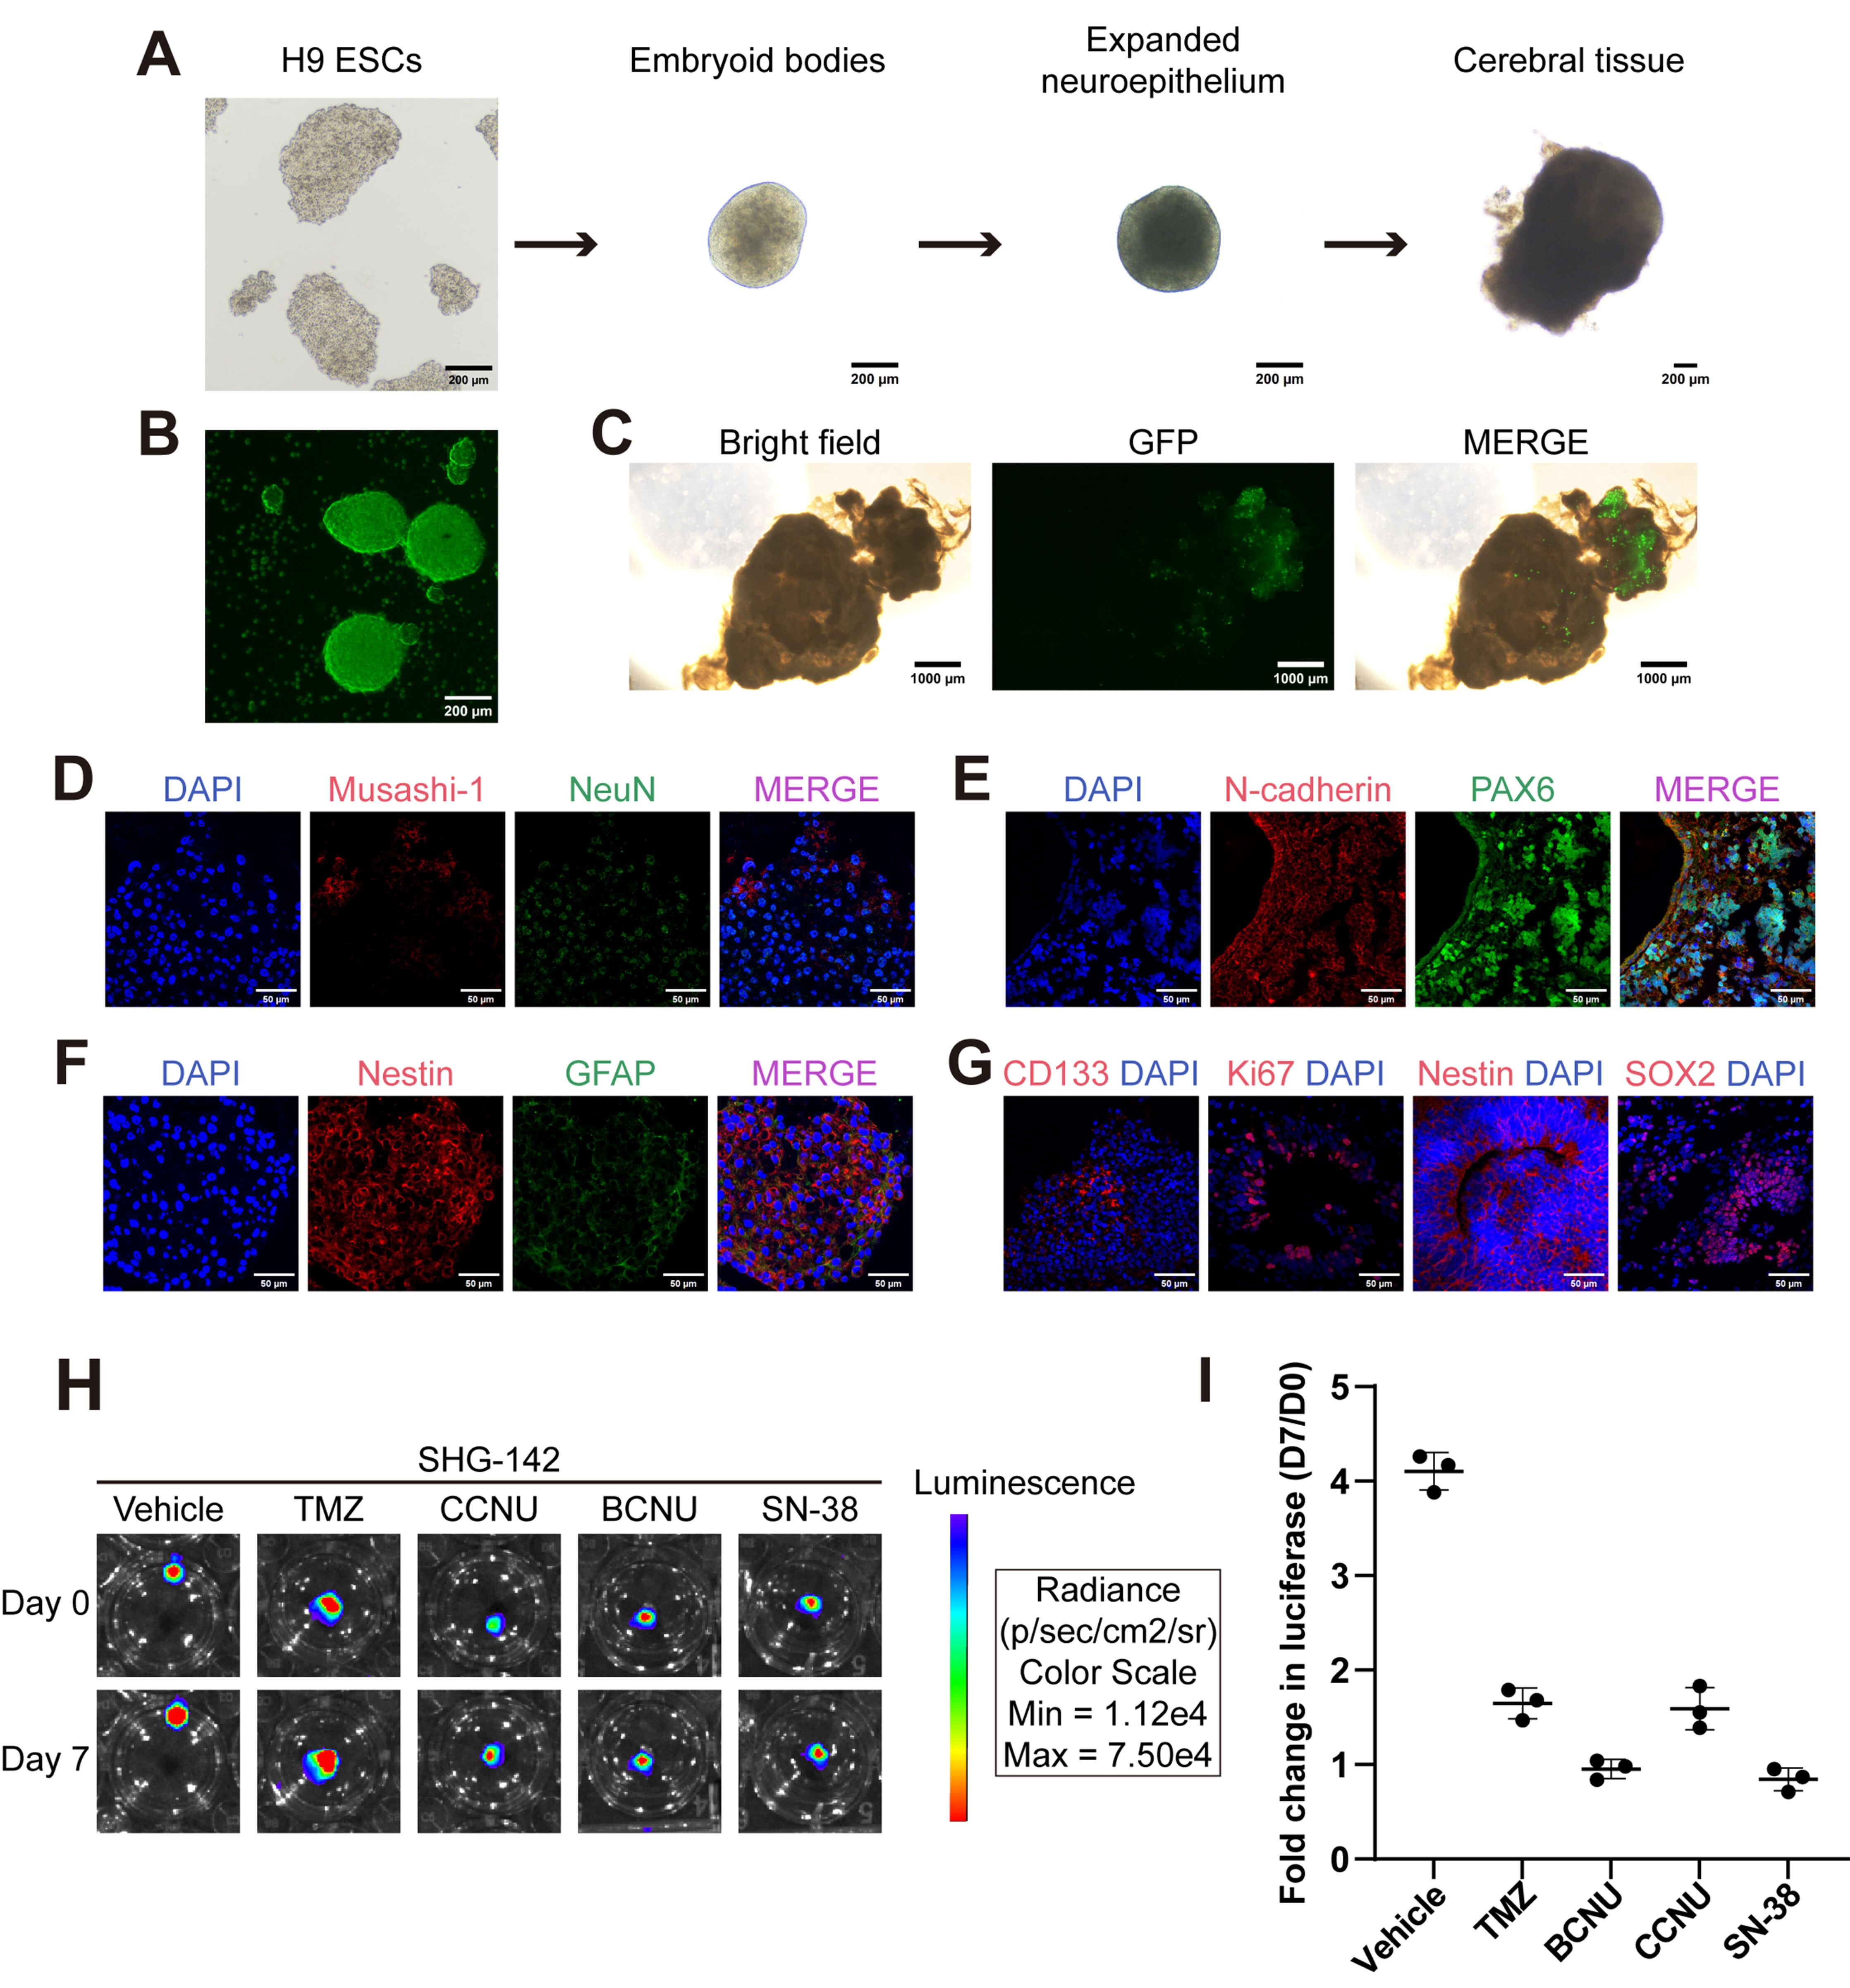 Fig. 5.
Generation of H9 hESC-derived brain organoids and application to
SHG142 GSC co-culture and drug response assessment. (A) Representative
bright-field images illustrating the organoid differentiation timeline: H9 ESC
culture (Day 7)
To complement the organoid invasion readouts, we further performed single-dose
drug testing in the SHG142 GSC–organoid coculture model with plate-based
bioluminescence imaging. Representative bioluminescence images at Day 0 and Day 7
show robust tumor-associated signal expansion in the vehicle group and marked
suppression following drug exposure (Fig. 5H). Quantification using
baseline-normalized luciferase fold change (Day 7/Day 0) demonstrated significant
growth suppression across all four agents compared with vehicle (vehicle mean
fold change 4.103 vs. TMZ 1.647, CCNU 1.590, BCNU 0.953, and SN-38 0.843; n = 3
organoids per group; ordinary one-way ANOVA followed by Dunnett’s multiple
comparisons test vs. vehicle, adjusted p
Genetic mutations are central driving forces in tumorigenesis. In glioblastoma (GBM), oncogenesis is closely associated with recurrent driver alterations, such as EGFR amplification, TERT promoter mutations, TP53 inactivating mutations, PTEN deletions, and IDH1 R132H somatic mutations. These alterations synergistically contribute to malignant glioma clonal evolution by disrupting key signaling pathways, including the RTK/PI3K/AKT axis, the p53-mediated genomic stability machinery, and the RB-associated cell cycle regulatory network. TERT promoter mutations, which create de novo binding motifs for ETS transcription factors (notably GABP), lead to aberrant reactivation of telomerase in tumor cells, enabling replicative immortality—a hallmark of glioblastoma pathogenesis.
To assess genomic concordance and lineage continuity during in vitro
propagation, we performed WES on the parental early-passage bulk primary culture
(P2), derived from the same surgical specimen, in parallel with SHG142 cells at
passage 50. The results revealed that key glioblastoma-associated events, such
as TP53 p.H193R, truncating NF1 p.R1947X, and the TERT
promoter hotspot (c.-124C
| Gene | Mutation type | Base mutation | AA mutation | VAF (P2; P50) |
| TP53 | nonsynonymous SNV | c.578A |
p.H193R | 100.0%; 100.0% |
| TERT | promoter SNV | c.-124C |
— | 53.5%; 78.3% |
| NF1 | stopgain | c.5839C |
p.R1947X | 44.7%; 42.9% |
| ERBB2 | nonsynonymous SNV | c.428G |
p.R143Q | 47.9%; 50.0% |
| CCT5 | nonsynonymous SNV | c.1075G |
p.V359I | 40.3%; 36.4% |
| BCORL1 | nonsynonymous SNV | c.4171G |
p.G1391R | 38.9%; 46.6% |
| NPHP4 | nonsynonymous SNV | c.3160C |
p.R1054C | 45.7%; 45.3% |
| PXDN | nonsynonymous SNV | c.1495C |
p.Q499E | 48.1%; 50.0% |
WES, whole-exome sequencing; VAF, Variant allele frequency; SNV, single-nucleotide variant; TERT, telomerase reverse transcriptase; NF1, neurofibromin 1; ERBB2, erb-b2 receptor tyrosine kinase 2; CCT5, chaperonin containing TCP1 subunit 5; BCORL1, BCL6 corepressor-like 1; NPHP4, nephrocystin 4; PXDN, peroxidasin.
In this study, we established and authenticated SHG142, an IDH1-wildtype GBM cell line from a 70-year-old female patient, and demonstrate its stable propagation and representative aggressive phenotypes, together with first-pass 2D and organoid-based 3D drug-response profiling.
Immunohistochemistry analyses revealed that SHG142 preserves a classical GBM-like morphology and a marker profile typical of high-grade astrocytic tumors, with sustained expressions of Nestin, GFAP, S-100, Ki-67, MGMT, P53 and CD34 after long-term passaging [19]. This constellation of markers indicates an astrocytic lineage [20], high proliferative activity [21], preserved MGMT repair capacity and prominent microvascularization [22, 23], all of which are characteristic of clinically aggressive GBM. The close concordance between the immunophenotype of SHG142 and that of the original tumor supports the view that this cell line largely recapitulates key features of the parental lesion at the histopathological level. Notably, transcriptome-based GBM subtyping (e.g., classical, mesenchymal, or proneural) was not performed in the present study; RNA-seq–based profiling will be required for formal subtype assignment in future work.
In serum-free medium, SHG142 cells readily formed free-floating tumorspheres, from which a CD133-positive glioma stem-like cell (GSC) subpopulation was isolated by magnetic-activated cell sorting. These GSCs displayed pronounced plasticity: upon transfer to serum-containing conditions, tumorspheres adhered and differentiated rapidly, indicating multilineage potential. This behavior is consistent with the presence of functional tumor-initiating cells and provides an experimentally tractable system for studying GSC biology and therapeutic resistance. CD133-positive GSCs are associated with poor prognosis, enhanced self-renewal, increased DNA repair capacity and resistance to chemoradiotherapy [24, 25, 26], and additional markers such as Nestin and A2B5 further contribute to the cancer stem cell phenotype [27, 28]. The ability to prospectively enrich and expand a stem-like fraction from SHG142 therefore represents a key strength of this model.
In vivo, both adherent SHG142 cells and SHG142 GSCs formed tumors when they were implanted intracranially in immunocompromised mice. Notably, tumors derived from SHG142 GSCs were associated with a modest reduction in survival (median 25 vs. 31.5 days; log-rank p = 0.025), highlighting their malignant potential; however, the cohort size (n = 6 per group) limits the precision of this estimate (HR = 3.179, 95% CI 0.845–11.96), and larger cohorts are needed for validation. Histological analysis revealed that SHG142 xenografts expressed GBM markers, such as GFAP, Nestin, MGMT, Ki-67, P53, S-100 and CD34, at levels consistent with those of the patient’s original tumor. Beyond qualitative observations, we now provide a more rigorous description of the invasion phenotype by quantifying the invasion-positive rate, invasion depth, and percentage of infiltrated area in the SHG142 GSC–organoid coculture system. Consistent with this objective, we performed single-dose drug testing in the SHG142 organoid coculture model using baseline-normalized bioluminescence (Day 7/Day 0) as the readout. At reference concentrations informed by 2D IC50 profiling, all four agents significantly suppressed tumor-associated luminescence compared with vehicle. Importantly, these single-dose concentrations were selected as reference points to provide a first-pass comparative 3D readout and are not intended to represent organoid-specific IC50 values. More broadly, the SHG142 GSC–organoid platform offers a flexible framework to interrogate tumor–microenvironment interactions, model therapeutic response and resistance, and explore personalized drug screening paradigms. In future work, we plan to incorporate endothelial cells and microglia to generate partially vascularized, innate-immune–containing brain organoids, extend drug exposure to prolonged and repeated dosing with longitudinal bioluminescence monitoring to capture resistance and rebound growth dynamics, and compare invasion and growth behaviors across GSC spheres from different patient-derived or chip-enabled 3D workflows to support individualized drug-response profiling [29].
Karyotype analysis revealed pronounced chromosomal instability in SHG142, characterized by aneuploidy and numerous structural rearrangements. Both near-diploid and hyper/polyploid subpopulations were present, reflecting dynamic chromosomal reshuffling and clonal selection. The core clonal alterations included trisomy 7, monosomy 10, and recurrent losses of chromosomes 13 and 17, along with multiple translocations and deletions suggestive of genomic damage at key cancer-related loci [30]. Whole-exome sequencing revealed mutations in TERT, TP53, and NF1, and the retention of canonical driver events supports lineage continuity during in vitro propagation. TERT promoter mutations are known to generate de novo ETS transcription factor-binding sites, leading to aberrant reactivation of telomerase activity and enabling replicative immortality in tumor cells [31]. TERT promoter mutation, TP53 mutation and NF1 loss are frequent events in primary IDH1-wildtype GBM and together drive telomerase activation, defective genomic surveillance, hyperactive RAS signaling and PI3K/AKT pathway activation [32, 33]. Consistent with passaging-associated selection rather than complete genetic stasis, our concordance analysis between an early bulk primary culture (P2) and late-passage SHG142 (P50) demonstrated shared SNVs and correlated VAFs while also revealing locus-specific VAF shifts.
To mitigate culture-induced drift, we emphasize practical strategies to maintain clonal fidelity in patient-derived models. These include early biobanking of low-passage material, prioritizing low-passage cells for functional assays while using later passages mainly to demonstrate long-term stability, maintaining parallel culture states under serum-adherent and serum-free sphere conditions to reduce bias from any single environment, and periodic authentication/monitoring using STR profiling and targeted validation of key driver events. In addition, we minimize unnecessary selection pressure by avoiding extensive single-cell cloning or aggressive enrichment unless required by the experimental objective.
Stem-like subpopulations may contribute to clonal retention versus drift during serial passaging. GSC-like states, through self-renewal and tumor-initiating capacity, could plausibly serve as a reservoir that preferentially persists under culture stress and helps maintain tumor-propagating clones and key driver events. Conversely, sphere culture and CD133-based enrichment impose strong selection and may narrow heterogeneity by expanding specific clones while depleting others. Future multi-passage comparisons of bulk, sphere, and CD133-enriched fractions using multi-timepoint bulk sequencing and single-cell profiling, with clonal tracking where feasible, will be needed to resolve how these dynamics shape clonal architecture during propagation.
Taken together, the molecular, cytogenetic, and phenotypic features of SHG142 are consistent with those of clinically aggressive IDH1-wildtype glioblastoma and support its use as a well-validated experimental model rather than as a biologically distinct GBM subtype. The diagnosis of IDH1-wildtype glioblastoma for the original tumor is supported by negative IDH1 R132H staining, the absence of IDH1 mutations on exome sequencing and the presence of the canonical +7/–10, TERT-mutant background, in line with the 2021 WHO criteria. The combination of high Ki-67 expression, extensive chromosomal instability and TP53 mutation indicates unchecked proliferative drive and impaired genomic control [34], whereas the co-occurrence of IDH1-wildtype status, TERT promoter mutation and MGMT promoter unmethylation defines a high-risk molecular subgroup of glioblastoma that has the worst survival and only limited benefit from temozolomide-based chemoradiotherapy [35]. These converging alterations explain the aggressive behavior of the index tumor and underscore SHG142 as a representative and well-validated model of IDH1-wildtype GBM with high-risk molecular features.
We established SHG142, a novel IDH1-wildtype glioblastoma cell line that retains key morphological and molecular features of the index tumor and provides a stable, reproducible platform for GBM research. This cell line exhibits long-term stable proliferation and harbors a CD133-positive subpopulation with strong stem-like properties. It also demonstrated invasive growth in coculture with human brain organoids, effectively modeling tumor–microenvironment interactions. Together, these attributes make SHG142 a valuable platform for GBM biology research and for developing precise therapeutic strategies.
GBM, Glioblastoma Multiforme; GSCs, Glioma Stem-like Cells; WES, Whole-Exome Sequencing; CCK-8, Cell Counting Kit-8; STR, Short Tandem Repeat; H&E, Hematoxylin and Eosin; IHC, Immunohistochemistry; CIN, Chromosomal Instability; MRI, Magnetic Resonance Imaging; TMB, Tumor Mutational Burden; GFAP, Glial Fibrillary Acidic Protein; SOX2, SRY-Box Transcription Factor 2; CD133, Cluster of Differentiation 133; A2B5, Ganglioside Antigen A2B5; MGMT, O6-methylguanine-DNA methyltransferase; P53, Tumor Protein 53; RTK, Receptor Tyrosine Kinase; PI3K, Phosphoinositide 3-Kinase; AKT, AKT Serine/Threonine Kinase; RB, Retinoblastoma Protein; hESC, Human Embryonic Stem Cell.
The whole-exome sequencing (WES) data generated in this study have been deposited in the NCBI Sequence Read Archive (SRA) under BioProject accession number PRJNA1289785 (https://www.ncbi.nlm.nih.gov/bioproject/PRJNA1289785) and will be publicly available upon publication. All other data supporting the findings of this study are included within the article, or are available from the corresponding author upon reasonable request.
Conceptualization, YXZ and HYG; methodology, HW and LY; experiments, HYG, LYT, GZZ and XZ; visualization, XYW; data analysis, JLQ; writing—original draft preparation, HYG; writing—review and editing, JLQ and YXZ; All authors read and approved the final manuscript. All authors contributed to editorial changes in the manuscript. All authors have participated sufficiently in the work and agreed to be accountable for all aspects of the work.
The study involving human samples was conducted in accordance with the Declaration of Helsinki and was approved by the Ethics Committee of Soochow University, with specimen collection approved in advance under Approval No. SUDA20221206H03 (2022) and the expanded scope of the current project approved under protocol code SUDA20240913H04 (approved on September 2024), including the establishment of organoid models and related procedures. Written informed consent was obtained from the patient prior to tissue collection. The animal study protocol was approved by the Ethics Committee of Soochow University (protocol code SUDA20240913A03, approved on September 12, 2024). All animal experiments were conducted in accordance with institutional guidelines and relevant national regulations, and are reported in accordance with the ARRIVE guidelines.
The authors acknowledge Metware Biotechnology Co., Ltd. (Wuhan, China) for their professional technical support and services in whole-exome sequencing experiments.
This research was funded by the National Natural Science Foundation of China, grant number 82473495.
The authors declare no conflict of interest. Metware Biotechnology Co., Ltd. (Wuhan, China) provided technical support for whole-exome sequencing; the company had no role in study design, data analysis, manuscript preparation, or the decision to publish.
Supplementary material associated with this article can be found, in the online version, at https://doi.org/10.31083/FBL49045.
References
Publisher’s Note: IMR Press stays neutral with regard to jurisdictional claims in published maps and institutional affiliations.