


 , Hanchao Gao 1,†, Zhennan Liao 2, Zixi Chen 1, Zhuoheng Song 1, Wenjun Xiong 3, Yong Dai 4, Weilong Li 1,*
 , Shaodong Luan 1,*
1 Department of Nephrology, Shenzhen Longhua District Central Hospital, The Affiliated Longhua Hospital of Shenzhen University, Shenzhen Longhua District Key Laboratory for Diagnosis and Treatment of Chronic Kidney Disease, 518110 Shenzhen, Guangdong, China
2 Department of Nephrology, The First Affiliated Hospital of Jinan University, 510630 Guangzhou, Guangdong, China
3 Clinical Medical Research Center, The Second Clinical Medical College of Jinan University, Shenzhen People’s Hospital, 518020 Shenzhen, Guangdong, China
4 Future Medicine Center, Shenzhen University of Advanced Technology, 518107 Shenzhen, Guangdong, China
†These authors contributed equally.
Abstract
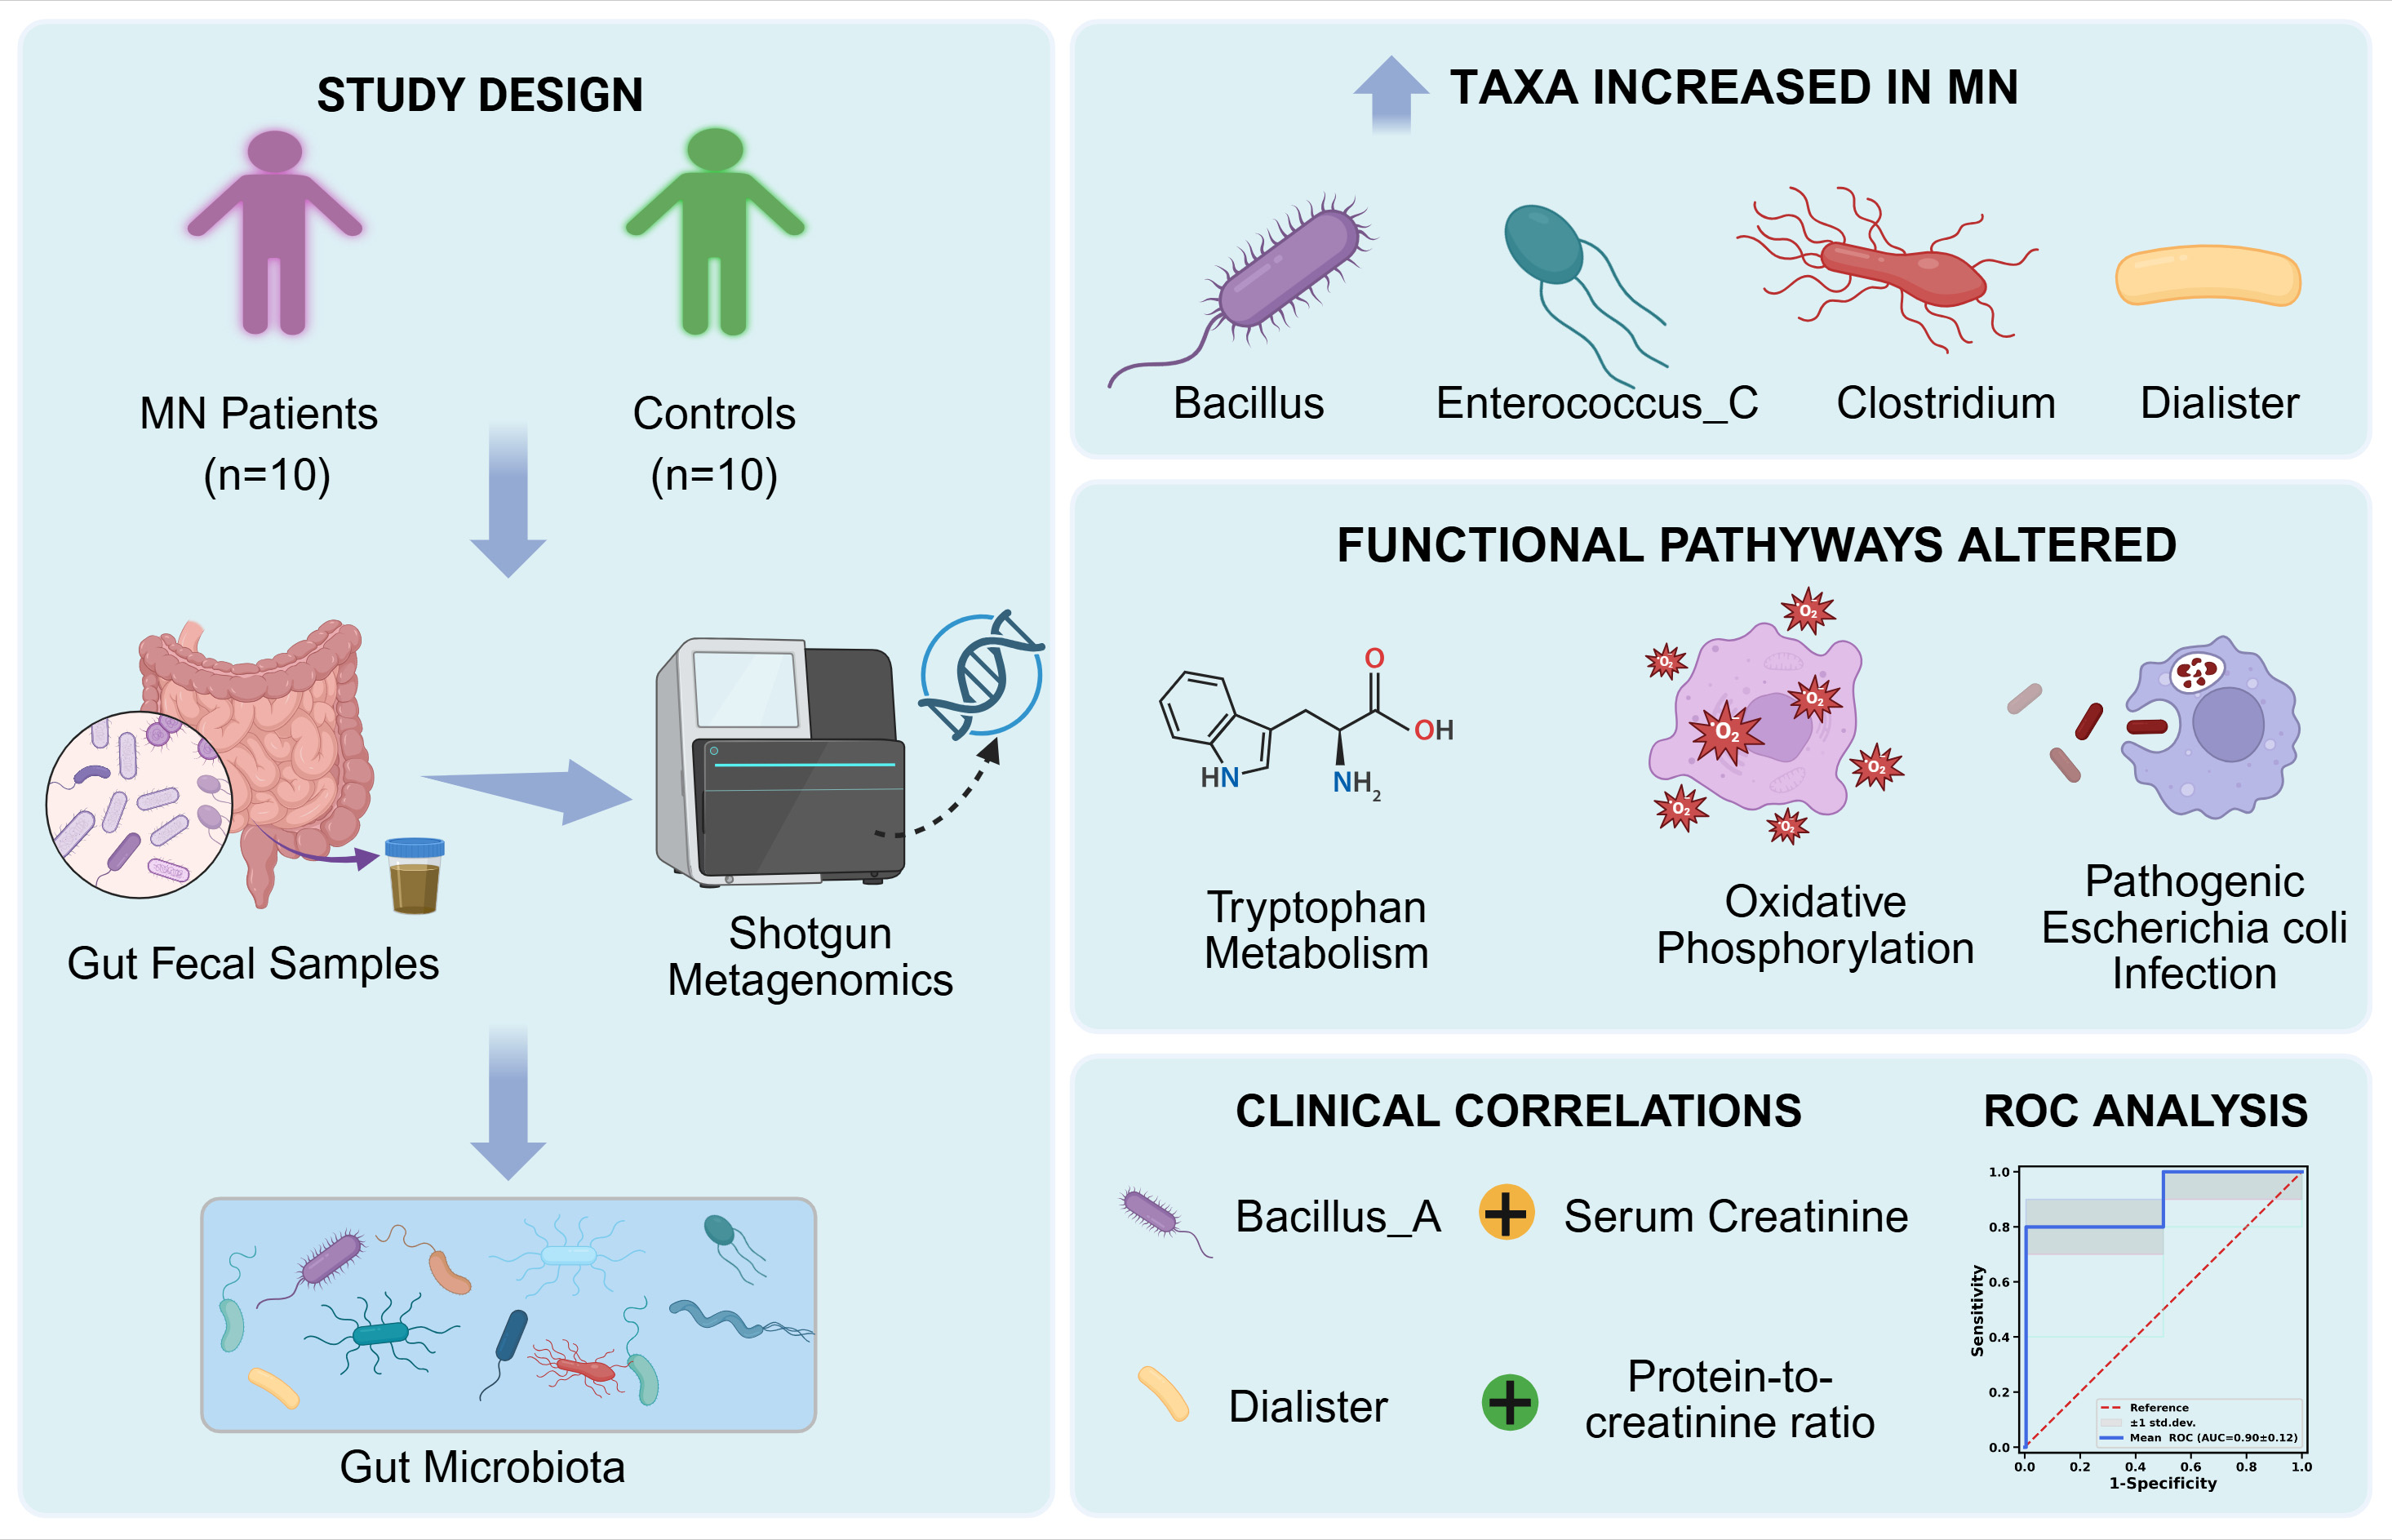
Membranous nephropathy (MN) is one of the most common forms of primary glomerulonephritis worldwide and is closely associated with immune dysregulation. Increasing evidence suggests that the gut microbiota plays a critical role in regulating renal disease through the gut–renal axis. However, the use of metagenomic sequencing to analyze changes in the gut microbiota in patients with MN has not yet been reported.
This study employed a metagenomic approach to comprehensively analyze the gut microbiota in patients with MN (n = 10) and normal controls (NCs; n = 10). Shotgun metagenomic sequencing was performed on fecal samples. Microbial diversity, taxonomic composition, and functional pathways were assessed, followed by Kyoto Encyclopedia of Genes and Genomes (KEGG) enrichment analyses. In addition, correlations between gut microbial characteristics and clinical indicators were also evaluated.
The gut microbial community in the MN group showed distinct differences from the control group, particularly with an increased abundance in phylum: Proteobacteria, Firmicutes_C, and Cyanobacteria; the genera Dialister, Selenomonadales, Clostridium, Bacillus, Megamonas, Romboutsia, and Inesitibacter; the species Bilophila_wadsworthia, Enterococcus_C, Megamonas funiformis, and Clostridium_perfringens. Furthermore, Bacillus_A showed a significant positive correlation with both serum creatinine and the protein-to-creatinine ratio. Conversely, higher levels of Victivallis were associated with lower blood urea nitrogen, while increased Fusicatenibacter was correlated with lower phospholipase A2 receptor levels. KEGG analysis indicated that the MN gut microbiota was enriched for pathways related to tryptophan metabolism, oxidative phosphorylation, and pathogenic Escherichia coli infection. Additionally, receiver operating characteristic analysis revealed that a four-genus model comprising enriched Dialister, Enterococcus_C, and Clostridium_P, and reduced Fusicatenibacter yielded an area under the curve of 0.90 ± 0.12, suggesting promising discriminatory potential that warrants further validation.
These findings demonstrate alterations in the composition and functional potential of the gut microbiota in patients with MN compared with the control group. Given the cross-sectional design of this study, these observations should be interpreted as associative, and further studies are required to validate these findings and explore any associated biological relevance.
Graphical Abstract
Keywords
- glomerulonephritis, membranous
- metagenomics
- gastrointestinal microbiome
- oxidative phosphorylation
- tryptophan metabolism
Immune-mediated kidney diseases, particularly membranous nephropathy (MN), have emerged as a major global health challenge [1, 2]. These conditions not only impact patients’ quality of life but can also lead to end-stage renal disease and renal failure. The main pathological features of MN include deposition of immune complexes in the glomerular basement membrane, with 70% to 80% of cases exhibiting autoantibodies against the phospholipase A2-receptor (PLA2R) [2, 3]. Immunosuppressive therapies that are most often employed clinically have demonstrated partial effectiveness in delaying the disease; however, they are frequently not sufficient to prevent renal damage and deterioration of renal function. The etiology of MN remains unclear and may be associated with environmental factors [4], genetic predisposition [5], or autoimmunity [6, 7].
The gut microbiota is a complex community of microorganisms living in the human gut, consistings of beneficial bacteria, neutral bacteria, and harmful bacteria. The gut microbiota is a multifaceted microecosystem that forms a symbiotic relationship with the host, establishing a complex ecological network that supports homeostasis [8, 9]. It is becoming increasingly evident that the gut microbiota is closely linked to the pathogenesis of numerous diseases, including inflammatory conditions, obesity [10], diabetes [11], and Parkinson’s disease [12]. Research has confirmed that the gut microbiota coordinates systemic immune and metabolic homeostasis by promoting chronic inflammatory responses, regulating microbial metabolic activity, and altering the intestinal microenvironment [13, 14, 15, 16].
A clinical study found that patients with MN often exhibit alterations in the structure of their gut microbiota [17]. Additionally, specific changes in the gut microbiota composition of patients with MN may promote the formation of anti-PLA2R antibodies through immune mechanisms such as epitope spreading or self-antigen modification [18]. Nevertheless, current research mainly uses 16S ribosomal RNA (rRNA) sequencing technology to investigate gut microbiota composition, which primarily provides taxonomic data but lacks the ability to analyze community function and detailed metabolic activities. Li et al. [19] employed 16S rRNA sequencing to compare gut microbiome differences between MN and other chronic kidney disease (CKD) subtypes. However, its taxonomic resolution is largely limited to the genus/family level, and functional profiling mainly relies on indirect inference rather than direct gene- and pathway-level annotation, thereby restricting the detection of species/strain signatures and the systematic characterization of MN-related functional pathway shifts.
By contrast, shotgun metagenomic sequencing enables species- and strain-level profiling and provides a gene-resolved view of microbial functional capacity through the direct annotation of microbial genes, pathways, and metabolic modules [20]. This higher-resolution framework facilitates the identification of MN-associated taxa together with their functional repertoires (e.g., pathways related to amino acid metabolism, energy metabolism, and pathogen-associated functions) and supports integrative analyses linking microbial features to clinical phenotypes. Moreover, metagenomics can capture clinically relevant genetic elements such as virulence factors and antibiotic resistance genes that are inaccessible to 16S rRNA gene sequencing approaches [21], thereby offering a more mechanistically informative characterization of MN-associated gut microbiome alterations beyond prior 16S rRNA sequencing-based studies.
This research utilized metagenomic technology to analyze the gut microbiome in patients with MN to better understand its functional role and possible mechanisms in disease progression. These findings may provide potential insights for the diagnosis and treatment of MN and support the development of therapeutic strategies targeting the microbiome.
This research was approved by the ethics committee of Shenzhen Longhua District Central Hospital (Approval No. 2025-108-01) and was carried out in accordance with the principles of the Declaration of Helsinki (1975). Ten patients with MN and ten normal controls (NCs) were recruited at the Department of Nephrology of Shenzhen Longhua District Central Hospital (Shenzhen, China). The participants were chosen as follows: (1) confirmed MN via renal tissue biopsy; (2) age 18 to 70 years old; (3) no use of antibiotics, steroids, immunosuppressants, or probiotics, and no ingestion of foods with active bacterial components within the last month; (4) no recent severe infection, such as fever, respiratory or gastrointestinal infection; and (5) provision of voluntary written informed consent. Exclusion criteria included: age less than 18 years or older than 70 years; secondary kidney diseases (e.g., diabetic nephropathy, systemic lupus erythematosus nephritis, acute cardiovascular or cerebrovascular disease, allergic purpura nephritis) or severe illness; pregnancy/lactation; and endoscopic procedures (gastroscopy or colonoscopy) in the past 3 months.
This study collected baseline demographic data from the participants, including age, sex, height, weight, smoking history, and alcohol consumption history. Laboratory investigations included 24-h urine protein quantification, red blood cell count, serum creatinine (CR), blood urea nitrogen (BUN), C-reactive protein (CRP), and random urine protein/CR ratio. For patients with MN, fecal specimens were obtained within 72 h after renal biopsy, with each sample weighing at least 8 g and placed in a sterile, dry stool container. Fecal samples from the normal controls were similarly collected within 3 days of their physical examination and were immediately transferred to –80 °C for long-term storage.
Genomic DNA was extracted from the fecal samples using the cetyltrimethylammonium bromide (CTAB) method. Samples were first homogenized in a CTAB extraction buffer (2% CTAB, 100 mM Tris-HCl, 20 mM Ethylenediaminetetraacetic acid (EDTA), and 1.4 M NaCl), followed by proteinase K (Aladdin, Shanghai, China) treatment to digest proteins and cellular debris. After incubation at 65 °C, the mixture was treated with chloroform-isoamyl alcohol to isolate the DNA-containing aqueous phase. DNA was then precipitated from this phase using isopropanol and recovered by centrifugation. To eliminate impurities, the DNA pellet underwent a 70% ethanol wash. The purified DNA was finally resuspended in nuclease-free water, quantified, and assessed for purity via Nanodrop, and checked for integrity on an agarose gel, confirming no notable degradation before storage at –80 °C.
Genomic DNA was fragmented using ultrasonic shearing to generate DNA fragments of appropriate sizes. Fragments ranging from 200 to 400 base pairs (bp) were precisely selected via magnetic bead-based size selection to optimize library preparation. In the end-repair and A-tailing steps, reaction systems were carefully formulated to repair DNA termini and add adenine (A) overhangs to the 3′ ends, facilitating adapter ligation. Adapter ligation was subsequently performed to attach sequencing adapters to the DNA fragments. The ligated products were amplified by Polymerase Chain Reaction (PCR) and purified using magnetic beads to ensure library quality.
For final library preparation, the PCR products were denatured into single-stranded DNA, followed by circularization to generate single-stranded circular DNA molecules, with removal of unligated linear DNA. These circularized templates were then subjected to rolling circle replication and combinatorial probe anchor synthesis sequencing technology. During this process, single-stranded circular DNA was amplified into DNA nanoballs and loaded onto high-density nanochips. This workflow significantly enhanced sequencing throughput and accuracy, completing the metagenomic library construction and sequencing pipeline.
Raw sequencing data underwent stringent quality control (SOAPnuke v1.5.0, BGI, Shenzhen, Guangdong, China, https://github.com/BGI-flexlab/SOAPnuke) to
generate high-quality clean data by removing reads with
The correlations between clinical biochemical parameters and various microbial taxa were assessed using Spearman’s rank correlation coefficient and visualized as a heatmap in R (v4.4.2; https://www.r-project.org/) with the pheatmap package. To identify microbial biomarkers capable of distinguishing patients with MN from normal controls, we first applied the Wilcoxon rank-sum test to select taxa with significant abundance differences. The diagnostic utility of these candidate biomarkers was then rigorously evaluated by performing receiver operating characteristic (ROC) curve analysis using Python (v3.10.12; https://www.python.org/).
This study enrolled 20 participants, comprising 10 patients with biopsy-confirmed membranous nephropathy (MN) and 10 normal controls (NCs). All patients were diagnosed with MN based on the biopsy results. We conducted a comparative analysis of the data between the MN and NC groups (Table 1). The two groups were well-matched in age and sex distribution, and all participants were non-smokers and non-drinkers. However, the MN group had a significantly higher body mass index (BMI), systolic blood pressure (SBP), diastolic blood pressure (DBP), creatinine levels (CR), and blood urea nitrogen (BUN) levels compared to the NC group.
| Characteristics | MN | NC | p-value | |
| Age (y) | 41.20 |
36.40 |
p | |
| Smoking [n (%)] | 0 (0%) | 0 (0%) | - | |
| Drinking [n (%)] | 0 (0%) | 0 (0%) | - | |
| Sex | p | |||
| Male [n (%)] | 7 (70%) | 6 (60%) | - | |
| Female [n (%)] | 3 (30%) | 4 (40%) | - | |
| BMI (kg/m2) | 25.46 |
22.01 |
p | |
| SBP (mmHg) | 133.50 |
110.80 |
p | |
| DBP (mmHg) | 87.80 |
70.30 |
p | |
| CR (µmol/L) | 97.10 |
73.30 |
p | |
| BUN (mmol/L) | 5.11 |
3.57 |
p | |
MN, membranous nephropathy; NC, normal control; BMI, body mass index; SBP, systolic blood pressure; DBP, diastolic blood pressure; CR, creatinine; BUN, blood urea nitrogen.
In our study, we performed metagenomic sequencing on fecal samples collected from patients with MN and NC to investigate the difference in gut microbial communities. As shown in Table 2, each fecal sample produced about 68–76 million raw reads. After quality filtering, 85.85–97.77% of reads were retained as clean reads, with an average clean data rate of 95.11%. The Q30 values ranged from 87.49% to 91.66%, indicating high sequencing accuracy suitable for downstream analyses. Rarefaction curves at the species level indicated that the dataset was sufficiently large and reliable (Fig. 1).
| Sample name | Raw reads | Clean reads | Clean data rate (%) | Q30 (%) |
| NC_1 | 68,800,000 | 66,913,574 | 97.26 | 87.90 |
| NC_2 | 69,440,000 | 67,176,342 | 96.74 | 88.08 |
| NC_3 | 69,760,000 | 67,273,456 | 96.44 | 91.66 |
| NC_4 | 75,520,000 | 67,016,176 | 88.74 | 89.57 |
| NC_5 | 68,640,000 | 67,111,284 | 97.77 | 87.49 |
| NC_6 | 68,480,000 | 66,898,090 | 97.69 | 88.06 |
| NC_7 | 68,800,000 | 67,072,716 | 97.49 | 87.98 |
| NC_8 | 68,269,958 | 66,538,652 | 97.46 | 87.77 |
| NC_9 | 75,840,000 | 66,784,750 | 88.06 | 89.80 |
| NC_10 | 68,800,000 | 66,889,992 | 97.22 | 88.25 |
| MN_1 | 77,920,000 | 66,890,438 | 85.85 | 91.63 |
| MN_2 | 69,760,000 | 66,918,788 | 95.93 | 89.99 |
| MN_3 | 69,680,000 | 66,795,586 | 95.86 | 90.33 |
| MN_4 | 69,760,000 | 66,919,152 | 95.93 | 90.05 |
| MN_5 | 69,760,000 | 66,945,760 | 95.97 | 90.95 |
| MN_6 | 70,480,000 | 66,811,778 | 94.80 | 90.61 |
| MN_7 | 70,240,000 | 67,013,630 | 95.41 | 90.48 |
| MN_8 | 69,920,000 | 66,994,836 | 95.82 | 90.15 |
| MN_9 | 69,600,000 | 66,979,054 | 96.23 | 90.35 |
| MN_10 | 69,920,000 | 66,835,418 | 95.59 | 90.47 |
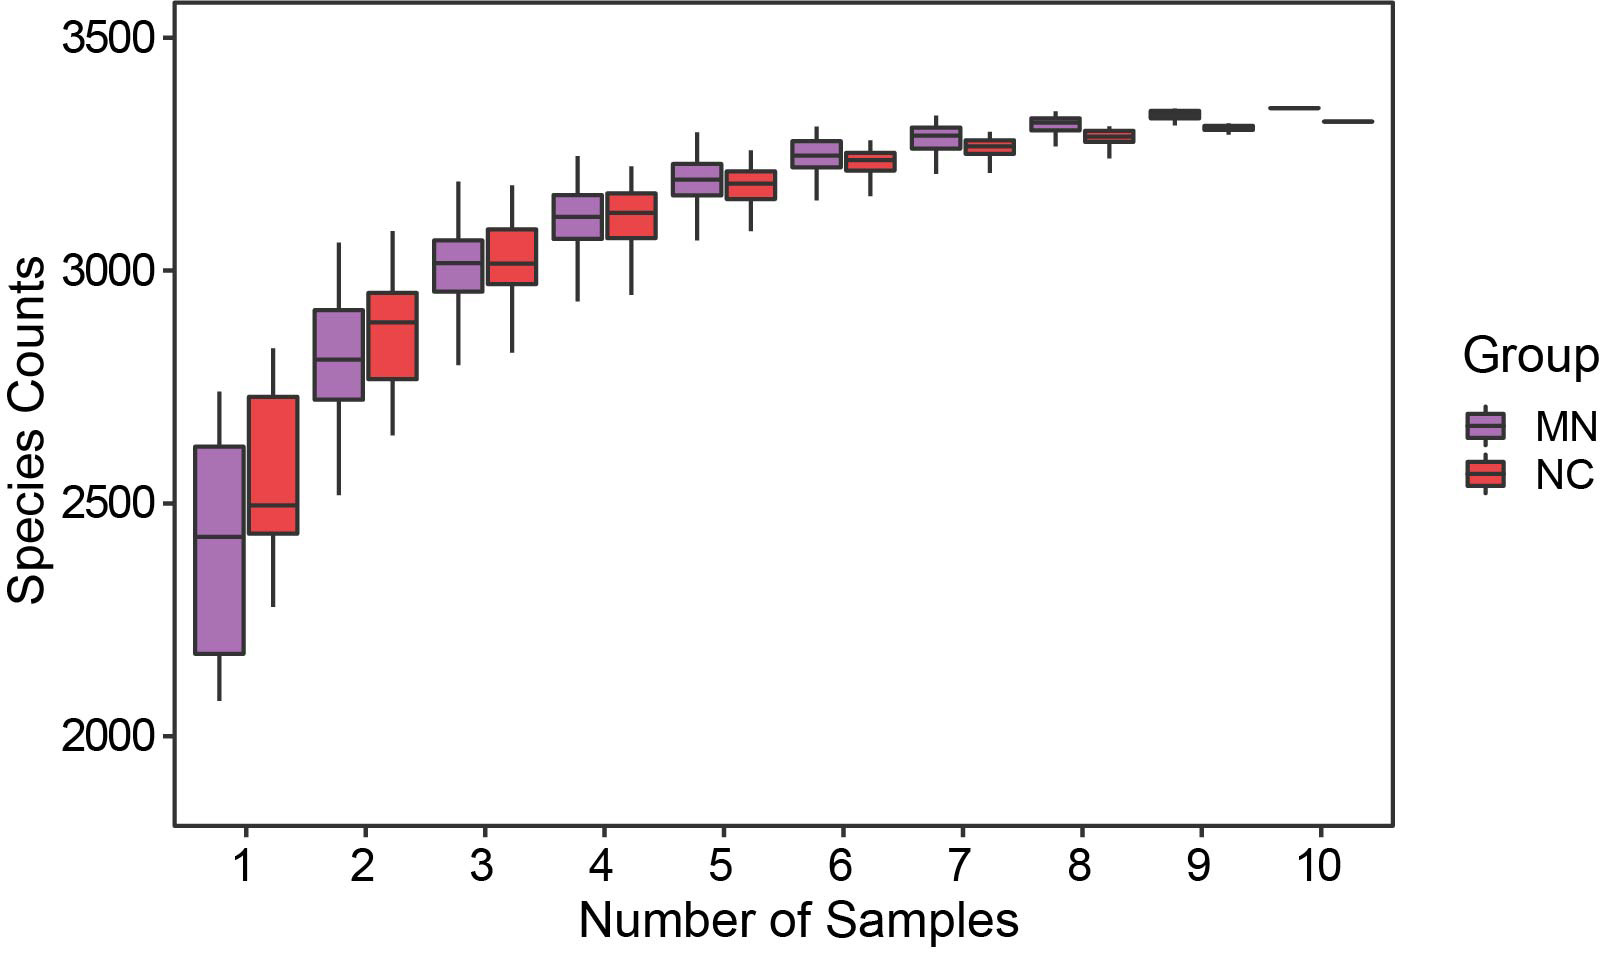 Fig. 1.
Species richness rarefaction curves for the MN and NC groups, showing the relationship between sequencing sample size and observed species counts.
Subsequently, alpha-diversity analysis was performed to assess community
diversity between the MN and NC groups. As shown in Fig. 2A, the Chao1 index was
significantly lower in the MN group than in the NC group (Wilcoxon, p =
0.037), whereas the Simpson and Shannon indices showed no significant differences
between the two groups (p
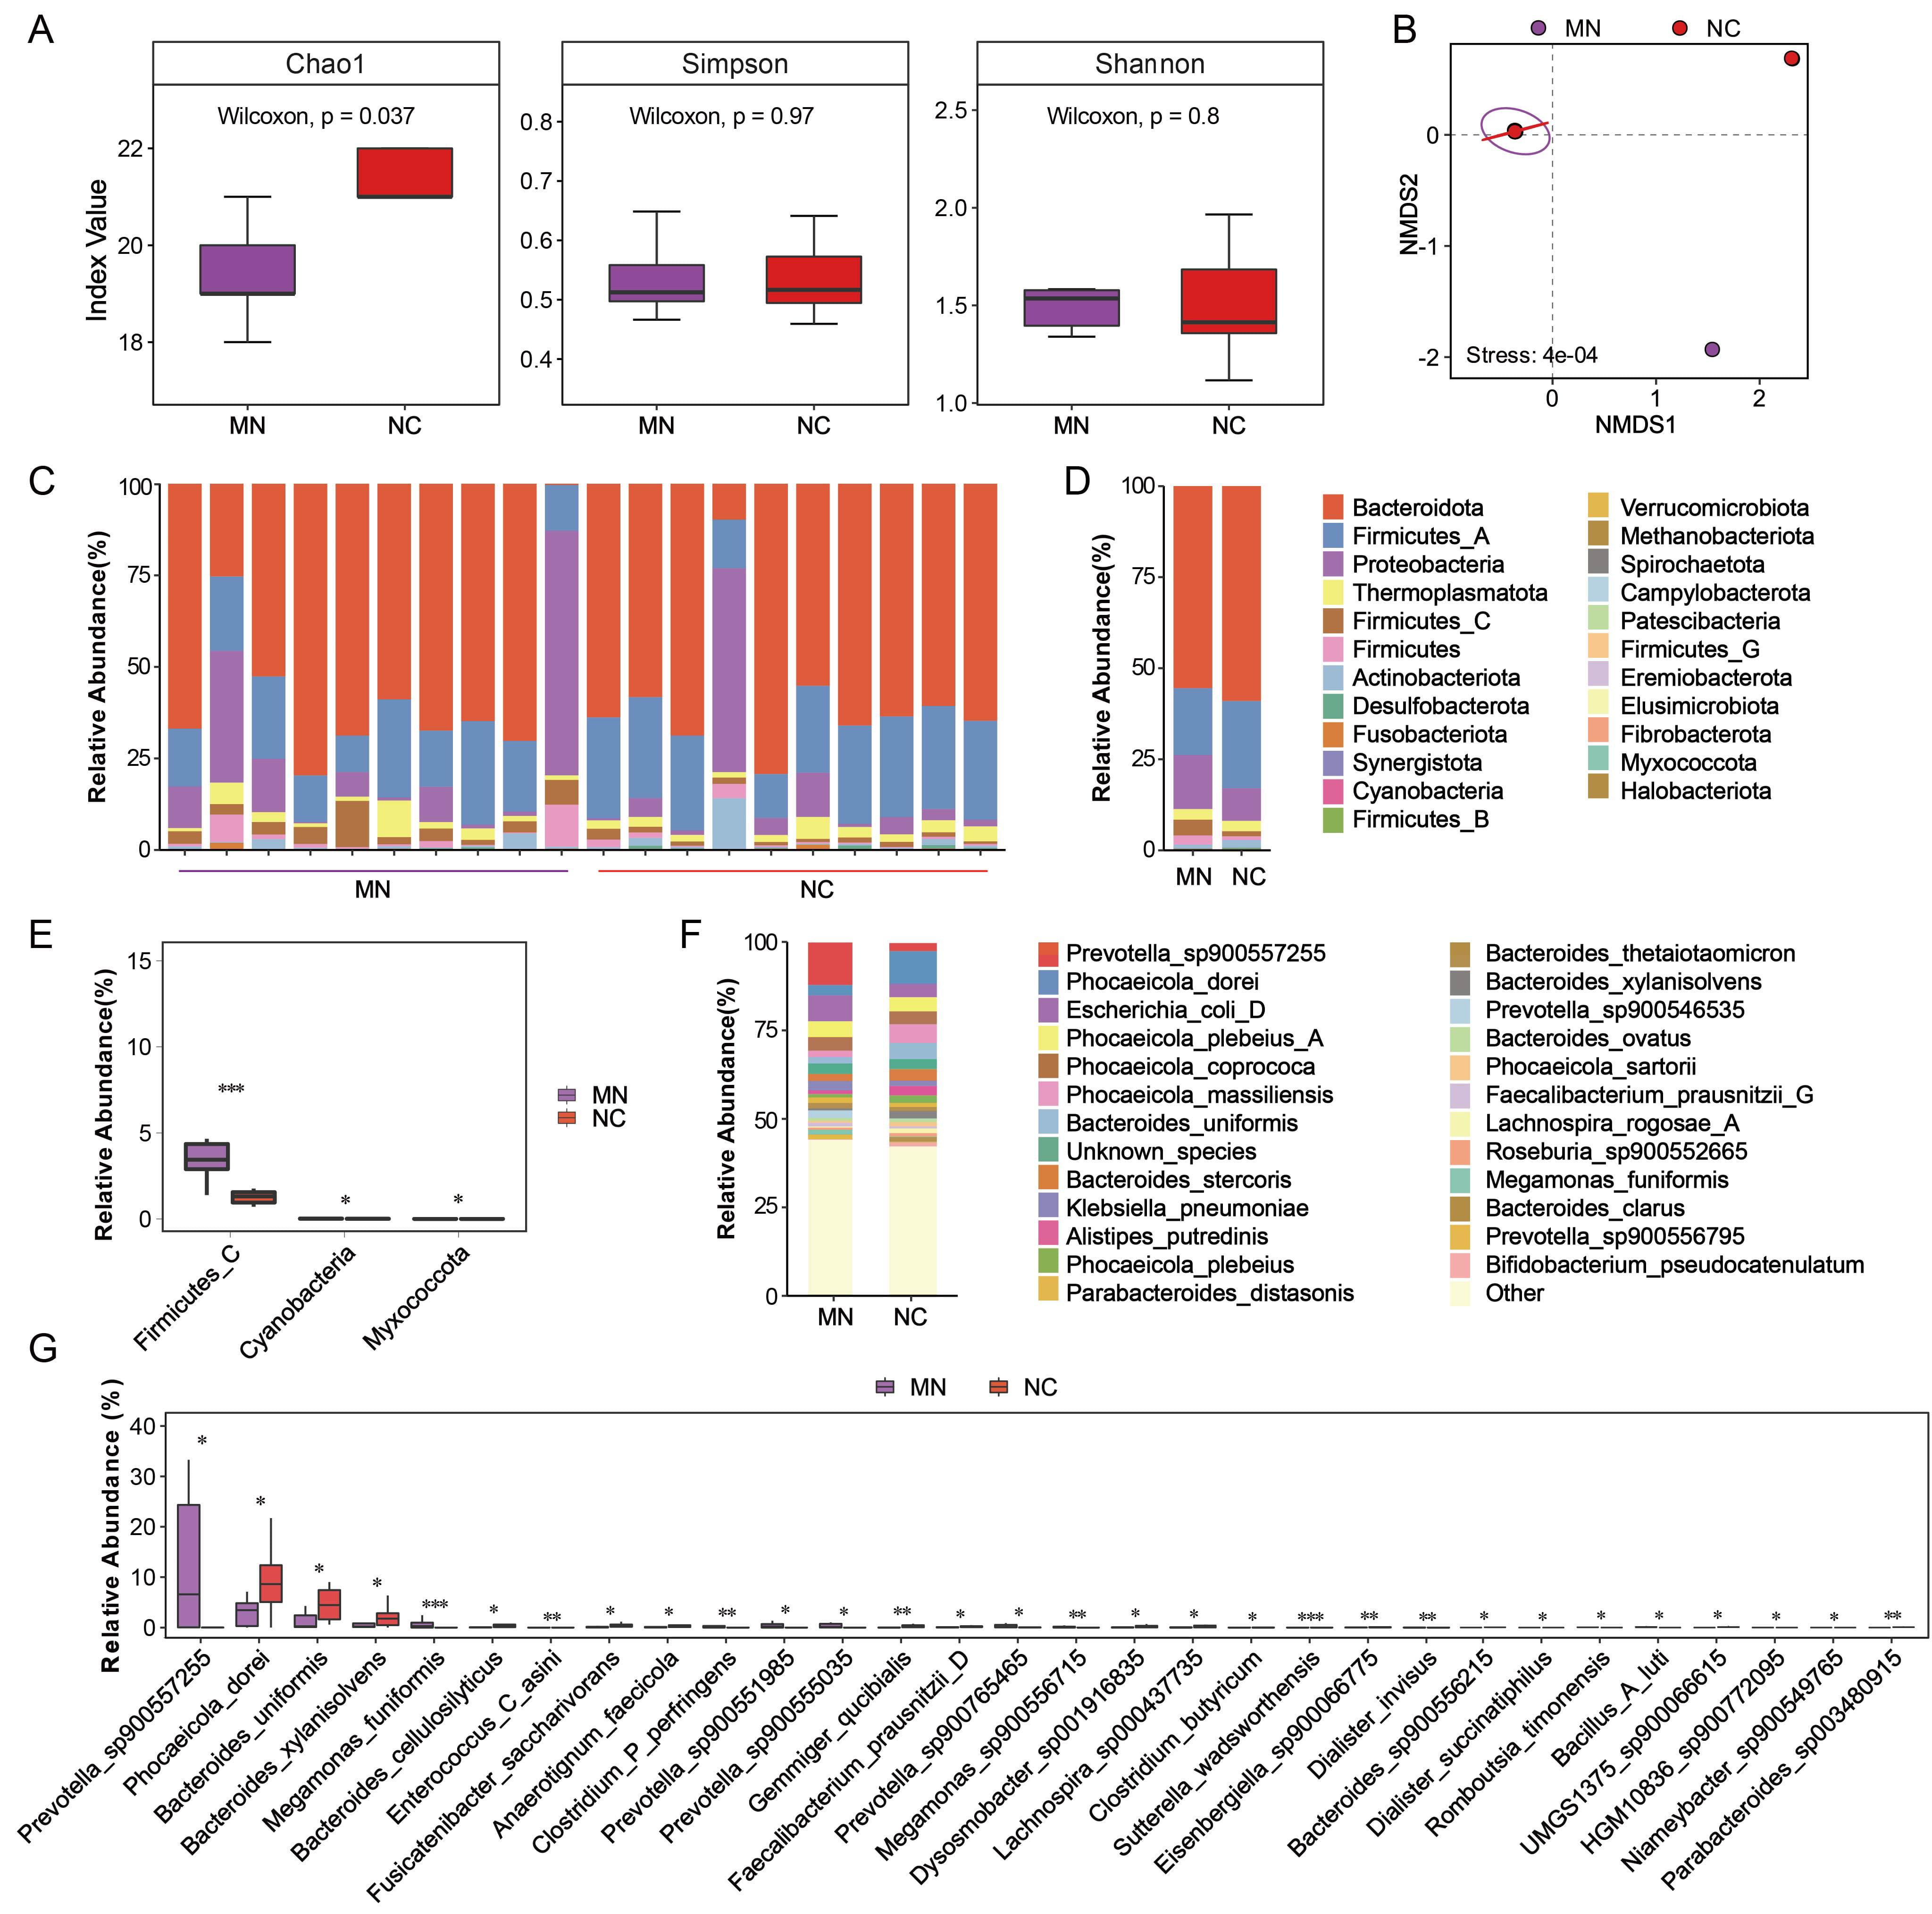 Fig. 2.
Differences in gut microbial diversity and composition between
the MN and NC groups. (A) Boxplots showing alpha diversity indices (Chao1,
Simpson, and Shannon) in the MN, and NC groups. (B) Non-metric multidimensional
scaling plot based on Bray-Curtis dissimilarity depicting beta diversity between
the two groups. (C) Relative abundance of major bacterial phyla in each sample.
(D) Average relative abundance of dominant bacterial phyla in the MN and NC
groups. (E) Differentially abundant phyla between groups identified by the
Wilcoxon rank-sum test. (F) Relative abundance of the top 20 most abundant
bacterial species in the MN and NC groups. (G) Differentially abundant species
between the MN and NC groups were identified using the Wilcoxon rank-sum test.
*p
To further investigate the differences in microbial composition, we analyzed the
relative abundance of bacterial taxa at the phylum level (Fig. 2C,D). Across most
of the samples, Bacteroidota and Firmicutes_A were the
dominant phyla, followed by Proteobacteria. The relative abundance of
Proteobacteria (14.83% vs. 8.98%) and Firmicutes_C (4.35%
vs. 1.39%) was higher in the MN group than in the NC group, whereas the relative
abundance of Bacteroidetes (55.49% vs. 59.01%) and
Firmicutes_A (18.36% vs. 23.95%) was lower in the MN groups compared
to the NC group. Non-parametric statistical testing (Wilcoxon test) was
subsequently applied to identify phyla with significant differences between the
two groups (Fig. 2E). Firmicutes_C (4.35% vs. 1.39%) and Cyanobacteria (0.025% vs. 0.006%) were significantly enriched in the MN group
(p
We next profiled the microbiota at the species level, As shown in Fig. 2F,
Prevotella_sp900557255 (11.99% vs. 2.27%),
Escherichia_coli_D (7.33% vs. 3.77%), and
Klebsiella_pneumoniae (2.69% vs. 1.47%) were more abundant in the MN
group, whereas Phocaeicola_dorei (2.94% vs. 9.26%),
Phocaeicola_massiliensis (1.79% vs. 5.26%),
Bacteroides_uniformis (1.86% vs. 4.57%), and
Alistipes_putredinis (1.03% vs. 2.69%) showed reduced abundance
compared with the NC group. Subsequently, statistical significance analysis was
performed on the differential species to identify those with significant changes.
A total of several taxa exhibited significant changes in relative abundance
between the MN and NC groups (Fig. 2G). Prevotella_sp900557255 was
markedly enriched in the MN group, while Phocaeicola_dorei,
Bacteroides_uniformis, and Bacteroides_xylanisolvens were
significantly decreased (p
To explore the potential functional alterations associated with microbial dysbiosis in patients with MN, functional profiling based on KEGG pathway annotation was performed. Principal coordinate analysis (PCoA) of predicted microbial functions revealed a clear separation trend between the MN and NC groups (Fig. 3A), indicating distinct functional patterns of the gut microbiota. Analysis of similarities (ANOSIM) analysis further confirmed a statistically significant difference between the two groups (R = 0.118, p = 0.043) (Fig. 3B).
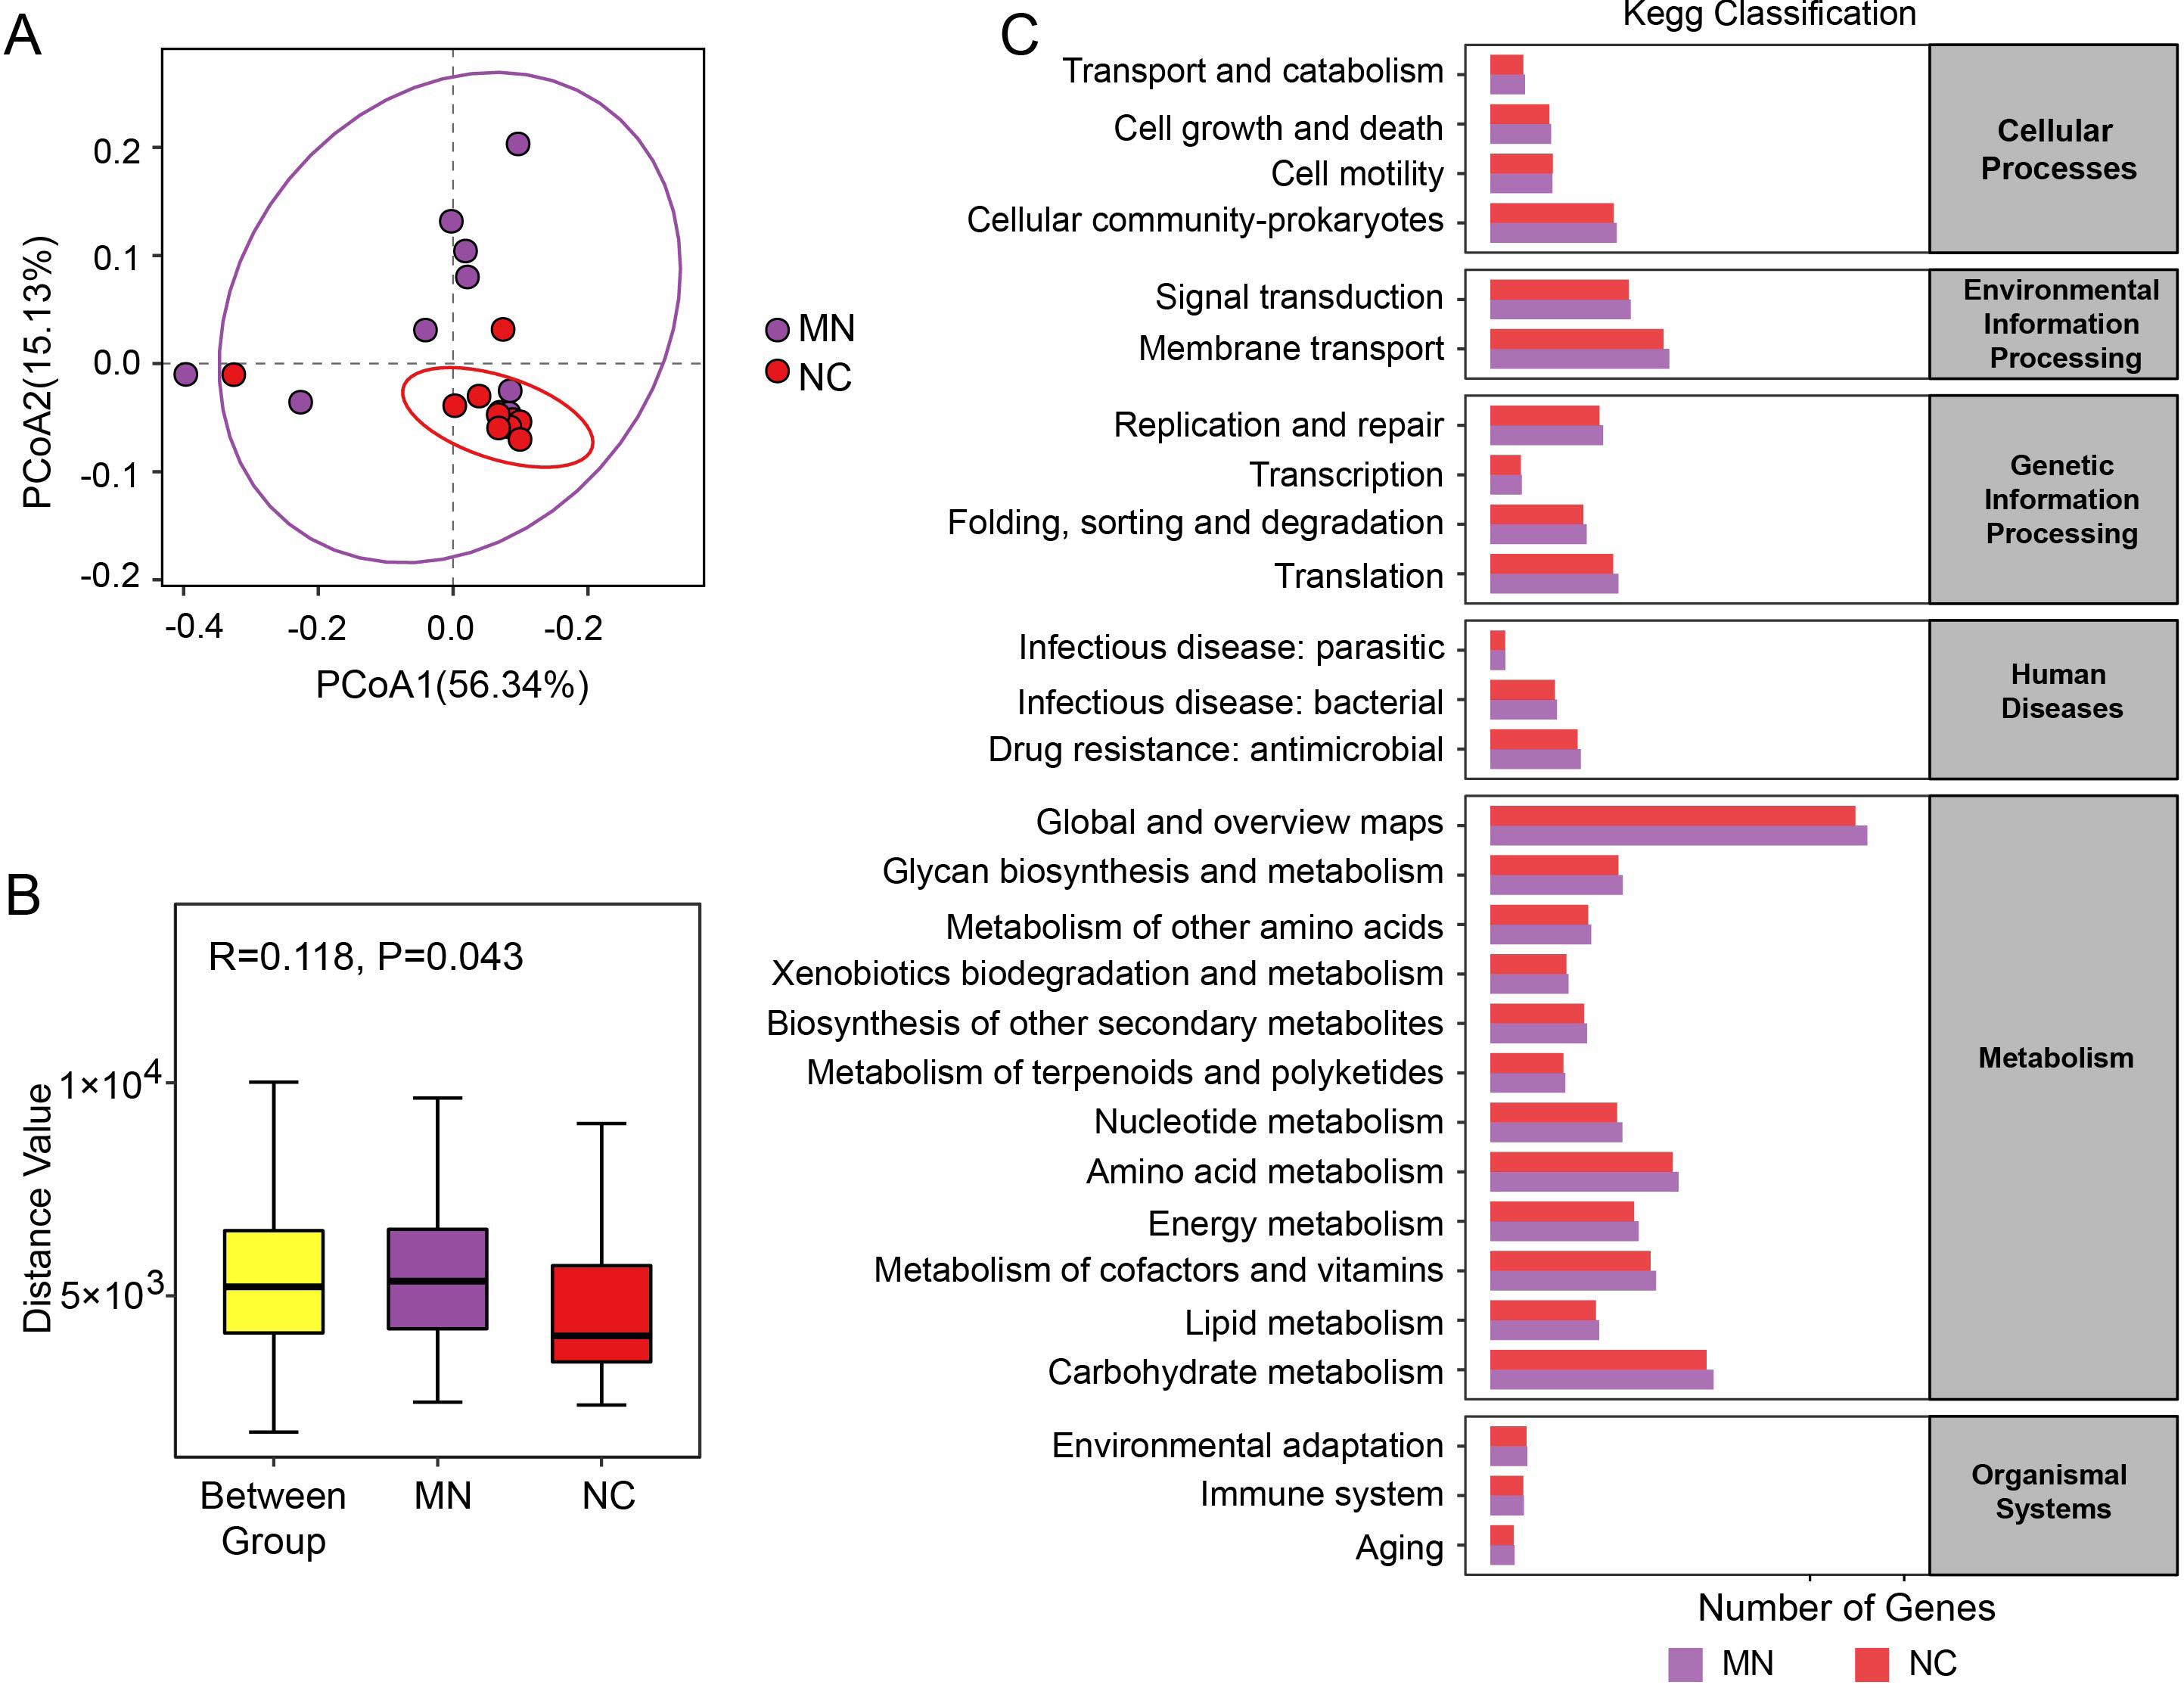 Fig. 3.
Functional differences of gut microbiota between the MN and NC groups. (A) Principal coordinate analysis (PCoA) based on Bray-Curtis distances illustrating the overall differences in metagenomic functional profiles between the MN and NC groups. (B) Analysis of similarities (ANOSIM) showing the variation in microbial functional composition among and within groups. (C) Kyoto Encyclopedia of Genes and Genomes (KEGG) functional classification of predicted microbial pathways across categories including metabolism, genetic information processing, environmental information processing, cellular processes, human diseases, and organismal systems.
As shown in the KEGG classification (Fig. 3C), microbial functions were predominantly enriched in metabolism-related pathways, including carbohydrate metabolism, amino acid metabolism, lipid metabolism, and energy metabolism. In addition to metabolic pathways, functional categories related to cellular processes (e.g., transport and catabolism, cell growth and death, and cell motility) and environmental information processing (e.g., membrane transport and signal transduction) were also detected. Pathways involved in genetic information processing, such as replication and repair, transcription, and translation, were present as well. Moreover, a small proportion of pathways were associated with human diseases (e.g., bacterial and parasitic infections, antimicrobial resistance) and organismal systems (e.g., environmental adaptation and immune system functions).
To further explore functional alterations of the gut microbiota between the MN and NC groups, KEGG pathway enrichment analysis was performed to identify significantly enriched pathways. As shown in Fig. 4, the MN group exhibited enrichment in pathways associated with bacterial pathogenicity and redox metabolism, such as Enterohemorrhagic E. coli/Enteropathogenic E. coli (EHEC/EPEC) pathogenicity signature, reduced nicotinamide adenine dinucleotide (NADH): quinone oxidoreductase (prokaryotes), Nicotinamide adenine dinucleotide (NAD) biosynthesis, anthranilate degradation, and cytochrome c oxidase. Notably, tryptophan metabolism was also enriched in the MN group, representing a key pathway involved in immune modulation and host-microbe interactions. By contrast, the NC group was enriched in pathways related to amino acid and cofactor metabolism, such as leucine degradation, pyrimidine degradation, heme biosynthesis (bacteria), phylloquinone (vitamin K1) biosynthesis, methionine salvage pathway, and trans-cinnamate degradation.
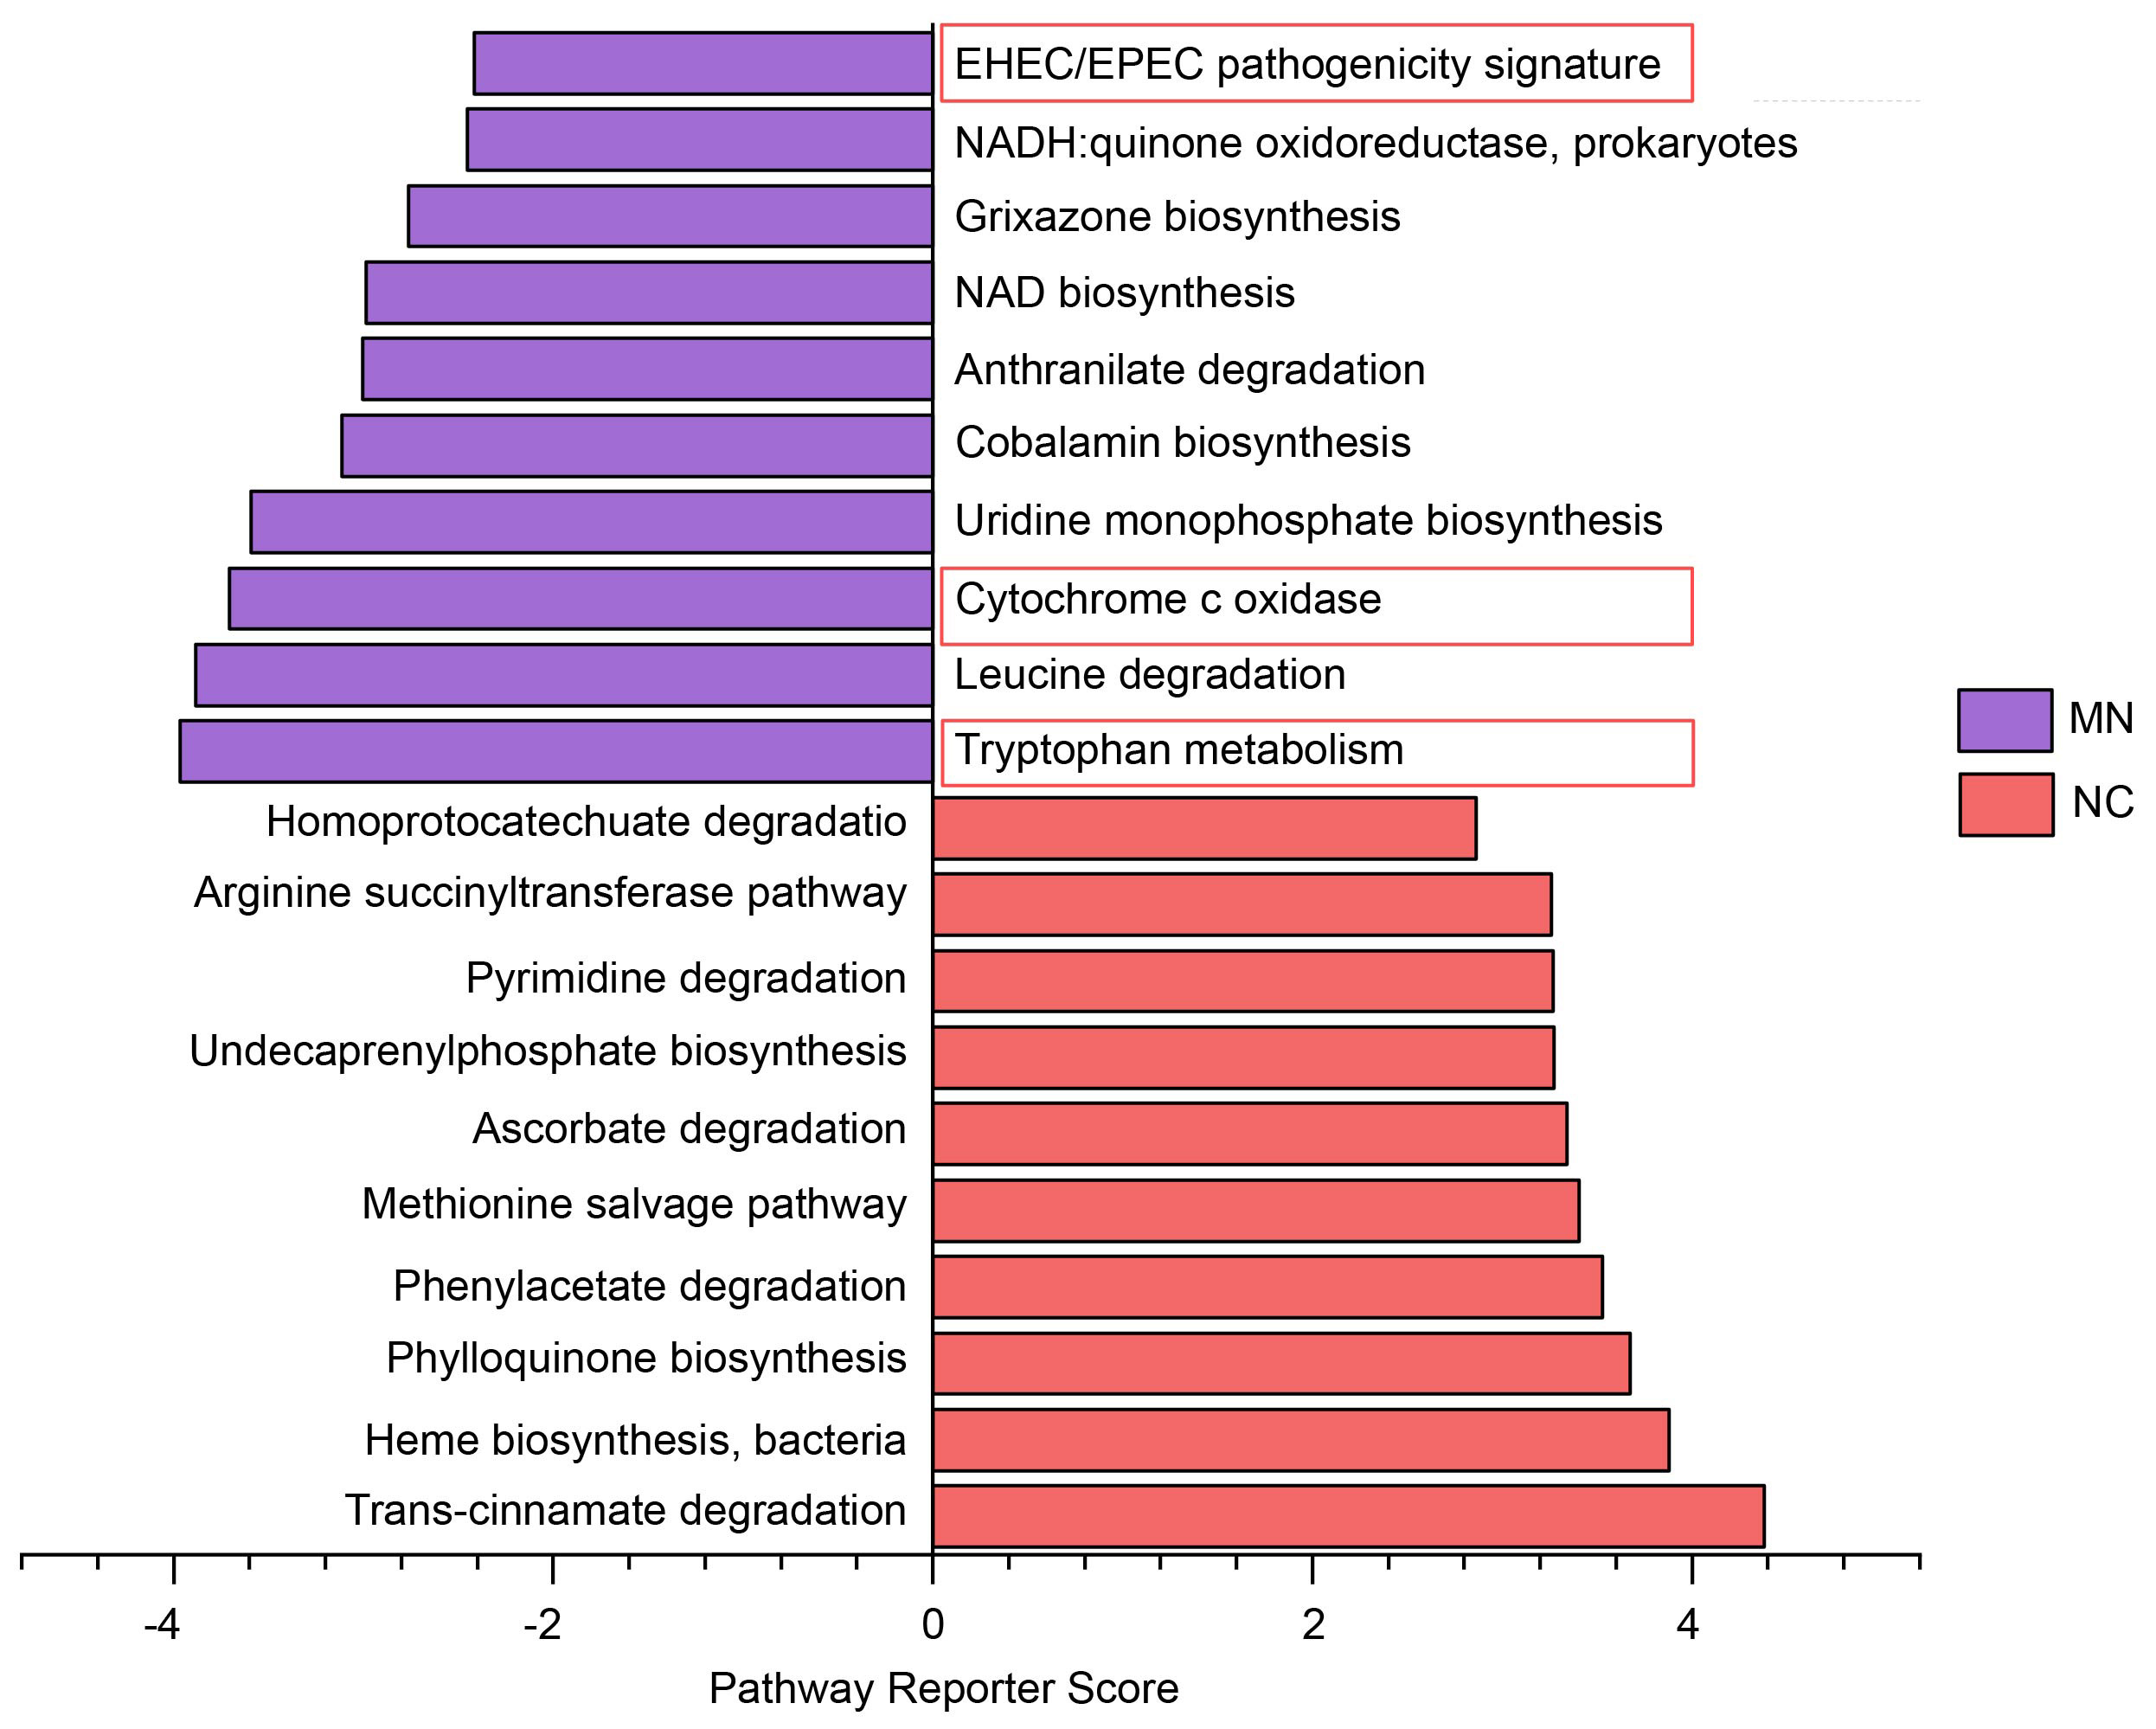 Fig. 4.
KEGG pathway enrichment analysis showing the top 10 most
enriched pathways in the MN and NC groups. Enrichment significance was evaluated
using the Reporter Score method. Pathways with a corrected Z-score
We further performed a correlation analysis between gut microbiota and clinical
parameters. The results showed that several bacterial genera were significantly
associated with renal function-related indicators (Fig. 5). Specifically,
Bacillus_A was significantly positively correlated with both serum
creatinine (CR) and protein-to-creatinine ratio (PCR) (p
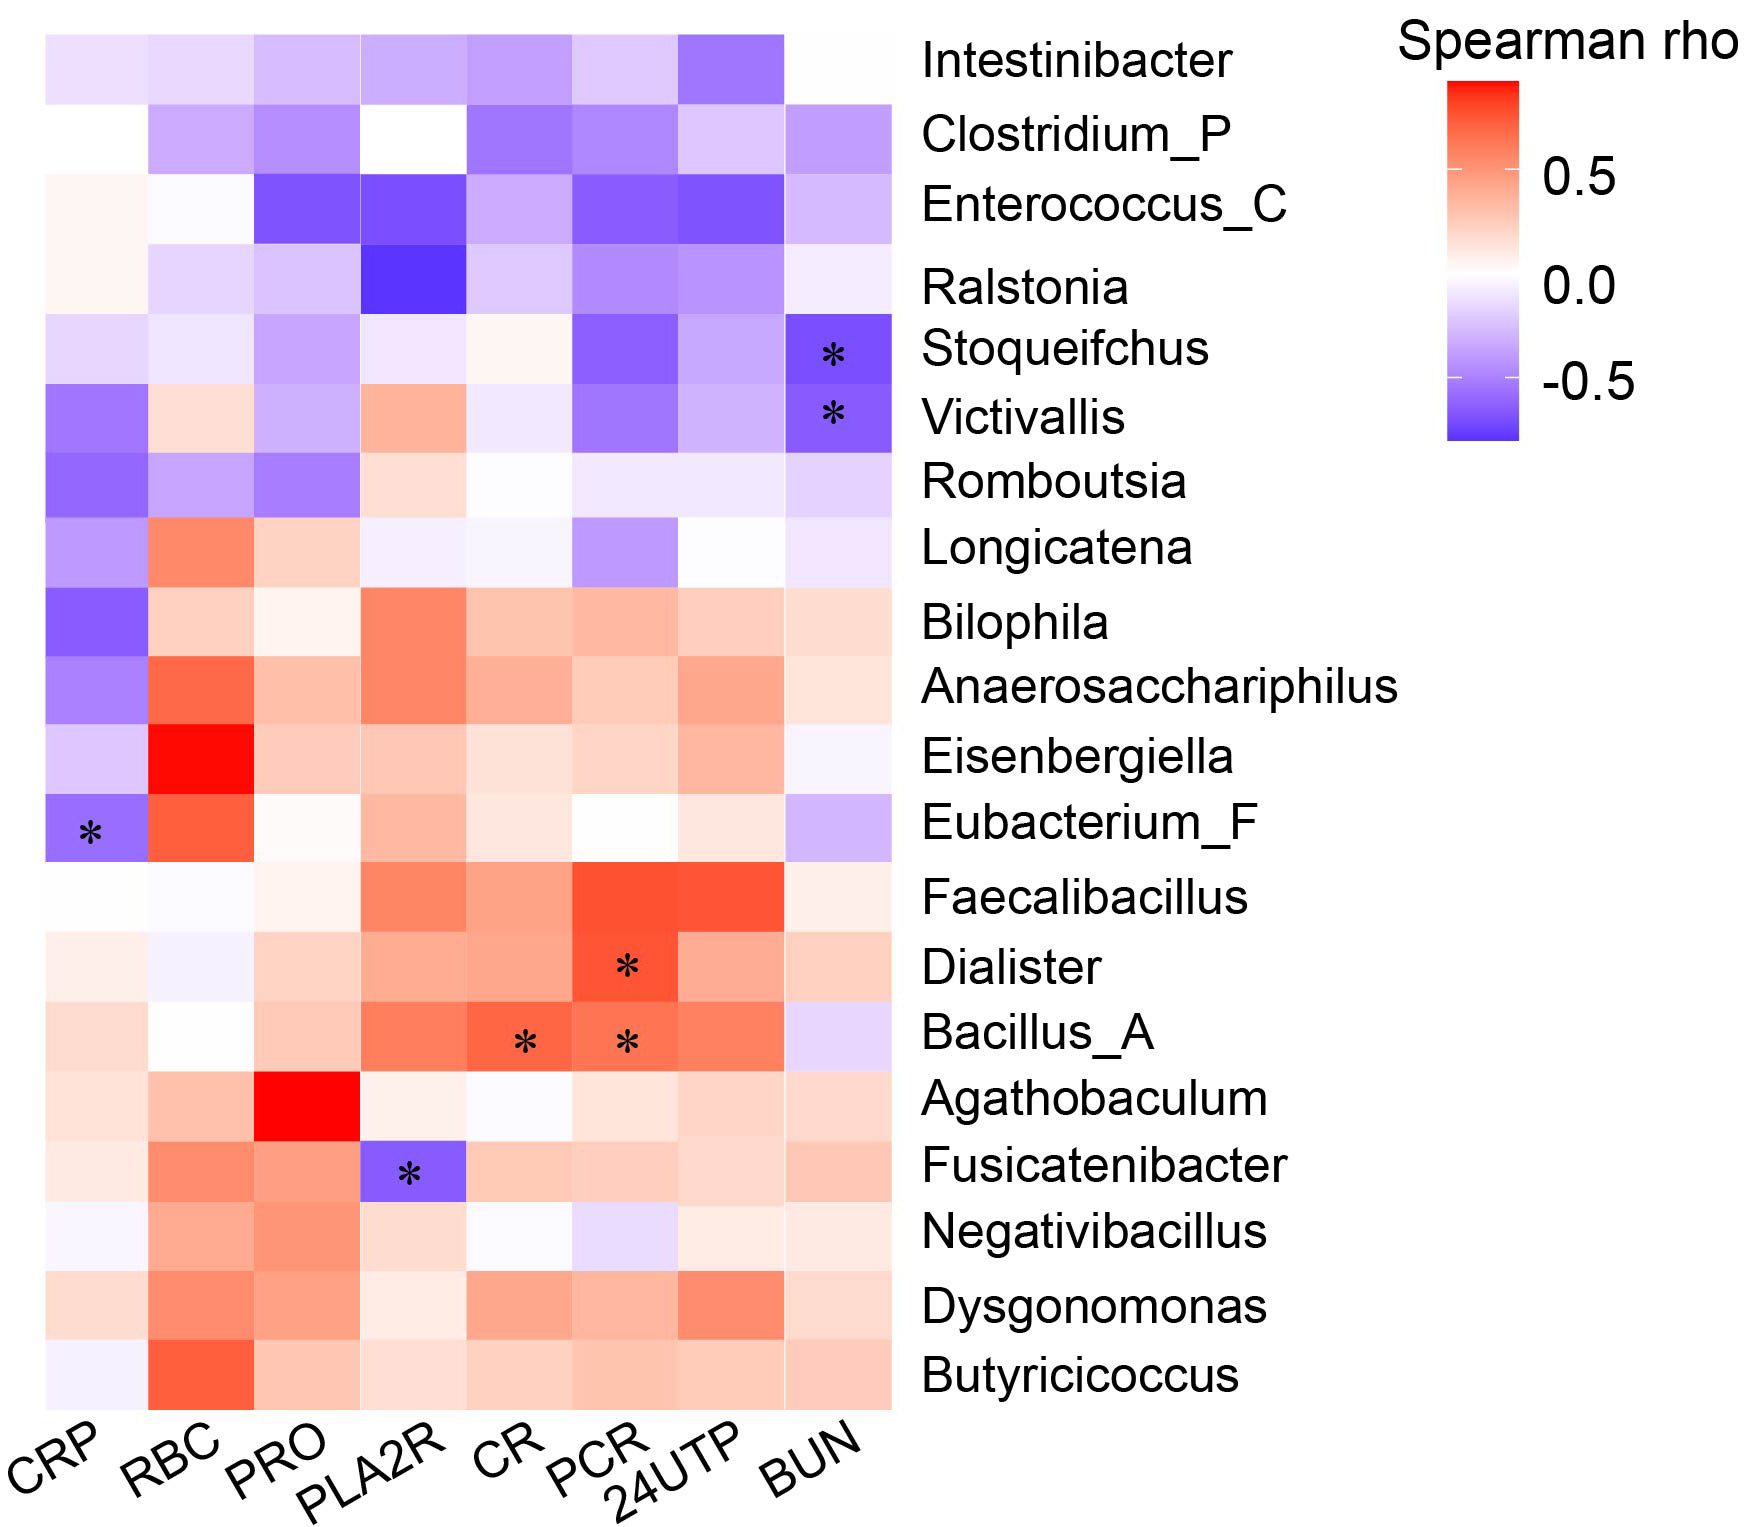 Fig. 5.
Spearman correlation heatmap between gut bacterial genera and
clinical indicators. Red indicates positive correlations, blue indicates
negative correlations, and color intensity reflects the strength of association.
*p
To evaluate the discriminatory power of the key microbial taxa between the MN
and NC groups, ROC curve analysis was performed for four differential genera,
Dialister, Enterococcus_C, Fusicatenibacter, and
Clostridium_P. Fig. 6 showed that the combined model achieved an
average area under the curve (AUC) of 0.90
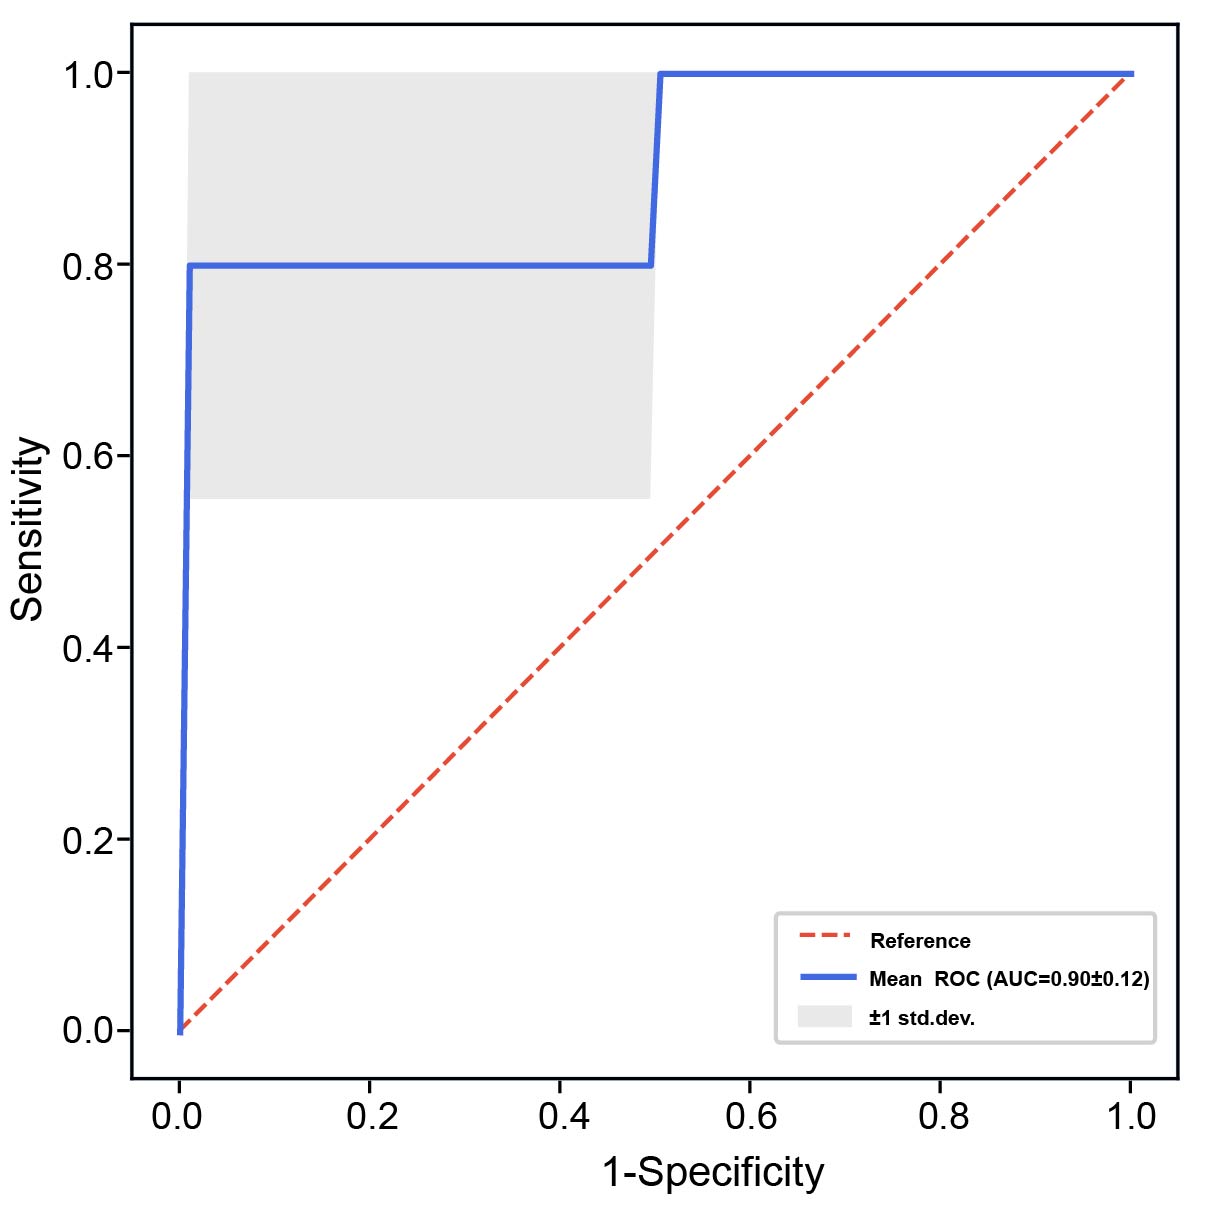 Fig. 6.
Receiver operating characteristic (ROC) curve analysis based on
four genera in the fecal microbiota (Dialister, Enterococcus_C, Fusicatenibacter, and Clostridium_P). The
blue line represents the mean ROC curve with the corresponding area under the
curve (AUC), and the shaded area indicates the
Gut microbiota diversity and abundance are crucial for sustaining normal physiological function [16, 22]. This study employed metagenomic sequencing to comprehensively characterize the gut microbial community of patients with MN. Our results revealed substantial differences in microbial diversity, taxonomic composition, and functional potential across patient groups and normal controls.
The composition and functions of the gut microbiota may change due to diet and geographic variations, as well as disease progression [23, 24]. To minimize the impact of dietary and lifestyle differences on the study results, we enrolled normal controls who lived in the same area with similar lifestyles. Our results indicated that fecal microbial richness of patients with MN was significantly reduced in comparison to normal controls, which was consistent with earlier studies [19, 25]. Taxonomic analyses also revealed that patients with MN had a distinct form of microbiota dysbiosis in the gut, characterized by an expansion in possible pathobionts and a reduction in health-related commensals. Specifically, the relative abundances of Proteobacteria (e.g., E. coli, K. pneumoniae), C. perfringens, Enterococcus spp., and M. funiformis were increased. E. coli and K. pneumoniae are intestinal opportunistic pathogens and their overproliferation is typically associated with intestinal barrier dysregulation, lipopolysaccharide (LPS)-induced hypersecretion, and systemic immune enhancement [26, 27]. Previous studies based on 16S rRNA sequencing have reported enrichment of Escherichia in patients with MN, with further linking these taxa to disease stage or immunopathological features [19]. However, increased intestinal levels of E. coli have also been reported in other kidney diseases, including IgA nephropathy [28] and diabetic nephropathy [29]. These findings suggest that the expansion of Escherichia may represent a shared feature associated with renal dysfunction or chronic inflammatory states rather than a microbiota alteration unique to MN. C. perfringens secretes a variety of toxins that disrupt intestinal epithelial integrity, leading to intestinal inflammation and metabolic imbalances [30]. Enterococcus spp. are highly drug-resistant pathogens capable of producing extracellular proteases and bile salt hydrolases, thereby enhancing intestinal permeability and inducing immune activation [31], which may exacerbate systemic inflammation and renal injury.
Moreover, the increase of pathogenic and pro-inflammatory bacteria species in patients with MN was accompanied by considerable changes in the microbial metabolic pathways. KEGG annotation-based functional prediction indicated that bacterial genes related to redox metabolism, tryptophan metabolism, and pathogenicity-associated mechanisms were highly upregulated in the MN group. Enhanced NADH:quinone oxidoreductase activity and cytochrome c oxidase pathways suggest increased bacterial oxidative phosphorylation and redox imbalance, which could result in excessive generation of ROS and facilitate the development of mucosal oxidative stress. Such oxidative stress reportedly disrupts the intestinal tight junction, exacerbating epithelial integrity and bacterial translocation [32].
Notably, the enrichment of the tryptophan metabolism pathway in patients with MN may represent a change in microbial catabolism toward the generation of immunomodulatory metabolites, including indole derivatives, kynurenine, and indoxyl sulfate. These substances may act as ligands to aryl hydrocarbon receptor (AhR) and other immune signaling receptors, affecting mucosal immune homeostasis and systemic inflammation [33]. Miao et al. [34] reported that gut microbiota–derived tryptophan metabolites are closely linked to intrarenal activation of the AhR in MN, with alterations in tryptophan metabolite profiles accompanying enhanced AhR signaling and increased renal immune activation. Potential mechanisms suggest that disrupted tryptophan metabolism may interfere with immune cell differentiation (particularly affecting the balance between pro-inflammatory Th17 cells and regulatory T cells [Tregs]) and modulate B-cell activation [35]. These immunological alterations may be linked to pathogenic autoantibody responses against podocyte antigens, including PLA2R. Furthermore, indoxyl sulfate is produced by microbial tryptophan metabolism and reportedly correlates with oxidative stress, endothelial dysfunction, and renal fibrosis, all of which contribute to the progression of CKD [36, 37].
By contrast, the gut microbiota of normal controls showed functional features that supported host metabolic and redox homeostasis. Pathway enrichment mainly involved amino acid and cofactor metabolic processes, such as homoprotocatechuate degradation, arginine succinyltransferase activity, pyrimidine breakdown, and the biosynthesis of phylloquinone (vitamin K1) and heme. These metabolic pathways are essential in amino acid catabolism, antioxidant synthesis, and cofactor reuse, and have thus been suggested to maintain energy supply and redox balance in intestinal epithelial cells, thereby promoting mucosal repair and barrier function [33, 34]. Moreover, the normal group showed increased enrichment of symbiotic bacteria, such as Faecalibacterium prausnitzii and Roseburia spp., which synthesize short‑chain fatty acids (SCFAs), particularly butyrate. Butyrate activates epithelial cell metabolism, increases tight junction protein expression, and induces Treg differentiation, thereby producing anti-inflammatory and barrier-protective effects [38, 39, 40]. These butyrate-producing bacteria were significantly decreased in MN patients, potentially impairing the energy provision and immune tolerance of the intestinal mucosa, aggravating inflammatory reactions and disrupting the immune balance.
This study found that certain gut microbial genera are associated with renal function indicators in patients with MN. Fusicatenibacter showed a negative correlation with PLA2R, suggesting that this butyrate-producing bacterium may exert immunomodulatory effects on membranous nephropathy or mitigate PLA2R-mediated autoimmune-related immune activation. Conversely, Bacillus_A had a significant positive correlation with CR and PCR, suggesting that its enrichment may reflect impaired renal filtration or increased proteinuria. Some Bacillus species can produce endotoxins or pro-inflammatory metabolites [41, 42], which may exacerbate renal injury and inflammatory responses.
Our findings indicate that a combination of four specific fecal bacterial genera (Dialister, Enterococcus_C, Fusicatenibacter, and Clostridium_P) can accurately distinguish patients with MN from healthy controls. However, future studies are crucial for confirming their reliability as diagnostic and prognostic biomarkers.
Together, our findings indicate that gut dysbiosis in patients with MN manifests not only as alterations in compositional structure but also involves functional reprogramming, leading to a shift in their metabolic state toward pro-inflammatory, oxidative stress, and uremic conditions. These altered microbial profiles may be associated with increased intestinal permeability and systemic inflammation and may relate to renal injury through the gut–kidney axis. The sample size in this study was relatively small (10 MN patients and 10 controls), highlighting the need for further validation. Future research should integrate metaproteomics, metabolomics, immunological profiling and should employ multicenter, large-sample, longitudinal studies with independent validation cohorts to elucidate the causal relationships among microbial metabolites, immune responses, and renal pathology in MN.
This study had several limitations. First, the sample size was small (10 MN patients and 10 controls), which may have limited statistical power, potentially leading to false-positive or false-negative results and affecting the robustness and reproducibility of the findings. Second, the cross-sectional observational design precludes causal inference, and the results should be interpreted as associations only. Third, although appropriate statistical methods were applied, differences in several clinical parameters between groups, including BMI, blood pressure, CR, and BUN, may represent potential confounding factors. Renal function impairment and altered metabolic status are known to influence gut microbiota composition and microbial metabolic activity, and therefore may have partially contributed to the observed microbiota alterations. Future research should include multicenter, large-sample, longitudinal studies with independent validation cohorts to confirm the reproducibility of the identified taxa, functional pathways, and the proposed microbial signature model.
In this exploratory study, we observed distinct gut microbial profiles in patients with MN compared with healthy controls. These findings suggest a potential association between MN and gut microbiome dysbiosis and provide preliminary evidence for candidate taxa that may be involved in MN-related host–microbe interactions. Given the limited sample size, these associations warrant further validation in larger, well-characterized cohorts. Collectively, our results provide a foundation for future studies to confirm these microbial signatures and to further investigate the mechanistic relationships between gut microbiota alterations and MN.
All data generated or analyzed during this study are included in this published article. Raw data are available from the corresponding author upon reasonable request.
YL: Writing—original draft, Investigation, Data curation. HG: Writing—original draft, Investigation, Data curation. ZL: Investigation. ZC: Data analysis. ZS: Writing—review& editing, Data analysis. WX: Writing—review& editing, Data analysis. YD: Conceptualization. WL: Supervision, Resources, Conceptualization. SL: Supervision, Resources, Conceptualization. All authors contributed to editorial changes in the manuscript. All authors read and approved the final manuscript. All authors have participated sufficiently in the work and agreed to be accountable for all aspects of the work.
This research was approved by the ethics committee of Shenzhen Longhua District Central Hospital (Approval No. 2025-108-01) and was carried out in accordance with the principles of the Declaration of Helsinki (1975). Informed consent was obtained from all participants.
We acknowledge the use of BioRender for creating the graphical abstract and confirm that appropriate copyright permissions have been obtained.
This work was supported by grants from Shenzhen Foundation of Science and Technology (Grant/Award Number: JCYJ20240813153002004, JCYJ20250604191024032); Guangdong Basic and Applied Basic Research Foundation (Grant/Award Number: 2025A1515012512); Shenzhen Longhua District Healthcare Institutions Scientific Research Project (Grant/Award Number: 2022041); Key Medical Discipline Construction Fund of Shenzhen Longhua District; Guangdong Yiyang Healthcare Charity Foundation (Grant/Award Number: JZ2025107).
The authors declare no conflict of interest.
References
Publisher’s Note: IMR Press stays neutral with regard to jurisdictional claims in published maps and institutional affiliations.