


 , Olga O. Miletina 1,†, Lidia V. Mammadova 1, Nadezhda V. Antipova 2, Alexander A. Shtil 3, Oleg A. Kuchur 1,4,*
1 Center for Molecular and Biological Technologies, ITMO University, 190002 Saint Petersburg, Russia
2 Laboratory of Membrane Bioenergetics, Shemyakin-Ovchinnikov Institute of Bioorganic Chemistry, Russian Academy of Sciences, 117997 Moscow, Russia
3 Laboratory of Tumor Cell Death, Blokhin National Medical Research Center of Oncology, 115522 Moscow, Russia
4 Laboratory for Bio and Chemoinformatics, School of Computer Science, Physics and Technology, Higher School of Economics, 194100 Saint Petersburg, Russia
†These authors contributed equally.
Abstract
Neuroblastoma (NB), a transcriptionally driven pediatric malignancy, exhibits a remarkable clinical and biological heterogeneity. Two major subtypes, adrenergic and mesenchymal, are differentially governed by distinct subsets of transcription factors that constitute the core regulatory circuitry (CRC). The adrenergic subtype is often associated with MYCN oncogene amplification and is particularly aggressive and therapy-resistant, underscoring the need for novel therapeutic targets.
Gene knockdown with siRNAs, qRT-PCR, flow cytometry-assisted measurements of intracellular oxidation and cell death parameters, immunoblotting, cytotoxicity assays (MTT, colony formation).
We identified the multifunctional non-POU domain-containing octamer-binding (NONO) protein as a guardian of individual CRC genes, thereby promoting the survival of NB cells with different MYCN copy numbers. In the MYCN-amplified Kelly cell line, intracellular oxidation induced by auranofin, an inhibitor of thioredoxin reductase 1 (TrxR1), rapidly down-regulated NONO mRNA and protein levels. Conversely, NONO knockdown by RNA interference (siNONO) also triggered intracellular oxidation. These effects were less pronounced in the SK-N-AS cell line carrying a single MYCN copy, as well as in non-malignant HS5 fibroblasts. In Kelly and IMR-32 cells, siNONO attenuated auranofin-induced activation of CRC genes, namely, heart and neural crest derivatives expressed 2 (HAND2) and paired-like homeobox 2B (PHOX2B). Furthermore, the Kelly cells were more sensitive to combinations of sublethal auranofin concentrations and siNONO than the counterparts with single MYCN copy. Importantly, MYCN-amplified cells demonstrated a significantly suppressed clonogenic survival 14 days after transient exposure to these combinations compared with each agent alone; HS5 fibroblasts were largely spared.
Our findings reveal a new role for the transcriptional regulator NONO in maintenance of the cellular redox balance and justify the strategy of therapeutic targeting of MYCN-amplified tumors vulnerable to oxidative stress.
Keywords
- auranofin
- core regulatory circuitry
- MYCN
- NONO
- neuroblastoma
- oxidative stress
Neuroblastoma (NB) is a pediatric malignancy of the sympathetic nervous system, arising from embryonic neural crest precursors. It shows extreme clinical heterogeneity: some tumors spontaneously regress, whereas others progress relentlessly despite intensive multimodal therapy [1, 2, 3]. About half of patients present with high-risk disease, for which 5-year survival remains below 50% [4]. Like most childhood tumors, NB has a low somatic mutation burden; instead, widespread epigenetic and transcriptional deregulation are predominant. A hallmark of high-risk NB is amplification of the MYCN oncogene, an established marker of the aggressive disease. Other factors such as activating ALK mutations or 11q deletions occur in subsets of cases [5, 6, 7, 8]. Thus, NB is better characterized by a ‘transcriptional burden’ [9], underscoring the importance of gene-regulatory therapeutic programs.
Genome-wide expression profiling has revealed two major NB cell states termed the adrenergic (ADRN) and mesenchymal (MES) subtypes [10, 11]. The ADRN subtype is typically linked to MYCN gene amplification and is defined by a cohort of transcription factors (PHOX2B, HAND2, GATA3, ISL1, TBX2, ASCL1, etc.) that regulate each other at the level of gene expression. These factors form a self-reinforcing core regulatory circuitry (CRC) [12, 13]. In contrast, MES cells express a different lineage program, e.g., PRRX1, YAP/TAZ and SNAI1, and resemble neural-crest–derived MES phenotypes. This state tends to be more chemoresistant and invasive, and may expand after treatment pressure [14, 15, 16]. Importantly, both states can undergo transition and transdifferentiate in the course of therapy [17, 18]. This transcriptional heterogeneity and plasticity, along with low immunogenicity, complicates the treatment.
Current regimens for high-risk NB include intensive chemotherapy, radiotherapy, anti-GD2 immunotherapy and autologous stem-cell rescue [19, 20, 21]. However, the majority of tumors relapse. Over half of children with high-risk NB eventually experience disease recurrence, which significantly reduces survival rates [22, 23]. Conventional therapies do not specifically address the individual molecular ‘portraits’ of NB subtypes; therefore, the tumors can escape standard cytotoxic agents [24, 25, 26]. These limitations highlight the need for novel approaches that target the biological peculiarities of NB.
CRC targeting has emerged as an attractive strategy. The genome-wide screens showed that MYCN, HAND2, ISL1, PHOX2B, GATA3 and TBX2 transcription factors are essential for MYCN-amplified NB [27, 28]. Disruption of this circuitry profoundly impairs NB growth. Combined inhibition of transcriptional proteins BRD4 and CDK7 caused rapid loss of CRC transcription and synergistically suppressed MYCN-amplified tumors [29]. These reports as well as other studies emphasized a network of distinct CRC members and auxiliary survival pathways that act in concert to promote NB cell survival [30].
Among transcriptional mechanisms in NB, the non-POU domain-containing octamer-binding protein (NONO or p54nrb) deserves a special heed. NONO, a multifunctional DNA/RNA-binding protein, has been recently identified as a master regulator of oncogenic transcription in NB [31, 32]. NONO binds to 5′-ends of introns and to long non-coding RNAs (lncRNAs) including MYCN transcript, promoting the expression of oncogenes [33]. Through these interactions, NONO ‘guards’ CRC and amplifies MYCN signaling. Clinically, high NONO expression correlates with aggressive NB and poor prognosis [34].
Thus, NONO is an important regulator of neuroblastoma conditions, and its pharmacological inhibition is preferred as it appears to be a promising strategy for the NB treatment. However, NONO has long been considered undruggable since this protein lacks an enzymatic structure; only very recently the small molecular weight compound that disrupts NONO-RNA interaction has been introduced [35, 36, 37]. Nevertheless, evidence has been reported in favor of NONO inhibition as a result of metabolic deregulation.
Auranofin is a clinically approved irreversible inhibitor of the antioxidant enzyme thioredoxin reductase 1 (TrxR1) [38]. Consequently, auranofin forces intracellular accumulation of reactive oxygen species (ROS). This effect has been used for induction of oxidative stress in neurogenic tumors [39, 40, 41]. Notably, MYCN-amplified NB cells rely on robust redox buffers; therefore, these cells may be particularly vulnerable to the shift of redox balance to oxidation [42]. Intriguingly, Hou et al. [43] have shown that auranofin can inactivate NONO in glioblastoma. Although the mechanism of inhibition remained to be elucidated, this pivotal observation set the stage for a detailed investigation of the role of NONO in specific metabolic responses as well as for therapeutic combinations to enhance intracellular oxidation in NB cells.
In this study, we investigated whether intracellular oxidation is mechanistically linked to NONO inactivation, deregulation of individual CRC genes and death of NB cells carrying different numbers of MYCN copies. The CRC genes PHOX2B and HAND2 were chosen because the former transcription factor reflects the integrity of ADRN lineage-determining program whereas HAND2 participates in enhancer-dependent transactivation and MYCN-mediated proliferation [28, 44].
Reagents were purchased from Dia-M, Moscow, Russia unless specified otherwise.
The human NB cell lines with (Kelly and IMR-32) or without (SK-N-AS, SK-N-SH, SH-SY5Y) MYCN amplification were used. All cell lines were purchased from the American Type Culture Collection (Manassas, VA, USA). The HCT116 (colorectal adenocarcinoma; collection of the Institute of Cytology, Russian Academy of Sciences, Saint-Petersburg, Russia) and A549 (lung adenocarcinoma; Biolot, Moscow, Russia) cell lines were used as transformed non-neuronal control. The bone marrow-derived HS5 fibroblast cell line (gift of Dr. T. Lebedev, Engelhardt Institute of Molecular Biology, Russian Academy of Sciences, Moscow, Russia) was a non-malignant counterpart. The Kelly and HS5 cell lines were propagated in RPMI-1640 with 10% fetal bovine serum (Biolot, Moscow, Russia) and 100 µg/mL gentamicin. The IMR-32, SK-N-SH and SH-SY5Y cells were grown in Eagle’s Minimum Essential Medium supplemented with 10% serum and 100 µg/mL gentamicin. The HCT116 and A549 cells were grown in Dulbecco’s Modified Eagle Medium with 10% serum and 100 µg/mL gentamicin. The SK-N-AS cells were cultured in the same medium with high glucose and 1% non-essential amino acids. Cells were propagated at 37 °C, 5% CO2 in a humidified atmosphere. All cell lines were validated by STR profiling and found negative for Mycoplasma (MycoReport kit, Evrogen, Moscow, Russia).
Auranofin (Astellas Pharma, Tokyo, Japan) was dissolved in 10 mM dimethyl sulfoxide and stored at 20 °C prior to the experiments. For transient gene knockdown, five small interfering RNAs (siRNAs) were used: NONO, MYCN, HAND2, PHOX2B (CRC gene-specific) and siRNA to GFP (unrelated control). All siRNAs (DNA Synthesis, Moscow, Russia; Table 1) were transfected with GenJect liposomes 40 (Molecta, Moscow, Russia): 2 µL siRNA, 125 nM liposomes in 35 mm Petri dish for 24 h according to the manufacturer’s instructions. Gene knockdown was registered 24 h post transfection. Two to three variants of each siRNA sequence were tested to achieve the most pronounced and reproducible knockdown. In combination experiments, cells were transfected with the respective siRNAs; 24 h later fresh medium supplemented with auranofin was added, and cells were incubated for 14 days followed by cytotoxicity assays (see below).
| Target gene | siRNA | Sequence |
| MYCN | Sense | 5′-GCUUUUGCUGGAAAAGGAAAAdTdT |
| Antisense | dTdTUUCCUUUUCCAGCAAAAGCUG-5′ | |
| NONO | Sense | 5′-GCGACAGCAGGAAGGAUUCAAdTdT |
| Antisense | dTdTCGCUGUCGUCCUUCCUAAGUU-5′ | |
| HAND2 | Sense | 5′-GUGUAAACGUUGUAAGUAUUCdTdT |
| Antisense | dTdTAUACUUACAACGUUUACACCU-5′ | |
| PHOX2B | Sense | 5′-UAUGUUCACAAACAUAGUCCAdTdT |
| Antisense | dTdTGACUAUGUUUGUGAACAUAAU-5′ | |
| GFP | Sense | 5′-GAACGGCAUCAAGGUGAACdTdT |
| Antisense | dTdTCUUGCCGUAGUUCCACUUG-5′ |
siRNA, small interfering RNA; NONO, non-POU domain-containing octamer-binding; HAND2, heart and neural crest derivatives expressed 2; PHOX2B, paired-like homeobox 2B; GFP, green fluorescent protein.
After incubation with auranofin without or with siRNAs, cells were loaded with 5 µM 2′,7′- dichlorodihydrofluorescein diacetate (DCFH2-DA), incubated for 60 min at 37 °C, then washed with phosphate buffered saline pH7.4 (PBS), harvested by centrifugation (500 g, 5 min) and resuspended in 200 µL PBS. Fluorescence intensity was analyzed on a CytoFlex B2-R2-V0 flow cytometer (Beckman Coulter, Brea, CA, USA) (excitation/emission settings 493/523 nm; FITC channel, 488 nm laser). Hydrogen peroxide (0.5 mM) was used as a control for induction of intracellular oxidation.
Isolation of total RNA from cells was performed with the ExtractRNA buffer (Evrogen, Moscow, Russia) according to the manufacturer’s protocol. cDNA was synthesized from 2 µg total RNA preparation using MMLV reverse transcriptase: 25 °C 10 min, 42 °C 50 min, 70 °C 10 min, 10 °C 10 sec. The PCR mixture contained 1 µg cDNA, 5x qPCR SYBR Green I, forward and reverse primers (10 µM each; Table 2), and nuclease-free H2O.
| Gene | Primer | Sequence |
| MYCN | Forward | 5′-GAGGACACCCTGAGCGATTC-3′ |
| Reverse | 5′-TTGGTGTTGGAGGAGGAACG-3′ | |
| NONO | Forward | 5′-ATATGCCACTCCGTGCAAAG-3′ |
| Reverse | 5′-GAAGGAGCCTTCACTGCATC-3′ | |
| HAND2 | Forward | 5′-CTCCAAAATCAAGACCCTGCG-3′ |
| Reverse | 5′-GGCCTTTGGTTTTCTTGTCGT-3′ | |
| PHOX2B | Forward | 5′-ATTCCTCTGCCTACGAGTCCT-3′ |
| Reverse | 5′-TTTGTAAGGAACTGCGGCG-3′ | |
| TXNRD1 | Forward | 5′-GAGAAAGCTGTGGAGAAGTTTG-3′ |
| Reverse | 5′-CCACAACACGTTCATTGTCTTT-3′ | |
| CDKN1A | Forward | 5′-AGTCAGTTCCTTGTGGAGC-3′ |
| Reverse | 5′-CATTAGCGCATCACAGTCGC-3′ | |
| 18S | Forward | 5′-AAGTGACGCAGCCCTCTATG-3′ |
| Reverse | 5′-TGGACAACAAGCTCCGTGAA-3′ | |
| HPRT1 | Forward | 5′-TATATCCAACACTTCGTGGGGTC-3′ |
| Reverse | 5′-ACAGGACTGAACGTCTTGCTC-3′ |
RT-PCR, Reverse Transcription-Polymerase Chain Reaction; TXNRD1, thioredoxin reductase 1; CDKN1A, cyclin-dependent kinase inhibitor 1A; 18S, 18S ribosomal RNA; HPRT1, hypoxanthine-guanine phosphoribosyltransferase 1.
Amplification conditions:
• Stage 1 (1 cycle): 94 °C 3 min, 60 °C 40 sec, 72 °C 40 sec;
• Stage 2 (28–30 cycles): 94 °C 10 sec, 60 °C 10 sec, 72 °C 20 sec;
• Stage 3 (1 cycle): 72 °C 3 min;
• Stage 4 (storage): 4 °C.
After the completion of reactions, the relative expression was determined by the
After the completion of treatments, cells were lysed in a buffer containing 50
mM Tris-HCl pH 8.0, 150 mM NaCl, 1% NP-40, 0.1% sodium dodecyl sulfate, 200
µM phenylmethylsulfonyl fluoride, protein inhibitor cocktail (leupeptin,
aprotinin and pepstatin, 1 µg/mL each) (Sigma-Aldrich, Burlington, MA, USA).
Protein concentration was measured by Bradford assay. Lysates (35 µg
total protein per lane) were separated by electrophoresis in 10% sodium dodecyl
sulfate-polyacrylamide gels and transferred onto a nitrocellulose membrane
(BioRad, Hercules, CA, USA) at 250 mA, 1 h at 4 °C. Membranes were blocked
with 5% bovine serum albumin for 30 min at room temperature and incubated with
primary antibodies (1:1000) overnight at 4 °C. After washing with
Tris-buffered saline-Tween-20, membranes were incubated with horseradish
peroxidase-conjugated secondary antibodies (1:1000, Cell Signaling Tech.,
Danvers, MA, USA) for 1 h. Signals were detected with Enhanced Chemilumiscence reagent
(Thermo Fisher, Waltham, MA, USA) and captured using a gel documentation system
ChemiDoc™ Touch (BioRad) with multiple exposure times to ensure
linear range of detection. Primary antibodies were: NONO (PAJ818Hu01, Cloud-Clone
Corp., Houston, TX, USA), HAND2 (E-AB-61488, Elabscience, Wuhan, Hubei Province,
China), MYCN, PHOX2B,
Five thousand cells/well were plated into 96-well plates and left overnight.
Auranofin was tested at concentrations 0.1–50 µM. Cells were
treated for 72 h at 37 °C, 5% CO2. Cell viability was
determined by 3-(4,5-dimethylthiazol-2-yl)-2,5-diphenyltetrazolium bromide assays
(MTT; Sigma-Aldrich, Burlington, MA, USA). Absorbance was registered on a Tecan
spectrophotometer (Tecan Spark™, Männedorf, Switzerland) at
570 nm. The percentages of viable cells were calculated as a ratio (OD570 in
wells with respective auranofin concentrations) to (OD570 of vehicle-treated
cells)
For colony formation assays, cells were transfected with the respective siRNAs (indicated in Results) for 24 h, then treated with 0.25 µM auranofin for 24 h, plated into 60 mm Petri dishes (100 cells/well, 10 mL of culture media) and incubated at 37 °C, 5% CO2 for 14 days. Colonies were fixed in methanol, stained with 0.05% crystal violet for 30 min and counted.
For cell cycle analysis, cells were treated as indicated in Results, then detached and collected by centrifugation. Pellets were washed twice with PBS, fixed with 70% ethanol in PBS at –20 °C for 30 min, treated with 25 µg/mL RNase A (Biolot), stained with 20 µg/mL propidium iodide (PI; Fisher Sci., Waltham, MA, USA) for 15–30 min, resuspended in PBS and analyzed on a CytoFlex B2-R2-V0 flow cytometer (Beckman Coulter, Brea, CA, USA) at excitation/emission settings 544/570 nm (TRITC channel, 532 nm laser). Twenty thousand fluorescence events were collected per each sample.
To determine the mode of death, cells were transfected with siRNAs or treated
with auranofin as indicated in Results. After the completion of treatments cells
were detached from the plastic, pelleted for 1 min at 500
The GraphPad Prism 8.0 program (GraphPad Software, Boston, MA, USA) was used to
plot graphs. Results were processed using a one-way ANOVA test. Differences were
statistically significant at *p
The role of NONO in the development of transcriptional deregulation is crucial due to its ability to bind to lncRNAs and promote transcription of oncogenes [33]. Additionally, high NONO expression correlates with NB aggressiveness [34]. Therefore, targeting NONO emerges as a promising strategy for neuroblastoma treatment. Auranofin, an inhibitor of TrxR1, has been implicated in inactivation of NONO protein in neural cells [42, 45]. Firstly, we analyzed the cytotoxic effect of auranofin (72 h exposure) on a panel of cell lines. Fig. 1A shows that auranofin was preferentially cytotoxic against MYCN-amplified NB cell lines Kelly (~0.39 µM) and IMR-32 (~0.86 µM) and non-MYCN-amplified cell lines SH-SY5Y (~0.41 µM) and SK-N-SH (~0.94 µM) cell lines. The SK-N-AS cells (single MYCN copy) were less sensitive to auranofin (IC50 ~1.39 µM). The HS5 fibroblasts exhibited similar sensitivity as SK-N-AS cells (IC50 ~1.87 µM). The least responsive were A549 and HCT116 cells (IC50 ~3.54 µM and ~6.95 µM, respectively). Therefore, epithelial cells have less potential of being affected by auranofin compared to MES and neuronal cells.
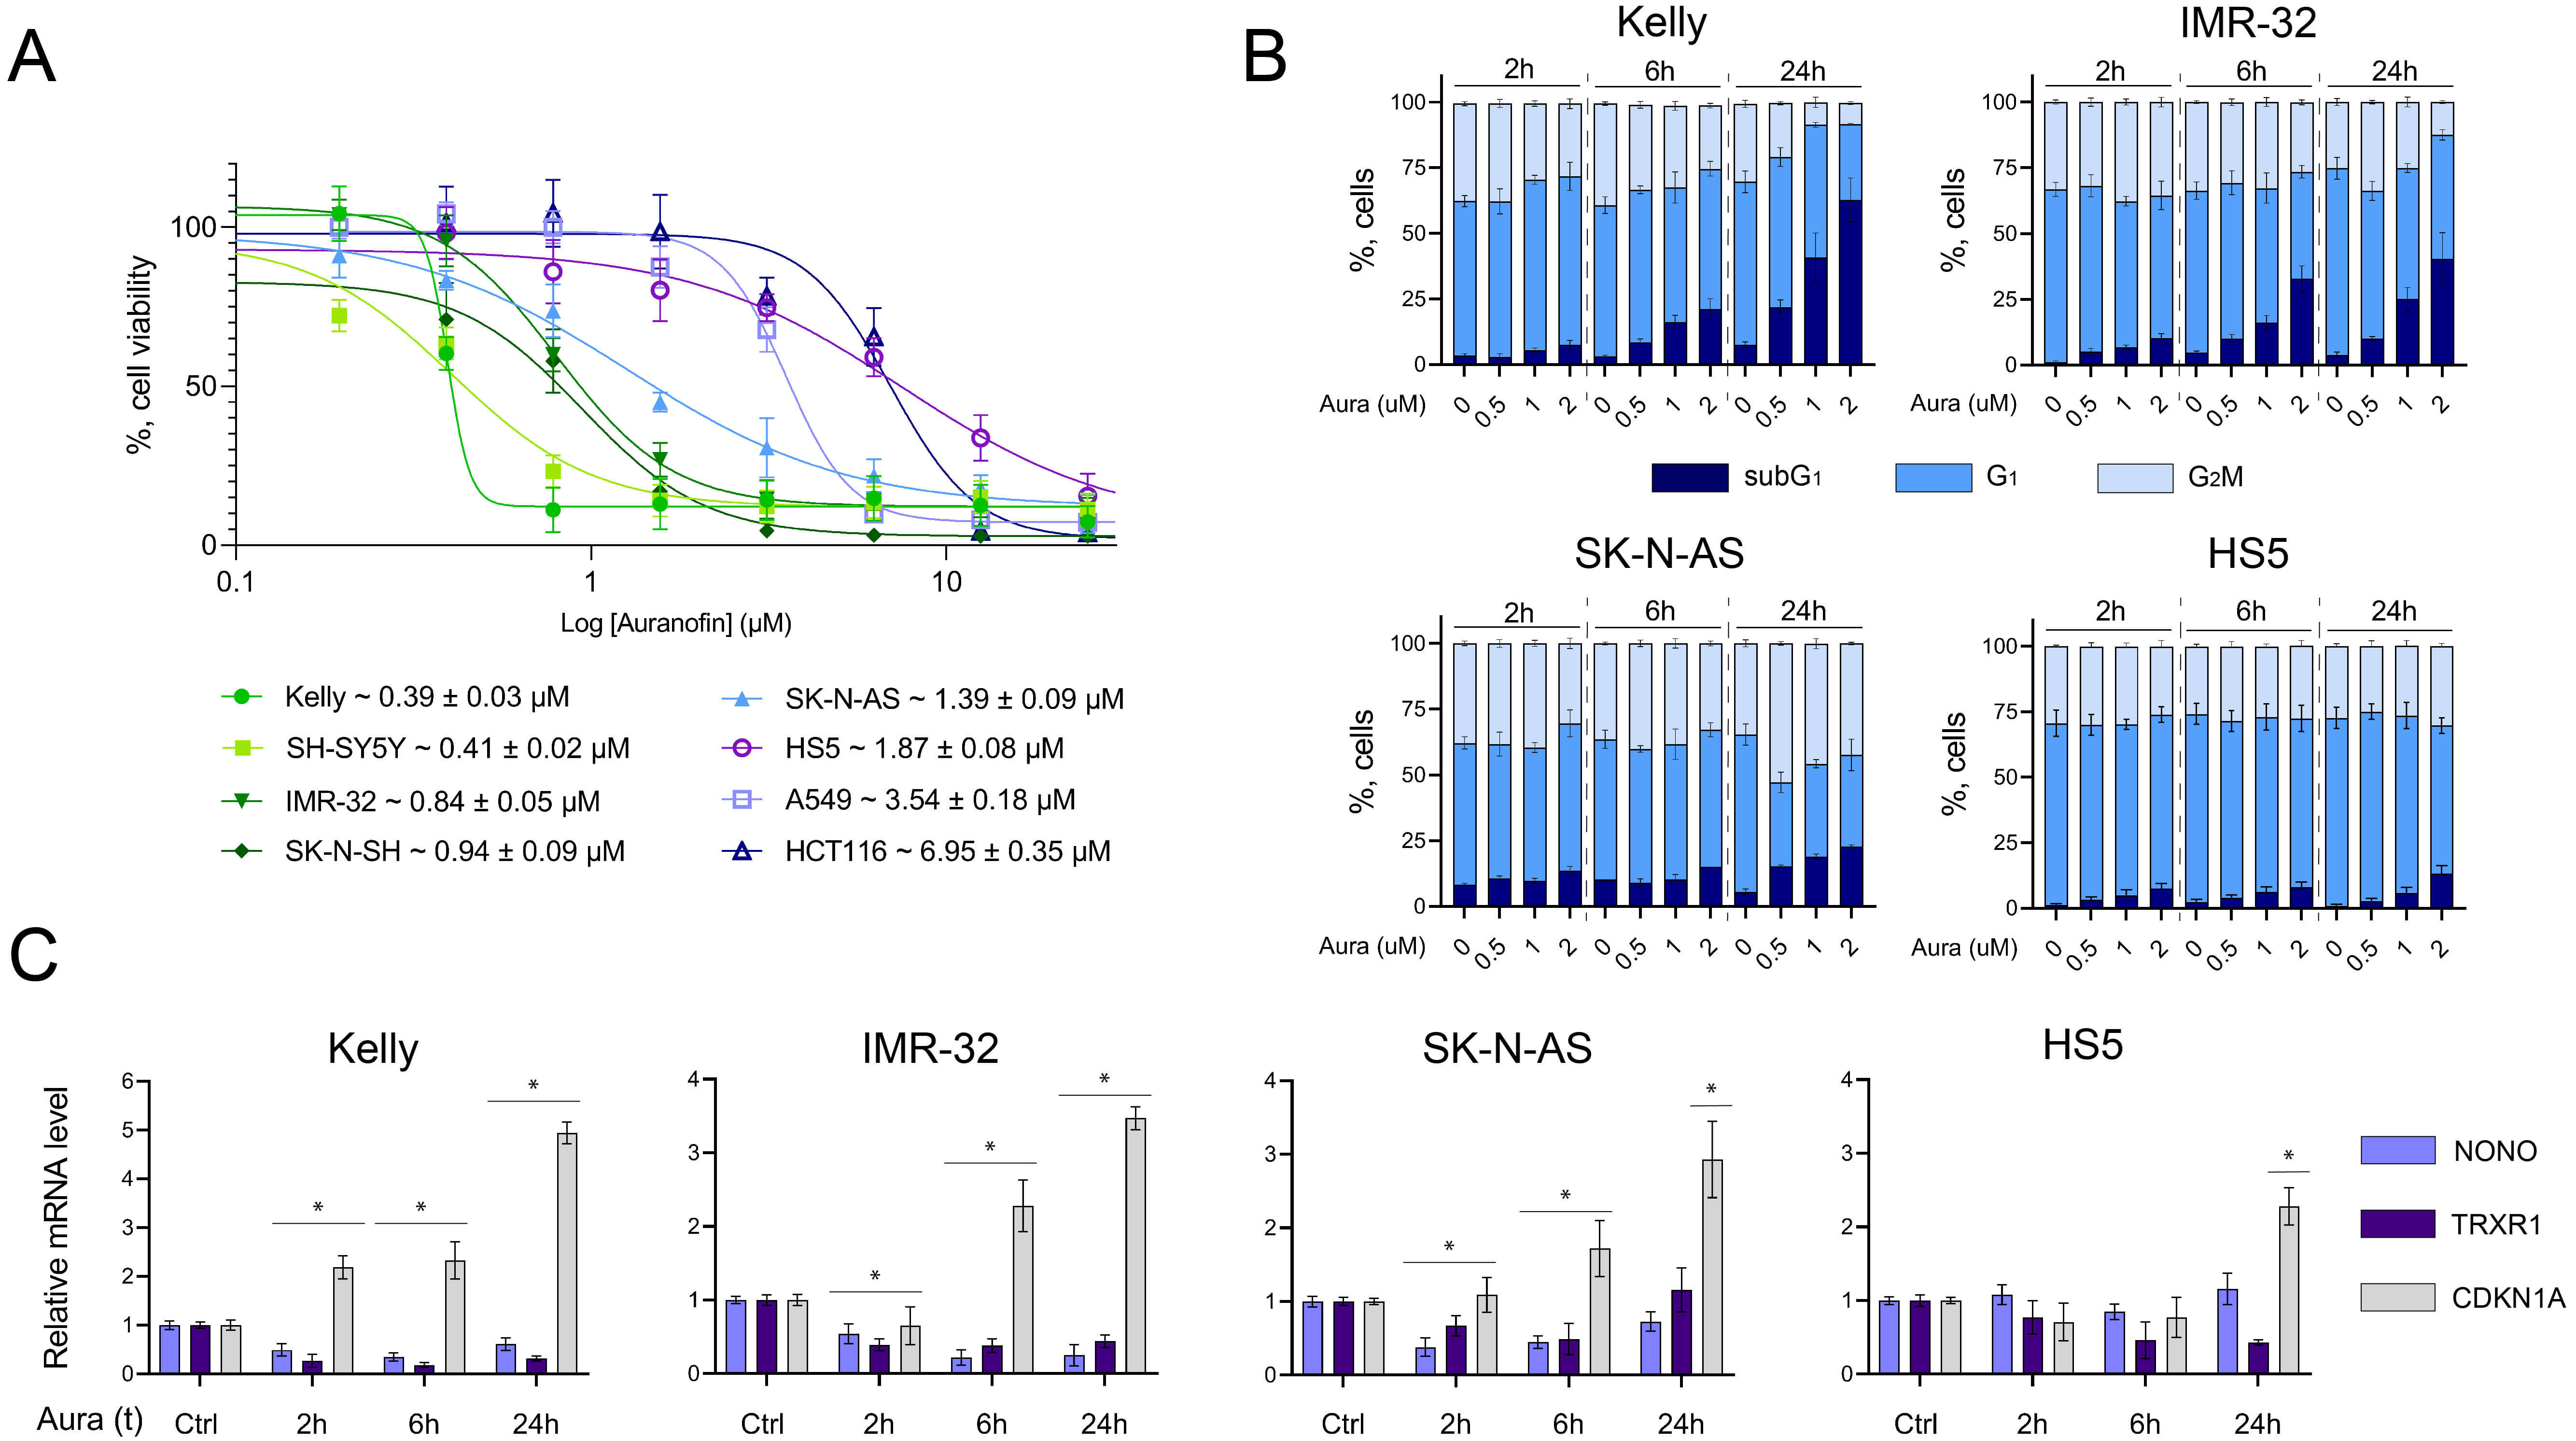 Fig. 1.
The effects of auranofin on cell viability, cell cycle
distribution and gene expression. (A) Dose response of the cell lines panel to
auranofin (72 h, MTT assay). (B) Cell cycle distribution in auranofin-treated
cells. Results are shown as mean
Differential sensitivity of NB cells was further demonstrated by the cell cycle distribution flow cytometry analysis (Fig. 1B and Supplementary Fig. 1). Auranofin elevated the percentage of apoptotic subG1 events in a dose- and time-dependent manner. By 24 h this effect was the strongest in MYCN-amplified Kelly cells: cell populations contained ~30–40% and 50–60% apoptotic cells after treatment with 1 µM and 2 µM auranofin, respectively. In IMR-32 cells, subG1 portions were less pronounced. In SK-N-AS and HS5 cells, the respective percentages were only 10–20%. These results confirmed a preferred sensitivity of MYCN-amplified NB cells to auranofin compared to non-MYCN-amplified NB cell lines.
Next, we evaluated the abundance of TXNRD1 and NONO mRNAs in NB cell lines with different MYCN status and in bone marrow fibroblast cell line HS5 after incubation with 0.5 µM auranofin (Fig. 1C). The steady-state levels of TXNRD1 and NONO mRNAs in HS5 cells were insignificantly affected by auranofin by 2–6 h. This can be associated with the activity of antioxidant systems potent in HS5 cells [46, 47]. In NB cell lines, the level of TXNRD1 and NONO mRNAs significantly decreased as early as by 2 h with auranofin. The strongest effect was observed in MYCN-amplified Kelly and IMR-32 cell lines, further substantiating their preferential sensitivity to auranofin-mediated NONO downregulation. In the SK-N-AS cells at 2–6 h the abundance of TXNRD1 and NONO mRNAs decreased significantly, whereas by 24 h these values returned to control. In contrast, the steady-state levels of CDKN1A mRNA increased ~3–4-fold, arguing against general down-regulation of transcription in auranofin-treated cells.
Next, we investigated whether auranofin differentially regulates individual CRC
genes across three NB cell lines compared to non-malignant counterparts. As shown
in Fig. 2A, treatment with gene-specific siRNAs was efficient: siMYCN attenuated
MYCN mRNA ~2–3-fold; a similar extent of NONO down-regulation was achieved with siNONO. Importantly, auranofin and
MYCN/NONO siRNAs differentially influenced the expression of
HAND2 and PHOX2B genes. In Kelly and IMR-32 cells, auranofin
activated these genes ~2-fold, and this activation was prevented
by siNONO but not by siMYCN. In SK-N-AS and HS5 cells, auranofin evoked minor
effects (
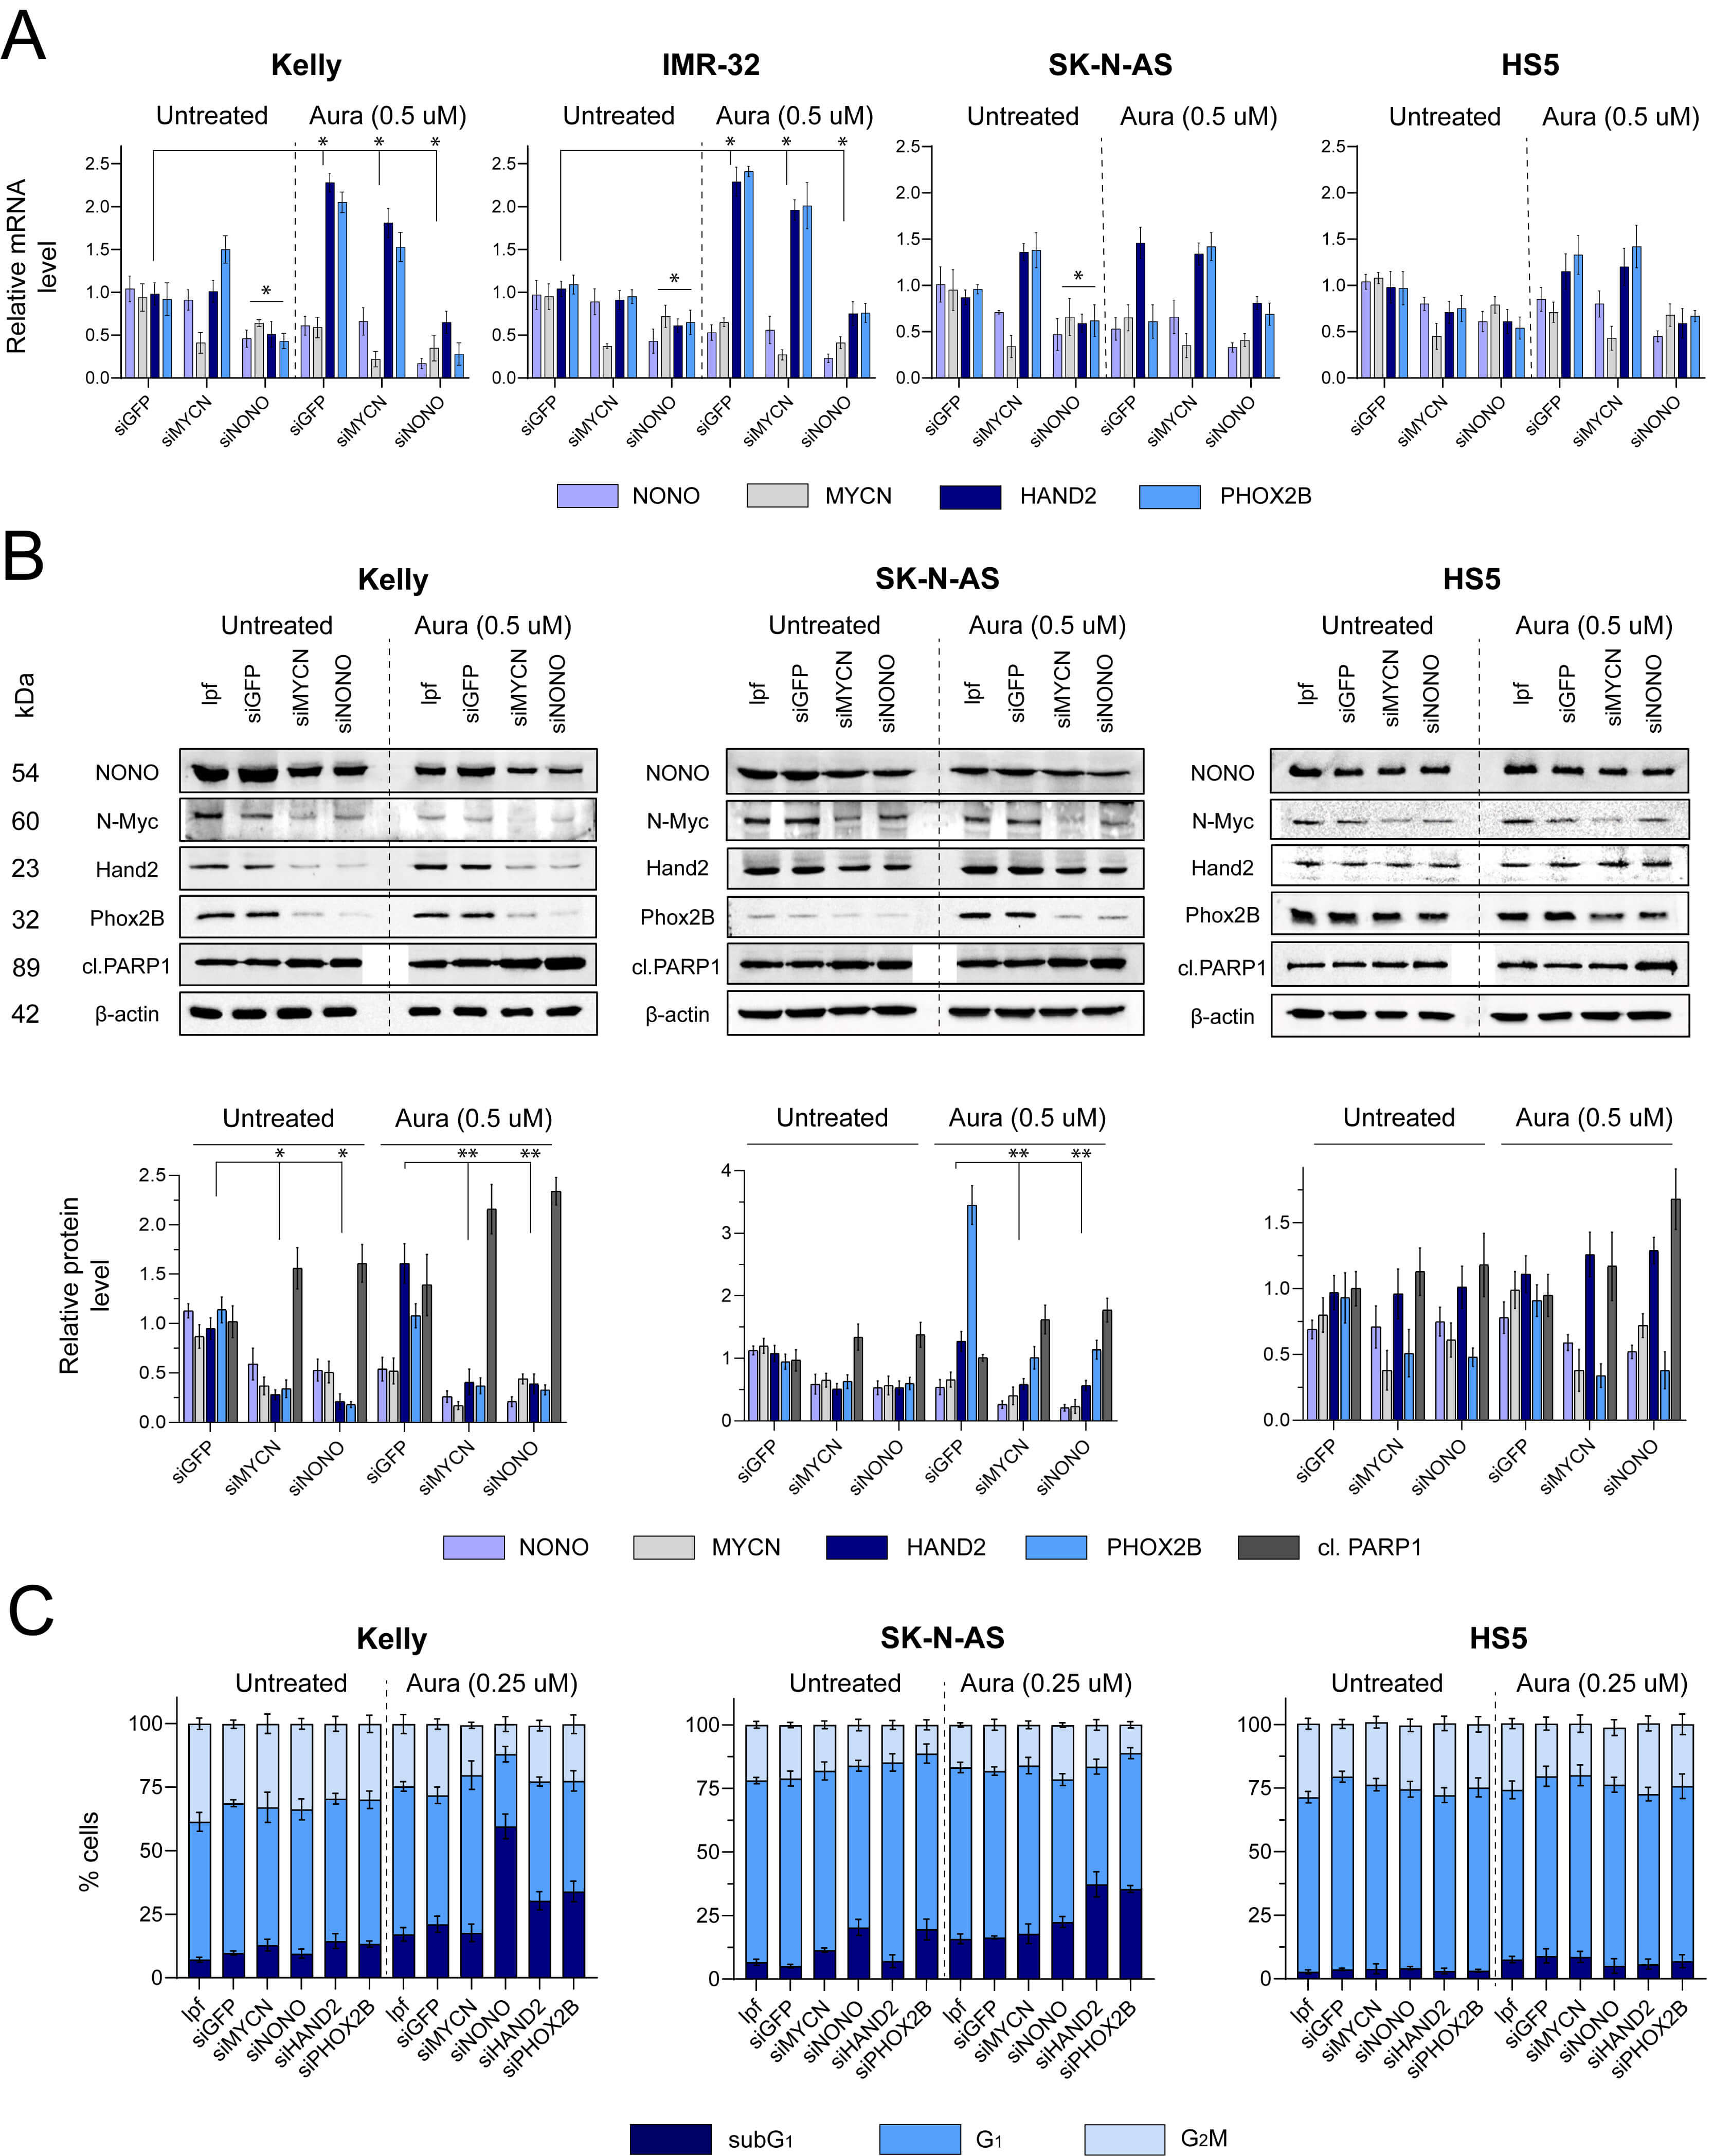 Fig. 2.
Auranofin, NONO and MYCN cooperate for CRC
deregulation in NB cell lines. Steady-state levels of CRC mRNAs (A) and proteins
(B). (A) Gene-specific signals were normalized to HPRT1 transcripts. The
ratio in untreated cells was taken as 1.0 (control). Bars above the column groups
show statistical significance relative to the control. (B) Top,
immunoblotting of cell lines transfected with siMYCN or siNONO followed by
exposure to auranofin. Loading control:
The analysis of cell cycle distribution showed that the MYCN-amplified Kelly cell line was sensitive to siRNA-mediated NONO suppression: the portion of nuclei with fragmented DNA (subG1 events) increased up to 60%, in contrast to cell lines carrying a single MYCN copy (Fig. 2C and Supplementary Fig. 2). Thus, auranofin and NONO knockdown synergized in the decrease of the factors relevant to NB cell survival. These results led us to test the therapeutic meaningfulness of these combinations.
Auranofin induces intracellular ROS accumulation via direct inhibition of the TrxR1 antioxidant enzyme. We addressed the question whether intracellular oxidation evokes death of NB cells with different MYCN status. After incubation with siRNAs and auranofin (0.5 µM) cells were stained with YO-PRO™-1 and PI dyes to determine apoptotic vs. necrotic components of cell death by flow cytometry. YO-PRO™-1 enters cells with compromised plasma membrane (early apoptosis) and binds to nucleic acids, whereas PI permeates the damaged plasma membrane and intercalates into the DNA (a marker of late-stage apoptosis and/or necrosis). Triton X-100 (0.1%, 5 min) was used as a positive control for PI entry. Fig. 3A and Supplementary Fig. 3 showed that late apoptotic-necrotic fraction in response to siNONO+auranofin was robust in Kelly and SK-N-AS cell lines (~40%) compared to HS5 fibroblasts (~10%). Accordingly, HS5 cells appear to be less vulnerable to genetic (siRNA) as well as to pharmacological (auranofin) NONO inhibition, suggesting a therapeutic ‘window’. Additionally, siNONO alone induced a more pronounced apoptosis in Kelly cells, and synergy of auranofin and siNONO was observed only in this MYCN-amplified NB cell line.
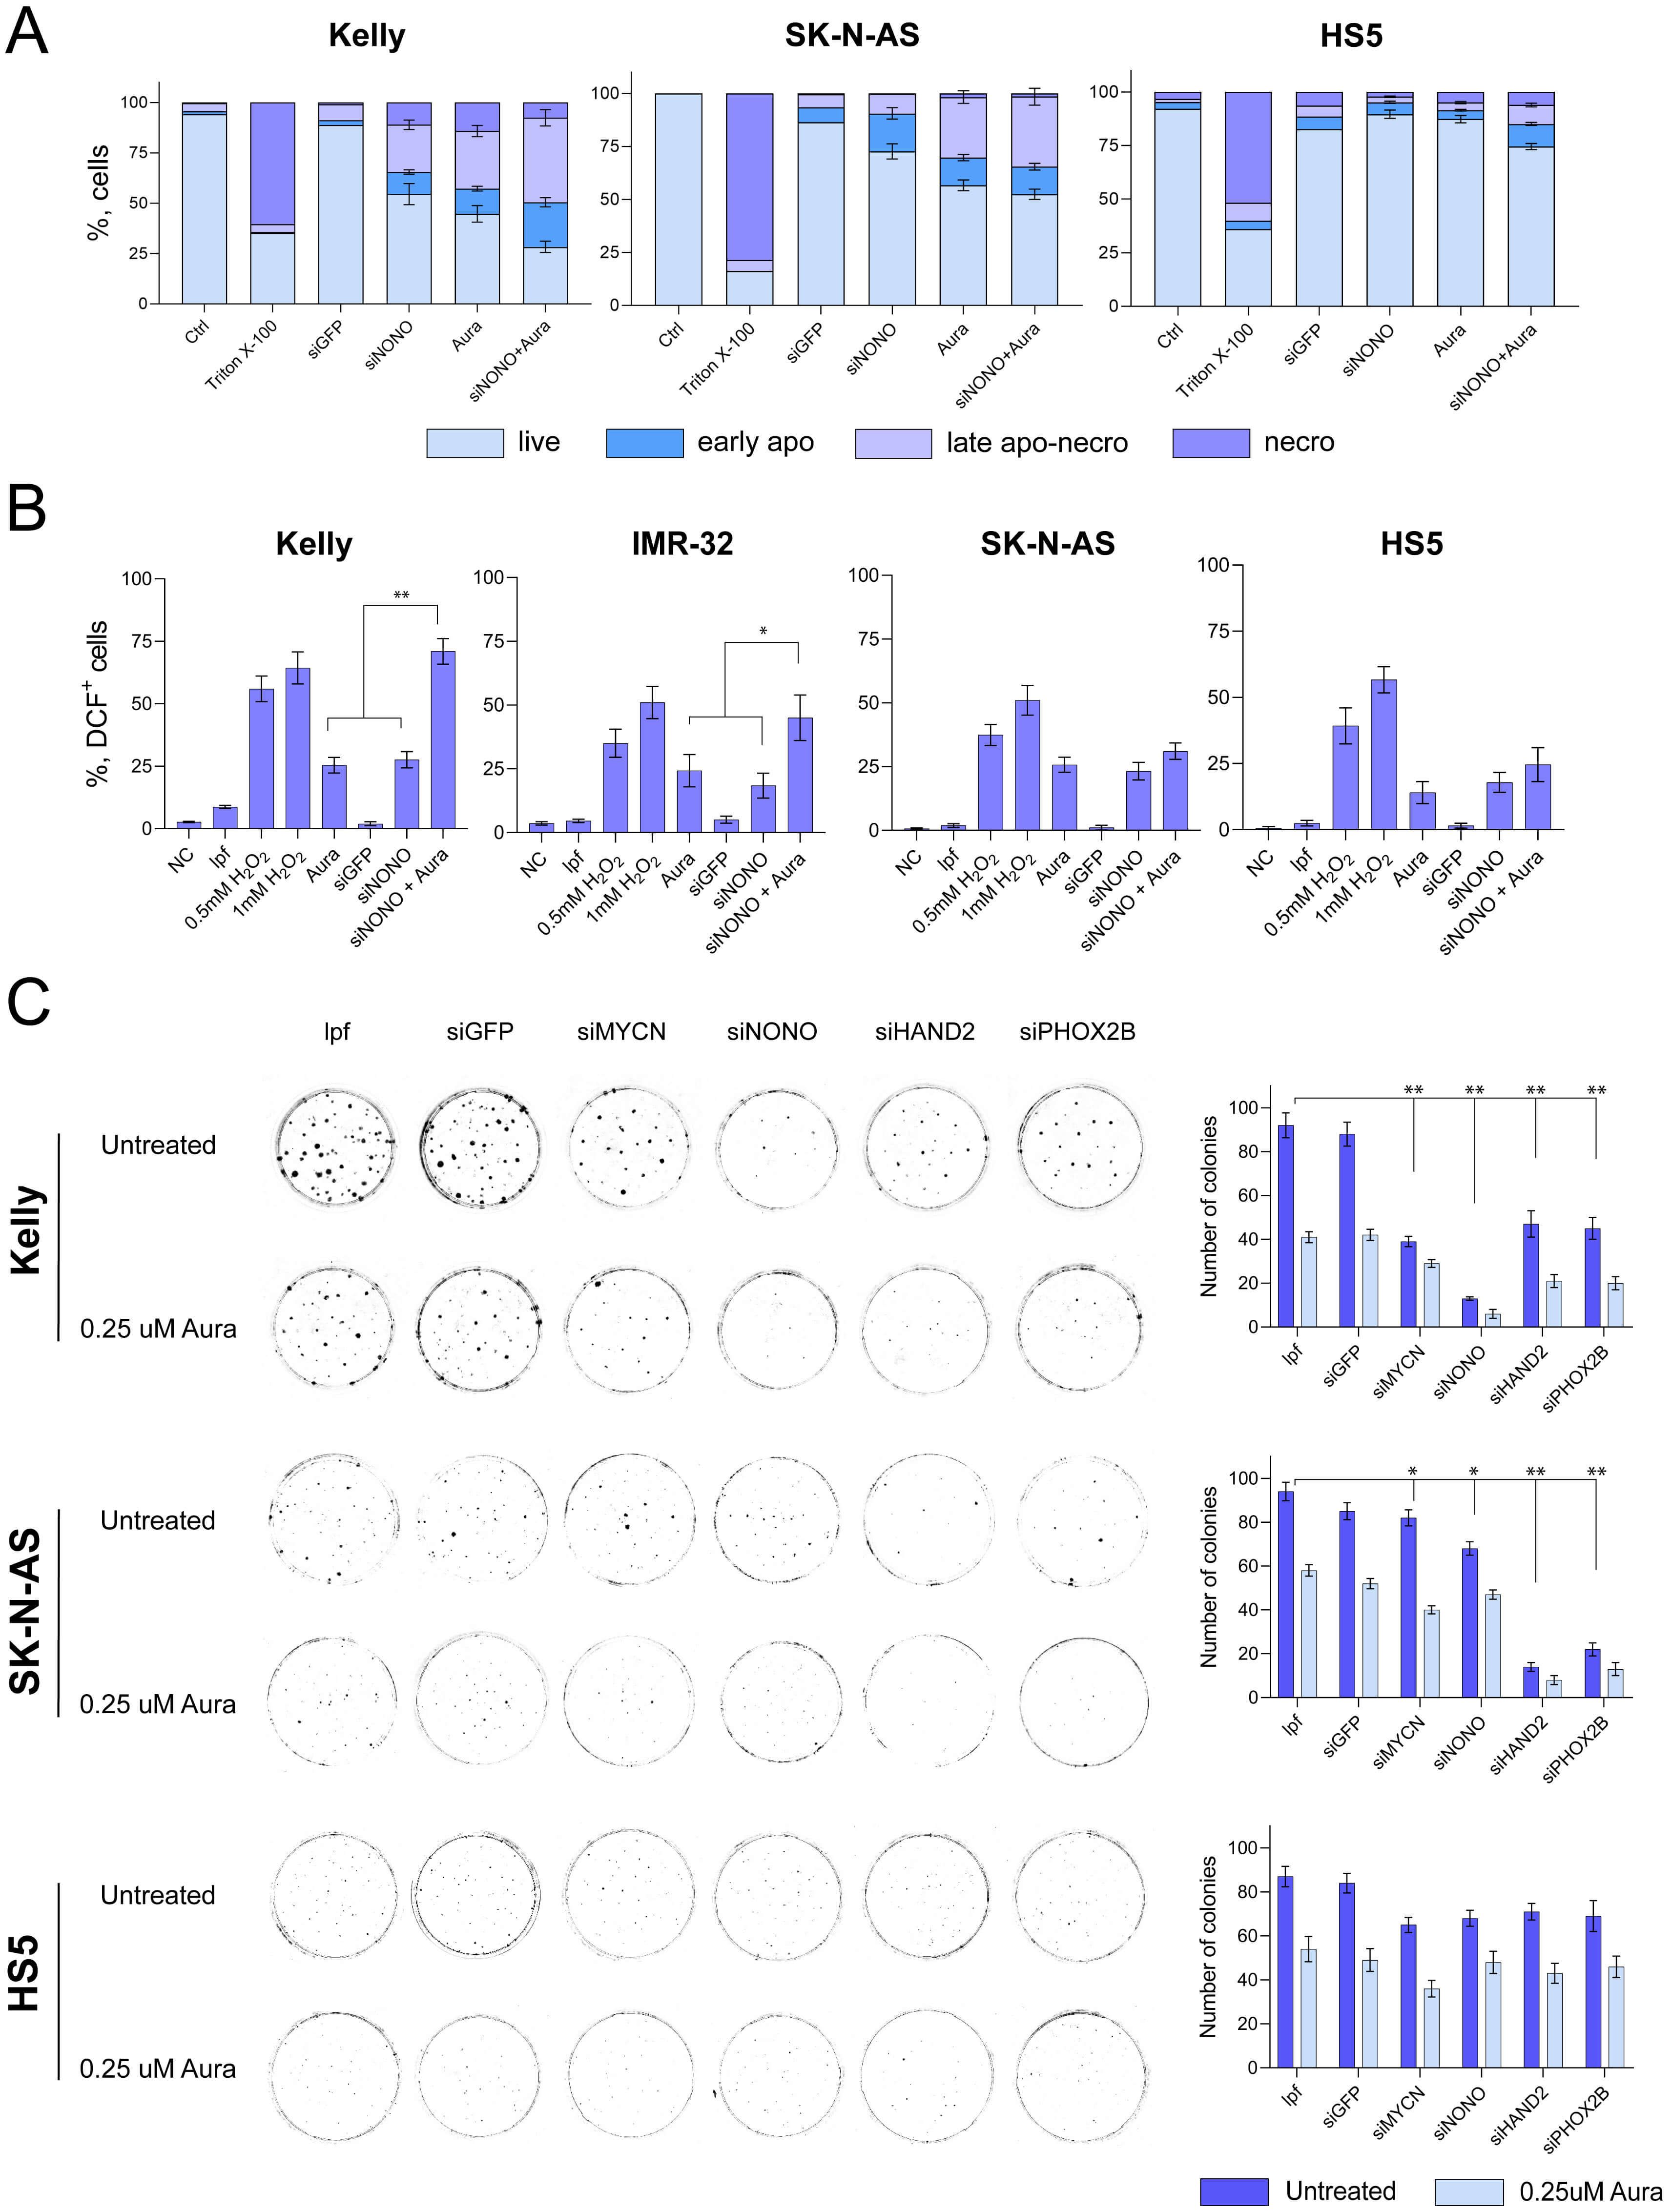 Fig. 3.
Effects of auranofin (Aura) and NONO knockdown on
intracellular ROS content and gene expression. (A) Distribution of cell
sub-populations stained with YO-PRO™-1 and PI following gene
inactivation (siGFP, siNONO) and auranofin (0.5 µM, 48 h) treatment in
Kelly, SK-N-AS and HS5 cell lines. Live, living cells; early apo, early
apoptosis; late apo-necro, late apoptosis and necrosis; necro, necrotic fraction.
(B) Intracellular ROS generation in cells pre-treated with DCFH2-DA and
exposed to indicated agents. Shown are the percentages of cells with elevated ROS
(DCF+). lpf, liposomes. (C) Colony formation assay 14 days
after transfection with the respective siRNAs and treatment with 0.25 µM
auranofin (24 h). Data are mean
Since we observed that auranofin can inactivate NONO on a protein level (Fig. 2B), we hypothesized that this effect stems not as much from direct NONO inhibition by auranofin but from altered intracellular redox balance in response to TrxR1 inhibition. To test this assumption, we examined the effect of auranofin on intracellular ROS generation using flow cytometry-assisted detection of DCFH2-DA dye fluorescence. H2O2 (0.5 mM) was used as a control for intracellular ROS accumulation [48]. As shown in Fig. 3B and Supplementary Fig. 4, auranofin (0.5 µM) rapidly increased the portion of DCF-bright events in NB cells (Kelly, IMR-32 and SK-N-AS) and, to a lesser extent, in non-malignant HS5 fibroblasts. Importantly, treatment with siNONO phenocopied the ROS-inducing effect of auranofin. Moreover, the combination of 0.5 µM auranofin and siNONO further elevated (up to ~50–75%) the percentage of DCF-bright cells in Kelly and IMR-32 cells.
Next, clonogenic assays were performed to evaluate the long-term effects of siNONO+auranofin combination on NB cell survival. Unlike shorter treatments, these experiments assessed cytotoxic potency via single-cell survival 14 days post-treatment. Fig. 3C shows that, alone, siRNAs NONO, MYCN, HAND2 and PHOX2B decreased the clonogenic survival whereas the CRC-unrelated siGFP had no effect. Most importantly, each knockdown was synergistic with sublethal (0.25 µM) concentration of auranofin. As in other assays, the most pronounced effect was observed in Kelly cells: siNONO was the most potent alone (~10-fold reduction of colony numbers vs. vehicle control) and together with auranofin (~20-fold reduction). In SK-N-AS cells, siRNAs against HAND2 and PHOX2B showed the best inhibitory effects (5–7-fold decrease of colony numbers). In HS5 fibroblasts, the cytotoxicity of auranofin, alone or together with each CRC-specific siRNAs, was significantly lower compared to NB cell lines.
In summary, intracellular ROS generation by submicromolar concentrations of auranofin altered the expression of the MYCN, NONO, HAND2 and PHOX2B genes in NB cell lines, the MYCN-amplified Kelly cell line being the most sensitive. Although each of these genes is differentially regulated by auranofin, the combinations of this drug with knockdown of NONO (Kelly) or HAND2 (SK-N-AS) substantially increased the cytotoxic potency. These data provide evidence in support of CRC members as regulators of redox status in NB cells. This function of NONO has not been previously documented.
In this study, we identified the multifunctional RNA/DNA-binding protein NONO as a novel regulator of intracellular redox status in NB cells. Transient NONO inactivation mimicked ROS generation in response to the TrxR1 antagonist auranofin. Combinations of NONO knockdown and auranofin were preferentially cytotoxic for MYCN-amplified (ADRN state-related) NB cells. Two lines of evidence support this conclusion: first, auranofin rapidly decreased the abundance of NONO mRNA and protein. Second, siNONO phenocopied ROS elevation by auranofin. Intracellular oxidation down-regulated CRC genes HAND2 and PHOX2B. Most importantly, combinations of auranofin and siNONO potently reduced long-term survival of MYCN-amplified cells while evoking less pronounced effect in single MYCN copy NB cells and sparing non-malignant counterparts. These observations provide evidence for a bidirectional link between NONO and cellular redox homeostasis: oxidation attenuates NONO mRNA/protein and, conversely, NONO knockdown exacerbates intracellular oxidation.
Mechanistically, several not mutually exclusive models may account for the observed phenomena: (i) direct modification of NONO (e.g., oxidation of redox-sensitive cysteine residues) could impair its binding to nucleic acids or promote proteasomal degradation; (ii) ROS-dependent limitation of availability of NONO-interacting partners (splicing factors, paraspeckle components, or RNA helicases) may reduce NONO stability or function; (iii) NONO loss may derepress transcriptional programs that activate mitochondrial respiration or diminish the antioxidant capacity (for instance, transcriptional down-regulation of glutathione peroxidase 1 in glioblastoma [49]), thereby producing a feed-forward ROS increase. Importantly, our data do not distinguish between these possibilities. The observed decrease in NONO mRNA and protein (Fig. 1C, Fig. 2B) could result from transcriptional repression, altered mRNA stability, enhanced proteasomal degradation, or a combination of these events. Disentangling these mechanisms will require measurements of NONO mRNA half-life, proteasome inhibition assays, and mass spectrometry-based identification of oxidative post-translational modifications.
It is known that MYCN amplification confers a transcriptional and metabolic state characterized by an elevated anabolism and dependence on robust antioxidant systems [50]. Our observation that MYCN-amplified cells were preferentially sensitive to auranofin and siNONO is consistent with the hypothesis that CRC integrity and redox status are interdependent vulnerabilities in ADRN NB. This selective vulnerability can be explained by mechanisms inherent in MYCN biology. First, MYCN-amplified cells operate under constitutive replicative and metabolic stress, leading to a heightened basal ROS load that renders them particularly dependent on antioxidant buffers like Trx system; thus, TrxR1 inhibition by auranofin pushes these cells beyond a critical redox threshold more readily than their non-amplified counterparts [42, 50]. Second, the ADRN cell identity maintained by CRC is a hallmark of MYCN-amplified tumors, making them exquisitely reliant on the transcriptional coherence. Silencing NONO likely causes a disproportionate disassembly of the CRC network, as evidenced by the pronounced downregulation of HAND2 and PHOX2B specifically in the Kelly cell line (Fig. 2A,B). Third, although not directly measured here, elevated NONO expression has been correlated with poor prognosis in NB [34], suggesting that MYCN-amplified tumors may exhibit a higher ‘oncogenic addiction’ to NONO function, making its suppression detrimental. NONO’s role in the maintenance of CRC network and association with MYCN mRNA [51] surmises that NONO suppression can weaken the transcription-driven proliferation and impair adaptive responses to oxidative stress. The loss of clonogenic survival by the auranofin-siNONO combination likely reflects a collapse of lineage-defining transcription and compensatory antioxidant defenses in cells metabolically stressed by MYCN amplification. These findings highlight NONO as an exploitable intersection of transcriptional tuning for adaptation to redox imbalance.
One of the most intriguing findings of this study is the differential regulation of core CRC genes by auranofin and siNONO. While siNONO alone downregulated HAND2 and PHOX2B, auranofin markedly triggered their upregulation, particularly in MYCN-amplified cells (Fig. 2A,B). This apparent paradox, i.e., activation of pro-survival genes by a pro-oxidant agent, can be interpreted within a model of a ‘compensatory stress response’ [42, 50]. MYCN-driven cells exist in a state of precarious homeostasis, contingent on both robust antioxidant systems and a coherent CRC. We propose that acute oxidative stress induced by auranofin acts as an alarm signal, triggering a rapid transcriptional response to reinforce the core identity by activating its key nodes (HAND2, PHOX2B). However, when this stress is applied to a cell with compromised CRC network due to NONO inactivation, the compensatory overexpression becomes maladaptive. The cell is forced to execute a transcriptional program without the proper regulatory machinery (NONO) under a prolonged metabolic/redox dysfunction, leading to a collapse. This model explains the dramatic synergy observed in clonogenic assays (Fig. 3C): the initial, seemingly pro-survival signal (auranofin-induced CRC gene expression) creates a state of heightened dependency, making the cell exquisitely vulnerable to NONO suppression. Thus, stress-induced adaptation, when pushed beyond a critical threshold, becomes the trigger for cell death.
Auranofin has a clinical history as an anti-rheumatoid drug owing to its potent and irreversible inhibition of TrxR1 [52]. As a repurposing candidate, auranofin has been explored in cancer treatment. Our data support the concept that transient induction of oxidative stress can lead to targeted destabilization of individual CRC members (HAND2, PHOX2B) to achieve a pronounced long-term lethality in MYCN-amplified NB. Importantly, auranofin has been reported to inactivate NONO at least indirectly as a part of metabolic response to intracellular oxidation [45]. However, the opportunities of translation of auranofin into clinical oncology, particularly for pediatric tumors, faces considerable challenges. Main limitations include a narrow therapeutic ‘window’ and dose‑limiting adverse systemic effects such as hepatic and renal toxicity [53, 54]. Moreover, as a TrxR1 inhibitor, auranofin can affect both tumor and normal cells, which raises concerns about its selectivity. Clinical trials of auranofin monotherapy in solid tumors have shown limited efficacy, likely due to tumor adaptation through compensatory antioxidant pathways [55]. Pharmacokinetics and long‑term safety profiles in children remain inadequately studied, necessitating caution [56]. Combinatorial strategies such as pairing low, potentially safer doses of auranofin with targeted molecular interventions like NONO suppression may offer a more viable route to enhance selectivity and reduce off‑target toxicity while achieving synergistic anticancer effects [57]. Recent discovery of (R)-SKBG-1 compound that covalently binds to a critical cysteine residue in NONO [35] provided a unique instrument for direct pharmacological NONO inactivation. It is of particular interest to investigate whether (R)-SKBG-1 evokes similar effects on ROS content and CRC gene expression as auranofin and siNONO. Also, protein degraders using (R)-SKBG-1 structure for NONO recognition (PROTAC-like approaches) are likely to be feasible. The fact that auranofin is an approved drug could accelerate early clinical testing of combinations given that safety considerations, particularly systemic oxidative stress and off-target toxicities, are rigorously evaluated. Notably, our data suggest a certain selectivity, as non-malignant HS5 fibroblasts were less susceptible to the combination treatment.
NB displays lineage plasticity between ADRN and MES states, and treatment-induced selection or trans-differentiation toward MES phenotypes has been associated with resistance [15]. Oxidative stress, a condition that accompanies NB growth in a mouse model [58], can favor state transition or select for MES-like cells that survive ROS insult [59]. Alternatively, ROS burst may activate compensatory transcriptional programs that involve HAND2/PHOX2B before terminal collapse. Future work should address the question of whether the surviving cells acquire MES phenotype(s) and evaluate the regimens that impede plasticity by combining NONO attenuation with inhibitors of pathways that support MES survival. Likewise, up-regulation of alternative antioxidant systems (glutathione biosynthesis, NADPH-producing enzymes) may produce resistance; profiling adaptive transcriptomic and metabolomic responses will be essential to design durable combinations.
We acknowledge that our conclusions regarding NONO’s role in maintaining CRC integrity are drawn from changes in expression of HAND2 and PHOX2B, rather than from direct chromatin occupancy or enhancer activity assays. This constitutes a limitation of the current study. However, we argue that these two factors serve as reliable sentinels of CRC functionality in MYCN-amplified neuroblastoma for several reasons. First, both HAND2 and PHOX2B are established core components of the ADRN CRC, identified through genome-wide CRISPR screens as essential for the survival of MYCN-driven cells [27, 28]. Their expression levels are tightly coupled to the functional state of the super-enhancer network that defines this lineage [44]. Second, mechanistic studies have demonstrated that NONO directly binds to and regulates the processing of HAND2 and other CRC-associated transcripts, acting as a post-transcriptional guardian of this circuitry [31, 33]. Therefore, the pronounced downregulation of HAND2 and PHOX2B upon NONO knockdown (Fig. 2A,B) is consistent with a disruption of known functions of NONO. While studies employing ChIP-seq for NONO or CRC-associated histone marks (e.g., H3K27ac) are expected to provide a deeper mechanistic insight, our current data establish an initial functional link between NONO suppression, destabilization of key CRC transcription factors, and subsequent cell death.
Moreover, the precise molecular mechanism by which oxidative stress downregulates NONO remains to be further elucidated. While we demonstrated a clear functional link between auranofin-induced ROS, decreased NONO expression, and CRC destabilization, our study does not address the question of whether this occurs at the transcriptional, post-transcriptional, or post-translational levels. Although attractive, a possibility that NONO is a direct sensor of redox deregulation requires molecular validation. These open questions highlight the need for transcriptome/proteome analyses and RNA stability assays to map oxidative modifications on NONO and its interacting partners.
This study establishes NONO as a mechanistic link between oxidative stress and the core regulatory circuitry in neuroblastoma. We demonstrate a bidirectional relationship in which auranofin-induced ROS downregulate NONO expression, while NONO knockdown itself elevates intracellular ROS. This interplay preferentially destabilizes the adrenergic transcriptional program, leading to suppression of CRC factors HAND2 and PHOX2B and a profound loss of clonogenic survival when NONO attenuation is combined with sublethal oxidative stress (Fig. 4). Importantly, MYCN-amplified cells exhibit heightened sensitivity to this dual insult, whereas non-malignant fibroblasts remain largely spared. These findings identify NONO as a therapeutically exploitable vulnerability in high-risk neuroblastoma and provide a rationale for combinatorial strategies that disrupt both CRC integrity and redox homeostasis.
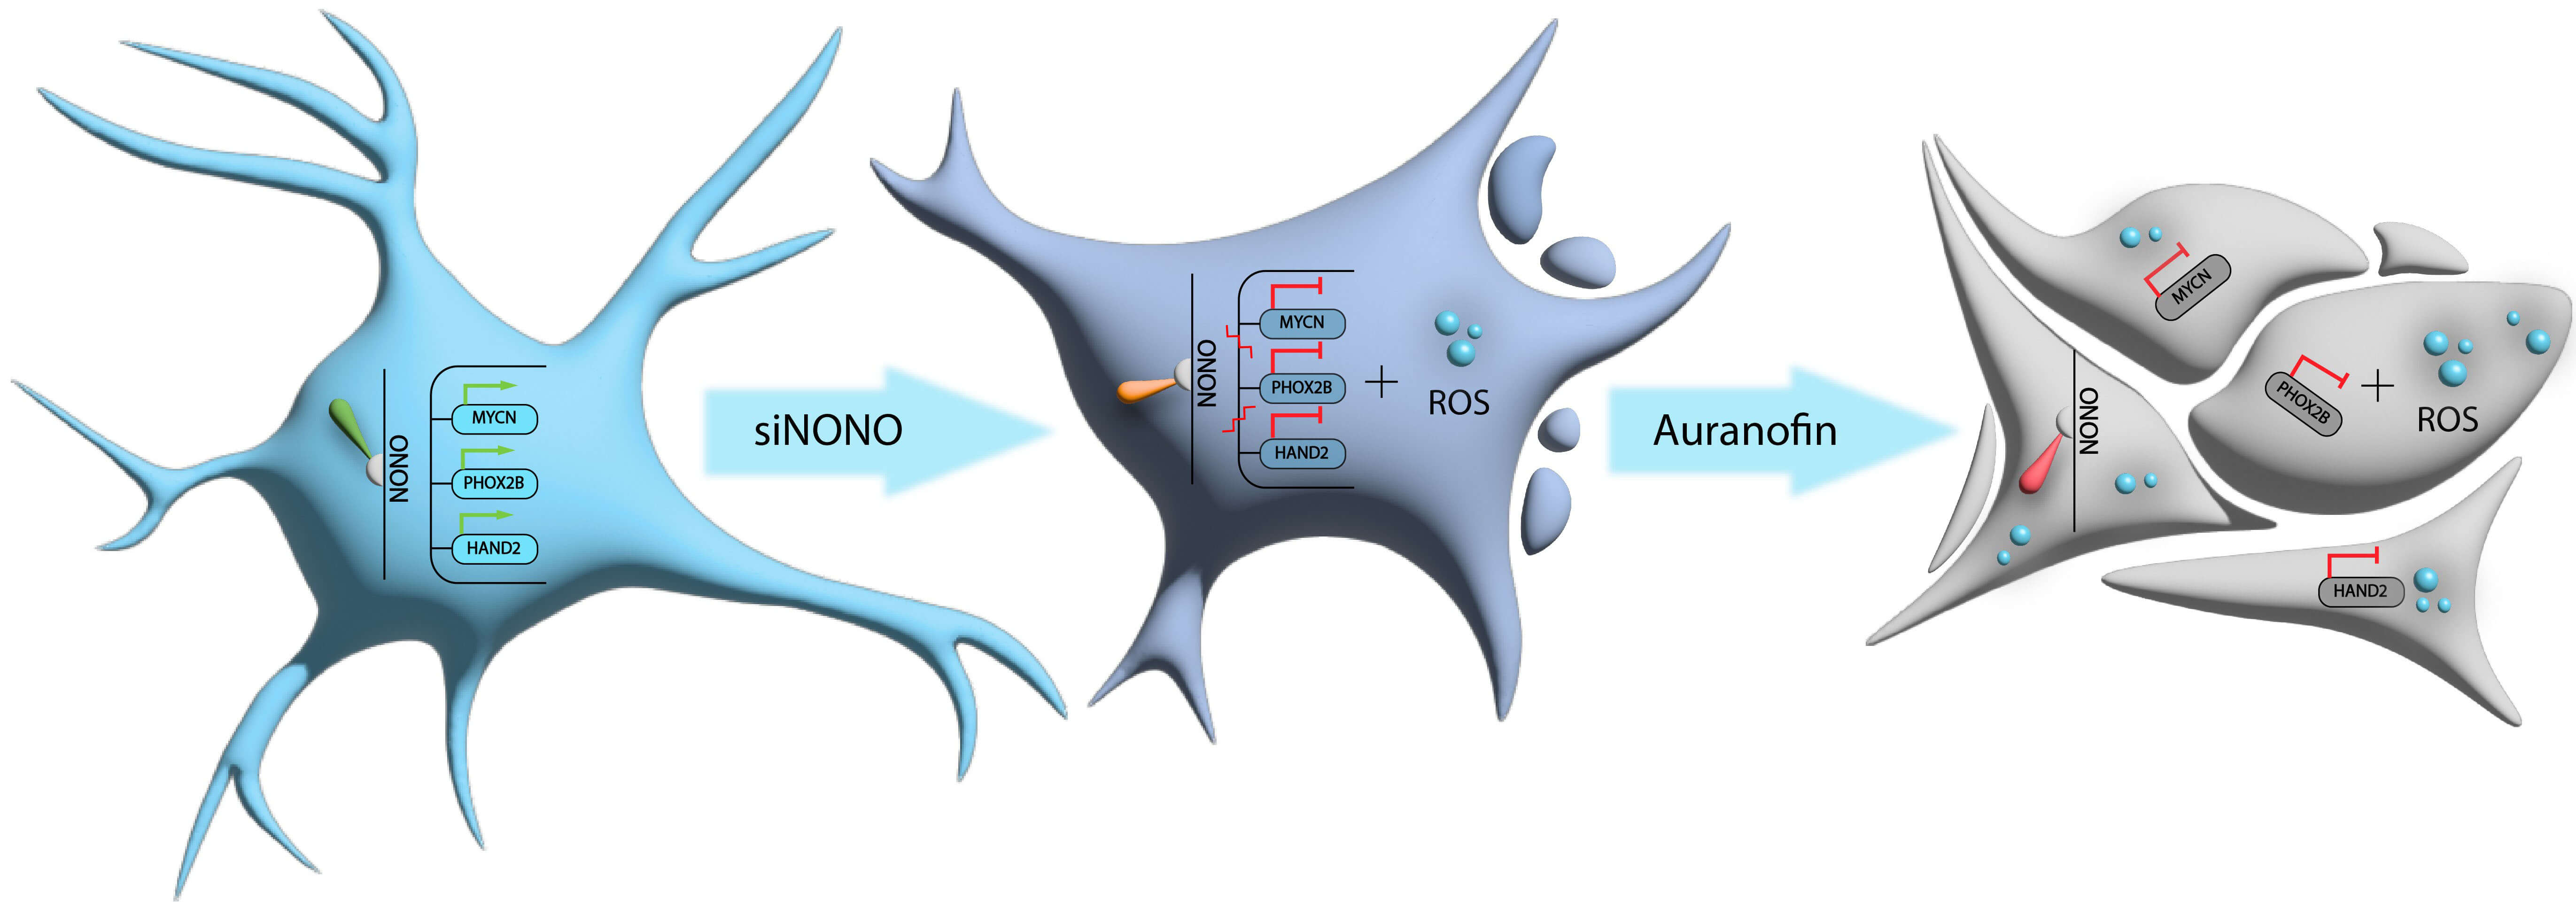 Fig. 4.
Auranofin and NONO knockdown synergize in triggering intracellular oxidation and death in NB cells. From left to right: intact neurocyte (blue); intracellular ROS generation and altered CRC gene expression in response to auranofin (pink); additional exposure to siNONO exacerbates redox imbalance leading to apoptosis (gray). Blue circles, ROS species; green lines, positive regulation; red lines, down-regulation. Made with Adobe Illustrator 2025.
The paper is listed as “NONO as a Sensor of Intracellular Oxidation: Relevance to Neuroblastoma Cell Death” as a preprint on bioRxiv at: https://www.biorxiv.org/content/10.1101/2025.10.30.685543v1.
ADRN, adrenergic; CDKN1A, cyclin-dependent kinase inhibitor 1A; CRC, core regulatory circuitry; GFP, green fluorescent protein; HAND2, heart and neural crest derivatives expressed 2; lpf, liposomes; NB, neuroblastoma; MES, mesenchymal; PHOX2B, paired-like homeobox 2B; ROS, reactive oxygen species; siRNA, small interfering RNA; TrxR1/TXNRD1, thioredoxin reductase 1.
The raw immunoblotting and flow cytometry data presented in this article are available from the lead contact upon request. The sources of datasets supporting the conclusions of this article are included within the article and its Supplementary Materials. All data supporting our findings are available from the corresponding author upon reasonable request.
Conceptualization: AAS and OAK. Methodology: SSP, OOM, LVM and OAK. Validation: SSP, OOM and LVM. Formal analysis: SSP, OOM and OAK. Data curation: NVA and AAS. Writing original draft: SSP, OOM, LVM, AAS and OAK. Visualization: SSP and OAK. Funding acquisition: NVA. All authors contributed to editorial changes in the manuscript. All authors read and approved the final manuscript. All authors have participated sufficiently in the work and agreed to be accountable for all aspects of the work.
Not applicable.
The authors are grateful to V.S. Leizerovich for providing auranofin, and to Dr. G.S.Kopeina (Moscow State University) for sharing the antibody to cleaved PARP1.
This work was supported by the Russian Science Foundation, grant 24-15-00097.
The authors declare no conflict of interest.
Supplementary material associated with this article can be found, in the online version, at https://doi.org/10.31083/FBL48544.
References
Publisher’s Note: IMR Press stays neutral with regard to jurisdictional claims in published maps and institutional affiliations.