


 , Jishen Feng 1, Zhengkai Fang 1, Yuhao Jiang 1, Jinzhong Duanmu 1, Xin Yu 2, Junfu Wang 1, Qunguang Jiang 1,*
1 Department of General Surgery, The 1st Affiliated Hospital, Jiangxi Medical College, Nanchang University, 330006 Nanchang, Jiangxi, China
2 Department of Oncology, The 1st Affiliated Hospital, Jiangxi Medical College, Nanchang University, 330006 Nanchang, Jiangxi, China
Abstract
To generate a single-cell atlas of colorectal cancer (CRC) development in Lynch syndrome (LS), and to delineate the associated cellular reprogramming and intercellular communication networks.
We performed single-cell RNA sequencing (scRNA-seq) on matched normal mucosa, adenoma, and carcinoma tissues obtained from patients with LS. Following quality control and batch-effect correction, we used the Uniform Manifold Approximation and Projection (UMAP) clustering and marker gene analyses to annotate cell types, differential expression analyses to identify stage-specific genes, and GSVA analyses to assess pathway activity. Functional assays with patient-derived organoids and transwell experiments were employed to validate the role of DMBT1. Cell–cell communication networks were inferred using Cell Chat.
We identified twelve distinct cell clusters and observed marked shifts in cellular composition during CRC progression, including increased T lymphocytes and macrophages and decreased epithelial cells. Trajectory analyses suggested a potential differentiation path from BEST4+ to CEMIP+/EGFR+ epithelial cells. DMBT1 was consistently down-regulated and its depletion activated the WNT/β-catenin pathway, enhancing organoid growth and cell migration. Expansion of CCR8+ regulatory T cells and C1QC+/IDO1+/IL1B+ macrophages indicated an immunosuppressive and pro-tumorigenic microenvironment.
This study provides a comprehensive single-cell resource for LS-associated CRC and highlights DMBT1 loss, epithelial remodelling, and immune dysregulation as potential therapeutic targets.
Keywords
- colorectal neoplasms
- lynch syndrome
- single-cell analysis
- RNA sequencing
- tumor microenvironment
Globally, colorectal cancer (CRC) ranks third in incidence and second in mortality among cancers, posing a significant threat to public health. CRC is a highly heterogeneous disease, which can be molecularly classified into four consensus molecular subtypes (CMS1, CMS2, CMS3, and CMS4) [1]. In 2022, there were approximately 1.92 million new cases and 904,000 deaths, with sporadic (non-hereditary) CRC accounting for about 65% of all new cases [2]. The adenoma-carcinoma sequence is an established model for the development of sporadic CRC, where adenomas are considered the primary precancerous lesions that may lead to the development of CRC. The development of colorectal cancer typically progresses from intestinal polyps to adenomas and ultimately evolves into adenocarcinomas through a multi-stage process [3]. However, the transformation of normal colon tissue into cancer, as well as the molecular events driving this change, remain incompletely understood.
Lynch syndrome (LS) is a hereditary condition that significantly increases the risk of CRC and several other cancers. It is caused by germline mutations in DNA mismatch repair genes (e.g., MLH1, MSH2, MSH6, PMS2) or the EPCAM gene [4]. LS-related CRCs are characterized by early-onset, a high frequency of proximal colon tumors, and microsatellite instability (MSI) due to defective DNA mismatch repair [5]. The unique molecular features and early onset of LS-related CRC highlight the importance of understanding its pathogenesis at the cellular and molecular levels.
Recent advances in single-cell RNA sequencing (scRNA-seq) have significantly enhanced our ability to analyze transcriptomes across thousands of individual cells, making it a powerful tool for revealing differences in gene expression states within single cells [6]. This technology has been widely applied in CRC research, providing insights into tumor heterogeneity and cancer progression [7]. However, most existing scRNA-seq studies focus on advanced-stage tumors, with limited exploration of the cellular and molecular changes during the transition from normal to precancerous and cancerous states in LS-related CRC. This gap in knowledge underscores the necessity and innovation of constructing a single-cell atlas for LS-related CRC progression. By employing scRNA-seq, we aim to delineate the dynamic changes in cellular composition and states from normal colon tissue to precancerous adenomas and CRC in LS patients, uncover early molecular alterations and identify novel intervention points.
In this study, we plan to obtain normal colon (N), adenoma poly (P), and carcinoma tissue (T) specimens from the same patient with concurrent adenoma and carcinoma in Lynch syndrome, and explore them through scRNA-seq. We aim to delineate the dynamic changes in cellular composition and cell states during the transition from normal colon tissue to precancerous adenoma to CRC, providing a scientific basis for understanding the mechanisms of cancer initiation and evolution, as well as for developing prevention and treatment strategies.
A total of four LS patients (1 female and 3 males; median age 56.5 years) who fulfilled the Amsterdam II criteria and demonstrated loss of MMR proteins by IHC were enrolled. IHC screening revealed combined MLH1/PMS2 loss in two cases, combined MSH2/MSH6 loss in one case, and isolated MSH6 loss in the remaining case. The inclusion criteria for the study samples were as follows: (1) Patients pathologically diagnosed with colorectal adenocarcinoma and confirmed by colonoscopy to have concurrent adenoma lesions. (2) Three paired samples obtained from the same patient during surgery: normal colonic mucosal tissue more than 5 cm from the tumor edge (verified by HE staining and immunohistochemistry to be free of cancerous and inflammatory changes), traditional adenoma tissue diagnosed according to WHO criteria, and primary cancer tissue (AJCC 8th edition TNM staging of T2-3N0M0). (3) Confirmed by immunohistochemistry to have loss of expression in at least two of the four mismatch repair proteins MLH1, MSH2, MSH6, and PMS2 (consistent with the molecular characteristics of Lynch syndrome). (4) No preoperative neoadjuvant chemotherapy, radiotherapy, or immunotherapy. (5) Tissue sample volume greater than 0.5 cm3, with preprocessing completed within 30 minutes after excision, and single-cell suspension viability greater than 90% as verified by trypan blue staining. Exclusion criteria: (1) Coexistence with other hereditary cancer syndromes (such as FAP, Peutz-Jeghers syndrome). (2) Presence of multiple primary colorectal tumors or metastatic tumors. (3) Sample collection areas with active infections or ulcerative lesions. Surgically resected cancerous tissues, adenoma tissues, and normal colonic mucosa samples were collected. Clinical pathological data were simultaneously recorded for subsequent analysis.
Prepare a cell buffer containing 1% BSA using PBS (Biosharp, Hefei, Anhui,
China) and bovine serum albumin (Solarbio, Beijing, China). Simultaneously,
prepare a mixed digestion solution of type IV collagenase (2 mg/mL, Sigma, St.
Louis, MO, USA) and DNase (1 mg/mL, Sigma) using PBS as the solvent, and pre-warm
it at 37 °C for later use. Dilute the 10
After confirming cell viability
The raw sequencing data (FASTQ format) were aligned to the GRCh38 reference
genome using STAR (v2.7.11b, Cold Spring Harbor Laboratory,
https://github.com/alexdobin/STAR) alignment based on Cell Ranger (v4.0,
10
The top 2000 most variable feature genes were selected using the
FindVariableFeatures function (based on the vst algorithm), with the selection
criteria considering both the mean expression and coefficient of variation to
ensure the capture of transcripts with significant biological relevance. During
the principal component analysis phase, an iterative feature selection strategy
was employed, and the top 30 principal components (cumulatively explaining
Phenotypic annotation of subpopulations was conducted by integrating the CellMarker database and literature. For the target subpopulation, differentially expressed genes (top 10 high/low expression genes) were extracted, and GSEA or GSVA analyses were performed to reveal their biological characteristics. Cell-cell communication analysis was further conducted to investigate intercellular interactions.
Samples were transferred into pre-chilled RPMI-1640 on ice within 5 min. Under sterile conditions, wash the tissue blocks three times with PBS to remove blood and mucus. Cut the tissue into small pieces of about 1–3 mm3 using a scalpel and forceps. Incubate the tissue pieces in a digestion solution containing collagenase and hyaluronidase at 37 °C and 150 rpm for 30–60 minutes. Gently shake the mixture every 10 minutes to ensure uniform digestion. After digestion, filter the digest through a 70 µm cell strainer and collect the cell clusters in the filtrate. Terminate the digestion by centrifuging the cell clusters at 300 g for 5 minutes and resuspend the cell pellet in RPMI-1640 culture medium containing 10% fetal bovine serum. Wash the cell pellet again with PBS and collect it by centrifugation at 300 g for 5 minutes.
Suspend the cell pellet in pre-cooled organoid culture medium. The organoid culture medium is based on an advanced stem cell culture system and contains essential components. Mix the cell suspension with Matrigel to allow the cells to anchor and form a 3D structure. Pipette 20–50 µL drops of the cell - Matrigel mixture into the U-shaped wells of a 24-well plate. Gently rock the culture plate to form uniform cell clusters. Place the culture plate in a 37 °C incubator with 5% CO2 for 30 minutes to allow the Matrigel to solidify. Add 500–800 µL of organoid culture medium to each well to ensure the organoids are completely submerged. Change the culture medium every 2–3 days to maintain a stable growth environment for the organoids.
When the organoids grow to a diameter of about 100–200 µm, they can be passaged. Collect the culture medium containing the organoids and filter it through a 40 µm cell strainer to collect the organoids. Wash the organoids with PBS and centrifuge them at 100 g for 3 minutes to remove residual culture medium. Suspend the organoids in a dissociation solution containing 0.25% trypsin and EDTA and incubate at 37 °C and 150 rpm for 5–10 minutes. Monitor the dissociation process closely to avoid over-dissociation that may damage the cells. Gently pipette the suspension every 2–3 minutes to promote the dissociation of organoids into cell clusters or single cells. After dissociation, immediately add RPMI-1640 culture medium containing 10% fetal bovine serum to terminate the reaction. Filter the suspension through a 70 µm cell strainer to collect the cell clusters. Wash the cell clusters with PBS, centrifuge them at 100 g for 3 minutes, and resuspend them in organoid culture medium. Passage the organoids according to the initial culture method to maintain their long-term growth and stable characteristics.
Regularly observe the morphological characteristics of the organoids under an inverted microscope, such as cell arrangement, size, and number. Perform immunofluorescence staining to detect the expression of colorectal-specific markers (such as CK20 and CDX2) in the organoids to verify the cell type and tissue origin of the organoids. Compare the genomic and transcriptomic features of the organoids with those of the original tumor tissue using whole-exome sequencing and gene expression profiling to assess the consistency between the organoids and the original tumor at the genetic and molecular levels. This ensures that the organoid model accurately reflects the biological characteristics of colorectal cancer, providing a reliable experimental model for subsequent drug screening and mechanism research.
SW480 cells were purchased from the American Type Culture Collection (ATCC,
CCL-228). Upon receipt, the cell line was authenticated by STR profiling against
the ATCC database and tested negative for mycoplasma contamination by
PCR-fluorescence. Cells were used within 10 passages. The SW480 cell line was
used and seeded in 6-well plates at a density of 500 cells/well, followed by
continuous incubation in a 37 °C, 5% CO2 constant-temperature
incubator for 14 days. After incubation, the cells were washed twice with PBS,
stained with 0.1% crystal violet solution at room temperature for 20 minutes,
rinsed with distilled water to remove residual stain, and air-dried naturally.
Colonies with a diameter
Transwell chambers with an 8µm pore size (Corning) were used. 5
Tissue blocks were fixed in 4% paraformaldehyde for 24 h, paraffin-embedded,
sectioned at 4 µm, and subjected to routine hematoxylin-eosin staining.
Representative images were acquired on an Olympus BX53 (Olympus Corporation,
Tokyo, Japan) microscope at 200
Formalin-fixed, paraffin-embedded (FFPE) tissues (normal colonic mucosa,
adenoma, and colorectal cancer) from Lynch syndrome patients were sectioned into
4-µm slices. IHC staining was performed per standard protocols with minor
modifications. Sections were deparaffinized, rehydrated, and subjected to antigen
retrieval in citrate buffer (pH 6.0) by pressure cooking. Endogenous peroxidase
activity was blocked with 3% H2O2, followed by non-specific binding
blocking with 5% BSA at 37 °C for 30 minutes. Sections were incubated overnight
at 4 °C with primary antibodies against DMBT1 (Cat. No.: 27069-1-AP, Proteintech,
Proteintech, Rosemont, IL, USA; 1:200), BEST4 (Cat. No.: HPA058564, Triple A
Polyclonals, Triple A Polyclonals, Heidelberg, Germany; 1:150), CEMIP (Cat. No.:
31106-1-AP, Proteintech, Rosemont, IL, USA; 1:200), and EGFR (Cat. No.:
IHC-00005, Invitrogen, Waltham, MA, USA; 1:100), respectively. After washing,
HRP-conjugated secondary antibody (1:200) was applied at 37 °C for 30 minutes.
Signals were visualized with DAB, and sections were counterstained with
hematoxylin, dehydrated, and mounted. Stained sections were photographed at
To stably silence DMBT1 expression, lentiviral vectors (pLKO.1) carrying short hairpin RNA (shRNA) targeting human DMBT1 were constructed. Based on validated sequences from previous studies, the following target sequences were synthesized: sh-DMBT1 #1: 5′-ACCTTGAGGTTGGTCAATTTACTCGAGTAAATTGACCAACCTCAAGGT-3′ and sh-DMBT1 #2: 5′-TCCGTGTACCTGCGTTGTAAACTCGAGTTTACAACGCAGGTACACGGA-3′. A non-targeting scrambled sequence (5′-CCTAAGGTTAAGTCGCCCTCGCTCGAGCGAGGGCGACTTAACCTTAGG-3′) was used as a negative control (Vector). Cells were seeded in 6-well plates and transduced with lentiviral particles at an appropriate multiplicity of infection (MOI) in the presence of 8 µg/mL polybrene. After 48 hours, the cells were subjected to selection with 2–5 µg/mL puromycin for 7–10 days to establish stable knockdown cell lines. The knockdown efficiency was rigorously validated at both mRNA and protein levels via RT-qPCR and Western Blot, respectively, prior to subsequent functional assays.
Handled samples (Ctrl, Vector, shDMBT1-1, shDMBT1-2) were collected, and total protein was extracted using pre-cooled RIPA lysis buffer supplemented with protease and phosphatase inhibitors, followed by quantification using the BCA method. Equal amounts of protein (typically 20–30 µg) were mixed with loading buffer, denatured by boiling, and separated by SDS-PAGE electrophoresis. The proteins were then transferred to PVDF membranes using constant-current wet transfer. Non-specific binding sites were blocked with 5% non-fat milk or BSA solution at room temperature for 1 hour.
The membranes were incubated overnight at 4 °C on a shaker with diluted primary
antibodies (The primary antibodies used in this study were as follows: DMBT1
(Cat. No. 27069-1-AP, Proteintech, Rosemont, IL, USA; 1:1000),
phospho-
All analyses were performed in R 4.2.1 (https://www.r-project.org/). For
single-cell RNA-seq: Seurat v4.3.0 (Satija Lab, New York Genome Center, New York,
NY, USA, https://satijalab.org/seurat/) was used for QC (300–7000 genes,
For in-vitro experiments: comparisons involving
To further dissect the heterogeneity of epithelial cells during the progression from normal intestinal mucosa to colorectal cancer (CRC) in Lynch syndrome, we performed in-depth subpopulation analysis of epithelial cells using single-cell RNA sequencing (scRNA-seq) data. Quality control and clustering analysis are shown as (Supplementary Fig. 1A,B).
Our scRNA-seq analysis provided a detailed single-cell atlas of the progression from normal intestinal mucosa to colorectal cancer in Lynch syndrome patients. The workflow (Fig. 1A) highlights the comprehensive approach taken to generate high-quality single-cell data. The representative images (Fig. 1B) confirm the histological integrity of the collected tissues, ensuring the reliability of the subsequent analysis. The dot plot (Fig. 1C) illustrates the expression of marker genes in different cell subpopulations, facilitating the accurate annotation of cell types. This step is crucial for understanding the cellular heterogeneity within the tissues. The UMAP clustering (Fig. 1D, Supplementary Fig. 1C) identified 12 distinct cell clusters, with eight cell types successfully annotated, including T cells, B cells, endothelial cells, epithelial cells, macrophages, plasma cells, fibroblasts, and mast cells. This comprehensive cell type annotation provides a detailed view of the cellular landscape in CRC development. The UMAP plots (Fig. 1E) show the distribution of these cell types across normal mucosa, adenoma, and cancer tissues, revealing significant shifts in cellular composition during disease progression. Notably, the box plot (Fig. 1F) quantitatively demonstrates the changes in the proportions of epithelial cells, T lymphocytes, and macrophages. The observed increase in T lymphocytes and macrophages, along with the decrease in epithelial cells, suggests a dynamic interplay between these cell types during CRC development.
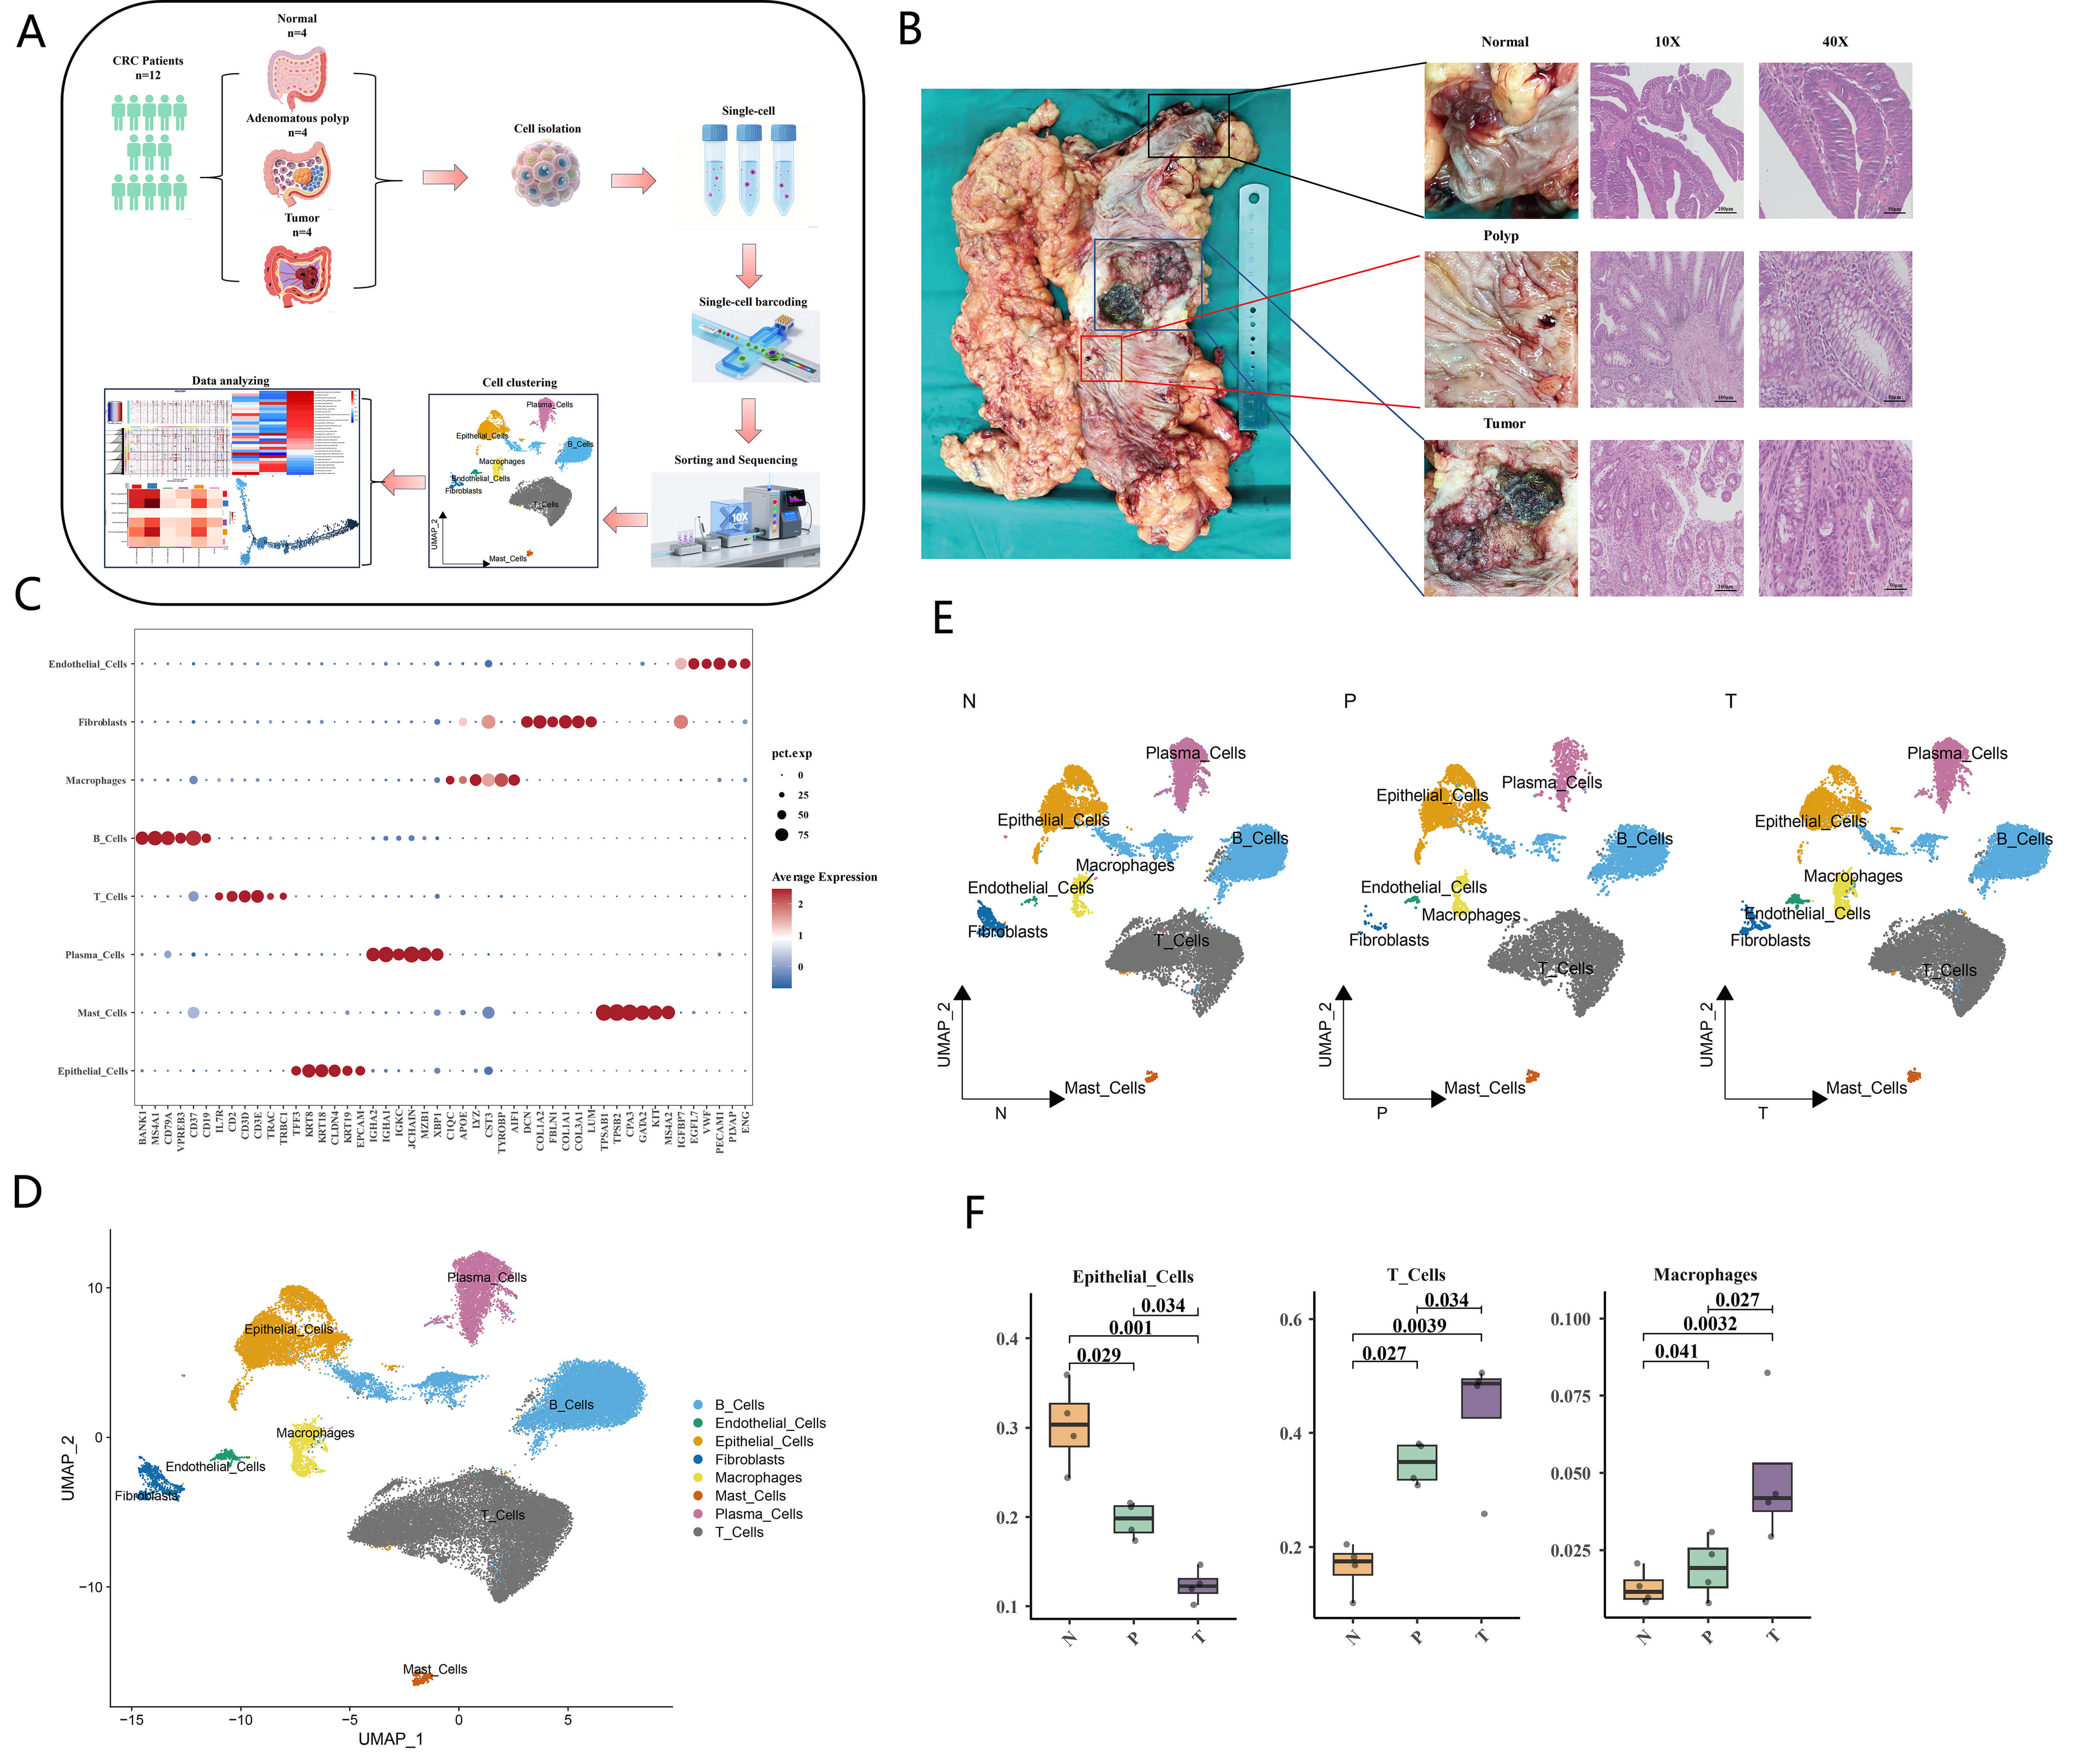 Fig. 1.
Single-cell atlas in colorectal cancer (CRC) development. (A)
Schematic diagram of the single-cell RNA sequencing workflow. The workflow
includes tissue collection, single-cell dissociation, library preparation,
sequencing, and bioinformatics analysis. (B) Representative images of normal
intestinal mucosa, adenomatous polyps and colorectal cancer tissues, along with
HE staining verification images (scale bar = 100 µm (magnification
These findings are consistent with previous studies that have highlighted the role of immune cells in the tumor microenvironment and the importance of epithelial cell changes in CRC progression [8]. The detailed single-cell atlas generated in this study provides valuable insights into the cellular dynamics and molecular mechanisms underlying Lynch syndrome-related CRC development. Future work may focus on further elucidating the functional roles of these cell types and their interactions, potentially leading to the identification of novel therapeutic targets and biomarkers.
To further elucidate the cellular dynamics and molecular mechanisms underlying the progression from normal intestinal mucosa to colorectal cancer (CRC) in Lynch syndrome, we conducted a detailed subpopulation analysis of epithelial cells using single-cell RNA sequencing (scRNA-seq) data. This analysis aimed to identify distinct epithelial cell subtypes and their roles in disease progression.
Our detailed subpopulation analysis of epithelial cells provides critical
insights into the cellular dynamics during CRC development in Lynch syndrome
(Supplementary Fig. 2). The UMAP visualization (Fig. 2A) and CNV
analysis (Fig. 2B, Supplementary Fig. 3) highlight the distinct
epithelial cell subtypes and their potential cancerous characteristics. The
marker gene expression (Fig. 2C) and their differential expression across normal
mucosa (N), adenoma (P), and tumor (T) tissues (Fig. 2D) further support the
subtype-specific signatures: BEST4 expression was significantly downregulated in
colorectal cancer tissues versus normal intestinal mucosa (p = 4.7
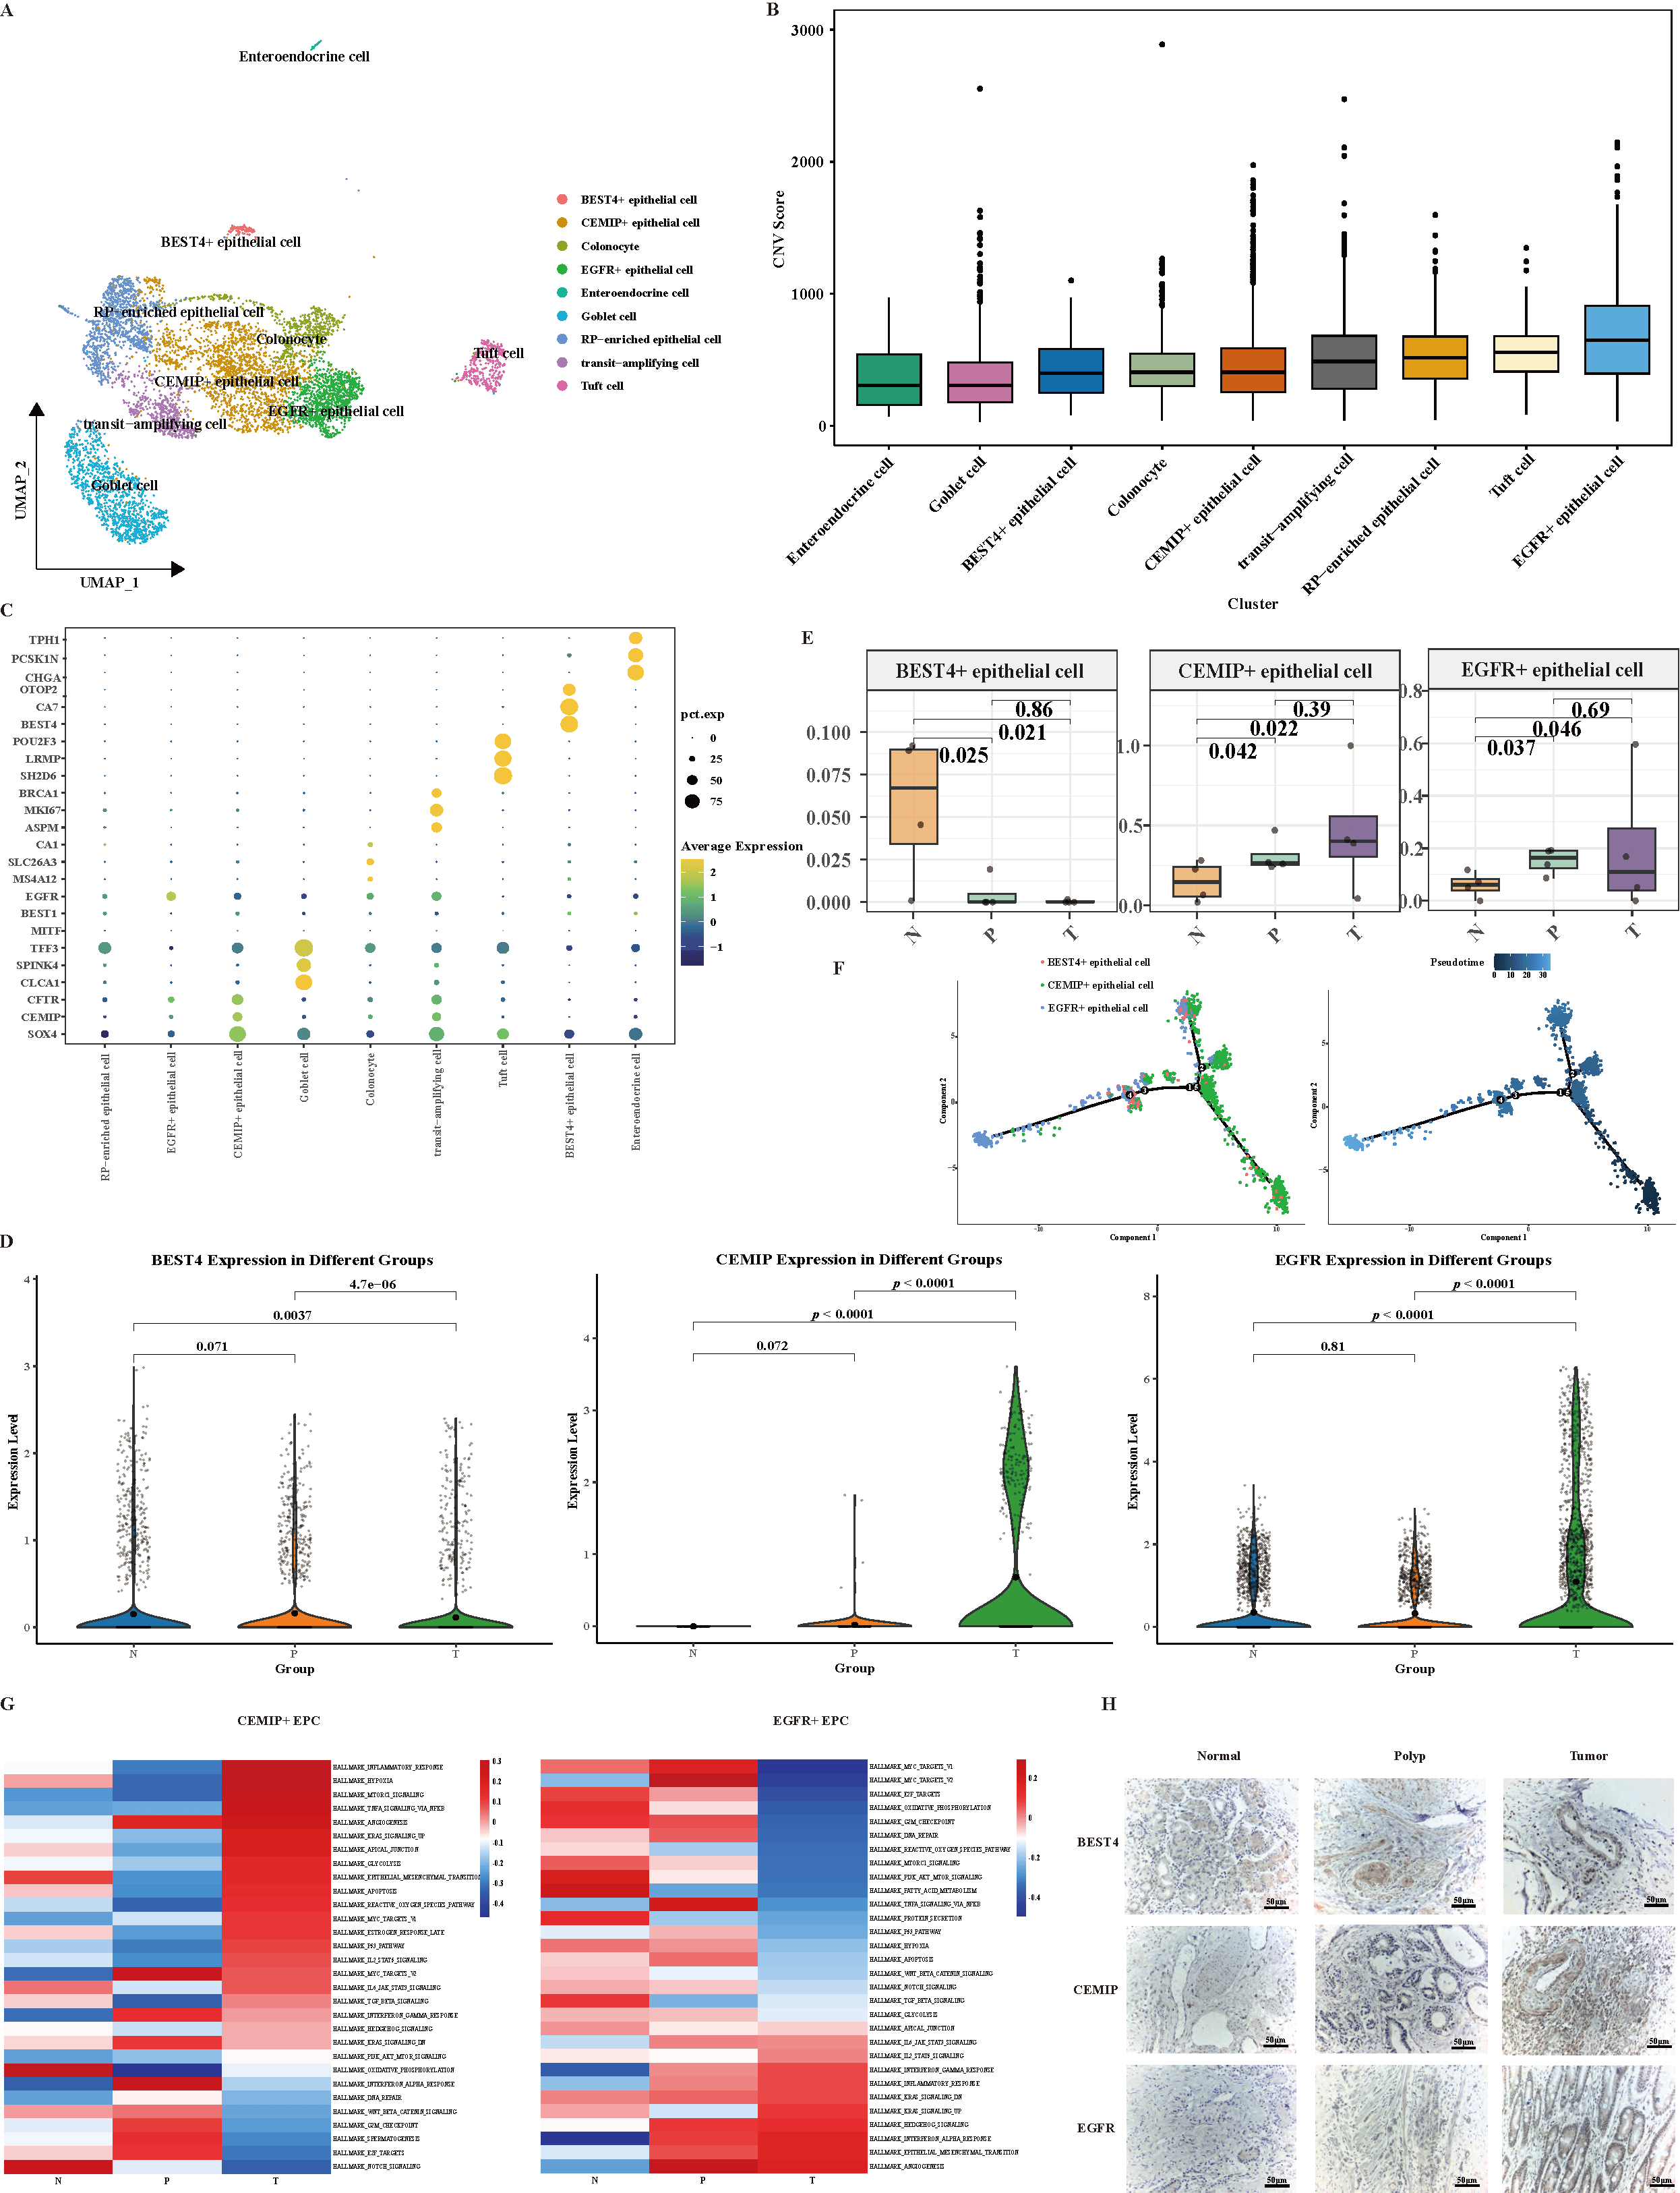 Fig. 2.
Distinct cellular subtypes and distribution characteristics of
epithelial cells during the multistage development of colorectal cancer. (A)
UMAP visualization depicting the primary clusters of epithelial cells. Each
epithelial cell is represented in color according to its specific condition. (B)
InferCNV evaluates the genomic variation and cancerous characteristics of
epithelial cells throughout the development of CRC. (C) Dot plot illustrating the
expression of markers in epithelial c cell subpopulations. (D) The violin plot
illustrates the expression levels of BEST4, CEMIP and EGFR in the N, P, and T
tissue types. (E) The box plot illustrates the changes in the proportions of
BEST4+, CEMIP+ and EGFR+ epithelial cells during the CRC development. (F)
Trajectories analysis of BEST4+, CEMIP+ and EGFR+ epithelial cells using Monocle
2. (G) GSVA analysis indicating the enriched pathways in CEMIP+ and EGFR+
epithelial cell populations. (H) Immunohistochemical staining images showing the
localization and expression levels of BEST4, CEMIP, and EGFR in normal mucosa
(N), adenoma (P), and cancer tissues (T) (magnification
To investigate the functional genes involved in the dynamic changes of epithelial cells during colorectal cancer (CRC) initiation and progression, we identified 3 differentially expressed genes (DEGs) (DMBT1, BTNL8, and XIST) across normal (N), adenoma (P), and cancer (T) tissues (Fig. 3A).
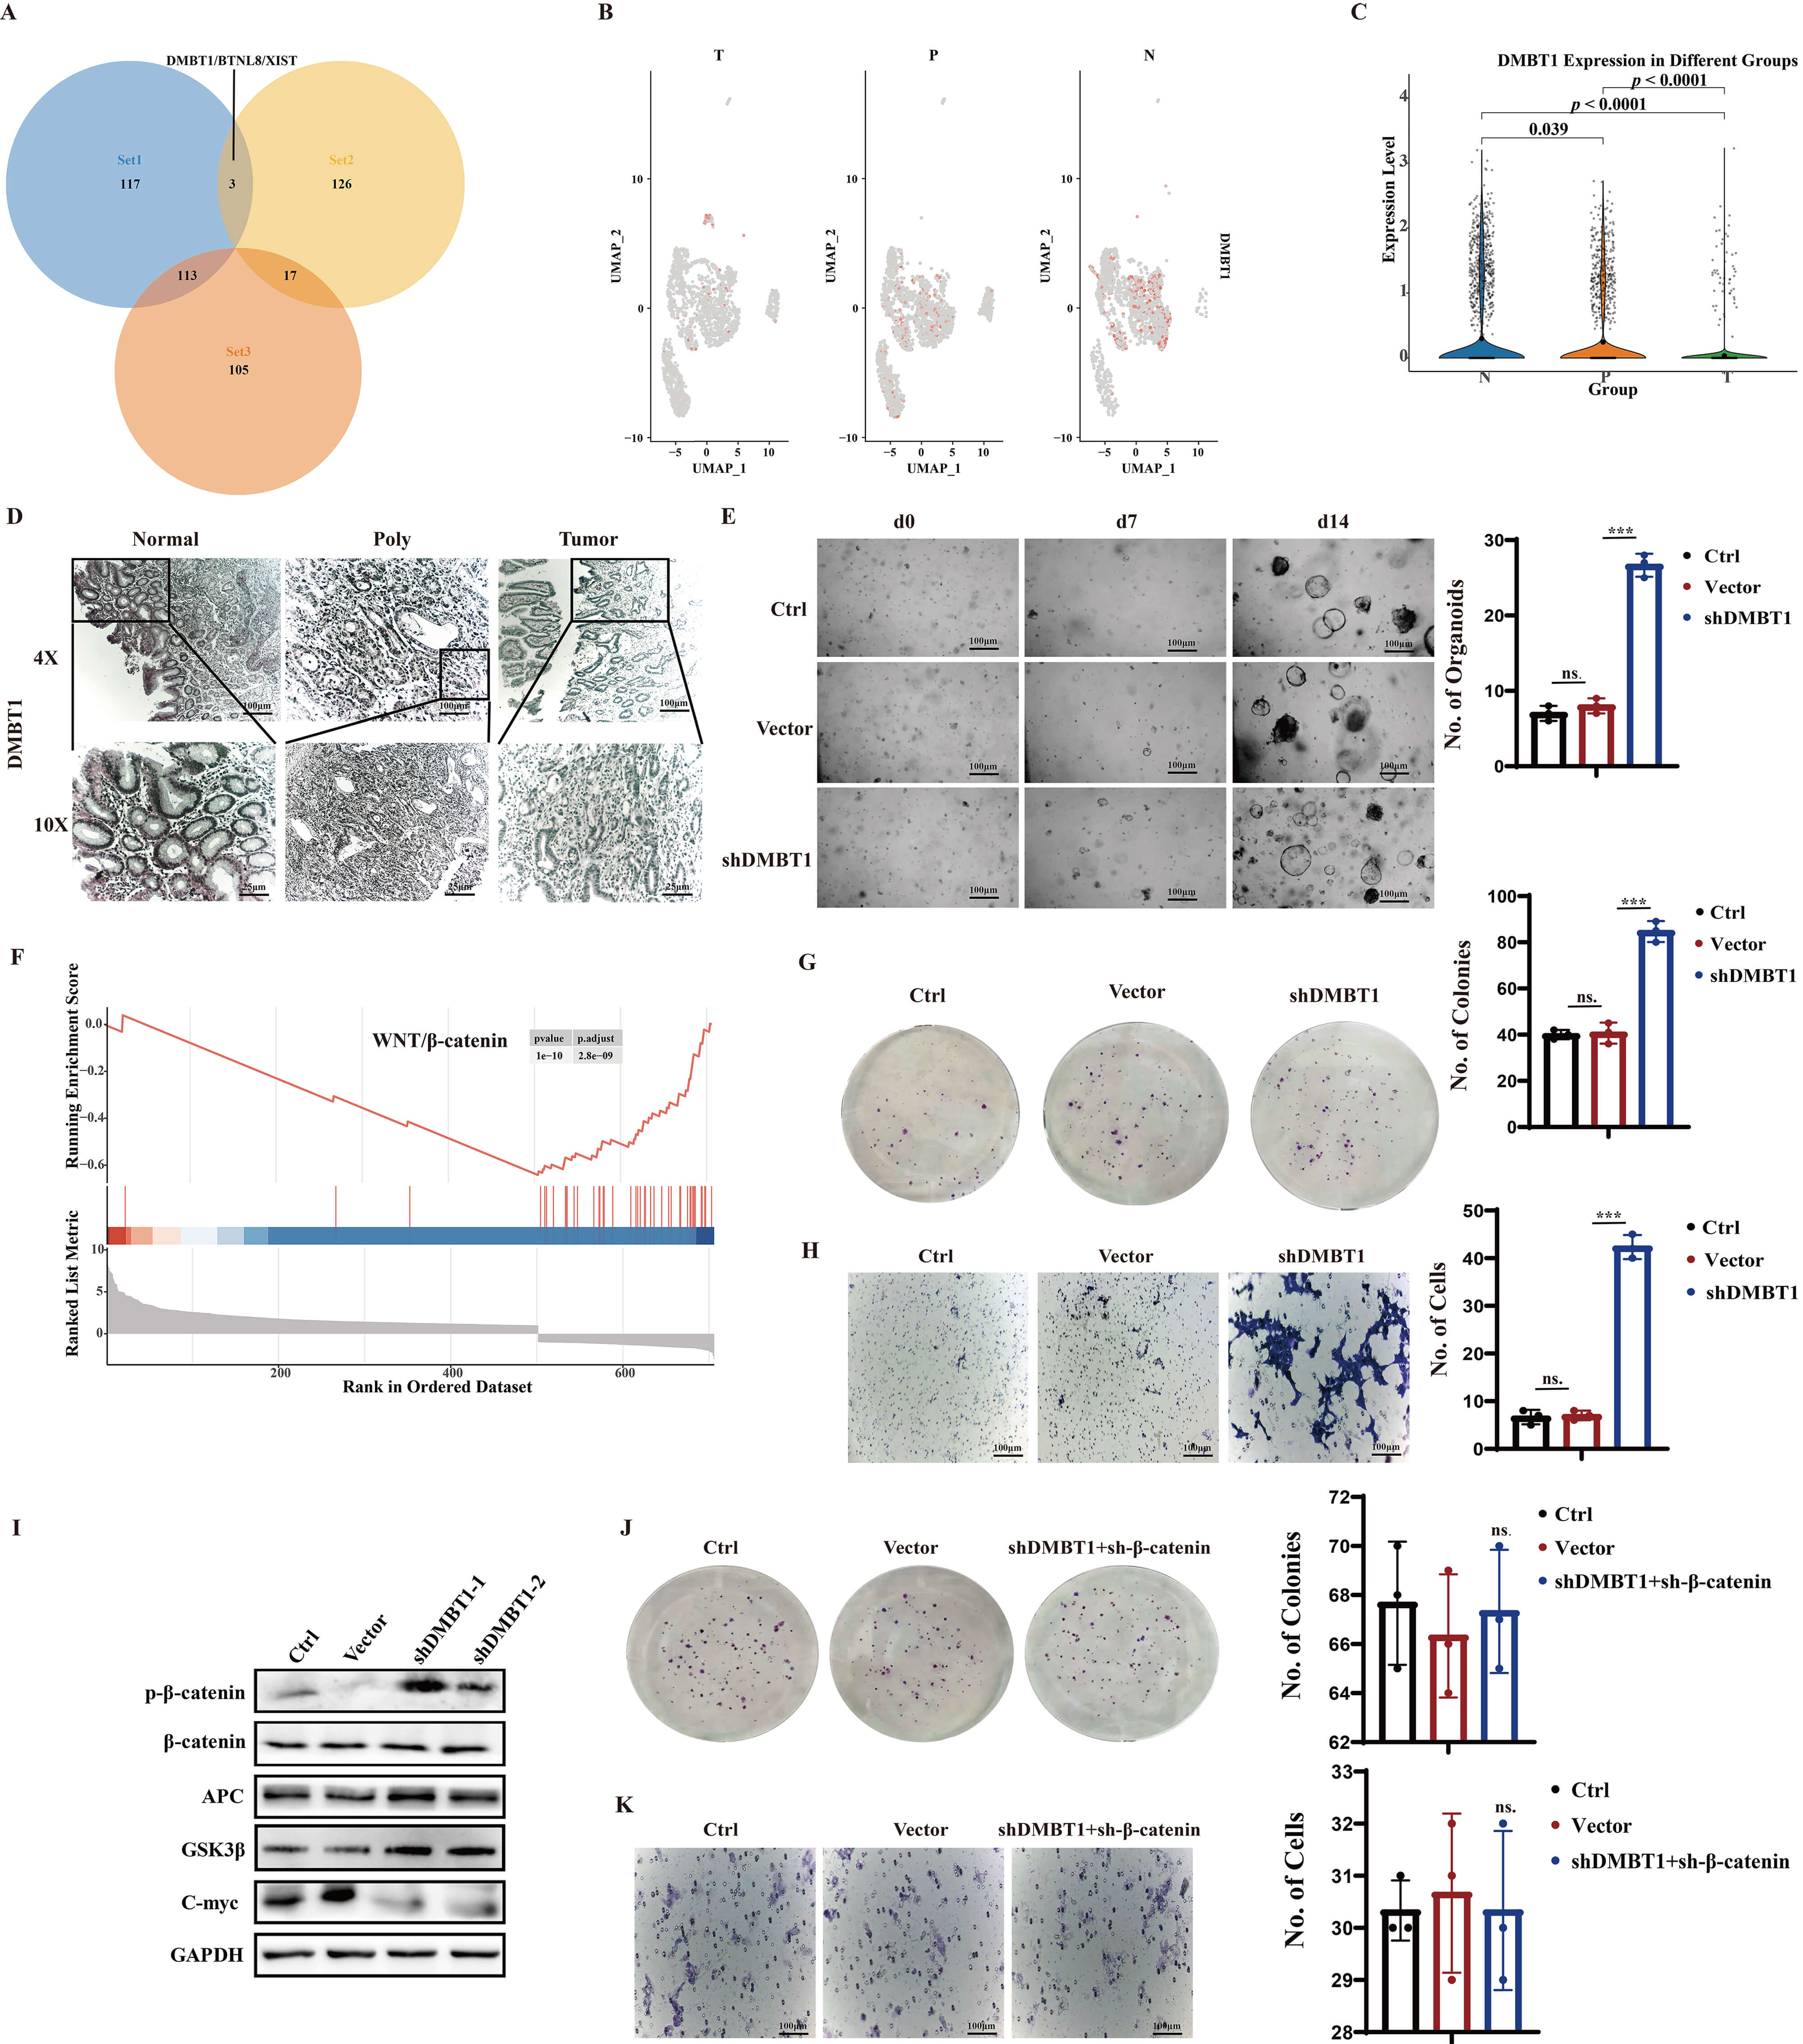 Fig. 3.
Activation of WNT/
Among the three core differential genes, DMBT1 was prioritized for functional validation, considering its distinct expression traits and research significance. Specifically, it displayed the most consistent and remarkable downregulation during the progression from normal mucosa to adenoma and CRC (Fig. 3B–D), exhibiting a tighter correlation with continuous pathological transformation compared to BTNL8 and XIST. As a well-documented glycoprotein involved in intestinal mucosal homeostasis regulation, DMBT1 has been implicated in CRC initiation and progression, yet its regulatory role in Lynch syndrome remains elusive—rendering it a novel and worthy research target, providing a robust basis for subsequent functional investigations.
Our comprehensive analysis of DMBT1’s role in CRC initiation and progression
reveals a critical mechanism involving the activation of the
WNT/
These findings are consistent with previous studies that have identified the
WNT/
To investigate the role of T lymphocytes in the progression of colorectal cancer (CRC) in Lynch syndrome, we performed a detailed analysis of T cell subtypes using single-cell RNA sequencing (scRNA-seq) data. This analysis aimed to identify distinct T cell subtypes and their dynamic changes during disease progression.
Our detailed analysis of T lymphocyte subtypes provides critical insights into the immune dynamics during CRC development in Lynch syndrome. The UMAP visualization (Fig. 4A) and box plot (Fig. 4C) highlight the distinct T cell subtypes and their dynamic changes during disease progression. The increase in CD4+ Reg and CD8+ effector T cells, along with the decrease in CD4+ Naive and CD8+ cytotoxic T cells, underscores the shift in the immune microenvironment towards a more immunosuppressive state.
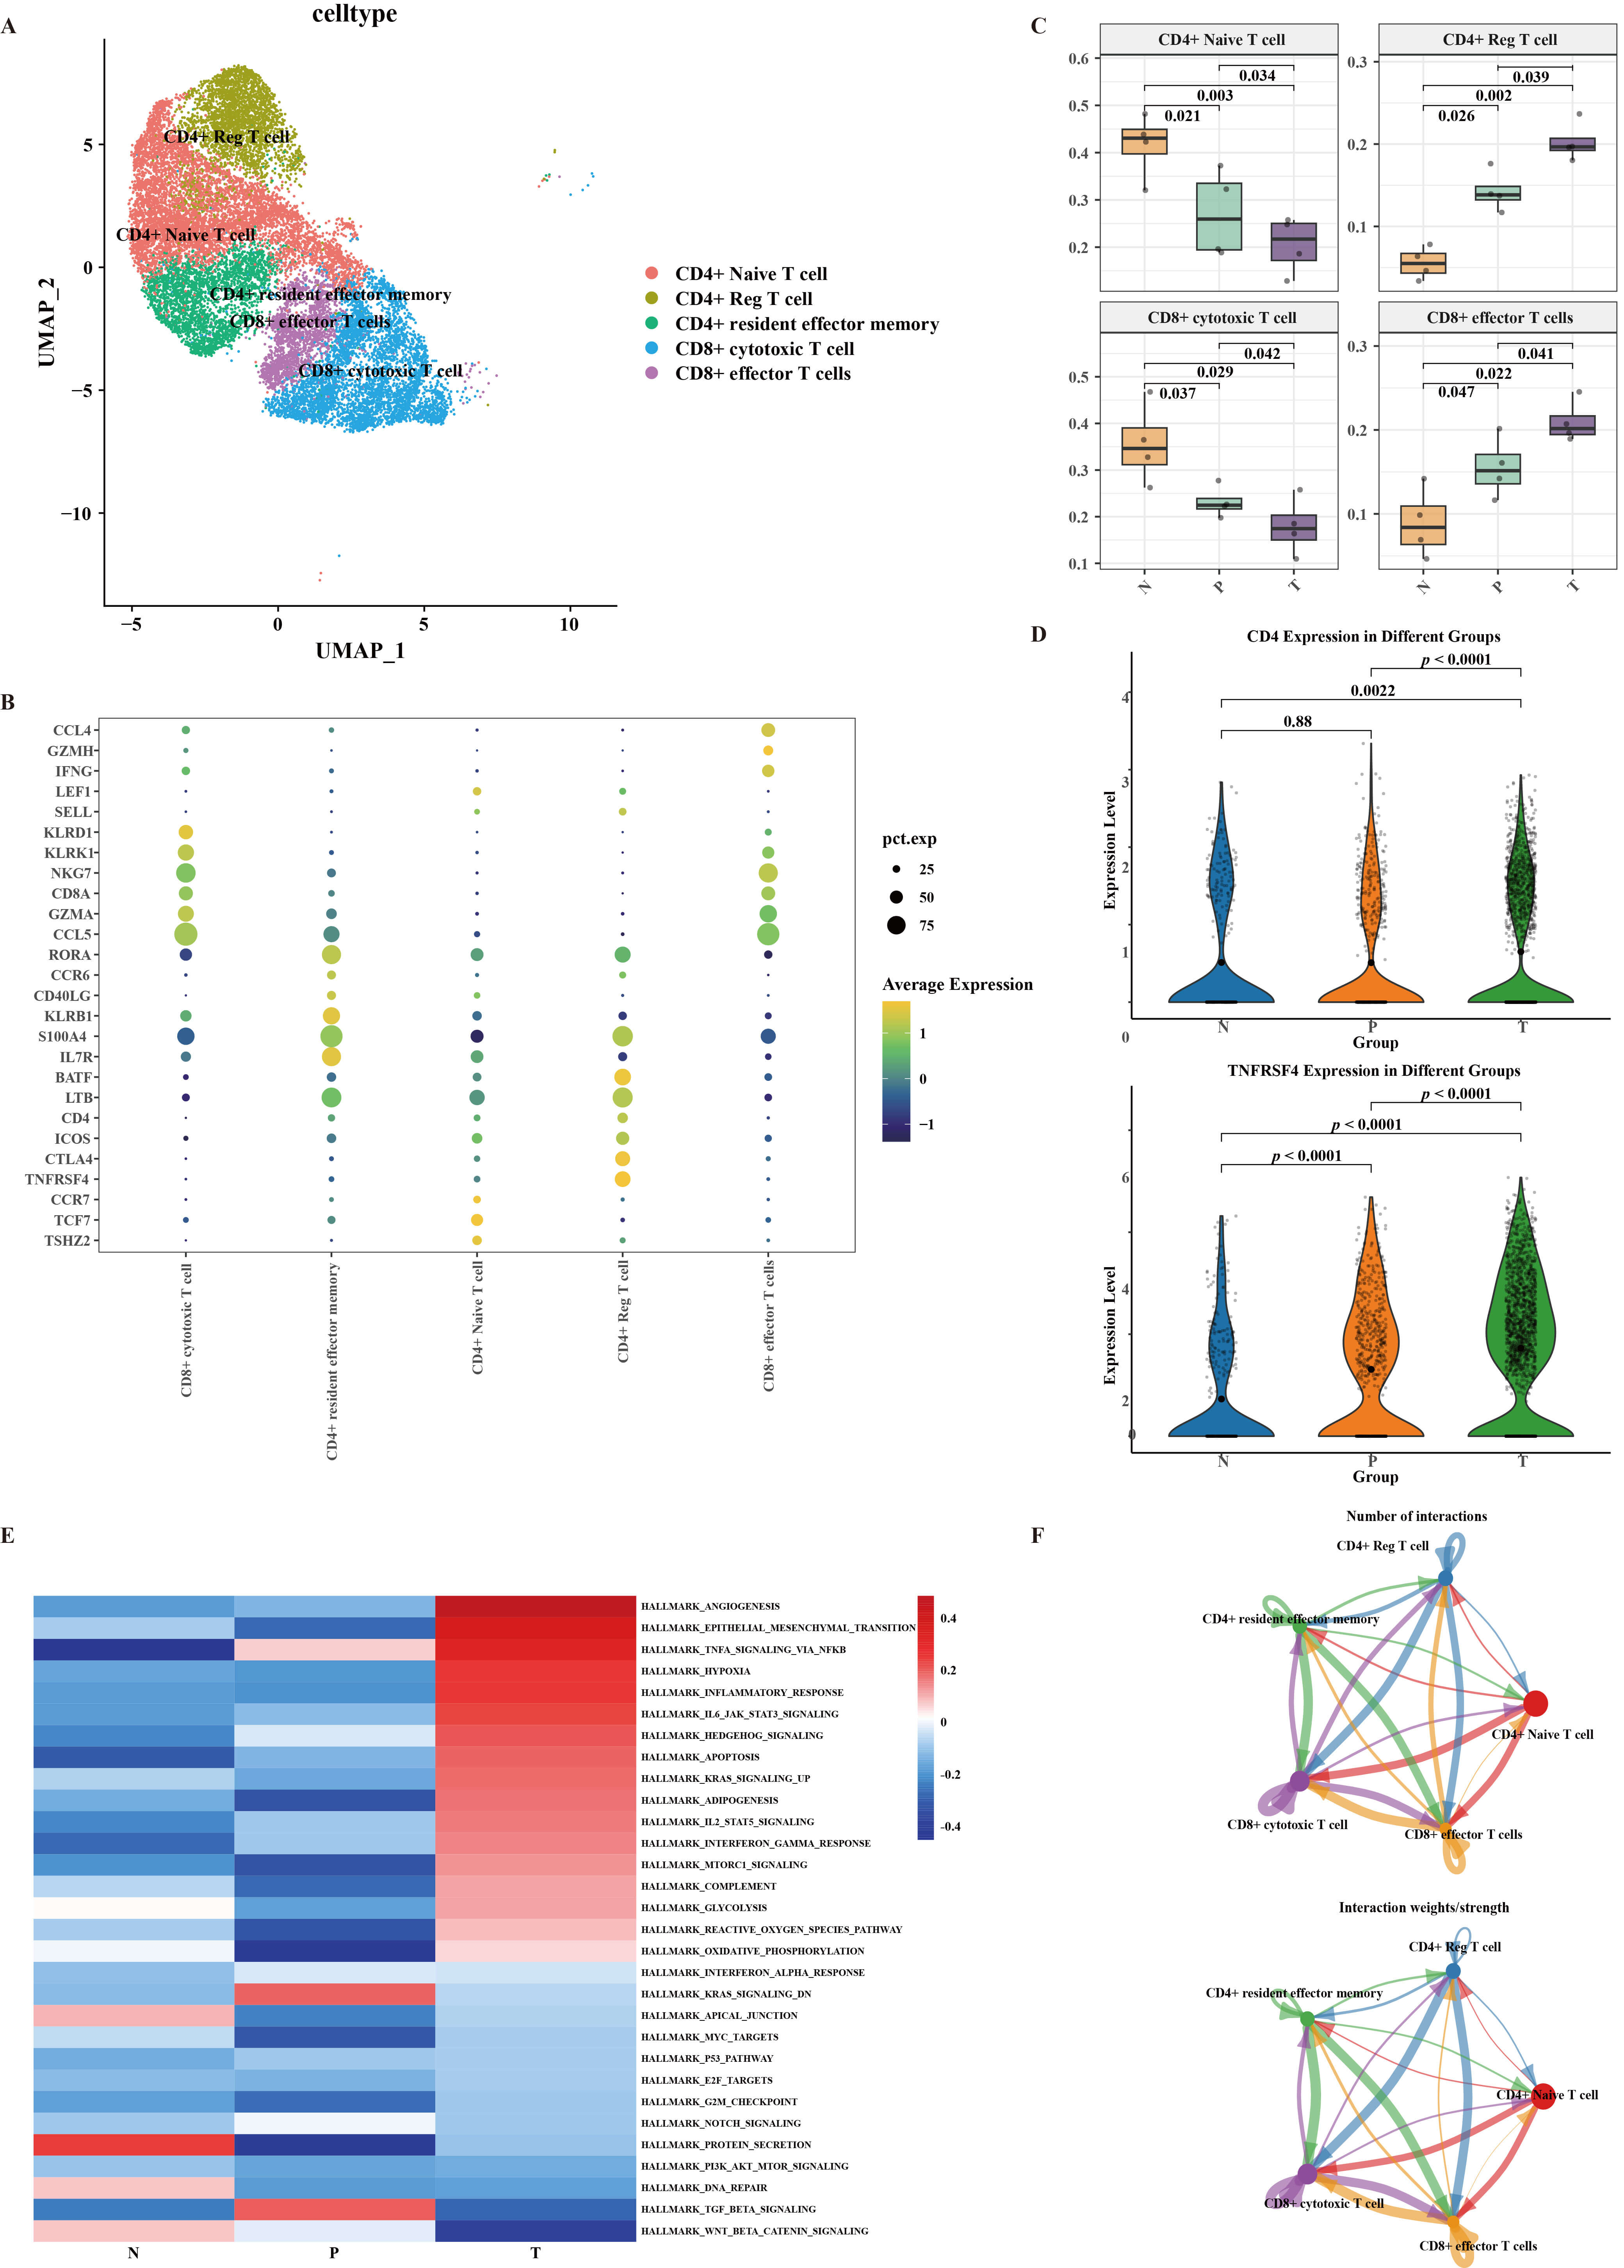 Fig. 4.
Characteristics of T lymphocytes subtypes. (A) UMAP plot depicting the subtype clusters of T cells. (B) Dot plot illustrating the expression of markers in T cell subpopulations. (C) The box plot illustrates the changes in the proportions of CD4+ Naive, CD4+ Reg, CD8+ cytotoxic and CD8+ effector T cells during the CRC development. (D) The violin plot illustrates the expression levels of CD4 and TNFRSF4 in the N, P, and T tissue types. (E) GSVA analysis indicating the enriched pathways in CD4+ Reg T cell populations. (F) The communication intensity network between CD4+ Reg T cell and other T cell subsets.
The marker gene expression (Fig. 4B) and changes in expression levels (Fig. 4D) further confirm the accumulation of CD4+ Reg T cells during CRC development. The GSVA analysis (Fig. 4E, Supplementary Fig. 7) reveals the activation of key pathways in CD4+ Reg T cells, suggesting their involvement in promoting tumor progression. These findings are consistent with previous studies that have identified similar pathways in CRC development [8].
The communication intensity network (Fig. 4F, Supplementary Fig. 8) highlights the significant interactions between CD4+ Reg T cells and other T cell subsets, emphasizing their role in modulating the immune microenvironment. This analysis provides a comprehensive view of the T cell landscape during CRC progression and underscores the importance of understanding the immune dynamics in Lynch syndrome-related CRC.
To further dissect the heterogeneity and roles of CD4+ regulatory T cells (Tregs) during colorectal cancer (CRC) development in Lynch syndrome, we performed a detailed subpopulation analysis of CD4+ Tregs using single-cell RNA sequencing (scRNA-seq) data. This analysis aimed to identify distinct CD4+ Treg subtypes and their dynamic changes during disease progression.
Our detailed analysis of CD4+ Treg subtypes provides critical insights into the immune dynamics during CRC development in Lynch syndrome. The UMAP visualization (Fig. 5A) and dot plot (Fig. 5B) highlight the distinct CD4+ Treg subtypes and their molecular signatures. The increase in CCR8+ CD4+ Tregs (Fig. 5C) underscores the shift in the immune microenvironment towards a more immunosuppressive state during CRC progression.
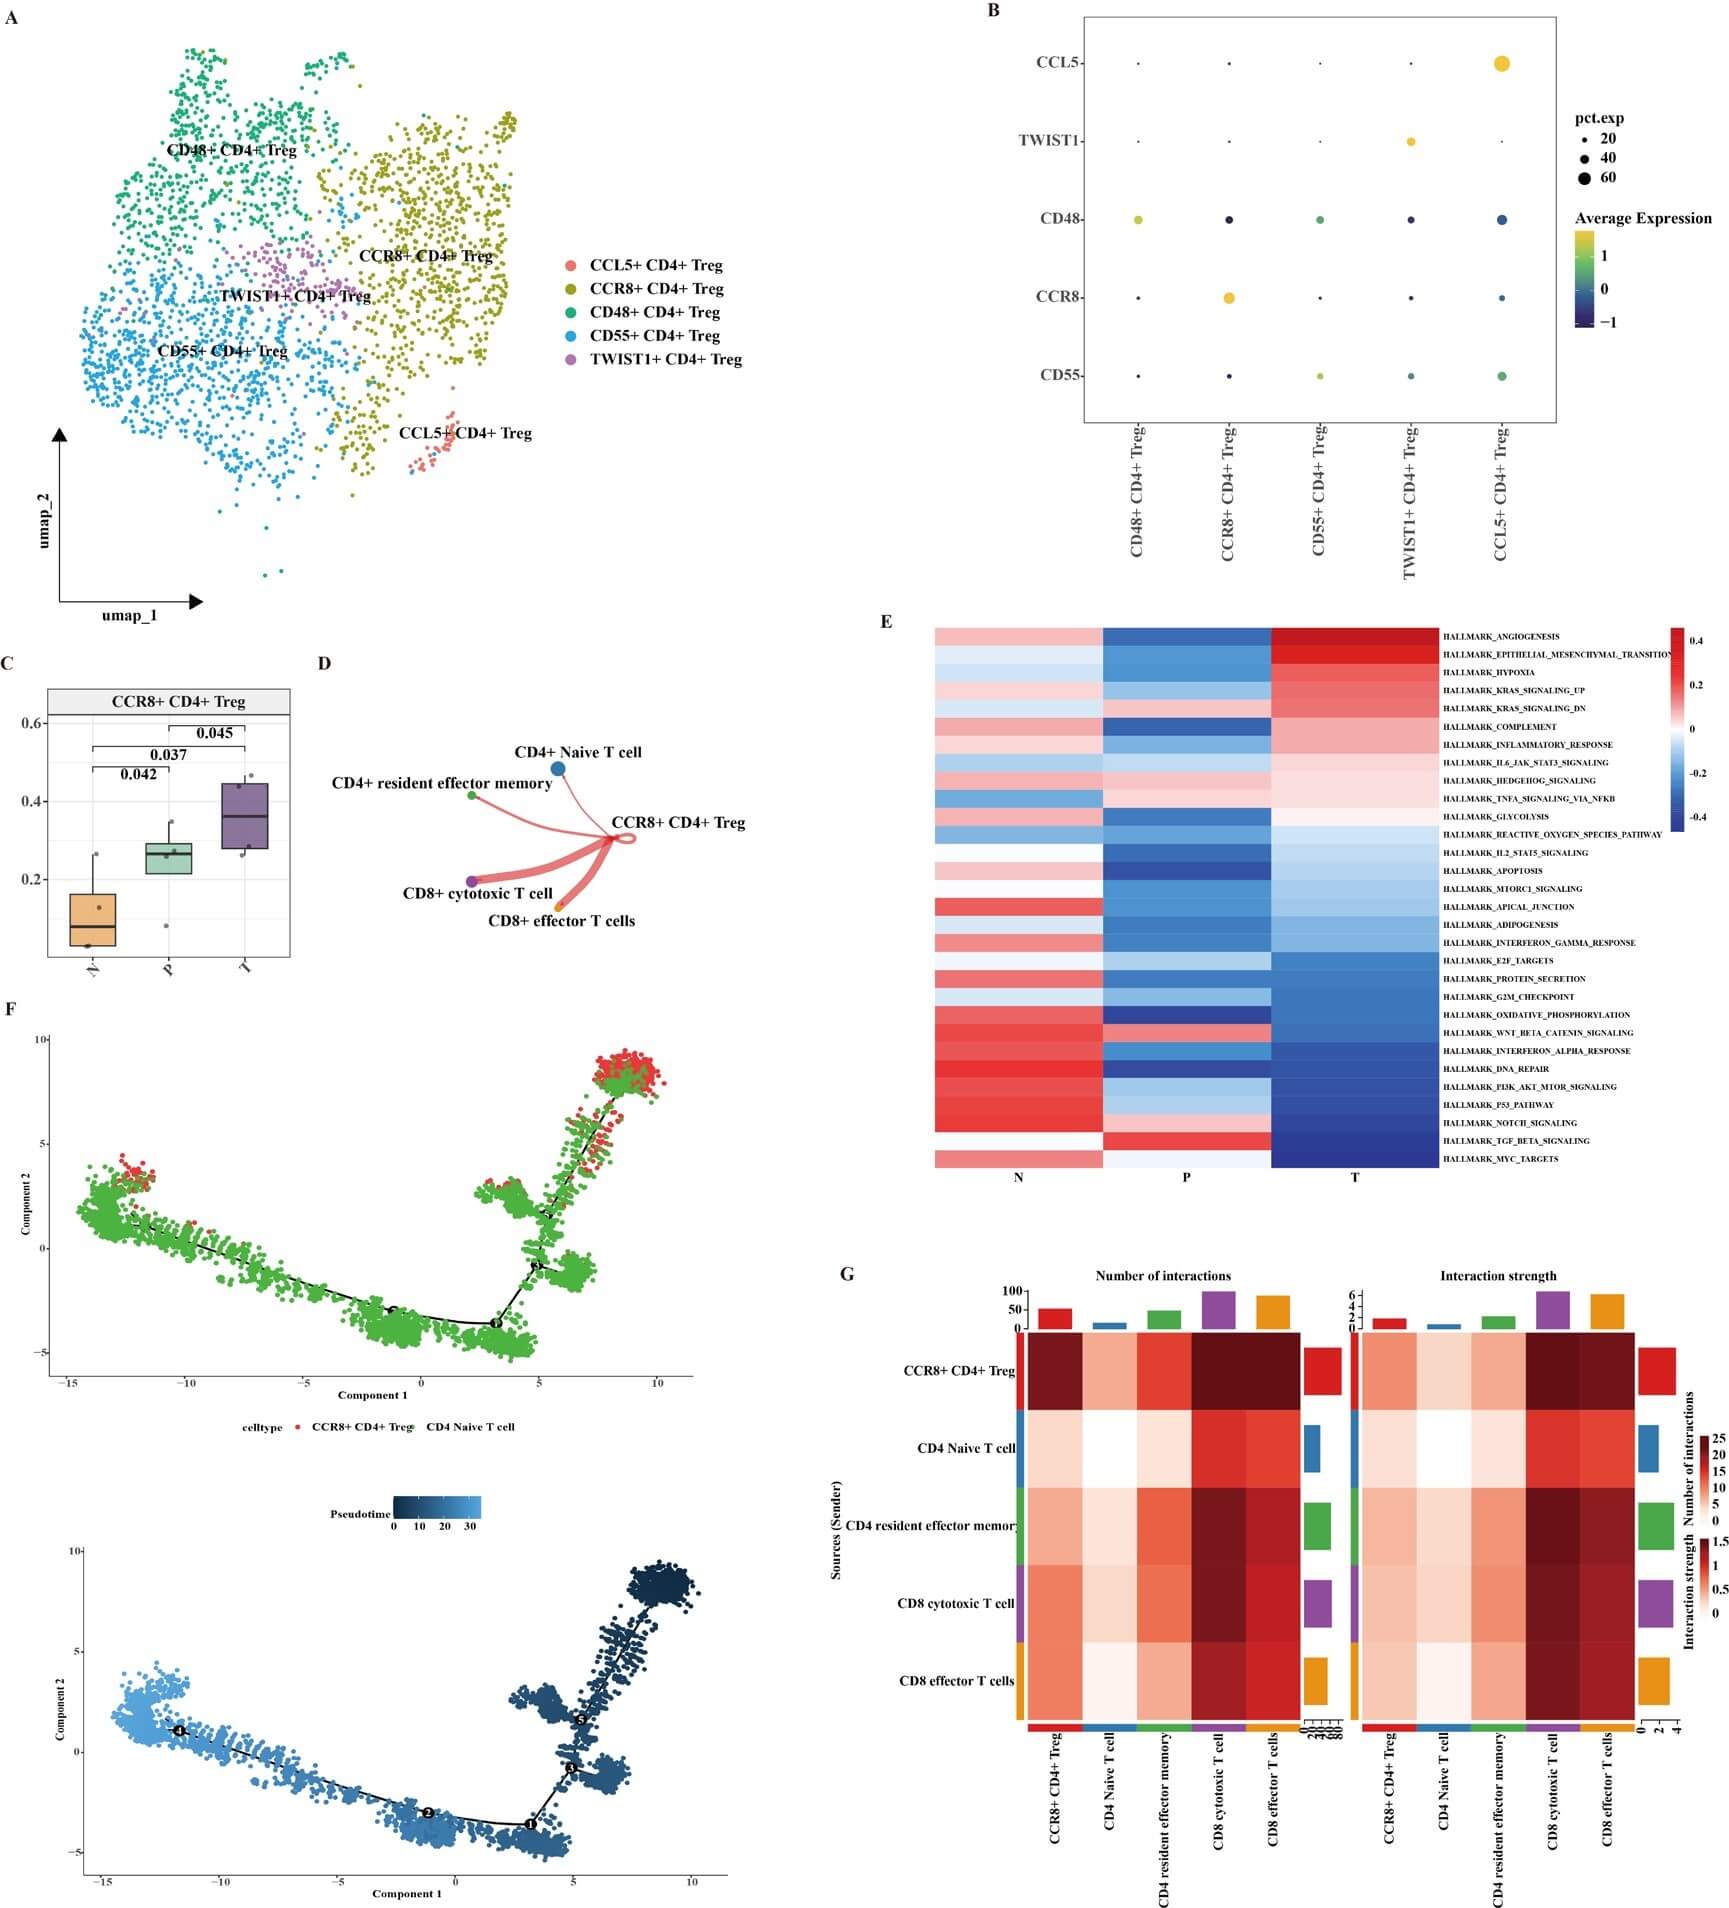 Fig. 5.
Characteristics of CD4+ Reg T cell subtypes. (A) UMAP plot depicting the subtype clusters of CD4+ Reg T cells. (B) Dot plot illustrating the expression of markers in CD4+ Reg T cell subpopulations. (C) The box plot illustrates the changes in the proportions of CCR8+ CD4+ Reg T cells during the CRC development. (D) The communication intensity network between CCR8+ CD4+ Reg T cell and other CD4+ Reg T cell subsets. (E) GSVA analysis indicating the enriched pathways in CCR8+ CD4+ Reg T cell during CRC development. (F) Trajectories analysis of CD4+ Naïve and CCR8+ CD4+ Reg T cell using Monocle 2. (G) The communication intensity network between CCR8+ CD4+ Reg T cell and other T cell subsets.
The GSVA analysis (Fig. 5E) reveals the activation of key pathways in CCR8+ CD4+ Tregs, suggesting their involvement in promoting tumor progression. These findings are consistent with previous studies that have identified similar pathways in CRC development [8]. The pseudotime analysis (Fig. 5F) provides insights into the potential differentiation trajectory of CCR8+ CD4+ Tregs from CD4+ Naïve T cells, highlighting the dynamic nature of Treg populations during disease progression.
The communication intensity network (Fig. 5D,G) highlights the significant interactions between CCR8+ CD4+ Tregs and other T cell subsets, emphasizing their role in modulating the immune microenvironment. CCR8+ CD4+ Reg T cells show strong communication with CD8+ effector and CD8+ cytotoxic T cells via HLA-A-CD8A (Supplementary Figs. 8–11). This analysis provides a comprehensive view of the Treg landscape during CRC progression and underscores the importance of understanding the immune dynamics in Lynch syndrome-related CRC.
To further understand the role of macrophages in the progression of colorectal cancer (CRC) in Lynch syndrome, we performed a detailed subpopulation analysis of macrophages using single-cell RNA sequencing (scRNA-seq) data. This analysis aimed to identify distinct macrophage subtypes and their dynamic changes during disease progression.
Our detailed analysis of macrophage subtypes provides critical insights into the immune dynamics during CRC development in Lynch syndrome. The UMAP visualization (Fig. 6A) and box plot (Fig. 6B) highlight the distinct macrophage subtypes and their dynamic changes during disease progression. The increase in C1QC+, IDO1+, and IL1B+ macrophages underscores the shift in the immune microenvironment towards a more pro-tumorigenic state during CRC progression.
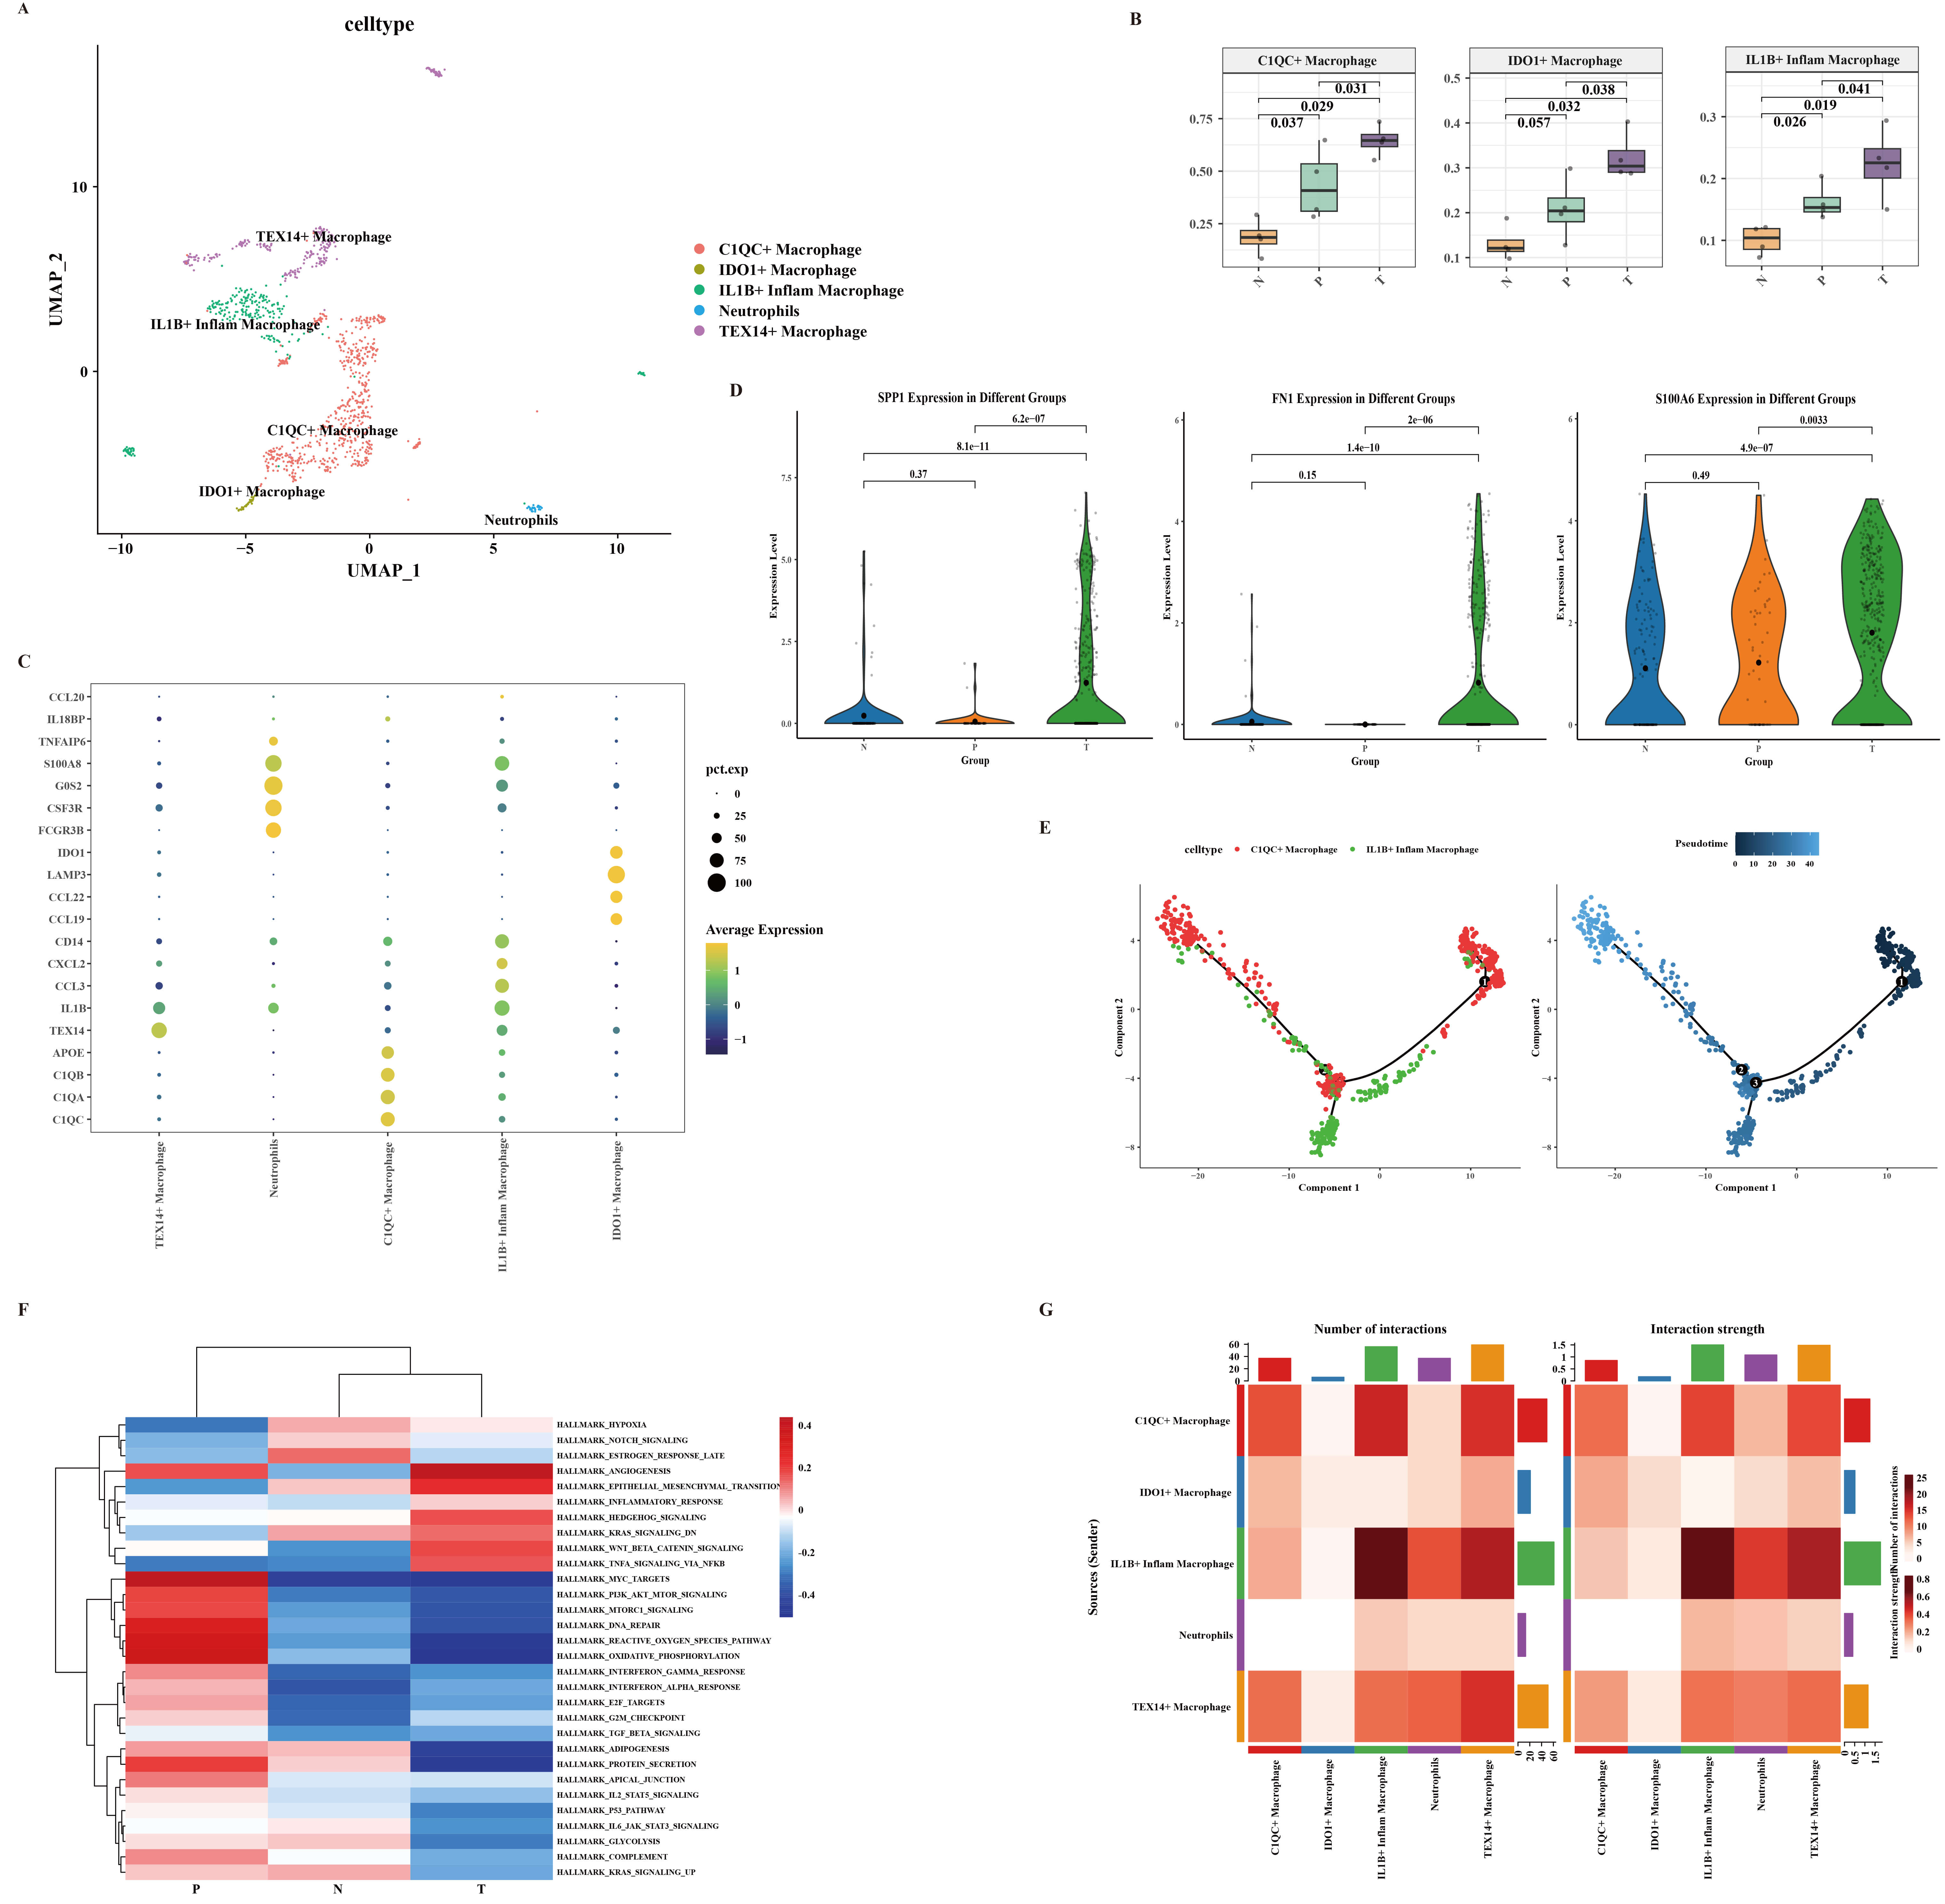 Fig. 6.
Characteristics of macrophages subtypes. (A) UMAP plot depicting the subtype clusters of macrophages. (B) The box plot illustrates the changes in the proportions of C1QC+, IDO1+ and IL1B+ macrophages cells during the CRC development. (C) Dot plot illustrating the expression of markers in macrophages subpopulations. (D) The violin plot illustrates the expression levels of SPP1, FN1 and S100A6 in the N, P, and T tissue types. (E) Trajectories analysis of C1QC+ and IL1B+ macrophages using Monocle 2. (F) GSVA analysis indicating the enriched pathways in C1QC+ macrophages during CRC development. (G) The communication intensity network between macrophages cell subsets.
The marker gene expression (Fig. 6C) and changes in expression levels (Fig. 6D) further confirm the activation and accumulation of specific macrophage subtypes during CRC development. The GSVA analysis (Fig. 6F) reveals the activation of key pathways in C1QC+ macrophages, suggesting their involvement in promoting tumor progression. These findings are consistent with previous studies that have identified similar pathways in CRC development [8].
The pseudo time analysis (Fig. 6E) provides insights into the potential differentiation trajectory of IL1B+ macrophages from C1QC+ macrophages, highlighting the dynamic nature of macrophage populations during disease progression. The communication intensity network (Fig. 6G) highlights the significant interactions between C1QC+ macrophages and other macrophage subsets, emphasizing their role in modulating the immune microenvironment. To elucidate the specific ligand-receptor interactions between macrophages and epithelial cell subsets, we performed a detailed ligand-receptor interaction analysis. This analysis revealed that CEMIP+ epithelial cells interact with IL1B+ macrophages through MIF (CD74+CD44) and APP-CD74 pathways. Additionally, CEMIP+ epithelial cells communicate with IDO1+ and C1QC+ macrophages via the APP-CD74 pathway. These interactions highlight the complex communication network between epithelial cells and macrophages, which may contribute to the pro-tumorigenic microenvironment in CRC (Supplementary Figs. 12,13).
Our study presents a comprehensive single-cell atlas detailing the
transcriptional landscape of colorectal cancer (CRC) development in Lynch
syndrome (LS) patients, from normal mucosa to adenoma and ultimately to
carcinoma. Through high-resolution single-cell RNA sequencing (scRNA-seq) of
matched tissues, we have delineated the complex cellular ecosystem and molecular
dynamics underlying LS-related carcinogenesis. Our key findings include: (1)
identification of 12 distinct cell clusters with significant compositional
changes during progression; (2) revelation of a novel epithelial differentiation
trajectory from BEST4+ to CEMIP+ and EGFR+ cells; (3) discovery of DMBT1 as a
consistently downregulated tumor suppressor that activates the
WNT/
The theoretical implications of our findings are profound. We have effectively
bridged the gap between hereditary cancer predisposition and actual tumor
development by providing a cellular and molecular roadmap of how specific genetic
backgrounds (MMR deficiency) create permissive environments for tumor initiation
and progression. Our identification of DMBT1 as a key regulator in LS-related CRC
adds a new dimension to the understanding of WNT pathway regulation in hereditary
cancers, suggesting that beyond the well-established APC/
However, their work primarily focused on sporadic CRC cases in than hereditary forms like LS. Similarly, Pelka et al. (2021) [13] spatially organized multicellular immune hubs in human colorectal cancer, but their analysis centered on advanced tumors rather than the critical transition from normal to precancerous and cancerous states. Our study uniquely addresses the natural progression of LS-related CRC from normal mucosa through adenoma to carcinoma, providing insights that are not captured in studies of sporadic CRC or established tumors alone. The concurrent analysis of epithelial, immune, and stromal compartments across disease stages represents a significant advancement over previous efforts that often focused on a single compartment or stage.
Our identification of a BEST4+ to CEMIP+/EGFR+ differentiation trajectory in
epithelial cells provides a mechanistic explanation for the cellular origins of
LS-related CRC. This finding complements recent work by Bortolomeazzi et
al. (2021) [14] who demonstrated that tumor cell intrinsic features
significantly influence the immune microenvironment. Our observation that DMBT1
downregulation activates the WNT/
While DMBT1 over-expression was not performed in the present study, we would
like to clarify why we consider the current evidence sufficient to support a
tumour-suppressive role for DMBT1 in LS-associated CRC. First, patient-derived LS
organoids and primary tissues were available only in limited numbers, and the
project time-frame was restricted; all viable material was therefore allocated to
the knock-down and
Our characterization of the immune landscape in LS-related CRC progression reveals both consistencies and contradictions with existing literature. We observed an increased proportion of T lymphocytes and macrophages with disease progression, along with epithelial fractions concomitantly declined-a finding consistent with general CRC biology. However, our specific identification of CD4+ regulatory T cell expansion (particularly the CCR8+ subset) and pro-tumorigenic macrophage polarization (C1QC+, IDO1+, IL1B+) provides novel insights into the immune environment of LS-related CRC. These findings partially align with but also expand upon previous reports. Pelka et al. (2021) [13] identified spatially organized immune hubs in colorectal cancer, noting distinct distributions of cytotoxic cells across different CRC subtypes. Similarly, Beck et al. (2024) [16] demonstrated that interleukin-2 signaling can restore CD8+ T cell neoantigen immunity in MHC class I-deficient cancers. However, our study adds the temporal dimension of how these immune populations evolve during LS-related carcinogenesis, revealing that immunosuppressive shifts occur early in the adenoma stage and intensify with progression to carcinoma. Our discovery of specific ligand-receptor interactions between epithelial cells and macrophages (e.g., MIF-CD74+CD44 and APP-CD74 pathways) provides mechanistic explanation for the observed immune changes. This finding resonates with recent work by Acha-Sagredo et al. (2025) [15] who identified CD74 as a key marker of interferon-high immunophenotypes in CRC that respond to immunotherapy, suggesting potential therapeutic implications for targeting these interactions in LS-related CRC. Our study employed state-of-the-art scRNA-seq methodologies with rigorous quality control measures, including the use of Cell Ranger for data processing, Seurat for analysis, and DoubletFinder for removing doublet artifacts. The integration of FastMNN for batch effect correction and UMAP for dimensionality reduction represents current best practices in the field, ensuring the reliability of our findings.
However, several technical considerations warrant discussion. While scRNA-seq provides unparalleled resolution of cellular heterogeneity, it necessarily involves tissue dissociation that may alter the transcriptional profiles of certain cell types, particularly fragile cells or those embedded in complex extracellular matrices. Recent advancements in spatial transcriptomics could help validate and contextualize our findings by preserving the architectural relationships between cells.
The use of organoid models for functional validation of DMBT1’s role represents a significant strength of our study, as it allows for controlled experimentation in a physiologically relevant system [17, 18, 19]. This approach aligns with emerging trends in cancer research, as demonstrated by MatriSpheres technology which incorporates decellularized extracellular matrix to better recapitulate in vivo tumor phenotypes [20, 21, 22]. Our organoid work provides compelling evidence for the functional significance of DMBT1 downregulation in LS-related CRC. Our identification of DMBT1 downregulation as an early event in LS-related carcinogenesis suggests its potential utility as a biomarker for risk stratification. LS patients exhibit varying risks of CRC development depending on the specific MMR gene affected, and DMBT1 expression status could potentially refine these risk estimates. Additionally, the epithelial differentiation trajectory we described (BEST4+ to CEMIP+/EGFR+ cells) could inform surveillance strategies, with increased proportions of CEMIP+/EGFR+ cells in colon biopsies potentially signaling elevated cancer risk.
These findings complement recent advances in liquid biopsy approaches for LS.
Integrative omics studies have identified circulating miRNA and metabolome markers (e.g., hsa-miR-101-3p, hsa-miR-183-5p, and HDL_TG) that predict cancer risk in LS carriers [23, 24]. Our cellular findings could enhance the interpretation of such liquid biopsy results by providing the cellular context of these circulating biomarkers.
Our characterization of the immune microenvironment in LS-related CRC has important implications for immunotherapy approaches. While immune checkpoint inhibitors (ICIs) have demonstrated remarkable efficacy in dMMR/MSI-H CRC, response rates remain variable, highlighting the need for better predictive biomarkers [15]. Our identification of CCR8+ Tregs and specific macrophage subsets (C1QC+, IDO1+, IL1B+) could inform patient selection for immunotherapy and suggest novel therapeutic targets. These findings align with recent work by Acha-Sagredo et al. (2025) [15] who identified a constitutive interferon-high immunophenotype marked by CD74 expression that predicts response to immunotherapy in CRC [15]. Our observation that CEMIP+ epithelial cells interact with macrophages through CD74-mediated pathways suggests that targeting these interactions could enhance antitumor immunity in LS-related CRC.
The DMBT1-WNT/
Despite the significant insights provided by our study, several limitations must be acknowledged. First, our sample size, while sufficient for initial characterization, remains relatively small for comprehensive analysis of all LS subtypes. Future studies with larger cohorts are needed to validate our findings and explore potential differences between LS cases with different MMR gene mutations. Second, our study focused primarily on the epithelial and immune compartments, but the stromal compartment (including fibroblasts and endothelial cells) also plays crucial roles in CRC development. Future work should extend our findings to these additional cell types to provide a more comprehensive view of the LS tumor microenvironment. Third, while we performed functional validation of DMBT1’s role using organoid models, additional in vivo studies would be valuable to confirm these findings in a more physiological context. The development of LS-specific mouse models incorporating DMBT1 manipulation could be particularly informative in this regard.
(1) Multi-omic integration: Combining scRNA-seq with epigenomic, proteomic, and spatial data could provide additional layers of understanding about LS-related carcinogenesis.
(2) Intervention studies: Testing therapeutic approaches targeting the DMBT1-WNT axis or immunosuppressive mechanisms we identified could lead to new prevention strategies for high-risk LS patients.
(3) Longitudinal tracking: Following LS patients over time with serial scRNA-seq analyses could reveal dynamic changes in the cellular landscape during cancer development and progression.
(4) Expansion to other LS-related cancers: Applying similar approaches to endometrial and other LS-related cancers could identify shared and unique mechanisms across tumor types.
Our study provides a comprehensive single-cell atlas of CRC development in Lynch
syndrome, revealing previously unappreciated cellular heterogeneity and molecular
dynamics. We have identified DMBT1 as a key regulator of WNT/
These findings significantly advance our understanding of LS-related carcinogenesis and suggest numerous potential applications for improving risk stratification, surveillance, and treatment for LS patients. By bridging the gap between genetic predisposition and actual tumor development, our work provides a foundation for the development of more effective strategies for managing this high-risk population. The integration of our findings with emerging technologies like spatial transcriptomics, liquid biopsy, and machine learning-based risk prediction will be essential for translating these biological insights into clinical practice. Ultimately, we envision a future where LS patients receive personalized management strategies based on their specific molecular and cellular profile, maximizing protection against cancer while minimizing the burdens of intervention.
CRC, colorectal cancer; LS, Lynch syndrome; scRNA-seq, single-cell RNA sequencing; UMAP, Uniform Manifold Approximation and Projection; DEGs, differentially expressed genes; WNT, Wnt signaling pathway; TNM, tumor, node, metastasis; FAP, familial adenomatous polyposis; MSI, microsatellite instability; MMR, mismatch repair; GSEA, Gene Set Enrichment Analysis; GSVA, gene set variation analysis.
The datasets used and analyzed during the current study are available from the corresponding author on reasonable request.
Conception and design: JD, XY, JW, QJ. Administrative support: JD, QJ. Provision of study materials or patients: SC, JD, XY, JW. Collection and assembly of data: SC, JF, JW, XY, YJ. Data analysis and interpretation: SC, JF, ZF, YJ. Manuscript writing: SC, JF, ZF. All authors contributed to editorial changes in the manuscript. All authors read and approved the final manuscript. All authors have participated sufficiently in the work and agreed to be accountable for all aspects of the work.
This study was conducted in accordance with the Declaration of Helsinki and was approved by the Ethics Committee of the First Affiliated Hospital of Nanchang University, Nanchang, China (Approval No. 2025-CDYFYYLK-06-021). Written informed consent was obtained from all participants prior to tissue collection.
We thank all patients who donated samples and all clinical staff for their support. We also acknowledge the Accuramed (Guangzhou) Biotechnology Co., Limited for technical assistance in single-cell sequencing.
Natural Science Foundation of China (grant no. 82460484 to Shangxiang Chen, 82260787 to Qunguang Jiang), Jiangxi Provincial Natural Science Foundation (grant no. 20224BAB216065 and 20232BAB206087 to Shangxiang Chen, 20212BAB206035 to Qunguang Jiang), Science and Technology Program of Jiangxi Provincial Health Commission (grant no. 202410173 to Shangxiang Chen).
The authors declare no conflict of interest. Although the authors received technical support from Accuramed (Guangzhou) Biotechnology Co., Limited, the interpretation of the data and the writing of the manuscript were conducted independently and were not influenced by this relationship.
Supplementary material associated with this article can be found, in the online version, at https://doi.org/10.31083/FBL47730.
References
Publisher’s Note: IMR Press stays neutral with regard to jurisdictional claims in published maps and institutional affiliations.