


 , Ryoma Fujita 1, Yuu Akaike 1, Saya Kanie 1, Sotaro Yoshino 1, Shinji Nishikawa 1, Yoshiki Nakamura 1, Kodai Miyagi 1, Satoshi Kishigami 1,2,*
1 Graduate School of Life and Environmental Sciences, Integrated Graduate School of Medicine, Engineering, and Agricultural Sciences, University of Yamanashi, 400-8510 Kofu, Japan
2 Center for Advanced Assisted Reproductive Technologies, University of Yamanashi, 400-8510 Kofu, Japan
Abstract
Optimizing culture conditions is essential for enhancing embryonic developmental potential. During the early developmental stages of preimplantation embryos, pyruvate is preferentially consumed in the lower-glucose environment of the fallopian tube, whereas glucose becomes the primary energy substrate in the higher-glucose uterine environment following compaction. However, the specific effects of glucose exposure on autophagy during early development of preimplantation mouse embryos remained unclear. This study used chloroquine (CQ), an autophagy inhibitor in preimplantation embryos. Furthermore, the effects of glucose exposure on the early embryo were investigated, with a focus on changes in autophagy and mitochondrial dependency during the process of embryo development.
We examined the sensitivity of in vivo–fertilized embryos (1-cell and 2-cell flushed embryos; 1-CF and 2-CF, respectively) and in vitro–fertilized (IVF) embryos to CQ, and to rotenone, a mitochondrial respiration inhibitor, from the 2-cell stage. Furthermore, using glucose-free CZB medium and glucose-containing modified CZB (mCZB), comparisons were made of development rates, autophagy activity measured with DAPGreen, and mitochondrial activity measured with MitoTracker. Additionally, we examined the effects of O-GlcNAc transferase (OGT) inhibition using the OGT inhibitor OSMI-1.
Under CQ treatment, the blastocyst formation rate decreased significantly in IVF embryos and 1-CF embryos cultured in mCZB compared to 2-CF embryos, starting at 2.0 μM CQ treatment and this was accompanied by reduced cell numbers. Interestingly, autophagy activity detected by DAPGreen was significantly higher at the morula stage in IVF embryos compared with in 2-CF embryos. Oppositely, under rotenone treatment, the blastocyst formation rate increased significantly in IVF embryos and 1-CF embryos compared to 2-CF embryos, starting at 1.0 μM rotenone treatment. Next, glucose-deprived IVF embryos, which cultured in CZB for 24 hours starting at 2 hours after insemination, exhibited increased sensitivity to rotenone during development and elevated mitochondrial activity at the 2-cell stage, followed by decreased autophagy activity at the 4/8-cell stage. Finally, OSMI-1 treatment in mCZB for 24 hours starting at 2 hours after insemination showed an increased mitochondrial activity at the 2-cell stage but, unexpectedly, these embryos showed a tendency toward increased CQ sensitivity.
Our data indicate that, regardless of fertilization conditions, glucose exposure immediately after fertilization begins to shift preimplantation mouse embryos towards a more autophagy-dependent and less mitochondria-dependent mode of development. This shift is accompanied by increased autophagy activity and reduced mitochondrial activity, potentially mediated in part by O-GlcNAc modification.
Keywords
- fertilization in vitro
- animals
- mice
- autophagy
- mitochondria
- glucose
The development of fertility treatment and in vitro culture techniques has contributed to the birth of many babies [1, 2, 3]. At the same time, however, nutrient supply and metabolism from culture media during preimplantation embryonic development are considered important determinants of long-term effects on both embryonic development and postnatal development [4, 5, 6, 7]. In particular, in vitro culture of preimplantation embryos can influence birth weight [8], the development of cardiovascular dysfunction in adulthood [9], placental morphology and DNA methylation levels [10], as well as impaired glucose tolerance [11]. Although the mechanism underlying these phenotypes remain enigma, even a short period in an in vitro environment may trigger alterations in the developmental trajectory, leading embryos to establish an in vitro–environment–specific developmental program [12].
Mouse preimplantation embryos in the body migrate to the fallopian tube between days 1 and 3 of embryonic development, reaching the uterine cavity on days 4 and 5. Furthermore, Preimplantation embryos exhibit significant metabolic differences before and after compaction [13]. In the fallopian tube environment, where pyruvate concentrations are high and glucose concentrations are low during the early development of preimplantation embryos in most species, including humans, pyruvate is preferentially consumed, and oxidative phosphorylation is used to generate energy. It is known that in the uterine environment after compaction, where pyruvate concentrations are low and glucose concentrations are high, glucose becomes the primary energy substrate.
In general, for in vitro culture of mouse embryos following in
vitro fertilization, one media enabling development from the post-fertilization
single-cell stage to the blastocyst stage has been developed in the 1990s such as
KSOM and modified CZB (mCZB) [13, 14]. These media contained nutrients that
allowed selection of embryos without requiring media changes, thereby reducing
stress on the embryos. CZB (Chatot-Ziomek-Bavister) medium was originally
developed as a glucose-free medium that allows 1-cell CF-1
Autophagy that degrades proteins and organelles includes macroautophagy, microautophagy, and chaperone-mediated autophagy [24]. Isolated membranes are induced during nutrient starvation and immediately after fertilization, forming autophagosomes that perform the vital function of recycling intracellular components [25, 26, 27, 28, 29] Preimplantation embryos deficient in autophagy have been reported to arrest development after the 4–8 cell stage, indicating autophagy is essential for preimplantation development [30, 31, 32]. However, it remains unclear how autophagy-mediated nutrient supply at this stage influences long-term outcomes. Chloroquine (CQ), a well-established antimalarial agent [33, 34], is also used in the management of inflammatory diseases [35]. In addition to these clinical applications, CQ functions as an inhibitor of autophagy [36] and has been utilized in studies involving preimplantation embryos [37]. Recently, using CQ and IVF, we demonstrated that mouse preimplantation embryos continue to require autophagy for their development even beyond the morula stage [38]. Furthermore, using in vivo-fertilized embryos, we found that adding CQ to the culture medium suppressed the long-term effects of in vitro culture such as increased body weight and glucose intolerance [39]. This suggests that autophagy during preimplantation development is involved in the long-term effects caused by in vitro culture. While further examining the CQ effect on the long-term consequences in IVF embryos, we incidentally observed that IVF embryos are susceptible to CQ.
In this study, we focused on the shift towards greater autophagy dependency and reduced mitochondrial dependency in IVF embryos caused by glucose exposure during the 1- to 2-cell stage, which results in characteristics distinct from those of in vivo-fertilized and developed embryos. Our results provide new insights into understanding IVF embryo physiology.
ICR strain female and male mice, aged 8–12 weeks, were purchased from Shizuoka Laboratory Animal Center (SLC) Inc. (Hamamatsu, Japan). The mice were maintained in a SPF room (25 °C, 50% humidity, and a 14/10-hour light-dark cycle). Mice were fed ab libitum with a standard pelleted diet and allowed free access to distilled water. All the animal experiments were approved by the Animal Experimentation Committee at the Univeristy of Yamanashi (Ethics Approval Number: A6-19). Animal handling and experimental procedures adhered to the 3Rs principles and were conducted in accordance with the Guidelines for Proper Conduct of Animal Experiments (Science Council of Japan). All mice used in this study were euthanized by cervical dislocation.
Female ICR (Institute of Cancer Research) mice were injected intraperitoneally with 7.5 IU of equine chorionic gonadotropin (eCG), followed 48 hours later by 7.5 IU of human chorionic gonadotropin (hCG) (ASKA Pharmaceutical, Tokyo, Japan) to induce superovulation. After hCG injection the superovulated females were mated with ICR males, and about 16 hours later, a vaginal plug check was performed. Approximately 6 or 30 hours after confirmation of a vaginal plug (for collection of 1-cell or 2-cell embryos, respectively), pluged female mice were then euthanized by cervical dislocation and the fallopian tubes were collected in microcentrifuge tube. The collected fallopian tubes were placed in HEPES-supplemented mCZB medium (HEPES-mCZB) (Sigma-Aldrich Chemical Co., St. Louis, MO, USA) [40]. The oviduct was flushed from the fimbrial end with HEPES-mCZB under a stereomicroscope. The flushed 1-cell or 2-cell stage embryos were collected and transferred into drops of mCZB medium (5.56 mM glucose-containing) or CZB medium (glucose-free) [14, 15]. Embryos were maintained at 37 °C under 5% CO2 in air until the appropriate developmental stage was achieved. The experimental procedures were conducted according to previously published protocols with minor modifications [41].
IVF was performed as previously described [42]. Briefly, male ICR mice aged 10
weeks or older were euthanized by cervical dislocation, and the cauda
epididymides were collected. The cauda epididymides were punctured to release
sperms, which were then placed in droplets of human tubal fluid (HTF) medium and
incubated at 37 °C in 5% CO2 for at least 30 minutes to allow
capacitation. HTF medium was also used for insemination during IVF [43]. Female
ICR mice aged 8 weeks or older were superovulated as described above. 16 h after
hCG injection, the cumulus-oocyte-complexes (COCs) were collected from the
oviducts and transferred into HTF medium droplets. Aliquots of sperm were added
to the medium containing COCs to achieve a final concentration of 1.0
CQ (C6628; Sigma-Aldrich, St. Louis, MO) was dissolved in H2O to a concentration of 5 mM and aliquoted into in 1-µL portions. A 5 mM CQ stock solution was diluted in CZB medium to final concentrations of 4 µM, 2 µM, and 1 µM. For CQ treatment, the collected embryos were transferred to CQ-containing medium droplets and cultured at 37 °C in a humidified atmosphere of 5% CO2.
Rotenone powder (R0090; Tokyo Chemical Industry Co., Ltd., Tokyo, Japan) was dissolved in dimethyl sulfoxide (DMSO) to prepare a 2 mM stock solution. The stock solution was aliquoted in 1-µL portions and stored at –30 °C. Before use, it was diluted in CZB medium to obtain final concentrations of 0–4 µM.
OSMI-1 powder (AB235455; Abcam, Cambridge, UK) was dissolved in DMSO to prepare a 10 mM stock solution. A 10 mM stock solution of OSMI-1 was diluted in CZB medium to final concentrations of 15 µM and 30 µM. For OSMI-1 treatment, the collected embryos were transferred to OSMI-1-containing medium droplets and cultured at 37 °C in a humidified atmosphere of 5% CO2.
Immunostaining was performed as previously described with slight modifications [44]. To further assess embryo quality, blastocysts cultured with or without CQ supplementation were subjected to immunostaining for caudal type homeobox 2 (Cdx2) and Nanog, markers of the trophectoderm (TE) and inner cell mass (ICM), respectively. Briefly, embryos were washed twice in phosphate-buffered saline (PBS) containing 1% polyvinyl alcohol (PBS-PVA) and fixed in 4% paraformaldehyde (PFA) in PBS for 30 minutes at room temperature. After washing in PBS-PVA, embryos were incubated overnight at 4 °C in blocking buffer (0.1% Triton X-100 and 1% bovine serum albumin [BSA] in PBS). The embryos were then incubated overnight at 4 °C with primary antibodies diluted in blocking buffer. The following primary antibodies were used: anti-Nanog (1:500, ab80892, Abcam, Cambridge, UK) , anti-Cdx2 (1:500, MU392-UC, BioGenex, Fremont, CA, USA), anti-LC3 pAb (1:1000, PM036, MBL, Nagoya, Japan), and mouse anti-O-GlcNAc RL2 (1:500, NB300-524, Novus Biologicals, Centennial, CO, USA). After washing in PBS-PVA, embryos were subsequently incubated with secondary antibodies, Alexa Fluor 488-conjugates anti-rabbit IgG (1:500) and Alexa Flour anti-mouse IgG (1:500), for 2 h at room temperature. After washing with PBS, embryos were mounted on glass slides in Vectashield (Vector Laboratories, Burlingame, CA, USA) supplemented with 1 µg/mL 4′,6-diamidino-2 phenylindole (DAPI). Fluorescence images were acquired using a fluorescence microscope (BZ-800; Keyence, Osaka, Japan) with identical laser settings applied to all samples.
To examine the changes in autophagy activity induced by low-concentration CQ treatment, DAPGreen (Dojindo, Kumamoto, Japan) staining was performed on CQ-treated embryos, as well as untreated and naturally mated embryos at the morula embryo stage. DAPGreen was dissolved in DMSO to prepare a 0.02 mM stock solution, which was then diluted 200-fold in mCZB medium to a final concentration of 1 µM. Embryos were incubated in this solution for 30 min at 37 °C, washed with mCZB medium, and incubated for an additional 30 min. Fluorescence signals were observed using a fluorescence microscope (BZ-800; Keyence, Osaka, Japan) under identical exposure settings.
0.5 mM Mito Tracker (Thermo M7513) stock was aliquoted into 1 µL portions and stored at –30 °C. Upon use, it was diluted 1000-fold in mCZB medium, and embryos were stained for 30 minutes.
Statistical analyses were conducted using JMP Pro software version 17.0 (SAS Institute Inc., Cary, NC, USA). Data were analyzed using one-way ANOVA followed by Tukey’s or Fisher’s LSD multiple comparison tests when appropriate. p-values less than 0.05 were categorized as statistically significant. Graph figures were generated by GraphPad Prism 10 Version 10.3.1 (2024) (GraphPad Software, LLC, Boston, MA, USA). Blastocyst formation rates were analyzed using the Tukey–Kramer test for pairwise comparisons, with each independent experiment regarded as one biological replicate.
In our previous study, we evaluated the concentration-dependent effects of CQ on preimplantation development using 2-cell embryos (2-CF) obtained by oviductal flushing after in vivo fertilization. When examining implanted embryos at progressively lower concentrations, the lowest concentration at which embryo development was possible was 2.0 µM CQ. In this experiment, embryos obtained via in vitro fertilization (IVF) and 1-cell flush (1-CF) after in vivo fertilization were subjected to low-concentration CQ treatment from the 2-cell stage for 48 hours to investigate effects on development and cell differentiation. Treatment groups consisted of 0, 1.0, 2.0, and 4.0 µM CQ (Fig. 1A). Unexpectedly, the IVF-derived development rate showed a tendency to decrease in a CQ concentration-dependent manner. Notably, embryos treated with 2.0 µM CQ exhibited a significant decline in developmental rate compared with the 2-CF group, resulting in blastocyst formation rates below 30% (Fig. 1B). Next, to examine the effects on cell differentiation, immunostaining was performed using antibodies against Cdx2 and Nanog, molecular markers of the trophectoderm (TE) and inner cell mass (ICM), respectively (Fig. 1C). The total cell number in each group decreased in a CQ concentration-dependent manner, with 2-CF embryos exhibiting the highest cell number (Fig. 1D). Similarly, the number of Cdx2-positive cells (Fig. 1E) and Nanog-positive cells (Fig. 1F) was highest in the 2-CF. Regardless of treatment with 0, 1.0, or 2.0 µM CQ, the number of cells in the 1-CF showed a significant decrease compared to the 2-CF. Next, we performed DAPGreen staining of 2-CF and IVF embryos at the morula-stage as well as morula flush embryos (MF) obtained by flushing the morula stage, to examine their autophagy activity levels (Fig. 1G). At the morula stage, DAPGreen relative fluorescence intensity was highest in IVF embryos. Conversely, the lowest fluorescence intensity was observed in embryos that developed in vivo up to the morula stage (Fig. 1H). These results suggest that IVF embryos exhibit the highest autophagic activity, reflecting an autophagy-dependent mode of development that is consistent with their sensitivity to CQ.
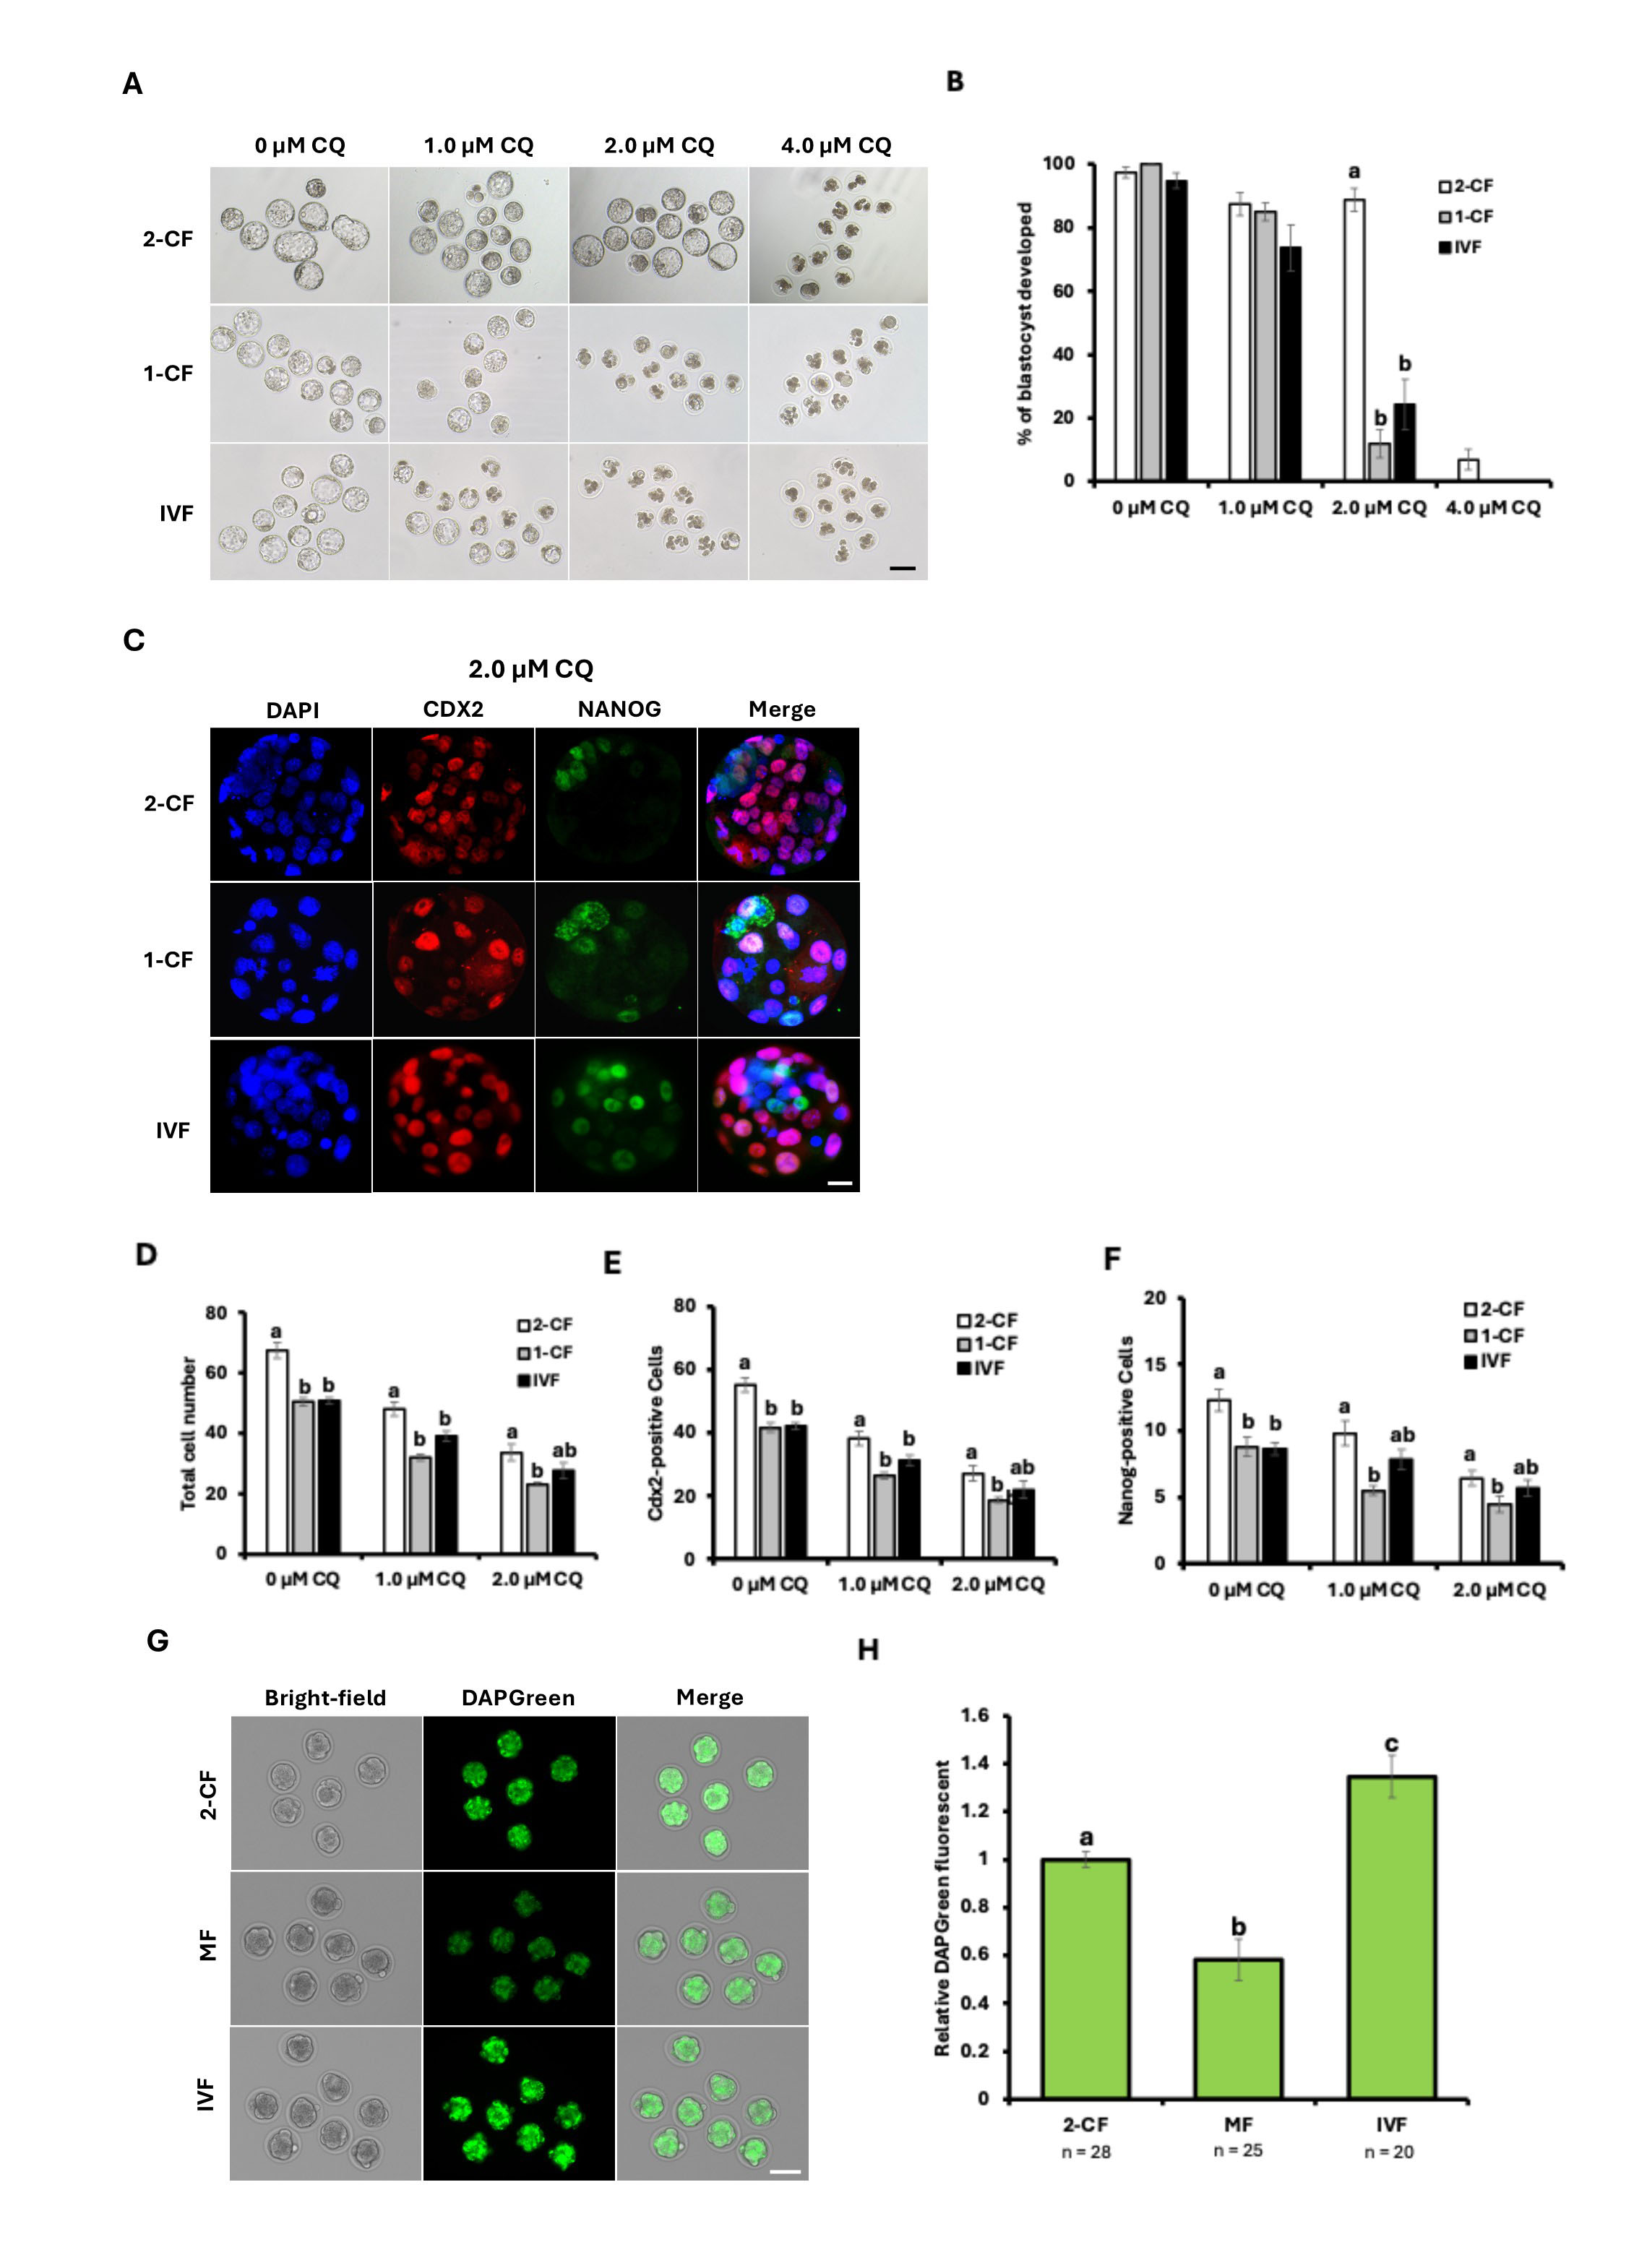 Fig. 1.
Effects of CQ treatment on the development and cell
differentiation of IVF and in vivo-fertilized embryos. (A)
Representative images of the blastocyst stage of IVF embryos and the blastocyst
stage of in vivo fertilized embryos (1-CF, 2-CF) at each CQ
concentration. Embryos cultured from the 2-cell stage in CZB medium were cultured
at concentrations of 0 µM, 1.0 µM, 2.0 µM,
and 4.0 µM CQ. Scale bar = 100 µm. (B) Blastocyst
formation rate in the CQ-treated groups (1-CF, 2-CF and IVF embryos): 0
µM, 1.0 µM, 2.0 µM, and 4.0
µM CQ (p
In this experiment, we further investigated the dependence of preimplantation embryos on mitochondrial respiratory chain function by employing rotenone (Ro), a mitochondrial complex I inhibitor, to examine energy metabolism mediated by mitochondria in detail. First, we used 2-CF cultured in vivo up to the 2-cell stage, 1-CF cultured in vivo up to the 1-cell stage, IVF embryos were treated with Ro at concentrations of 0 µM, 1.0 µM, 2.0 µM, and 4.0 µM starting from the 2-cell stage. These embryos were then cultured in vitro to examine Ro sensitivity differences influenced by fertilization conditions and in vitro culture duration (Fig. 2A). In 2-CF embryos, the development rate decreased in a Ro concentration-dependent manner, dropping to a blastocyst formation rate of 16% in the 2.0 µM Ro group. Furthermore, in the 4.0 µM Ro group, only IVF embryos developed to the blastocyst stage, but the blastocyst rate was a mere 11%. However, both IVF embryos and 1-CF embryos showed similar blastocyst development rates at 0 µM Ro, 1.0 µM Ro, and 2.0 µM Ro (Fig. 2A). These results suggest that 24 hours of in vitro culture starting from the 1-cell stage may reduce Ro sensitivity, regardless of the fertilization environment. Furthermore, based on previous results, glucose exposure up to the two-cell stage—which differs from the in vivo environment—is considered a factor altering Ro sensitivity depending on culture conditions. Therefore, focusing on glucose exposure time in IVF embryos, we cultured embryos in vitro up to the 2-cell stage using mCZB (glucose-containing) and CZB medium (glucose-free) after IVF, under conditions of either standard 6-hour insemination or 2-hour insemination, followed by Ro treatment. Under standard 6-hour IVF conditions, no difference in Ro sensitivity was observed between mCZB and CZB culture conditions, regardless of Ro concentration (Fig. 2B). However, when the IVF duration was shortened to 2 hours to minimize glucose effects, culture in CZB medium until the 2-cell stage resulted in a Ro concentration-dependent decrease in blastocyst formation (Fig. 2C). To further clarify the effects of shortened fertilization time and avoidance of glucose exposure until the 2-cell stage on embryo development and blastocyst quality, immunofluorescence staining was performed using antibodies against Cdx2 and Nanog (Fig. 2D–F). Analysis results showed a tendency for total cell count, TE cell count, and ICM cell count to decrease in a Ro concentration-dependent manner. However, the difference in effects between mCZB and CZB medium resulted in only a slight decrease in cell count at all cells counts, with no significant effect observed. These results suggest that shortening the medium exposure time to 2 hours and culturing cells in CZB medium until the two-cell stage increases subsequent rotenone sensitivity. To determine whether mitochondrial metabolism was increased, mitochondrial membrane potential at the 2-cell stage was compared using Mito Tracker (Fig. 2G). The results showed that Mito Tracker fluorescence intensity was significantly increased by both the 2-hour medium treatment and culture in CZB medium until the two-cell stage (Fig. 2H). These results suggest that minimizing glucose exposure until the 2-cell stage increases mitochondrial activity at that stage and enhances dependence on mitochondrial function during subsequent development.
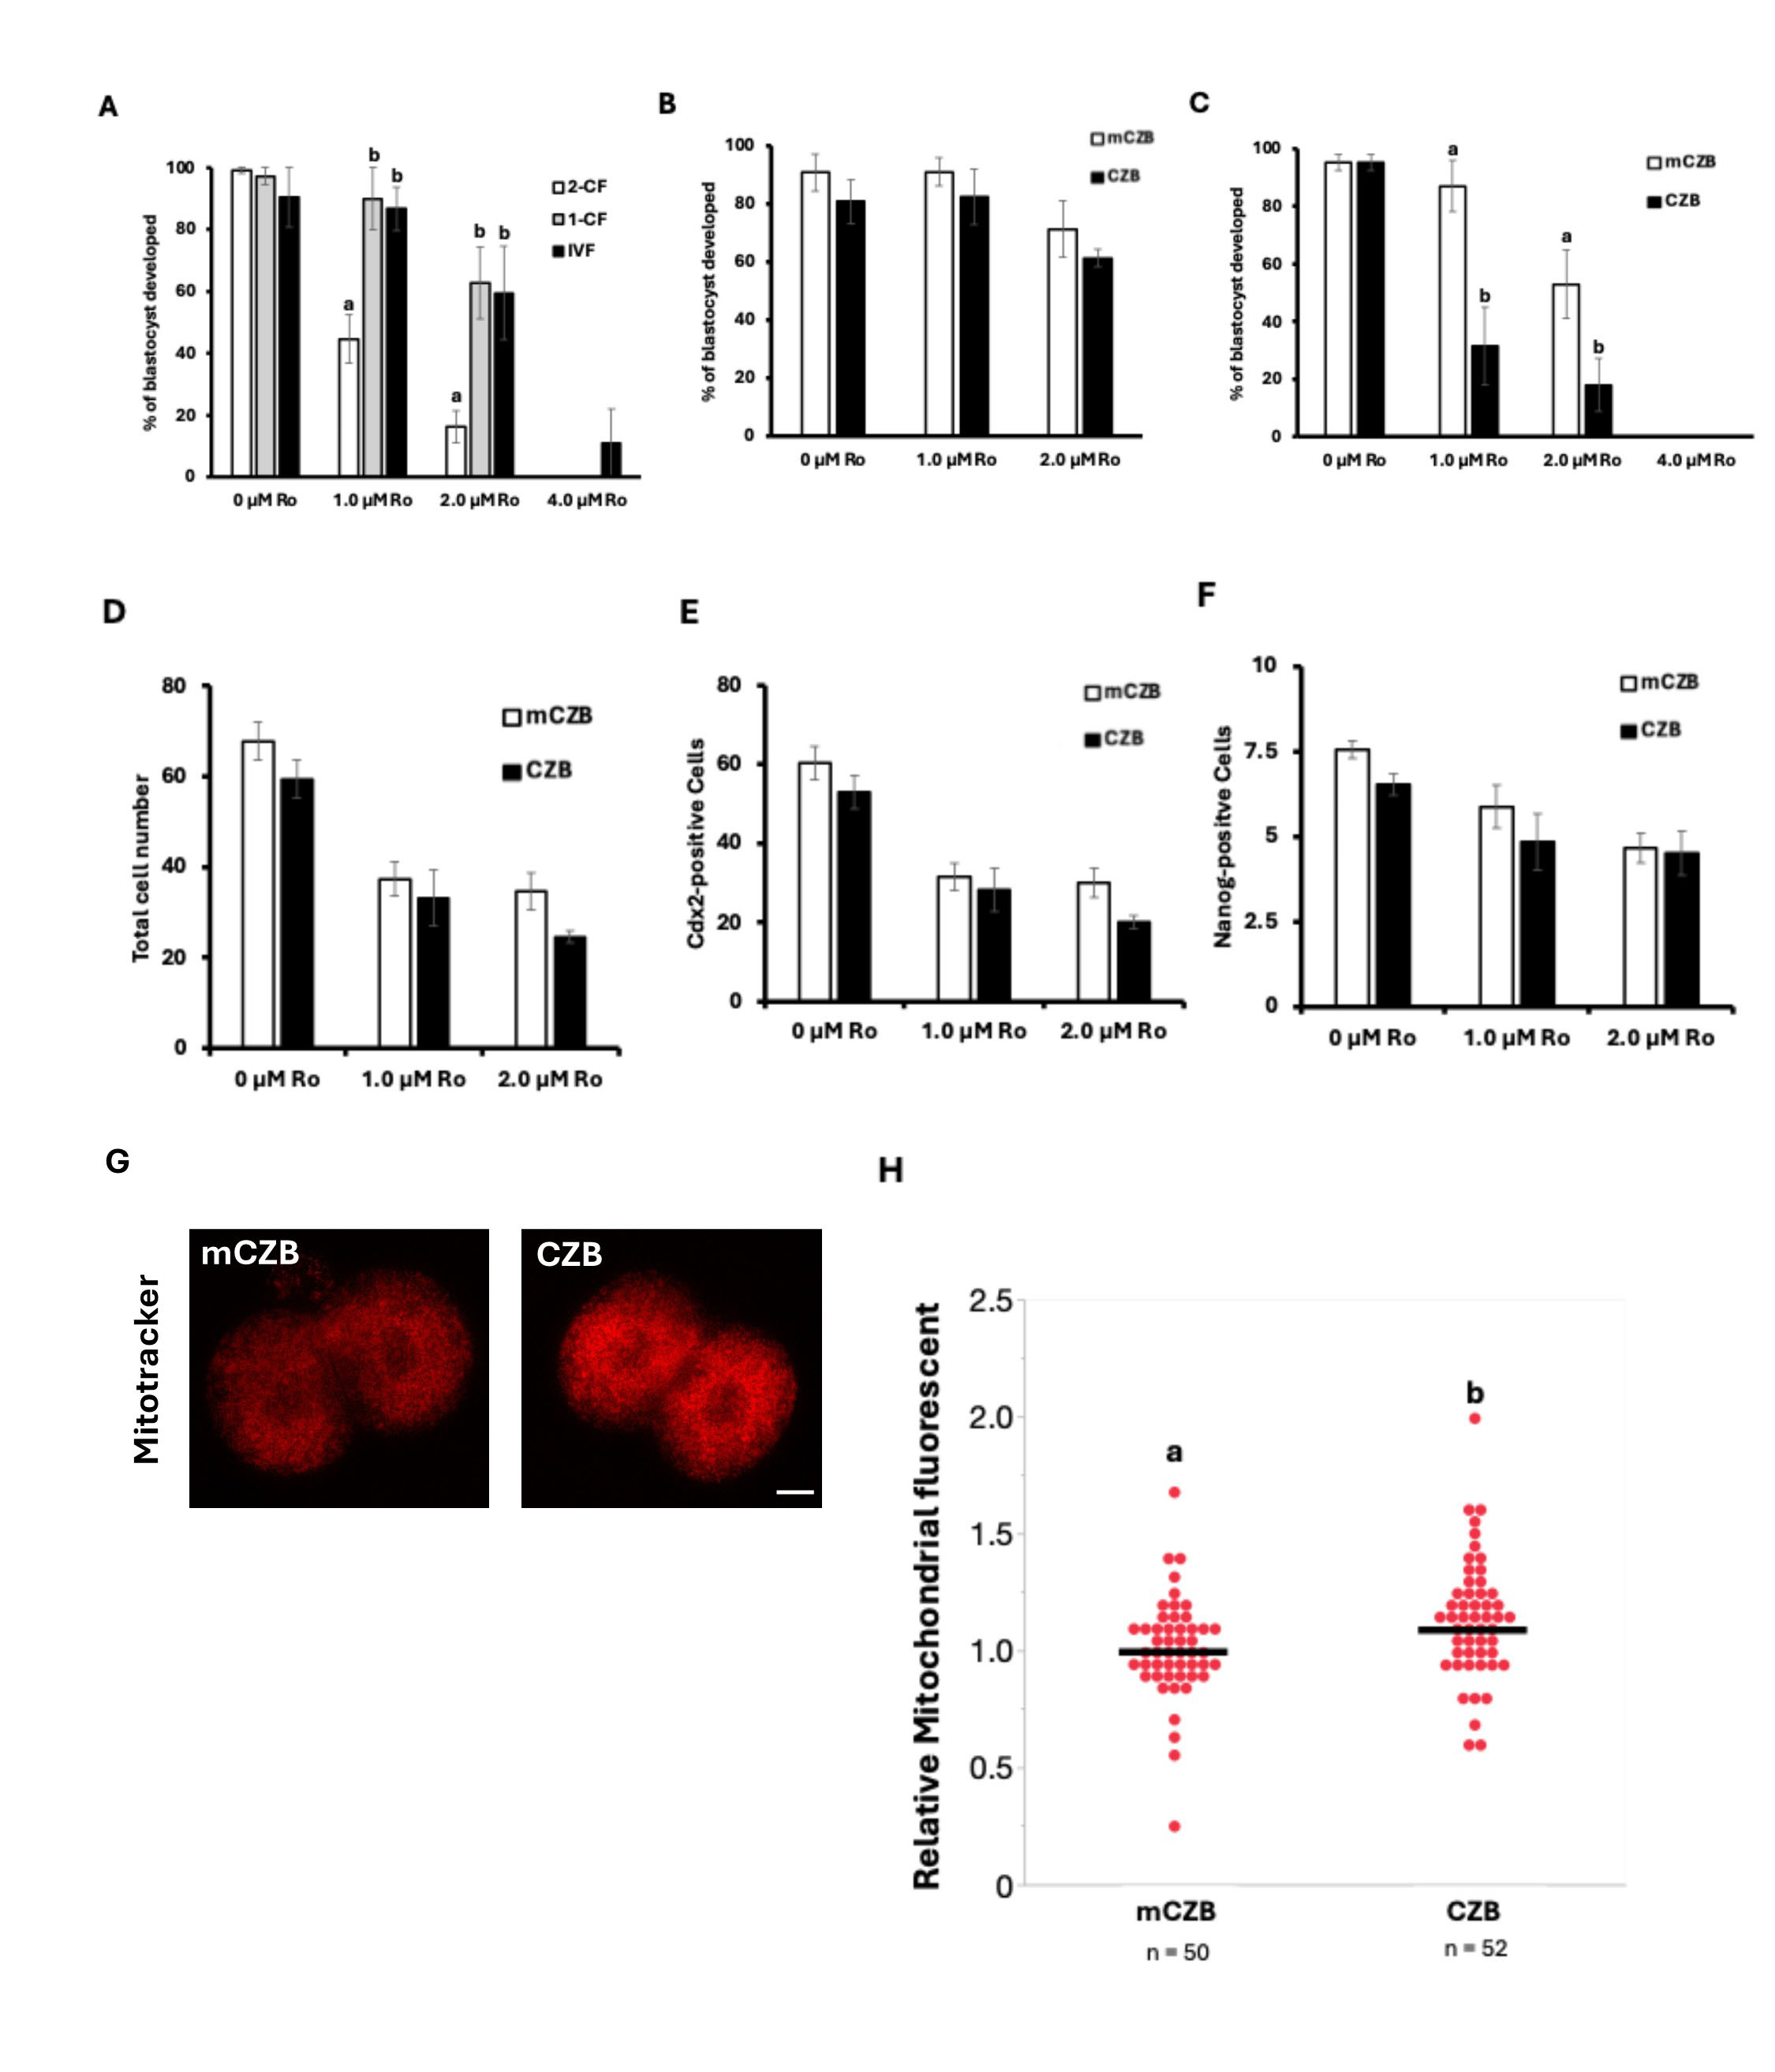 Fig. 2.
Comparison of blastocyst formation rates in IVF embryos treated
with various concentrations of rotenone (Ro) from the 2-cell stage onward. (A)
Blastocyst formation rates of IVF and 2-CF, 1-CF, and 0 µM, 1.0
µM, 2.0 µM, 4.0 µM Ro. Comparison of
blastocysts cultured in CZB medium from 6 hours post-fertilization until the
2-cell stage. (B) Blastocyst formation rates after 0 µM, 1.0
µM, 2.0 µM Ro treatment. Comparison of in
vitro fertilized blastocysts cultured in mCZB and CZB medium from 6 hours
post-fertilization until the 2-cell stage. (C) Blastocyst formation rates after 0
µM, 1.0 µM, 2.0 µM Ro treatment.
Comparison of in vitro fertilized blastocysts cultured in mCZB and CZB
medium from 2 hours post-fertilization until the 2-cell stage. (D) Comparison of
total cell numbers after DAPI, Cdx2, and Nanog immunostaining in IVF blastocysts
cultured starting at 2 hours after insemination to the 2-cell stage in mCZB and
CZB media with 0 µM, 1.0 µM, 2.0 µM and
4.0 µM Ro. (E) Comparison of Cdx2-positive cell numbers. (F)
Comparison of Nanog-positive cell numbers. (G) MitoTracker fluorescence images of
embryos cultured in mCZB and CZB medium from 2 hours post-fertilization to the
2-cell stage, with or without glucose. Scale bar = 25 µm. (H) Plot
of MitoTracker fluorescence intensity in mCZB and CZB medium. Data represent the
mean
In this experiment, to investigate whether glucose exposure time up to the 2-cell stage could cause differences in CQ susceptibility during preimplantation embryo development, we shortened the insemination time from 6 hours to 2 hours in conventional IVF embryos and considered the glucose concentration (2.25 mM) in the HTF medium used for insemination. Furthermore, we used CZB medium, which is mCZB medium with glucose removed, for in vitro embryo culture and examined the effects of glucose exposure from fertilization to the 2-cell stage. CQ concentrations were 0, 1.0, 2.0, and 4.0 µM CQ, as previously used, and low-concentration CQ treatment was performed for 48 hours from the 2-cell stage to the morula stage after IVF. Embryo development rates decreased in the 2.0 and 4.0 µM CQ groups after the morula stage (Fig. 3A). Like previous experiments, a CQ concentration-dependent decrease in development rate was observed. However, the blastocyst formation rate was 91% in the 1.0 µM CQ group, 71% in the 2.0 µM CQ group, and 20% in the 4.0 µM CQ group (Fig. 3B). Surprisingly, these results demonstrated that the development rate of IVF using mCZB medium could be restored in all treatment groups by reducing glucose exposure time (Fig. 3A,B). Furthermore, as previously, cell counts for total cells, TE, and ICM cells were measured and compared using immunostaining. Regarding total cell count, a CQ concentration-dependent decrease in cell number was observed as in previous studies. However, in this experiment using CZB medium, cell numbers increased in all experimental groups compared to conventional IVF using mCZB medium. Notably, the 2.0 µM CQ-treated group showed a marked tendency toward increased cell numbers (Fig. 3C). The cell count in the 0 µM CQ-treated group was 53, in the 1.0 µM CQ-treated group it was 40, in the 2.0 µM CQ-treated group it was 33, and in the 4.0 µM CQ-treated group it was 21. Furthermore, a CQ concentration-dependent decrease in the number of Cdx2- and Nanog-positive cells was also observed (Fig. 3D). Next, DAPGreen staining was performed at the 2-cell stage and 4–8-cell stage to examine changes in autophagy activity with and without glucose. The experimental groups consisted of embryos cultured in vitro in mCZB medium until the 2-cell stage or 4–8-cell stage (mCZB) and embryos cultured in vitro in CZB medium (Fig. 3E). At the 2-cell stage, DAPGreen fluorescence intensity was significantly higher in CZB embryos. Conversely, at the 4–8-cell stage, mCZB embryos showed a significantly higher trend (Fig. 3F,G). These results indicate that autophagy activity differs at least depending on glucose availability. To confirm these differences in autophagy activity, LC3 immunostaining was performed. Consistently, the relative LC3 fluorescence intensity was lower in the CZB group than in the mCZB group at the 2-cell stage, whereas this pattern was reversed at the 4–8-cell stage, suggesting enhanced LC3 degradation via autophagy (Fig. 3H–J).
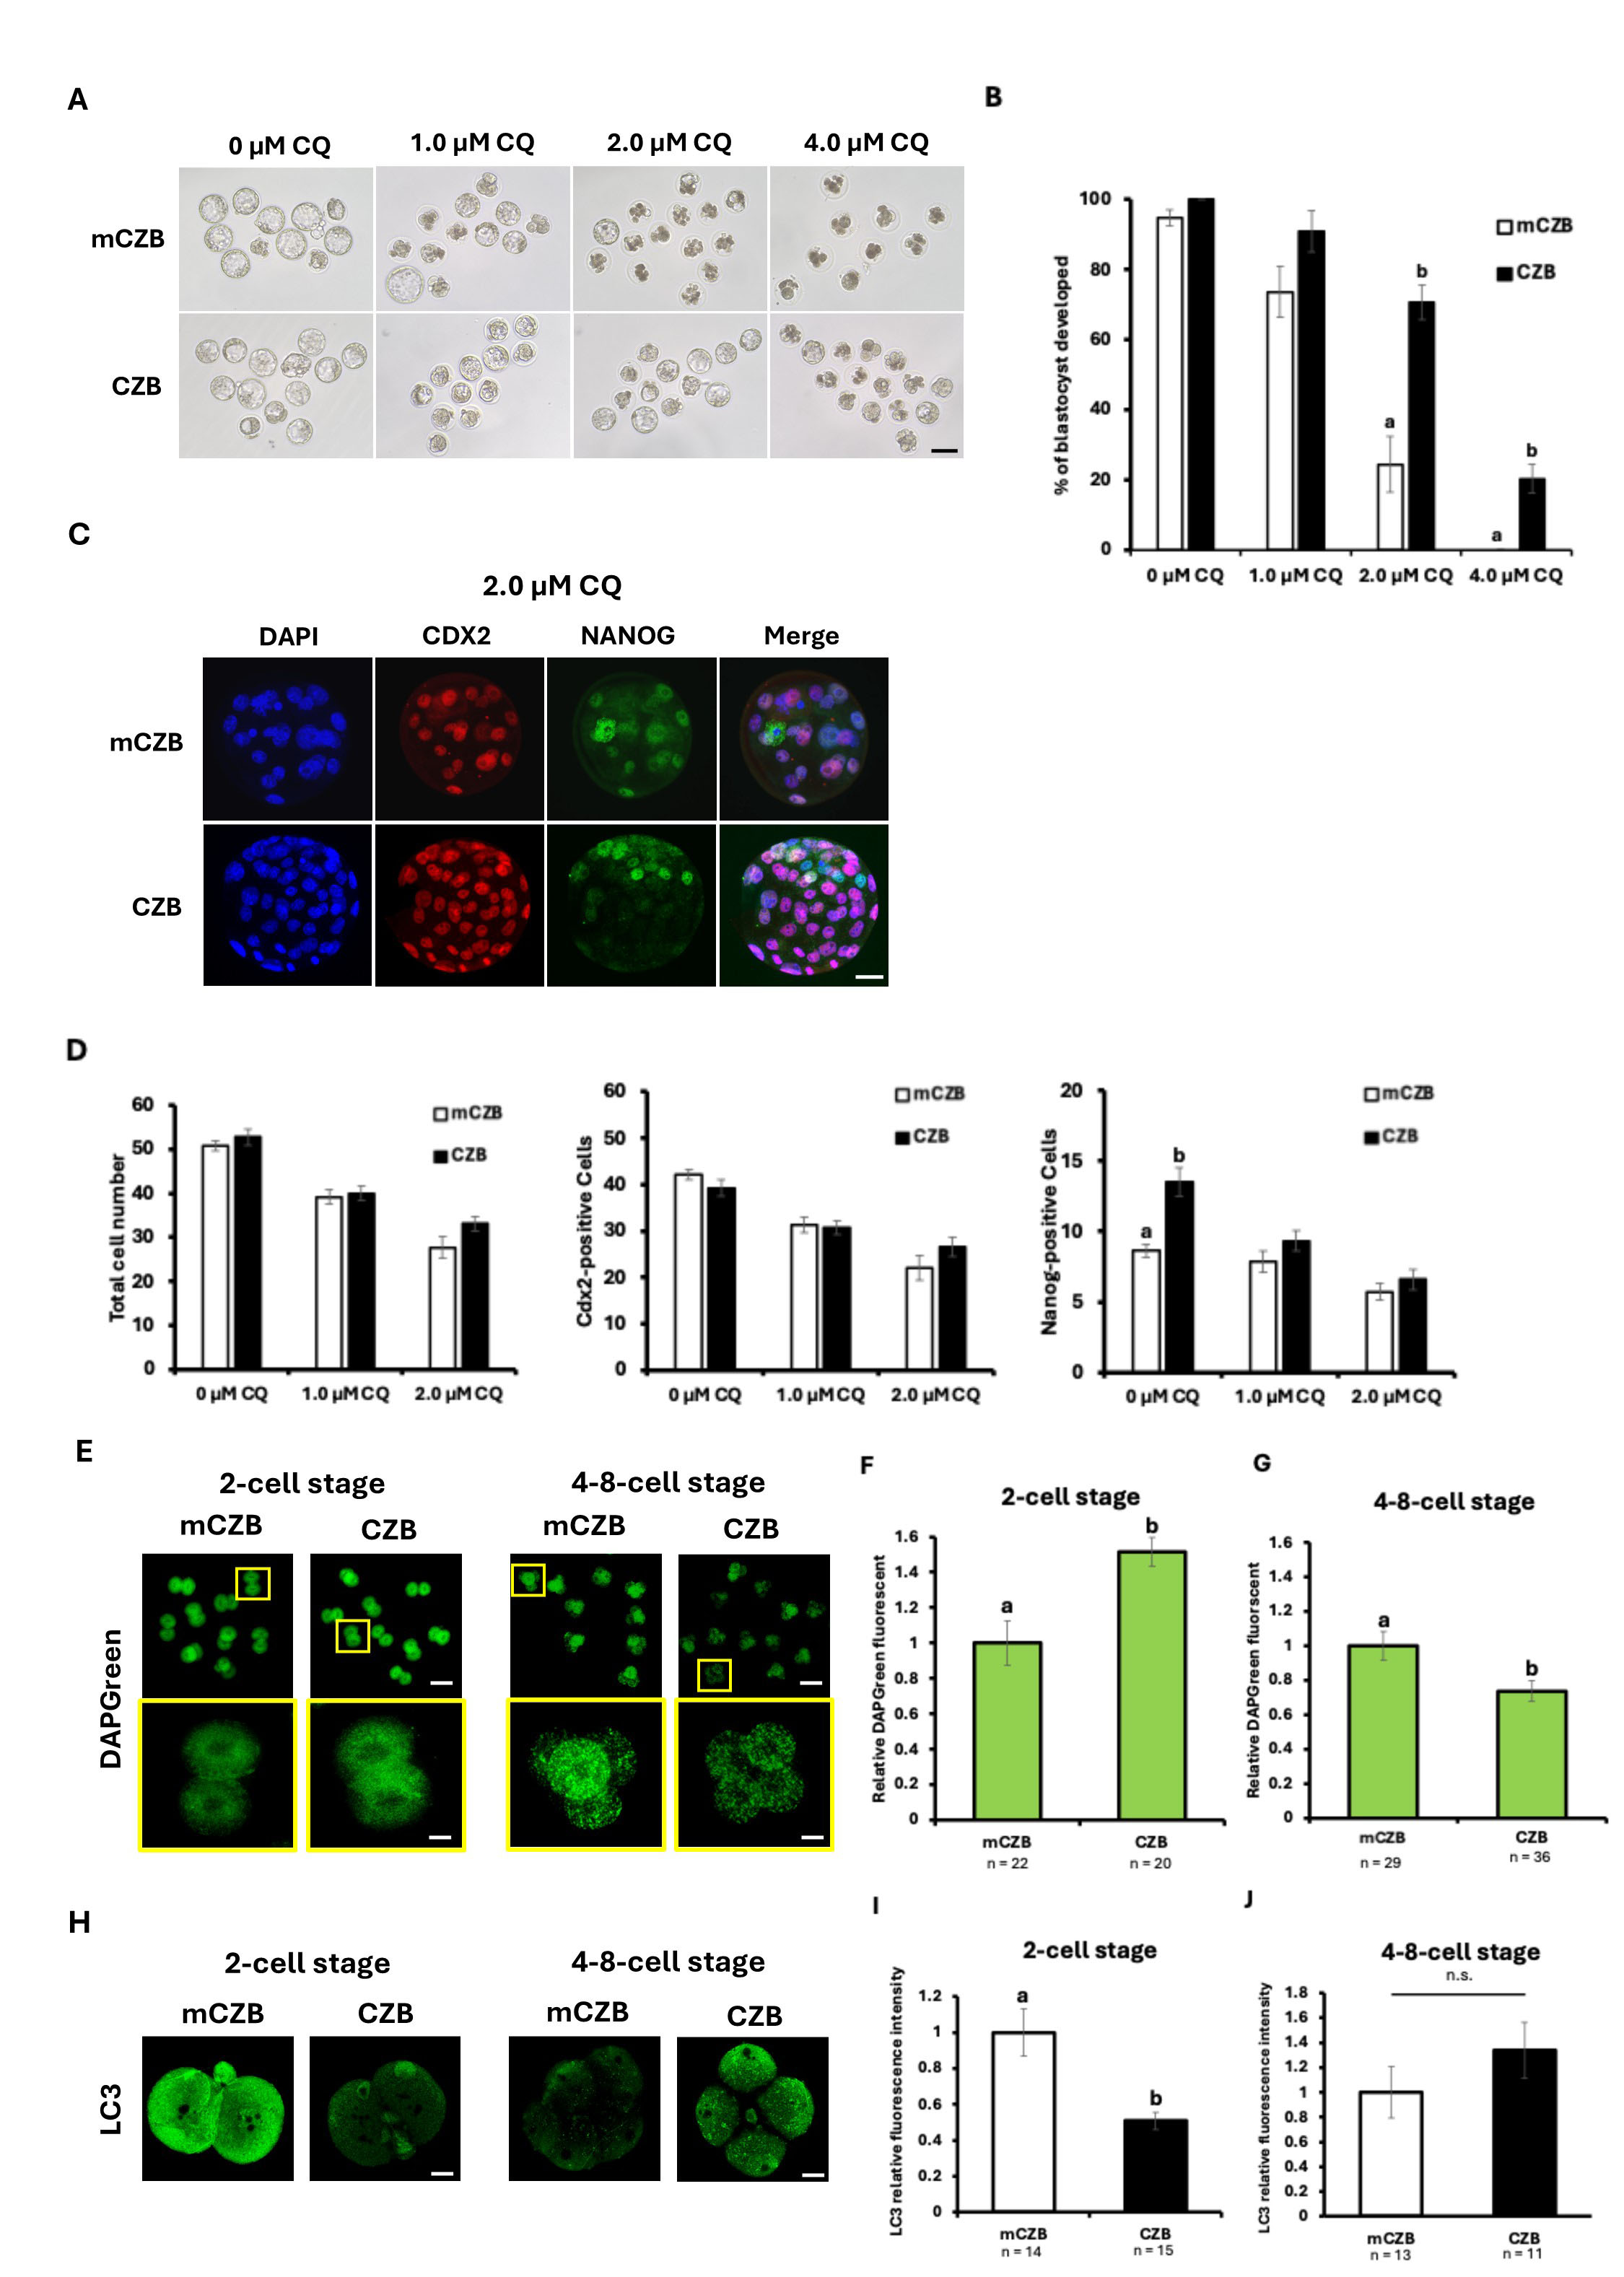 Fig. 3.
Effects of CQ treatment on the development and cell
differentiation of IVF embryos cultured from 2 hours post-insemination to the
2-cell stage in glucose-free medium. (A) Representative images of IVF embryos
cultured to the 2-cell stage in mCZB and CZB medium, then treated with 0
µM CQ, 1.0 µM CQ, 2.0 µM CQ, or 4.0
µM CQ. Scale bar = 100 µm. (B) Blastocyst formation
rate after CQ treatment in IVF embryos cultured in vitro with mCZB and
CZB medium with 0 µM CQ, 1.0 µM CQ, 2.0 µM
CQ, 4.0 µM CQ (p
In this study, we examined the effects of the OGT inhibitor OSMI-1 (OS) on embryonic sensitivity to CQ by treating embryos with OSMI-1 at concentrations of 15 or 30 µM. IVF embryos were cultured in mCZB medium with OS from 2 hours post-insemination until the 2-cell stage. These 2-cell stage IVF embryos were then cultured in mCZB and the blastocyst rate was examined. In the absence of CQ, embryos treated with 15 µM OS showed a blastocyst rate of 96%, equivalent to the control group. In contrast, embryos treated with 30 µM OS had a blastocyst rate of 82%, showing a slight tendency toward reduced development compared to the control (Fig. 4A). Furthermore, when MitoTracker staining was performed at the 2-cell stage, fluorescence intensity was significantly increased by 30 µM OS treatment compared to the control group (Fig. 4B,C). Furthermore, it was experimentally confirmed that OS treatment with 15 µM and 30 µM significantly reduced O-GlcNAc modification levels compared to the untreated control group (Fig. 4D,E). Subsequently, CQ treatment was applied to each of these embryos after the 2-cell stage to investigate the effect on CQ sensitivity. Unexpectedly, in the presence of 1.0 µM CQ, the developmental rate was significantly reduced by treatment with either 15 or 30 µM OS. Similarly, in the 2.0 µM CQ group, the blastocyst rate was greatly reduced by OS treatment. In the 4.0 µM CQ-treated group, development to the blastocyst stage did not occur after 15 µM OS treatment (Fig. 4F). These results indicate that OS treatment up to the 2-cell stage caused a decrease in the development rate of CQ-treated embryos compared to the control group. Additionally, autophagy activity was measured by DAPGreen staining in the 2-cell stage of each OS-treated group (Fig. 4G). The results showed a significant increase in fluorescence intensity in the 15 µM OS group compared to the 0 µM OS group, and a similar trend was also observed in the 30 µM OS group (Fig. 4H). Collectively, these data suggest that glucose-exposure after fertilization reduces mitochondrial function and autophagy activity via O-GlcNAc modification.
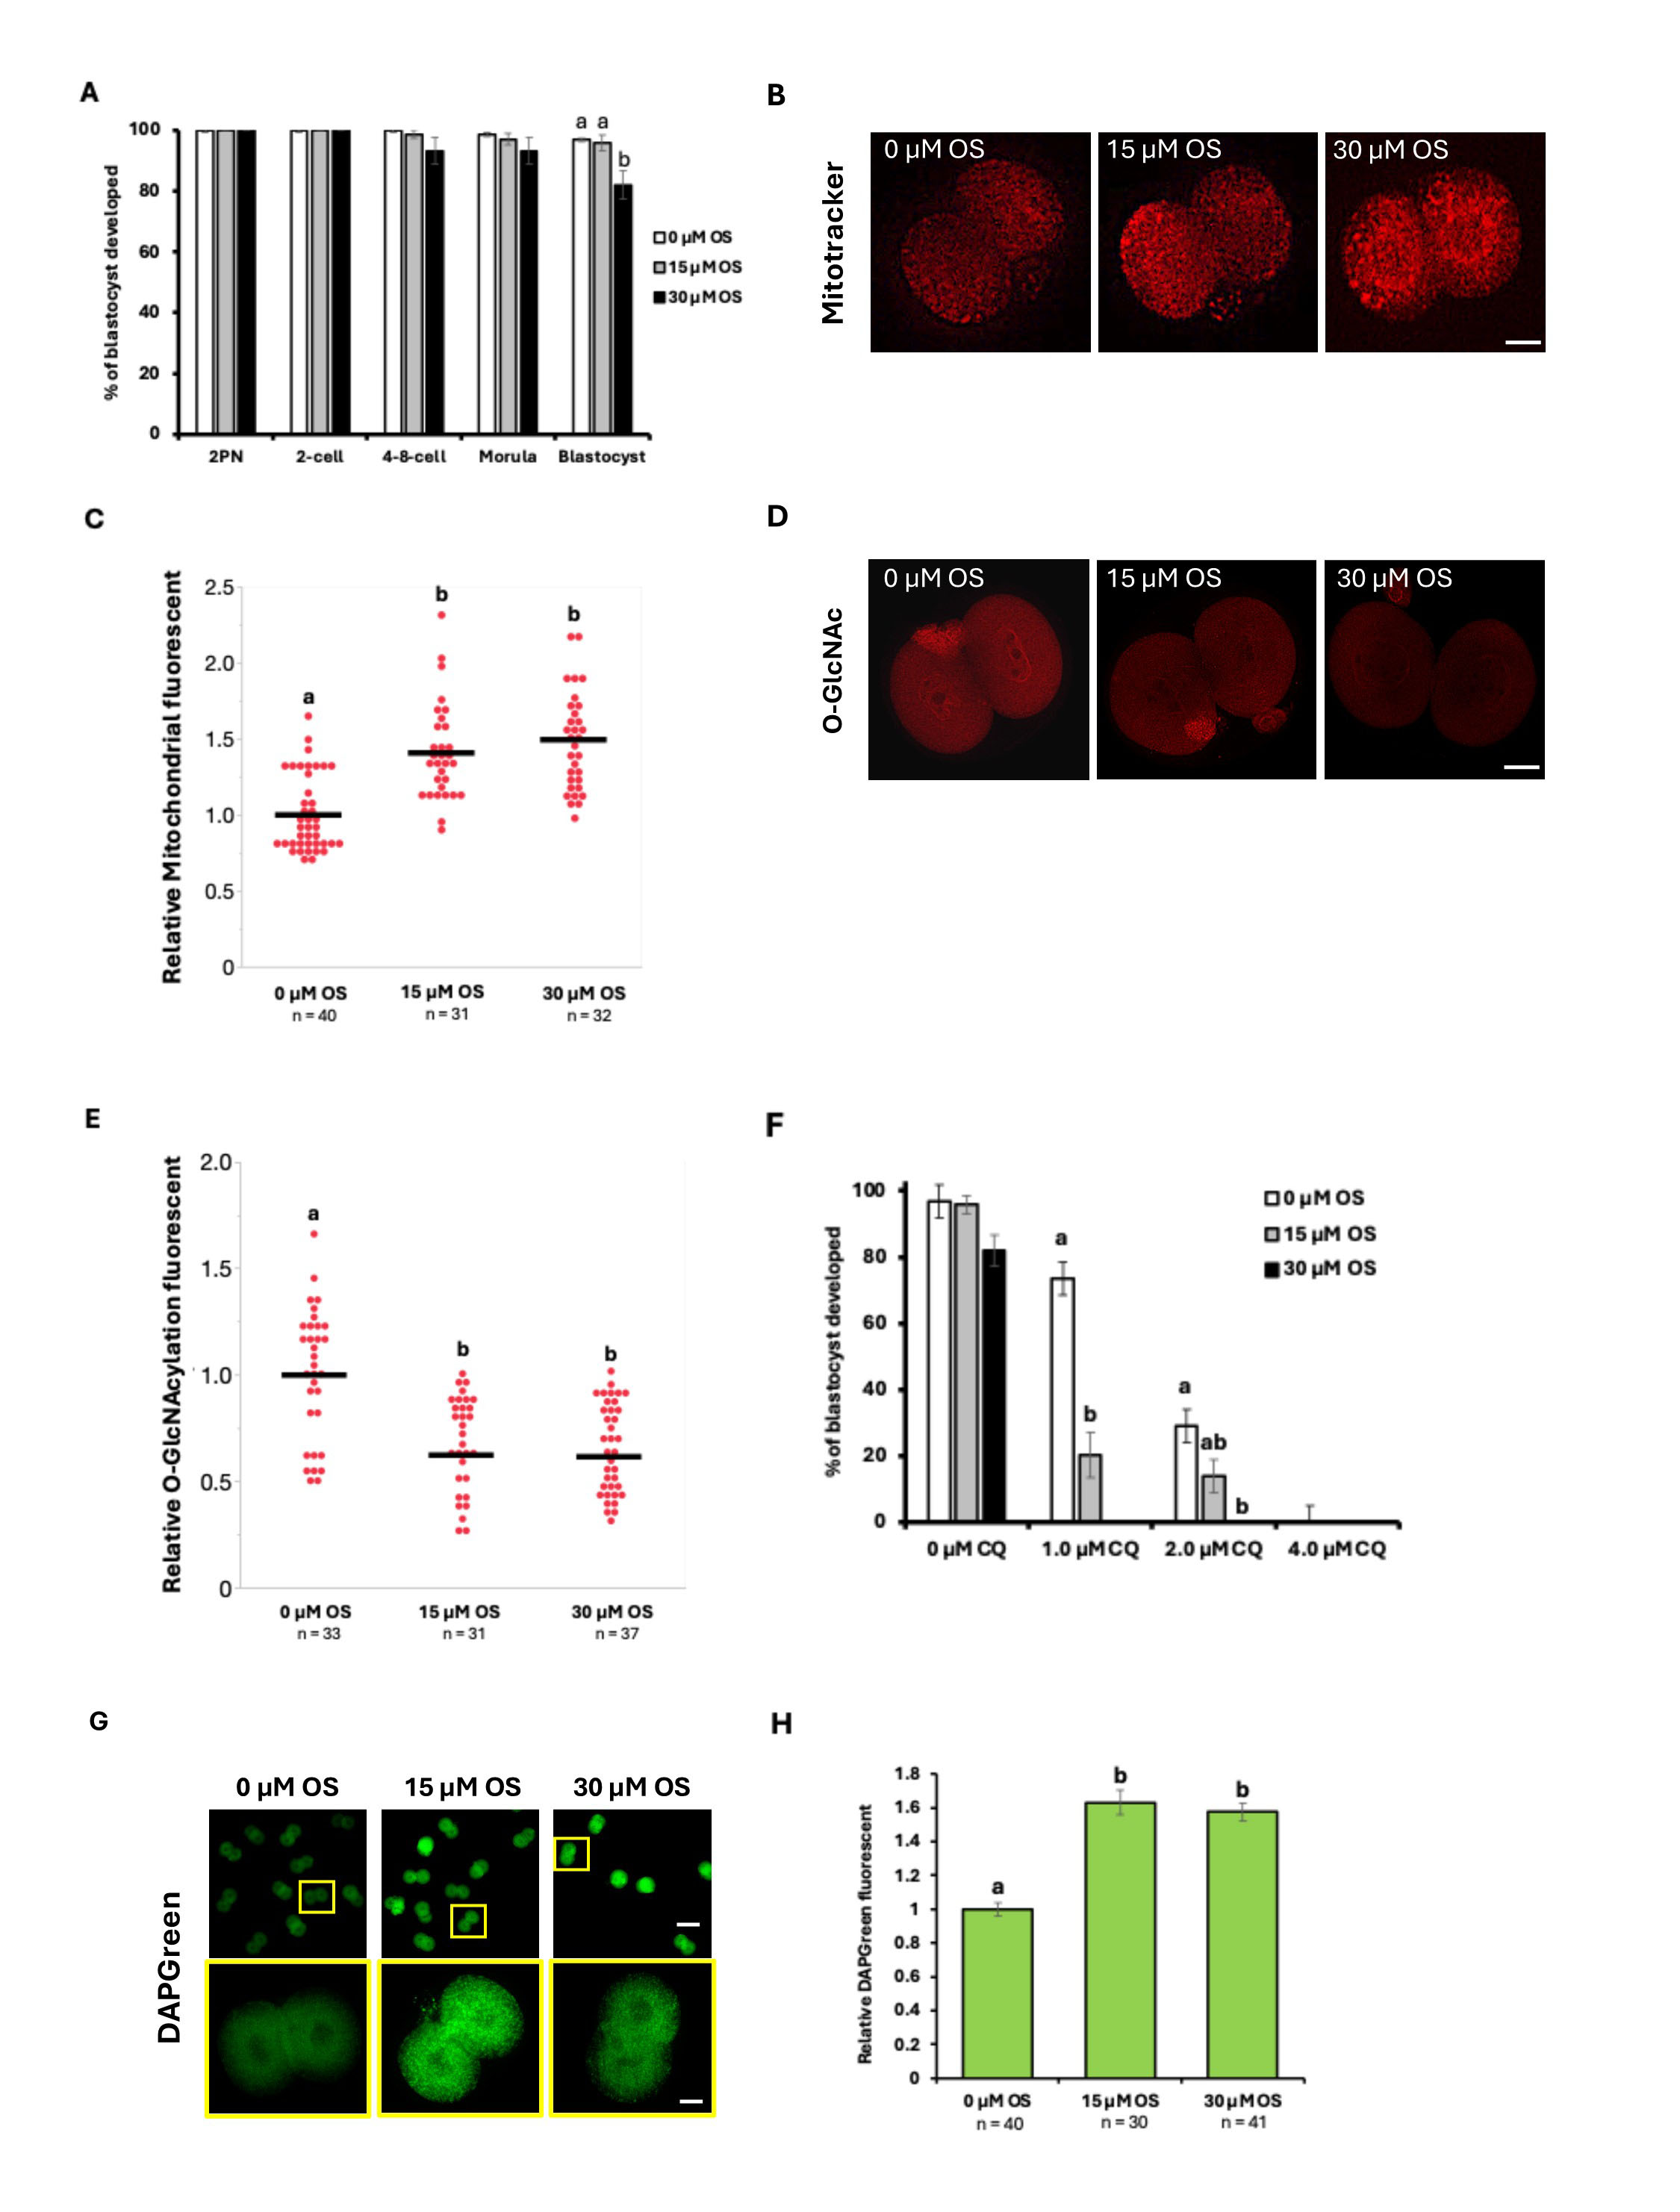 Fig. 4.
Comparison of development rates following OS treatment up to the
2-cell stage and CQ treatment from the two-cell stage onward. (A) Comparison of
blastocyst formation rates between embryos cultured from 2 hours
post-insemination until the 2-cell stage in mCZB (0 µM OS) versus
embryos treated with 15 µM OS or 30 µM OS. (B) Images
stained with MitoTracker fluorescence at the 2-cell stage in OS-treated embryos
(0 µM OS, 15 µM OS, 30 µM OS). Scale bar =
25 µm. (C) Plots of MitoTracker fluorescence intensity. (D)
Fluorescence images of O-GlcNAc modification levels during the 2-cell stage.
Scale bar = 25 µm. (E) Plots of O-GlcNAcylation intensity. (F) Blastocyst formation rate of embryos treated with 0
µM, 15 µM, or 30 µM OS until the 2-cell
stage, followed by 48-hour treatment with various concentrations of CQ (0
µM, 1.0 µM, 2.0 µM, 4.0 µM).
(G) Representative DAPGreen staining images of each OS-treated embryo (0
µM OS, 15 µM OS, 30 µM OS) at the 2-cell
stage. Scale bars = 125 µm (top) and 25 µm (bottom). (H) Comparison of DAPGreen fluorescence intensity after OS treatment.
DAPGreen fluorescence intensity was normalized to the 0 µM OS group,
which was set to 1. Data represent the mean
This study aimed to investigate how glucose exposure during in vitro culture up to the 2-cell stage following fertilization affects the autophagy dependency of early mouse embryos. Our study revealed that 1-CF and IVF embryos exhibited greater CQ sensitivity with higher autophagy activity compared to 2-CF. This was accompanied by decreased sensitivity to Ro, indicating altered responsiveness to mitochondrial inhibition. While this observation may be consistent with reduced mitochondrial reliance during subsequent development and increased dependence on autophagy, our data do not directly demonstrate a decrease in mitochondrial metabolic contribution. Direct metabolic measurements would be necessary to clarify this possibility.
Although autophagy is activated following fertilization in preimplantation embryos and plays a critical role in development beyond the 8-cell stage [30, 31, 32], we recently found that supplementation of the culture medium for 2-CF with a low dose (2.0 µM but not 1.0 µM) of CQ suppressed long-term adverse effects of in vitro culture, such as increased body weight and glucose intolerance, suggesting a close correlation between autophagy activity during preimplantation development and long-term outcomes [39]. This low dose of CQ is thought to partially inhibit autophagy in embryos, whereas 10 µM CQ induces an 8-cell-stage arrest similar to that observed in embryos with genetic autophagy deficiency, suggesting that 10 µM CQ fully inhibits autophagy in embryos [38]. Unexpectedly, while 2-CF 2-cell embryos can develop into the blastocyst stage even in the presence of 2.0 µM CQ, IVF 2-cell embryos fail to develop beyond the morula stage, which is consistent with our previous observations [38]. This study clearly showed that this difference is attributable to glucose exposure of embryos at the 1- to 2-cell stage. Consistently, the autophagy profile assessed by DAPGreen differed between in vivo and in vitro embryos: in vivo embryos exhibited higher autophagy activity at the 2-cell stage followed by a gradual decrease, as previously reported, whereas IVF or 1-CF embryos showed lower autophagy activity at the 2-cell stage and sustained high autophagy activity even at the morula stage. Thus, our results suggest that the early embryonic environment after fertilization, such as exposure to high glucose concentrations, determines the extent of autophagy dependence and activity during the subsequent development, enabling embryos to adapt and survive in a new environment. On the other hand, changes in LC3 levels in the presence or absence of glucose were opposite to the changes in autophagy activity detected by DAPGreen. Nevertheless, significant differences were observed in the mCZB and CZB conditions. This discrepancy may reflect accelerated autophagic flux, in which increased autophagy activity enhances LC3 degradation, resulting in reduced LC3 accumulation [45].
This study clearly demonstrates that the absence of glucose is required as early as 2 hours after insemination, whereas removal at 6 hours is too late to prevent the shift toward an autophagy-dependent mode. This result indicates that even 2.25 mM glucose present in the HTF medium used for IVF, which is lower than the 5.5 mM glucose in mCZB, is sufficient to induce the shift. Collectively, the results suggest that glucose exerts detrimental effects soon after fertilization and that a difference of as little as 4 hours is sufficient to prime the shift. However, the precise end of this sensitive window was not defined in the present study. Further studies are therefore required to determine the exact window, including minimum duration, and to elucidate the underlying mechanisms. Notably, the 1- to 2-cell stages of mouse preimplantation development represent a naïve window during which several critical cellular events, including extensive structural and epigenetic changes, occur [46]. At these stages, mitochondria appear small and rounded and lack well-developed cristae, whereas they become well formed at later stages [47]. Interestingly, several mitochondrial enzymes associated with the TCA cycle are essential for epigenetic remodeling during the 1- to 2-cell stage and are transiently and partially localized to the nucleus [48]. It will be important to investigate how glucose exposure affects this epigenetic remodeling and whether it contributes to a shift toward autophagy dependence.
Previous studies have reported that the average glucose concentration in the oviduct environment is approximately 1.09 mM [49]. The glucose concentration in the mCZB medium used in this study was adjusted to 5.56 mM, corresponding to approximately a fivefold increase compared with the physiological in vivo level. Mitochondrial function has been shown to be impaired in embryos derived from diabetic mouse models [50]. Indeed, mitochondrial function is markedly decreased in mouse embryos cultured in vitro [18]. Consistently, hyperglycemia has been reported to reduce mitochondrial content in mouse embryos [19]. As a result, glucose-exposed embryos shift toward mitochondrial-independent metabolism, resulting in increased resistance to Ro. Historically, to counteract the detrimental effects of glucose, glutamine has been added to culture medium because it provides beneficial support for embryonic development [15]. In cells whose mitochondrial function is impaired due to damage or stress, glutamine supplementation has been shown to improve mitochondrial membrane potential and ATP production, indicating a protective effect of glutamine [51]. Thus, even if mitochondrial function is impaired by glucose, autophagy and glutamine may allow embryos to develop to the blastocyst stage.
Uridine diphosphate N-acetylglucosamine (UDP-GlcNAc) is a metabolite produced at the end of the hexosamine biosynthesis pathway (HBP), which utilizes glucose as a substrate. UDP-GlcNAc serves as a sugar nucleotide donor for O-glycosylation (O-GlcNAc modification), a reversible post-translational modification mediated by O-GlcNAc transferase (OGT) [52]. O-GlcNAc modification occurs on numerous regulatory proteins involved in diverse intracellular processes, including signal transduction, transcription, translation, and proteasomal degradation, thereby modulating their functions [53, 54, 55]. Notably, O-GlcNAcylation is dynamically regulated by two enzymes—OGT and O-GlcNAcase (OGA), which catalyze the addition and removal of O-GlcNAc, respectively. OGT is essential for embryonic development [56, 57], and excessive inhibition of either OGT or OGA has been reported to impair normal embryogenesis [58, 59]. Protein O-GlcNAcylation levels are highly sensitive to extracellular glucose availability. Accordingly, high glucose concentrations have been shown to exert detrimental effects on embryos through activation of HBP and aberrant O-GlcNAcylation [20]. In somatic cells, increased O-GlcNAcylation of mitochondrial proteins has been reported to impair mitochondrial function [21]. Based on these observations, it is plausible that elevated glucose levels may adversely affect embryos, potentially through excessive O-GlcNAcylation and altered mitochondrial function. Consistent with this possibility, our study showed that glucose-exposed embryos exhibited reduced mitochondrial activity, which was restored by OS, an inhibitor of OGT. However, OS treatment under mCZB (glucose-containing) did not fully reproduce the phenotype observed under CZB (glucose-free); instead, it increased sensitivity to CQ while simultaneously enhancing mitochondrial function. Although the underlying mechanism remains unclear, this paradoxical effect may suggest that early embryonic development requires low, but not absent, glucose levels [22]. Complete loss of O-GlcNAcylation in early embryos may disrupt metabolic pathways and/or autophagic activity. Indeed, in somatic cells, O-GlcNAcylation has been shown to regulate both glycolysis and autophagy [60]. Further studies are needed to elucidate this paradoxical effect and its underlying mechanisms.
In conclusion, glucose exposure during the 1- to 2-cell stage increased CQ sensitivity after the 2-cell stage, suggesting that early glucose exposure may shift embryos toward a more autophagy-dependent mode of development. Simultaneously, glucose exposure was associated with reduced sensitivity to mitochondrial inhibition, which may indicate a decreased reliance on mitochondrial metabolism for energy production, although direct metabolic measurements would be required to confirm this interpretation. Conversely, the absence of glucose until the 2-cell stage was associated with a developmental profile in in vitro–fertilized embryos that more closely resembled in vivo development, characterized by reduced sensitivity to autophagy inhibition and increased sensitivity to mitochondrial inhibition. However, the simultaneous increase in mitochondrial activity and CQ sensitivity observed following OGT inhibition remains unresolved. Together, these findings provide new insights into the physiology of IVF embryo physiology and may contribute to the optimization of culture media that more closely recapitulate in vivo conditions, with embryonic autophagy activity serving as a potential biomarker of physiological status.
All raw data for this study are available from the corresponding author.
This work was conceptualized by SKis. KS, RF and SKis designed the research. KS, RF, SKis, SKan, YN, KM, SY, SN and YA performed the research. KS, RF and YA analyzed the data. KS and SKis wrote the paper with input from all authors. All authors contributed to editorial changes in the manuscript. All authors read and approved the final manuscript. All authors participated sufficiently in the work and agreed to be accountable for all aspects of the work.
All the animal experiments were approved by the Animal Experimentation Committee at the University of Yamanashi, Japan, and conducted in accordance with the ethical guidelines (protocol number A6-19). All procedures were performed in accordance with the principles of the 3Rs (Replacement, Reduction and Refinement).
We gratefully acknowledge discussions and technical support with Drs. T. Wakayama, S. Wakayama, D. Ito, and Y. Kanda at the Advanced Biotechnology Center, M. Saito and S. Furusato at the Center for advanced Assisted Reproductive Technologies, University of Yamanashi as well as all the lab members.
This work was supported by JSPS KAKENHI Grant (Numbers 20K06443 and 24K01937 to SK).
Given his role as an Editorial Board member, Satoshi Kishigami had no involvement in the peer-review process of this article and had no access to information regarding its peer review. Full responsibility for the editorial process for this article was delegated to Jacek Kubiak.
References
Publisher’s Note: IMR Press stays neutral with regard to jurisdictional claims in published maps and institutional affiliations.