


 , Hui Gong 1,2,†, Simiao Bian 1,2, Huiyang Xu 1,2, Rui Zang 1, Jiayi Hao 1, Yajie Wang 1, Yue Zhang 1, Yingying Jiang 1,2,*
1 School of Stomatology, Shandong Second Medical University, 261053 Weifang, Shandong, China
2 Weifang Key Laboratory of Oral Biomedicine, Shandong Second Medical University, 261053 Weifang, Shandong, China
†These authors contributed equally.
Abstract
N7-methylguanosine (m7G) is an important RNA modification involved in the regulation of gene expression during transcription. While its roles in mRNAs and tRNAs are increasingly understood, the distribution and function of m7G in long non-coding RNAs (lncRNAs), particularly in oral squamous cell carcinoma (OSCC), remain poorly understood. This study aimed to systematically characterize the m7G methylation landscape of lncRNAs in OSCC and investigate the oncogenic function and regulatory mechanism of the m7G-modified lncRNA DPY19L1P1.
Methylated RNA immunoprecipitation sequencing (MeRIP-seq) and RNA sequencing (RNA-seq) were performed on three pairs of OSCC and adjacent normal tissues to identify differentially m7G-modified and differentially expressed lncRNAs. Motif prediction, its potential functions are identified through analysis of Gene Ontology (GO) and Kyoto Encyclopedia of Genes and Genomes (KEGG) pathways. DPY19L1P1 was prioritized based on its high level of m7G modification and upregulation. Its clinical relevance was assessed using TCGA-HNSC datasets. In vitro and in vivo functional assays were performed to evaluate its oncogenic roles. The regulatory effects of methyltransferase-like 1 (METTL1) and WD repeat domain 4 (WDR4) on DPY19L1P1 were examined using expression correlation, MeRIP quantitative real-time PCR (qPCR), and splicing efficiency analyses.
A total of 5486 OSCC-specific m7G peaks and 5135 modified lncRNAs were identified. Compared to normal tissues, OSCC tissues exhibited broader distribution and higher levels of m7G modifications. Among 15,085 hyper-m7G-modified lncRNAs detected in OSCC, 80 were also upregulated. They are enriched in metabolic pathways associated with lncRNA cell adhesion and migration. DPY19L1P1 displayed the most prominent m7G methylation and expression levels, and was significantly associated with advanced clinical stage and poor differentiation, indicating its diagnostic potential. Mechanistically, METTL1 and WDR4 cooperatively enhanced both the m7G modification and expression of DPY19L1P1 by promoting its splicing efficiency. Furthermore, METTL1/WDR4 and DPY19L1P1 synergistically promoted OSCC progression, with DPY19L1P1 functioning as a key downstream effector. Functionally, DPY19L1P1 facilitated OSCC cell proliferation, migration, glycolysis-driven metabolic reprogramming, and epithelial–mesenchymal transition (EMT).
This study provides a comprehensive profile of m7G-modified lncRNAs in OSCC and identifies DPY19L1P1 as a hyper-m7G-modified oncogenic lncRNA regulated by the METTL1/WDR4 complex. As a key downstream effector, DPY19L1P1 promotes OSCC progression through metabolic reprogramming and EMT, and may serve as a potential diagnostic biomarker and therapeutic target.
Keywords
- oral squamous cell carcinoma
- N7-methylguanosine
- long non-coding RNAs
- DPY19L1P1
- METTL1
- WDR4
Oral squamous cell carcinoma (OSCC) constitutes the majority of head and neck squamous cell carcinoma (HNSCC), and ranks as a frequently diagnosed neoplasm in the oral cavity [1]. Owing to its propensity for recurrence, therapeutic resistance, and strong invasiveness, patients with OSCC often experience poor prognosis and high disability rates, severely affecting their quality of life [2]. In the present, the initial implementation of the OSCC policy is being implemented, radiotherapy, targeted therapy, immunotherapy [2, 3]. However, because of significant tumor heterogeneity, clinical outcomes have not improved substantially in recent years. Thus, it is clinically imperative to decipher the biological basis driving OSCC progression and to pinpoint potential targets for treatment.
In recent years, RNA epigenetic modifications have emerged as critical regulators of gene expression and have attracted increasing attention in cancer research. Among them, N1-methyladenosine (m1A), 5-methylcytosine (m5C), N6-methyladenosine (m6A), N7-methylguanosine (m7G) represent the major types of RNA modification [4]. Among these, m7G is a conserved and functionally diverse post-transcriptional modification, in which a methyl group is added to the N7 position of guanine in RNA, catalyzed by specific methyltransferases [5]. Classically, m7G is recognized as a hallmark modification at the 5′ cap of mRNAs and within tRNAs [6, 7], but also within internal regions of mRNA and long non-coding RNAs (lncRNAs) [8, 9], as well as in ribosomal RNAs [10], microRNAs [11]. m7G regulates various aspects of RNA metabolism, including methylation, splicing, nuclear export, stability, and translation, thereby playing crucial roles in maintaining cellular homeostasis and promoting cancer progression [12]. The m7G modification reaction primarily depends on the activity of known methyltransferase complexes [7, 11]. Specifically, METTL1 and WDR4 heterodimer acts as a critical writer complex that mediates the deposition of m7G at internal RNA sites [13]. Previous studies have shown that METTL1 and WDR4 are overexpressed in multiple cancer types and are positively correlated in their expression levels. In HNSCC, their synergistic upregulation drives tumor advancement and implies an adverse clinical prognosis [7, 14].
LncRNAs are a large category of noncoding RNAs with lengths greater than 200 nucleotides but no protein-coding ability [15]. Emerging studies have revealed that lncRNAs can modulate OSCC progression by controlling biological processes including cell proliferation, apoptosis, and metabolic reprogramming [16, 17]. Notably, certain highly expressed m7G-modified lncRNAs have been closely correlated with poor prognosis in OSCC [18], suggesting their potential as functional molecules or biomarkers. However, the specific roles and mechanisms of m7G-modified lncRNAs in OSCC remain largely unexplored and warrant further investigation through integrative omics and functional studies.
In this work, we systematically characterized the m7G methylation landscape of lncRNAs in OSCC by integrating m7G methylated RNA immunoprecipitation sequencing (MeRIP-seq) with RNA-seq. Gene Ontology (GO) and Kyoto Encyclopedia of Genes and Genomes (KEGG) enrichment analyses were conducted to explore the biological pathways potentially regulated by m7G-modified lncRNAs. We identified a subset of lncRNAs that were both hyper-m7G-modified and upregulated in OSCC. Among them, DPY19L1P1 was prioritized as a representative candidate due to its most prominent m7G hypermethylation, marked upregulation and strong association with clinicopathological features. METTL1/WDR4 was found to positively regulate both the expression and m7G modification of DPY19L1P1. Functionally, DPY19L1P1 facilitates OSCC cell proliferation, migration, glycolysis-driven metabolic reprogramming and EMT, acting as a key downstream effector of METTL1/WDR4-mediated epitranscriptomic regulation. These findings highlight DPY19L1P1 as a promising diagnostic biomarker and promising drug target, and provide novel insight into the oncogenic roles of m7G-modified lncRNAs in OSCC.
Six tissue samples (C1/N1, C2/N2, and C3/N3) were collected from three OSCC patients at the First Affiliated Hospital of Shandong Second Medical University (formerly Weifang Medical University). The criteria and procedures for tissue collection were detailed in our previous studies, and the study was approved by the Ethics Committee of Shandong Second Medical University (formerly Weifang Medical University) [19, 20]. Human OSCC cell lines (HN30, CAL-27, HN6, SCC-25 and SCC-9) were obtained from Shanghai Ninth People’s Hospital, Shanghai Jiao Tong University School of Medicine. The cDNA samples of normal primary human oral mucosal epithelial cells were provided by the same institution. All procedures related to these samples were conducted under institutional ethical approval (Approval No. SH9H-2019-TK235-1) with informed consent obtained from donors. The characterization of these cells has been previously reported [21, 22]. All cell culture conditions and protocols were consistent with those used in our earlier publication [20]. All procedures in this study were performed in accordance with the Declaration of Helsinki. All cell lines were recently verified prior to use by short tandem repeat (STR) analysis performed by Shanghai Biowing Applied Biotechnology Co., Ltd. All cell lines tested negative for mycoplasma.
The sequencing process was described in a previous study [19]. In brief, the MeRIP-seq technique involves the use of an m7G-specific antibody to enrich m7G-modified lncRNA fragments, followed by high-throughput sequencing to locate and quantify m7G modifications on the RNA fragments.
A quality score threshold of Q30 was applied for quality control following
sequencing on the Illumina NovaSeq 6000 platform. Cutadapt software (v2.10;
Marcel Martin, Max Planck Institute for Molecular Genetics, Berlin, Germany) was
utilized to generate high-quality, clean reads [23]. Clean reads from all samples
were mapped to the reference genome using HISAT2 (v2.0.4, Johns Hopkins
University, Baltimore, MD, USA) [24]. Methylated sites were called using MACS3
(v3.0.3, Harvard University, Cambridge, MA, USA) with the default parameters, and
the p values of the peaks were calculated based on the Poisson
distribution [25]. Differentially methylated sites were called using DiffReps
software (v1.55.6, The University of Texas MD Anderson Cancer Center, Houston,
TX, USA), with p values computed via negative binomial regression [26].
Peaks located in the exons of the lncRNAs were extracted for annotations, and
differentially methylated lncRNAs were identified using the thresholds of fold
change (FC)
For transcriptomic analysis, high-quality reads were mapped to the human
reference genome (UCSC HG19) using HISAT2 (v2.0.4) [24]. Transcript-level raw
counts were generated using HTSeq (v0.9.1, European Molecular Biology Laboratory,
Heidelberg, Germany), and lncRNA expression profiles were analyzed [27].
Differential expression analysis between OSCC and normal tissues was performed
using edgeR (v3.16.5, Walter and Eliza Hall Institute of Medical Research,
Melbourne, VIC, Australia) [28], with thresholds set at FC
p-values for both MeRIP-seq and RNA-seq analyses were adjusted for
multiple testing using the Benjamini-Hochberg method, and an adjusted
p-value
GO and KEGG pathway enrichment analyses on genes associated with differentially
m7G-modified and differentially expressed lncRNAs were analyzed using the online
tool, Database for Annotation, Visualization, and Integrated Discovery (DAVID,
https://davidbioinformatics.nih.gov/) [29]. The analyses were conducted based on
the Homo sapiens genome reference (HG19). A statistically meaningful
difference was defined as p
To visualize the chromosomal distributions of m7G-modified lncRNAs in OSCC versus normal tissues, the RCircos package (v1.2.2, National Cancer Institute, Bethesda, MD, USA) in R was utilized [30]. In addition, sequence motif characterization of m7G modifications in lncRNAs was performed with DREME (v5.5.9, University of Washington, Seattle, WA, USA) software [31].
Total RNA was isolated from cultured cells using TRIzol reagent (M5101, NCM
Biotech, Co., Ltd., Suzhou, Jiangsu, China). cDNA was generated by reverse transcription
with the Evo M-MLV RT Kit (AG11705, Accurate Biology Co., Ltd., Changsha, Hunan,
China). The target RNAs were amplified with the SYBR Green Pro Taq HS qPCR Kit
(AG11701, Accurate Biology Co., Ltd., Changsha, Hunan, China). Gene expression
levels were normalized to the
RNA from nuclear and cytoplasmic fractions was extracted using the
PARIS™ Kit (AM1921, Thermo Fisher Scientific, Waltham, MA, USA)
following the manufacturer’s instructions.
Fluorescence-labeled probes targeting DPY19L1P1, U6, and 18S rRNA were commercially designed and produced by RiboBio (Guangzhou, China). FISH was performed using the Ribo™ Fluorescent In Situ Hybridization Kit (C10910, RiboBio Co., Ltd., Guangzhou, Guangdong, China). Briefly, HN30 cells were cultured on sterile glass coverslips, fixed with 4% paraformaldehyde for 10 min, and permeabilized with 0.5% Triton X-100. After pre-hybridization, cells were incubated with fluorescent probes at 37 °C overnight. The next day, excess probes were removed by washing, and nuclei were counterstained with DAPI. Coverslips were mounted using an antifade reagent, and fluorescence images were captured using a TCS SP8 laser scanning confocal microscope (version 3.7.5, Leica Microsystems, Germany). Image processed with LAS X software (Leica Microsystems, Wetzlar, Germany) to determine the subcellular localization of DPY19L1P1.
MeRIP was conducted using the GenSeq® m7G MeRIP Kit (GS-
ET-004A, CloudSeq Inc., Shanghai, China) to assess the m7G modification levels of
the specific transcripts. Initially, total RNA was treated with mRNA Decapping
Enzyme (M0608S, New England Biolabs, Ipswich, MA, USA) to remove the 5′ cap
structure. The RNA was then fragmented, and 3 µg of the fragmented RNA was
reserved as the input control. The remaining RNA was mixed with either anti-m7G
antibody or control IgG, both pre-bound to Protein A/G magnetic beads were added,
and the mixture was incubated at 4 °C for 1 hour. After
immunoprecipitation, the beads were washed with 1
siRNAs targeting METTL1 and WDR4 (si-METTL1 and si-WDR4), as well as Smart Silencer RNAs targeting DPY19L1P1 (SS-DPY19L1P1), were synthesized by RiboBio (Guangzhou, China). The target sequences are provided in Supplementary Table 2. Expression plasmids for METTL1, WDR4 and DPY19L1P1 were constructed by GeneChem Co., Ltd. (Shanghai, China). Cells were transfected using the Lipo8000TM reagent (Beyotime, Shanghai, China) following the protocol. qPCR was used to evaluate transfection efficiency.
Cells (1.5
The cells (2.5
Twelve 4-week-old BALB/c nude mice (Jinan Pengyue Experimental Animal Breeding Center, SCXK [Lu] 2019-0003) were randomly assigned into two groups (n = 6 per group). All animal studies received approval from the Animal Care and Use Committee of Weifang Medical University (Approval No. 2023SDL332). Due to institutional restructuring, the committee has been renamed the Animal Care and Use Committee of Shandong Second Medical University, and the original approval remains valid under the same protocol.
To establish the subcutaneous xenograft tumor model, CAL-27 cells (2
Following 28 days, euthanasia was performed on mice under anesthesia via an intraperitoneal injection of sodium pentobarbital (150 mg/kg; prepared as a 50 mg/mL solution, Sigma-Aldrich, St. Louis, MO, USA), with death confirmed by the absence of heartbeat and respiration. Cervical dislocation was applied as a secondary measure if necessary. All procedures adhered to the AVMA Guidelines for the Euthanasia of Animals (2020).
Following euthanasia, tumors were excised, photographed, and measured to compare tumor volume and weight between the two groups. The tumor tissues underwent fixation in 4% paraformaldehyde for 24 hours, followed by dehydration, paraffin embedding, and sectioning. Histological analysis was conducted using Hematoxylin and Eosin (H&E) staining, while immunohistochemistry with a Ki-67 antibody was employed to assess cellular proliferation. The stained tissue sections were visualized and captured using an upright light microscope.
To evaluate the splicing efficiency of DPY19L1P1, qPCR was performed using two sets of transcript-specific primers, one amplifying unspliced precursor RNA (targeting intronic regions or exon-intron junctions) and the other amplifying spliced mature RNA (targeting exon-exon junctions). Splicing efficiency was quantified as the ratio of mature RNA to precursor RNA, and changes in this ratio were used to indicate alterations in splicing efficiency.
ATP levels in CAL-27 and HN30 cells were measured using an ATP Content Assay Kit
(Cat# BC0300, Solarbio, Beijing, China) according to the manufacturer’s
instructions. In brief, the cells were harvested and resuspended in the lysis
buffer (1 mL per 107 cells). After homogenization and full lysis on ice, the
samples were centrifuged at 10,000
Glucose uptake was quantified with a commercial Glucose Assay Kit (A154-1-1,
Nanjing Jiancheng Bioengineering Institute, Nanjing, China) following the
manufacturer’s protocol. Cells were seeded in 6-well plates and subjected to the
indicated treatments. After 24–48 h, culture supernatants were collected and
centrifuged at 12,000
Lactate levels in culture media were quantified using the L-Lactic Acid (LA)
Colorimetric Assay Kit (E-BC-K044-M, Elabscience Biotechnology Inc., Wuhan,
Hubei, China) following the manufacturer’s protocol. After treatment or
transfection, culture supernatants were collected and centrifuged at 12,000
Western blotting was carried out as previously described [22]. Antibodies employed in this study are listed in Supplementary Table 3. HRP-conjugated goat anti-mouse IgG (H+L) (Cat# P8001) and goat anti-rabbit IgG (H+L) (Cat# P8002) were purchased from New Cell and Molecular (NCM) Biotech (Suzhou, Jiangsu, China) and used as secondary antibodies at a 1:10,000 dilution. Immunoreactivity was visualized with enhanced chemiluminescence (ECL) Ultra reagent (NCM Biotech, Suzhou, Jiangsu, China). Band intensities were measured using ImageJ software, and the relative protein expression levels were analyzed accordingly.
All statistical analyses were performed using SPSS version 16.0 (IBM Corp.,
Armonk, NY, USA) and GraphPad Prism version 10.0 (GraphPad Software, San Diego,
CA, USA). For comparisons between two groups, an unpaired Student’s
t-test was used. Differences among more than two groups were assessed
using one-way analysis of variance (ANOVA) followed by post hoc tests as
appropriate. Pearson’s correlation analysis was conducted to evaluate the
relationships between gene expression levels. All data are expressed as mean
To explore the m7G methylation landscape in OSCC, m7G MeRIP-seq analysis was performed on three OSCC tissue samples (C1, C2, C3) and three matched adjacent normal tissue (N1, N2, N3). For high-confidence identification, only m7G peaks and lncRNAs detected in at least two biological replicates per group were included in subsequent analyses.
In OSCC tissues, a total of 1672 m7G peaks and 5651 modified lncRNAs were commonly detected across three samples (Fig. 1A,B). In comparison, 1220 shared m7G peaks and 5903 m7G-modified lncRNAs were identified in normal tissues (Fig. 1C,D).
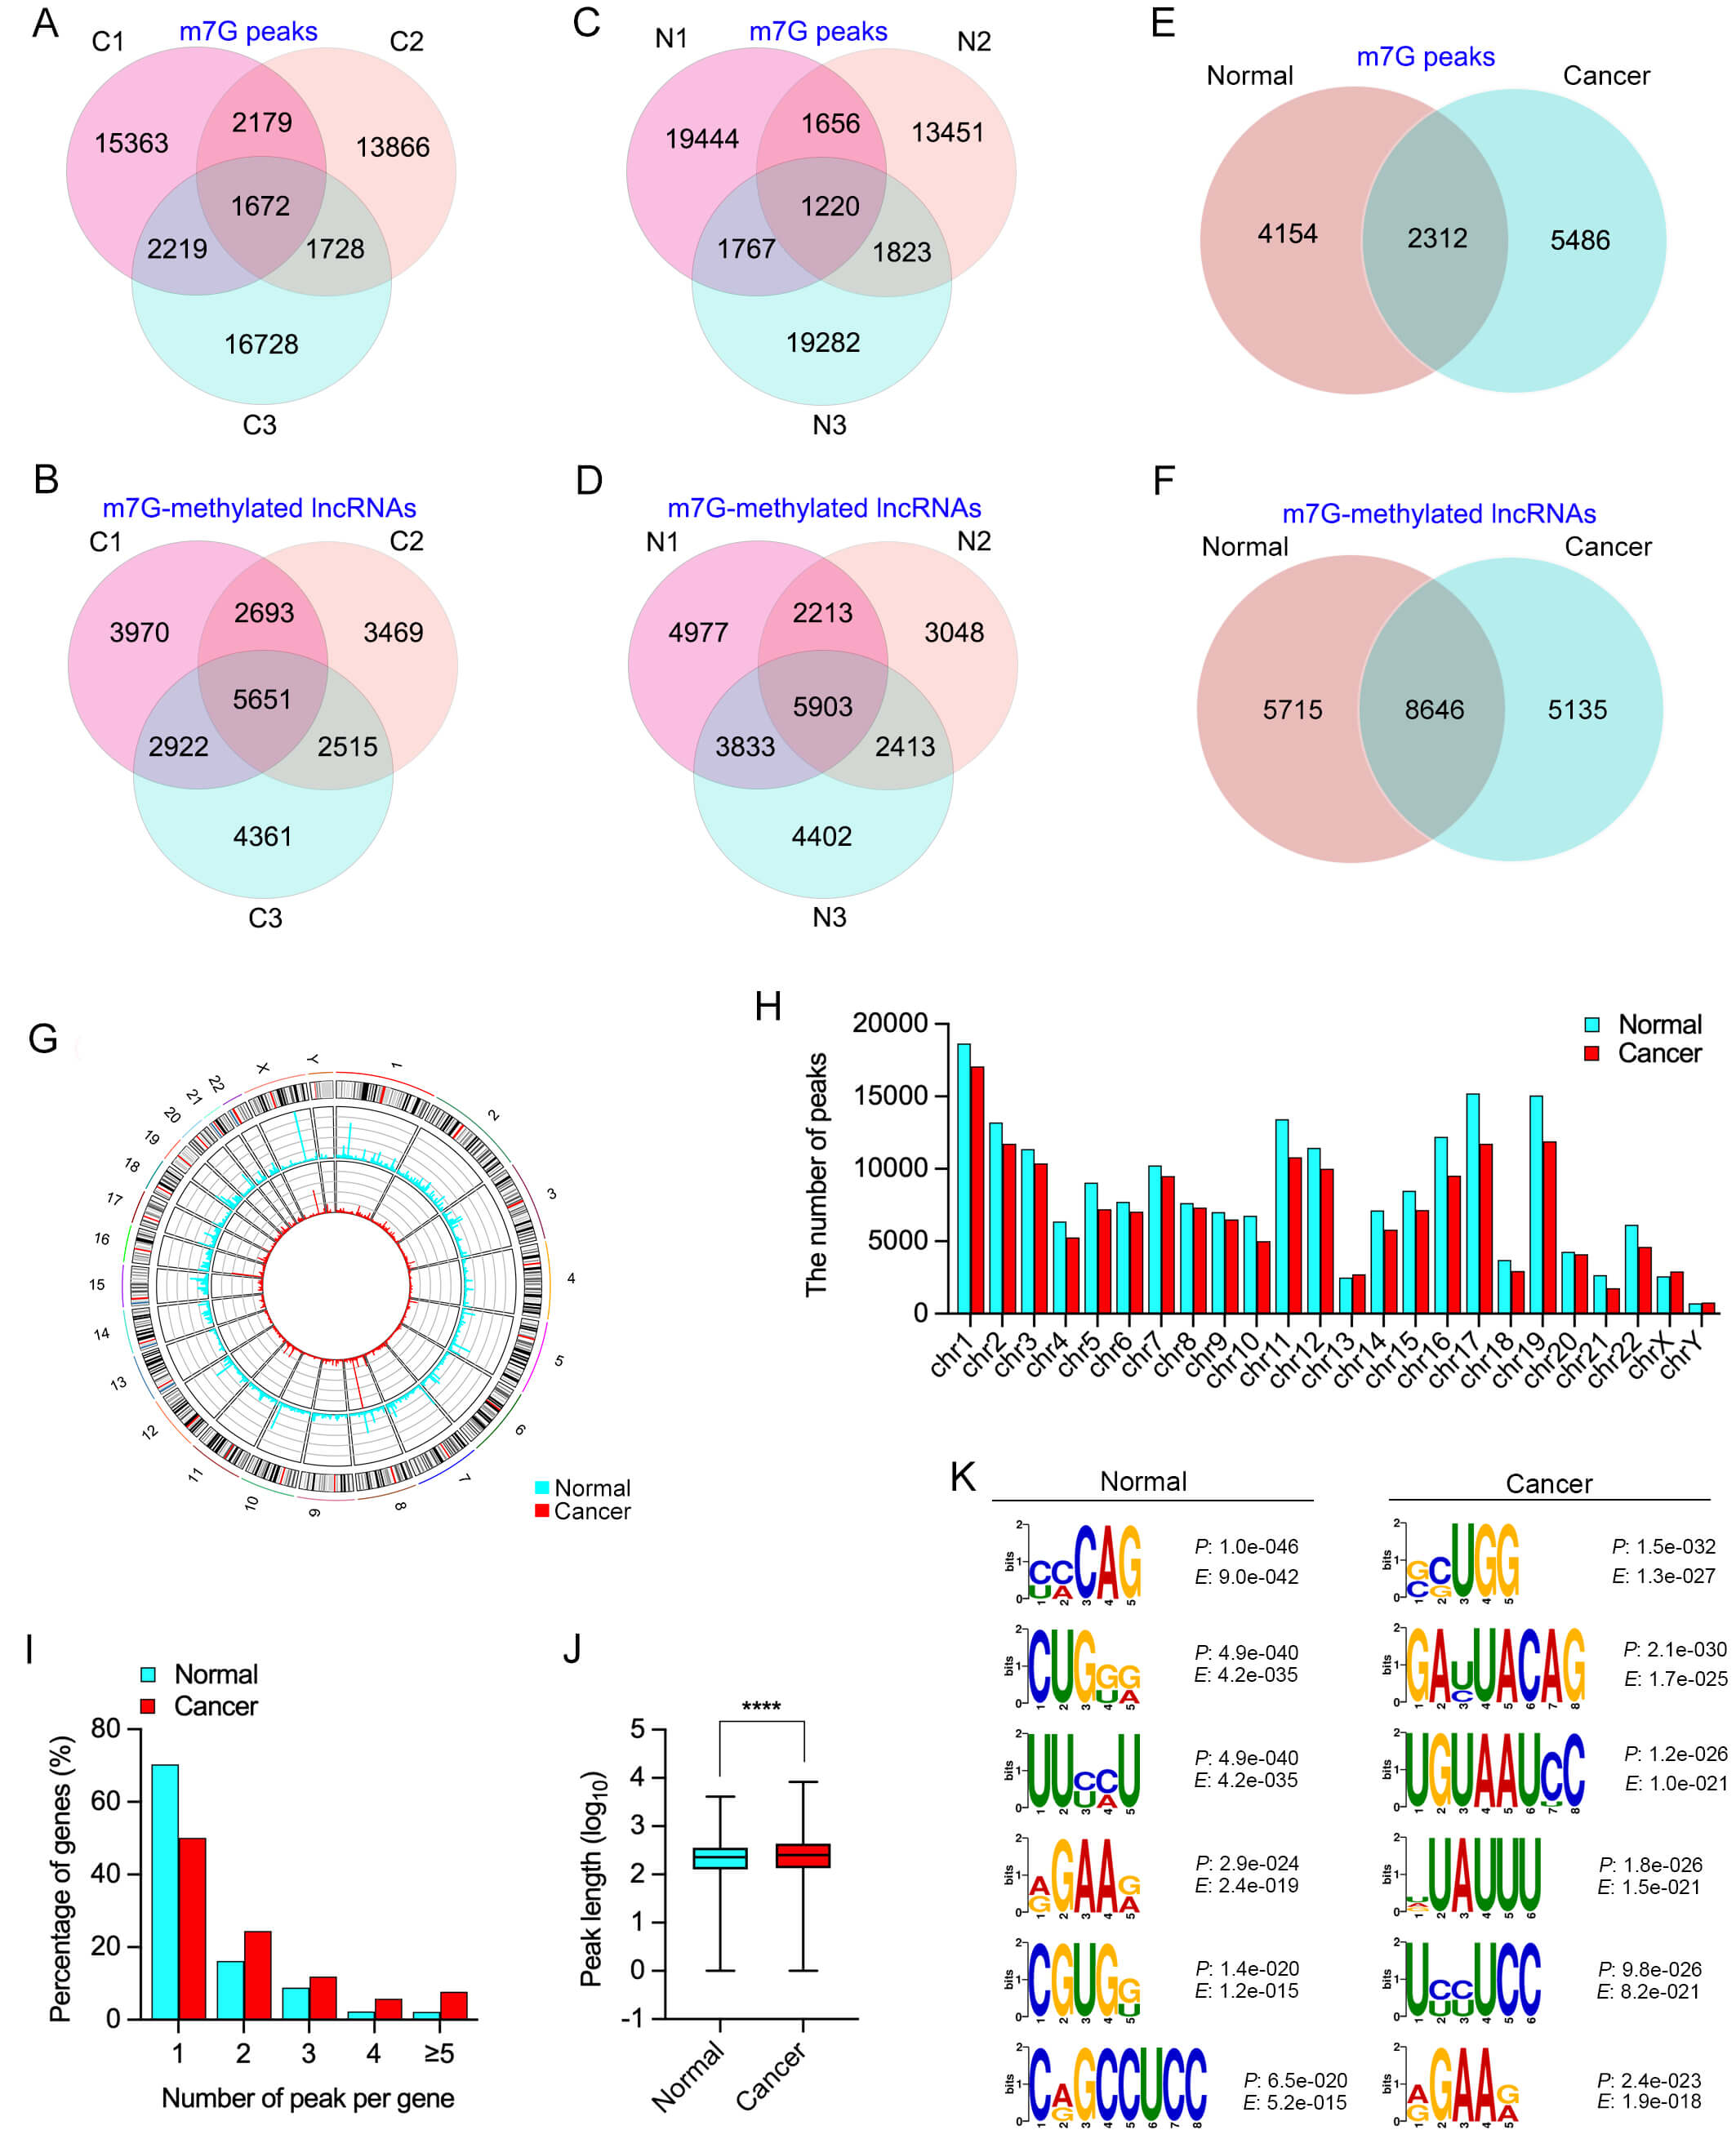 Fig. 1.
Comprehensive landscape of m7G-modified lncRNAs in OSCC
and normal tissues. (A,B) Venn diagrams showing the number of total m7G peaks
(A) and m7G-modified lncRNAs (B) identified in OSCC tissues, based on the
intersection of three OSCC samples (C1–C3), as analyzed by methylated RNA
immunoprecipitation sequencing (MeRIP-seq). (C,D) Venn diagrams showing the
number of total m7G peaks (C) and m7G-modified lncRNAs (D) identified in normal
tissues (N1–N3), based on the overlap of three normal samples (N1–N3), also
determined by MeRIP-seq. (E,F) Venn diagrams showing the overlap and specificity
of m7G peaks (E) and m7G-modified lncRNAs (F) between OSCC and normal tissues.
(G) Circos plot showing the chromosomal distribution of m7G-modified lncRNAs in
OSCC and normal tissues. (H) Bar graph showing the number of m7G peaks across
each chromosome in OSCC and normal tissues. (I) Distribution of the number of m7G
peaks per lncRNA transcript in cancer and normal tissues. (J) Box plot comparing
the length of m7G peaks (log₁₀-transformed) between OSCC and normal tissues. (K)
Top six significantly enriched sequence motifs within m7G peaks identified in
normal and OSCC tissues, along with associated p-values and
E-values. m7G, N7-methylguanosine; lncRNA, long non-coding RNA;
OSCC, oral squamous cell carcinoma. ****p
Upon integrating the OSCC and normal datasets, we found that 5486 m7G peaks and 5135 lncRNAs were specific to OSCC, while 2312 m7G peaks and 8646 m7G-modified lncRNAs were shared between the two groups (Fig. 1E,F). This finding highlights that m7G methylation in OSCC encompasses both conserved and tumor-specific modification patterns, suggesting its potential involvement in OSCC-specific transcriptional regulation.
A Circos plot, generated using the Circos package in R, revealed the chromosomal
localization of m7G peaks in both OSCC and normal tissues (Fig. 1G). These peaks
were located predominantly on chromosomes 1, 17, and 19 (Fig. 1H). To further
characterize the m7G modification landscape, we analyzed the distribution of m7G
peaks per lncRNA. In normal tissues, the majority of m7G-modified lncRNAs
(approximately 75%) harbored only a single peak. In contrast, although 50.13%
of lncRNAs in OSCC tissues also carried a single m7G peak, a substantially higher
proportion exhibited multiple peaks—nearly 50% had two or more. This shift
suggests an increase in methylation complexity in lncRNAs during OSCC
tumorigenesis (Fig. 1I). Additionally, the peak length distribution differed
significantly between OSCC and normal tissues (p
Motif analysis was conducted using DREME software to identify conserved sequence
motifs within the m7G peaks. A total of six significantly enriched motifs were
detected in each group (Fig. 1K). Among these, a conserved RGAAR motif (R = G/A)
was predominantly enriched in OSCC tissues (p = 2.4
Based on their genomic locations, m7G-modified lncRNAs can be classified into six categories: exon sense-overlapping, intronic antisense, intergenic, natural antisense, intron sense-overlapping, and bidirectional. Among these, the majority of m7G-modified lncRNAs in both OSCC and normal tissues originated from exon sense-overlapping and intergenic regions (Fig. 2A). Comparative analysis of the distribution patterns revealed that m7G-modified lncRNAs in OSCC tissues (C1–C3) were significantly less enriched in exon sense-overlapping regions and more frequently derived from intergenic regions compared to those in normal tissues (N1–N3) (Fig. 2B).
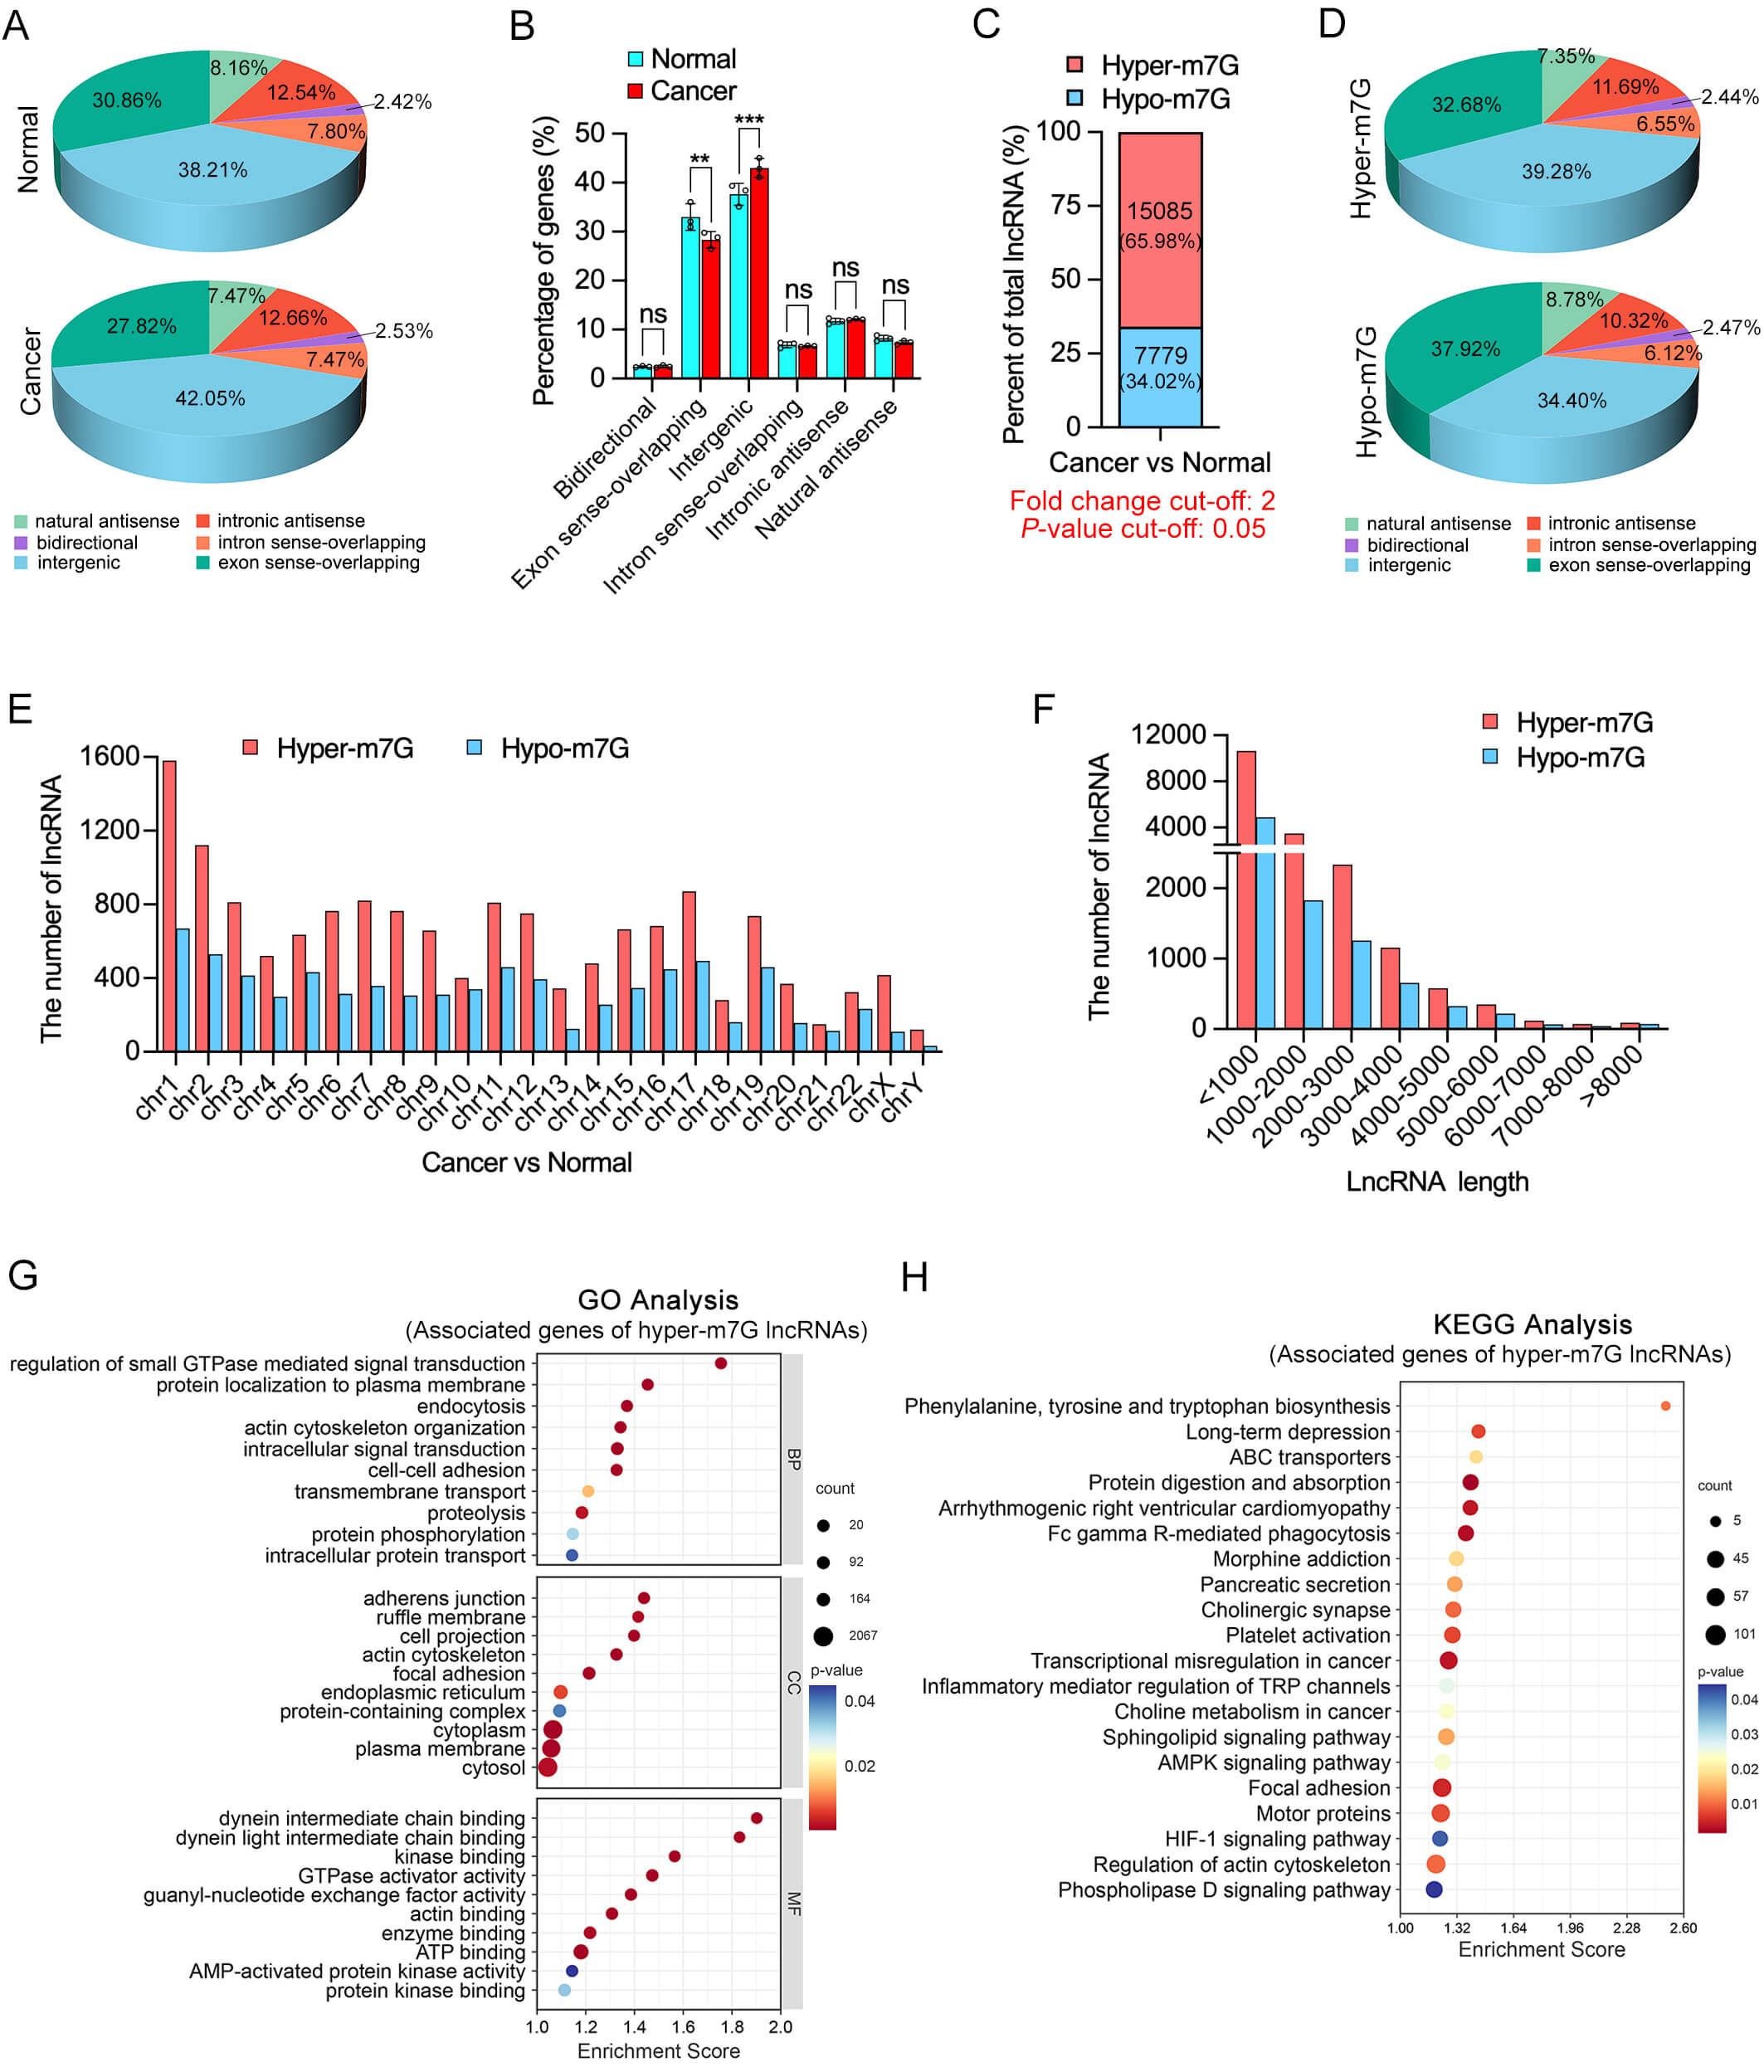 Fig. 2.
Integrated characterization of differentially
m7G-methylated lncRNAs in OSCC. (A,B) Genomic feature distribution of
m7G-modified lncRNAs in normal (top) and OSCC (bottom) tissues. Pie charts (A)
and bar graphs (B) showing the proportion of lncRNAs derived from 6 genomic
regions. (C) Proportional analysis showing that 65.98% of differentially
modified lncRNAs were hyper-m7G, while 34.02% were hypomethylated (hypo-m7G) in
OSCC compared to normal tissues. (D) Genomic origin categorization of hyper- and
hypo-m7G lncRNAs in OSCC tissues, revealing distinct distributions between the
two methylation states. (E) Chromosomal distribution of hyper- and hypo-m7G
lncRNAs across all chromosomes, with a broad but uneven genomic distribution. (F)
Length distribution of lncRNAs with aberrant m7G modification. (G,H) GO and KEGG
enrichment analyses of genes associated with hyper-m7G-modified lncRNAs in OSCC
tissues. GO, Gene Ontology; BP, biological process; CC, cellular component; MF,
molecular function; KEGG, Kyoto Encyclopedia of Genes and Genomes. **p
To further investigate group-specific methylation differences, differentially
m7G-methylated lncRNAs were identified using DiffReps software, with thresholds
set at FC
Additionally, analysis of the chromosomal localization of differentially m7G-modified lncRNAs revealed that hyper-m7G-modified lncRNAs were consistently more abundant than hypo-m7G-modified lncRNAs across all chromosomes (Fig. 2E). This distribution pattern was broadly consistent with the previously observed distribution of total m7G peaks, indicating potential chromosomal preferences of m7G modifications and possible links to transcriptional activity or regional genomic function. Moreover, analysis of transcript lengths revealed that lncRNAs shorter than 2000 nucleotides exhibited a higher frequency of both hyper- and hypo-m7G methylation events (Fig. 2F), suggesting that shorter lncRNAs may be more dynamically regulated by m7G methylation in OSCC (Fig. 2F).
To elucidate the potential biological functions of differentially m7G-methylated
lncRNAs in OSCC, GO and KEGG enrichment analyses were performed based on their
predicted target genes. The analysis focused on genes associated with hyper-m7G
lncRNAs. All enrichment terms presented met the significance threshold of
p
As shown in Table 1, the top ten lncRNAs exhibiting the most significant changes in m7G methylation, both hypermethylated and hypomethylated, are listed.
| Transcript id | Gene name | FC value | p-value | Coordinates | Regulation |
| ENST00000443767 | TATDN2P1 | 1210.4 | 7.3528 |
chrX:44143162-44145492+ | Hyper-m7G |
| uc004bit.1 | AX746484 | 1140.3 | 3.5411 |
chr9:117112777-117115409- | Hyper-m7G |
| ENST00000452051 | TM4SF19-AS1 | 1020.7 | 1.1286 |
chr3:196045221-196052441+ | Hyper-m7G |
| ENST00000435770 | RPL36AP6 | 994.7 | 3.2269 |
chr9:110596790-110597110- | Hyper-m7G |
| ENST00000519041 | RP11-386D6.1 | 893.6 | 4.9882 |
chr8:87719775-87777251+ | Hyper-m7G |
| ENST00000609973 | GRM4 | 860.4 | 3.5150 |
chr6:34021956-34100798- | Hyper-m7G |
| NR_110306 | LOC101929657 | 837.7 | 1.0048 |
chr13:52703031-52706859+ | Hyper-m7G |
| NR_026790 | HCG11 | 829.0 | 3.2564 |
chr6:26521934-26527612+ | Hyper-m7G |
| NR_024433 | LINC00926 | 819.2 | 3.2771 |
chr15:57592563-57599967+ | Hyper-m7G |
| ENST00000526935 | CTD-3064C13.1 | 808.6 | 3.1712 |
chr11:22282755-22283802- | Hyper-m7G |
| ENST00000433383 | NEK4P1 | 1015.7 | 5.3712 |
chr21:18582787-18583665- | Hypo-m7G |
| ENST00000509669 | CTD-3179P9.1 | 885.7 | 3.7330 |
chr5:117260703-117542666+ | Hypo-m7G |
| NR_027498 | COL18A1-AS1 | 809.1 | 4.1420 |
chr21:46839631-46844985- | Hypo-m7G |
| ENST00000609206 | CTA-268H5.14 | 774.0 | 3.7204 |
chr22:45658166-45659466- | Hypo-m7G |
| ENST00000464333 | SFI1 | 766.1 | 3.8445 |
chr22:32010357-32014533+ | Hypo-m7G |
| ENST00000445341 | MSANTD2P1 | 732.7 | 4.0893 |
chr21:24473545-24475396+ | Hypo-m7G |
| ENST00000507903 | RP11-586E1.1 | 723.9 | 5.5059 |
chr5:62318746-62319316- | Hypo-m7G |
| ENST00000393388 | RP11-320N7.1 | 710.4 | 4.5655 |
chr12:4219194-4227298- | Hypo-m7G |
| NR_103535 | NEXN-AS1 | 708.3 | 6.9869 |
chr1:78347033-78355224- | Hypo-m7G |
| ENST00000480002 | CACNG2 | 665.3 | 4.0822 |
chr22:36980536-36981501- | Hypo-m7G |
lncRNAs, long non-coding RNAs; m7G, N7-methylguanosine; OSCC, oral squamous cell carcinoma.
Differential expression analysis of lncRNAs was conducted using HTSeq software,
identifying 266 upregulated and 303 downregulated lncRNAs based on the thresholds
of p
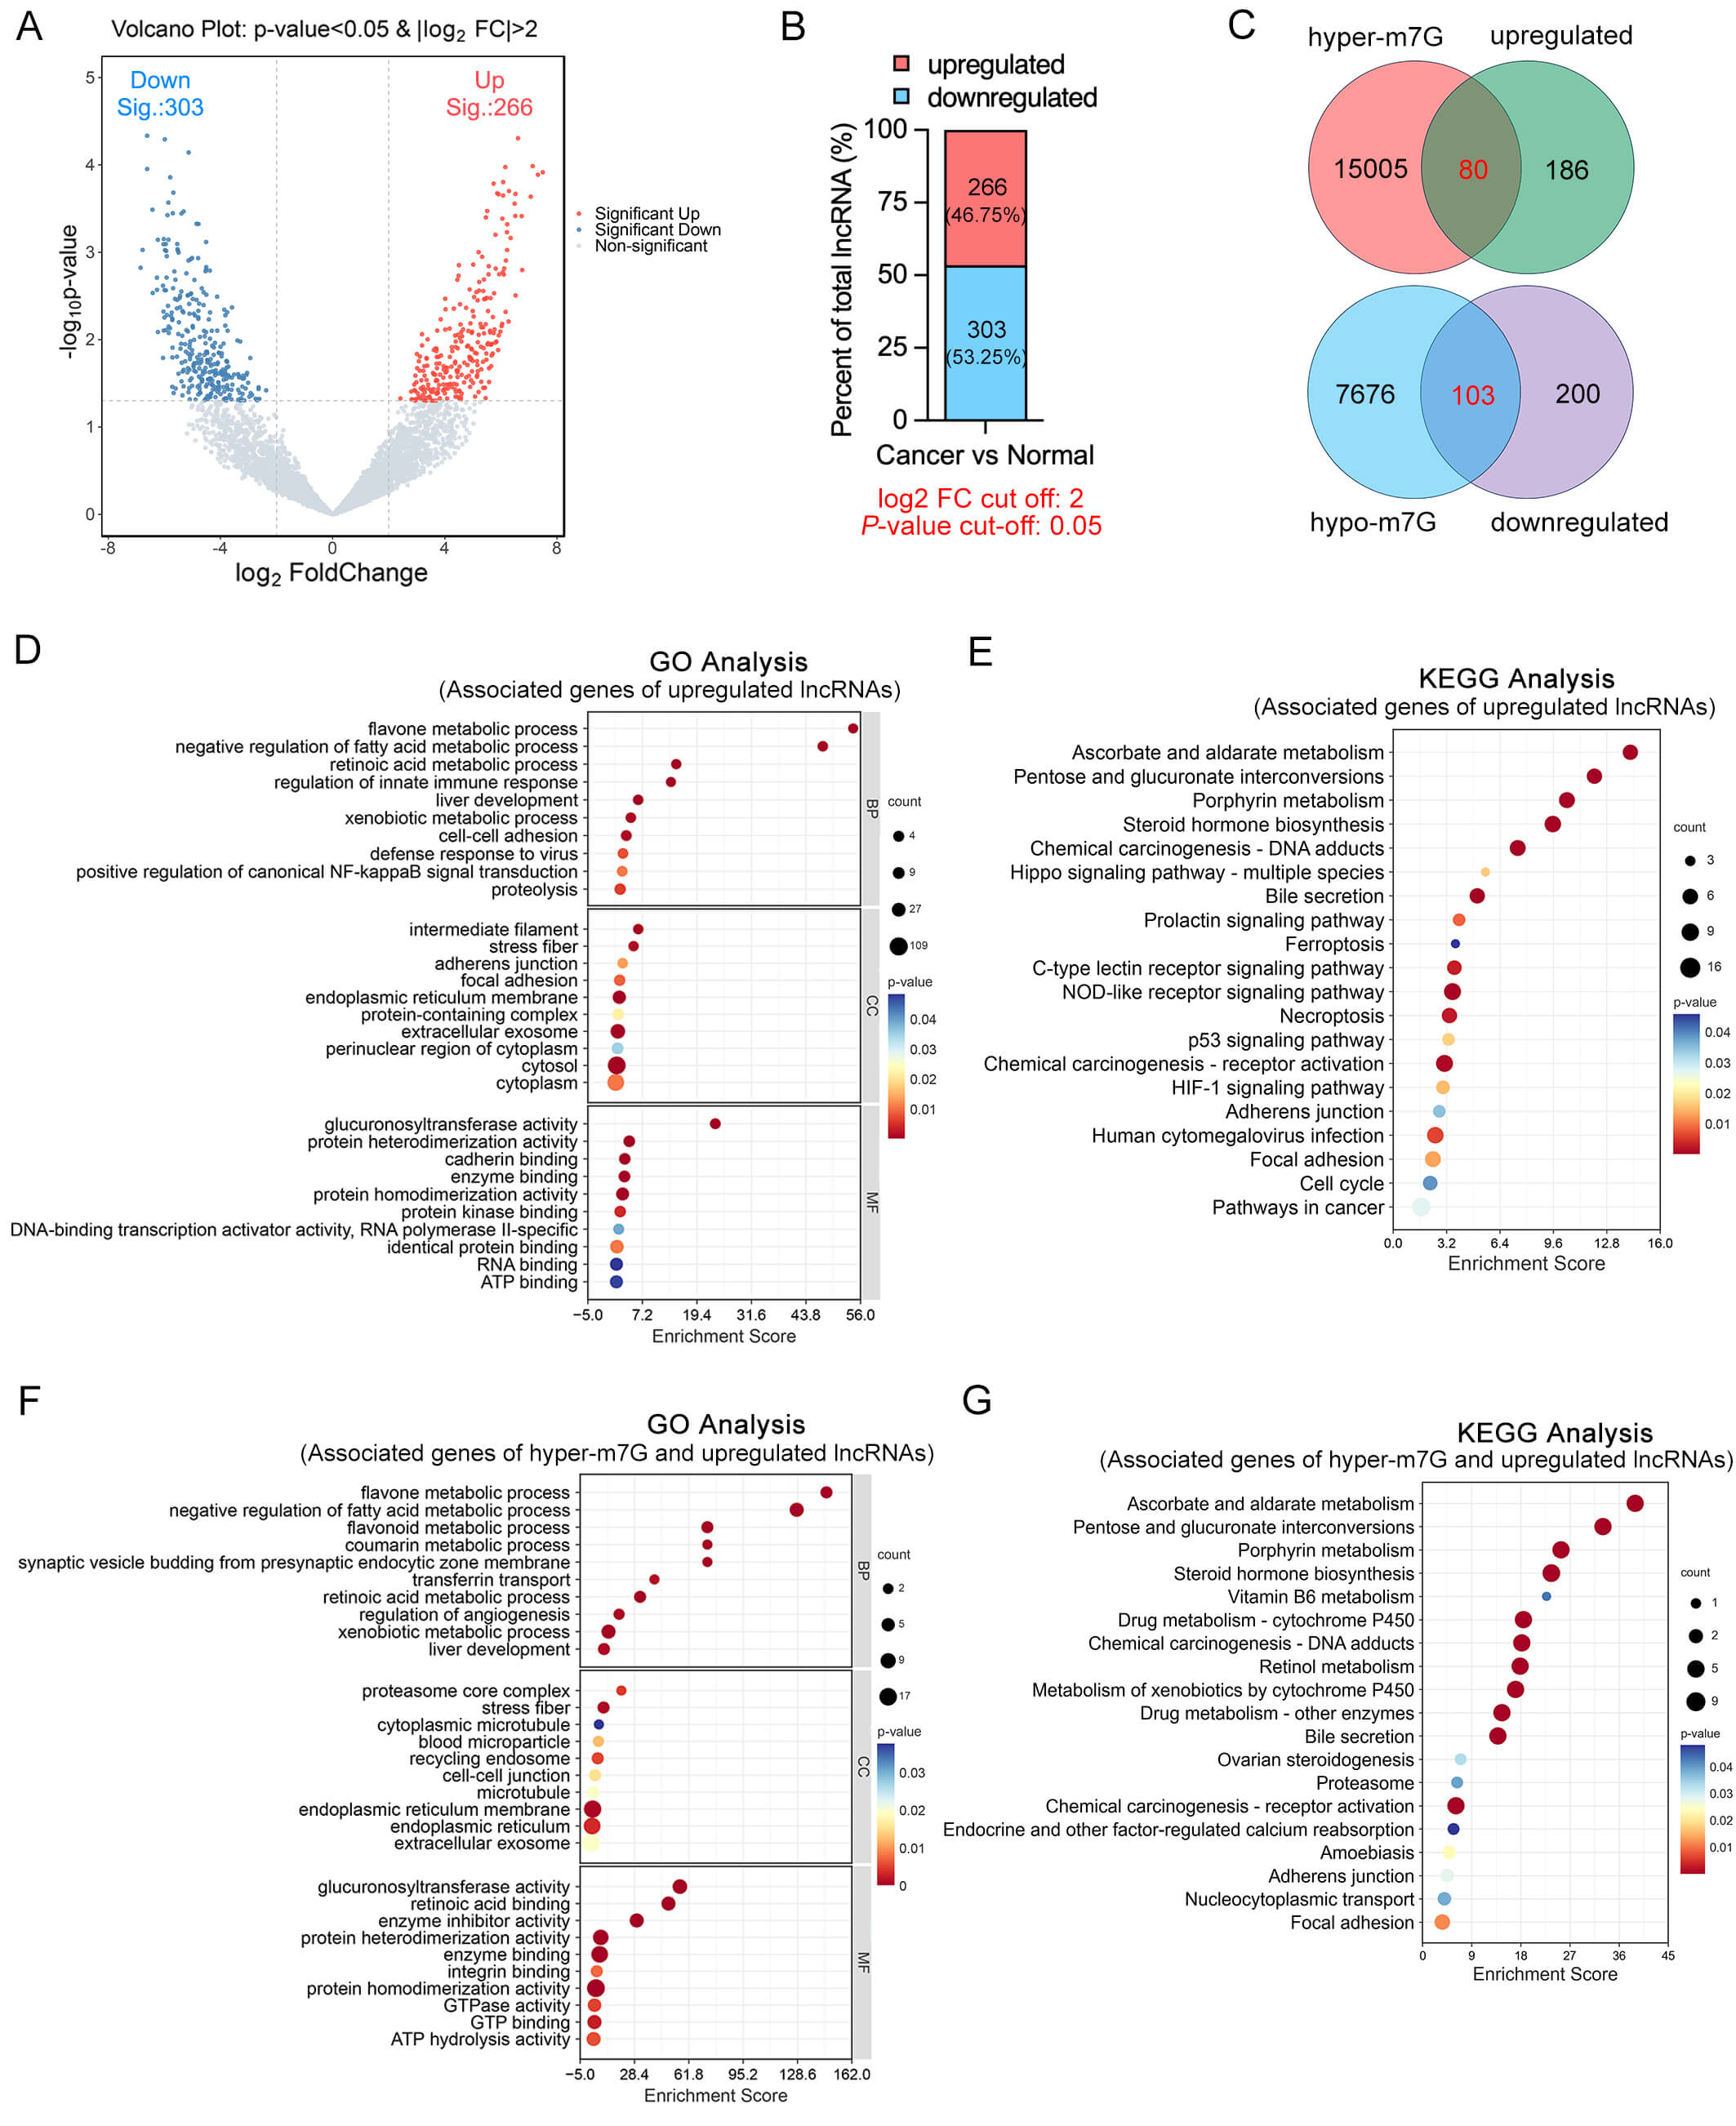 Fig. 3.
Integrated analysis of differentially expressed and
hyper-m7G-modified lncRNAs in OSCC. (A) Volcano plot displaying the
differentially expressed lncRNAs in OSCC tissues compared to adjacent normal
tissues. Red and blue dots represent significantly upregulated and downregulated
lncRNAs, respectively (
GO and KEGG pathway enrichment analyses were conducted for genes associated with dysregulated lncRNAs. The results showed that genes associated with upregulated lncRNAs were significantly enriched in diverse metabolic processes, pathways related to cell adhesion and migration, along with a variety of signaling pathways (Fig. 3D,E). Meanwhile, GO and KEGG analyses of genes associated with downregulated lncRNAs, showing significant enrichment in muscle system processes, cytoskeletal organization, and cardiomyopathy-related pathways (Supplementary Fig. 2A,B).
Furthermore, GO and KEGG enrichment analyses of genes associated with hyper-m7G-modified and upregulated lncRNAs revealed significant enrichment in various biological pathways, including retinoic acid metabolism, xenobiotic and drug metabolism, the proteasome pathway, and cell adhesion-related processes such as focal adhesion and adherens junction. These findings suggest that such lncRNAs may be involved in regulating cellular metabolic activity, protein degradation mechanisms, and tumor cell adhesion and migration, potentially contributing to OSCC progression (Fig. 3F,G). In parallel, functional annotation (GO and KEGG) of the target genes linked to the concurrent hypo-m7G and downregulated lncRNAs highlighted a prominent involvement in pathways related to neuronal development, intracellular signaling and transport, calcium signaling, and chromatin remodeling (Supplementary Fig. 2C,D).
Taken together, the data suggest that lncRNAs exhibiting both hypermethylation and upregulation are closely associated with oncogenic pathways, implicating them as potential contributors to OSCC progression.
Given the well-established association between m7G hypermethylation and OSCC progression, we further analyzed the set of 80 lncRNAs that exhibited both increased m7G methylation and upregulated expression in OSCC tissues. Among these lncRNAs, 20 showed a fold change in m7G methylation greater than 100 (Table 2). To ensure the specificity of non-coding RNA candidates, we examined all transcripts generated by each gene and retained only eight lncRNAs whose transcripts were classified as non-coding, whereas the remaining genes contained one or more protein-coding transcripts.
| Transcript id | Gene name | FC value | p-value | Coordinates | Gene type1 | Source |
| ENST00000467041 | SSR2 | 347.9 | 5.2124 |
chrX:44143162-44145492+ | Mixed | gencode |
| ENST00000411812 | RNF216 | 312.9 | 3.2279 |
chr9:117112777-117115409- | Mixed | gencode |
| ENST00000526172 | C1orf106 | 296.6 | 4.2345 |
chr3:196045221-196052441+ | Mixed | gencode |
| uc031qjh.1 | JX088243 | 272.3 | 3.8232 |
chr9:110596790-110597110- | Non-coding | UCSC |
| ENST00000481194 | CCM2 | 250.8 | 3.1880 |
chr8:87719775-87777251+ | Mixed | gencode |
| uc002snv.4 | BC024248 | 240.1 | 3.5411 |
chr6:34021956-34100798- | Non-coding | UCSC |
| NR_036680 | DPY19L1P1 | 234.8 | 3.5779 |
chr13:52703031-52706859+ | pseudogene | RefSeq |
| NR_103783 | BLACAT1 | 229.1 | 7.0597 |
chr6:26521934-26527612+ | LncRNA | RefSeq |
| ENST00000592582 | SEH1L | 183.2 | 1.9911 |
chr15:57592563-57599967+ | Mixed | gencode |
| ENST00000551334 | CTD-2314B22.3 | 177.7 | 3.6684 |
chr11:22282755-22283802- | LncRNA | gencode |
| ENST00000525379 | KDM2A | 177.6 | 1.1450 |
chr21:18582787-18583665- | Mixed | gencode |
| ENST00000421951 | ANKRD36BP2 | 164.4 | 9.2036 |
chr5:117260703-117542666+ | pseudogene | gencode |
| ENST00000541795 | RAB6A | 163.4 | 3.5101 |
chr21:46839631-46844985- | Mixed | gencode |
| ENST00000435097 | FAM83H-AS1 | 157.1 | 3.2174 |
chr22:45658166-45659466- | Mixed | gencode |
| ENST00000493456 | NUP50 | 133.1 | 2.9514 |
chr22:32010357-32014533+ | Mixed | gencode |
| uc003skl.1 | AK127339 | 126.5 | 3.9081 |
chr21:24473545-24475396+ | Non-coding | UCSC |
| ENST00000483509 | KIAA1841 | 121.9 | 4.1191 |
chr5:62318746-62319316- | Mixed | gencode |
| NR_027350 | MIR17HG | 110.7 | 6.8074 |
chr12:4219194-4227298- | ncRNA | RefSeq |
| ENST00000486208 | GGNBP2 | 109.4 | 9.2636 |
chr1:78347033-78355224- | Mixed | gencode |
| ENST00000473949 | ARF1 | 103.0 | 2.1545 |
chr22:36980536-36981501- | Mixed | gencode |
1 Mixed indicates that the gene locus contains both protein-coding and noncoding transcript isoforms.
These eight lncRNAs were further analyzed using multiple public databases, including GEPIA3 (https://gepia3.bioinfoliu.com/) [33], ENCORI (https://rnasysu.com/encori/panCancer.php) [34], cProSite (https://cprosite.ccr.cancer.gov) [35], TIMER3 (https://compbio.cn/timer3/) [36], to evaluate their expression patterns in HNSCC. The results revealed that DPY19L1P1, BLACAT1, ANKRD36BP2, and MIR17HG were highly expressed in the TCGA-HNSC cohort (Fig. 4A–D; Supplementary Fig. 3A,B). To further explore regulatory mechanisms, the correlation between these candidate lncRNAs and METTL1/WDR4 was assessed. Among them, DPY19L1P1 and MIR17HG exhibited a significant positive correlation with METTL1 expression (Fig. 4E; Supplementary Fig. 3C). Notably, DPY19L1P1 showed the most prominent m7G hypermethylation and was thus prioritized as the top candidate for further investigation. In addition, analysis using the cProSite dataset revealed that DPY19L1P1 expression was also positively correlated with both METTL1 and WDR4 (Fig. 4F,G), suggesting a potential regulatory relationship.
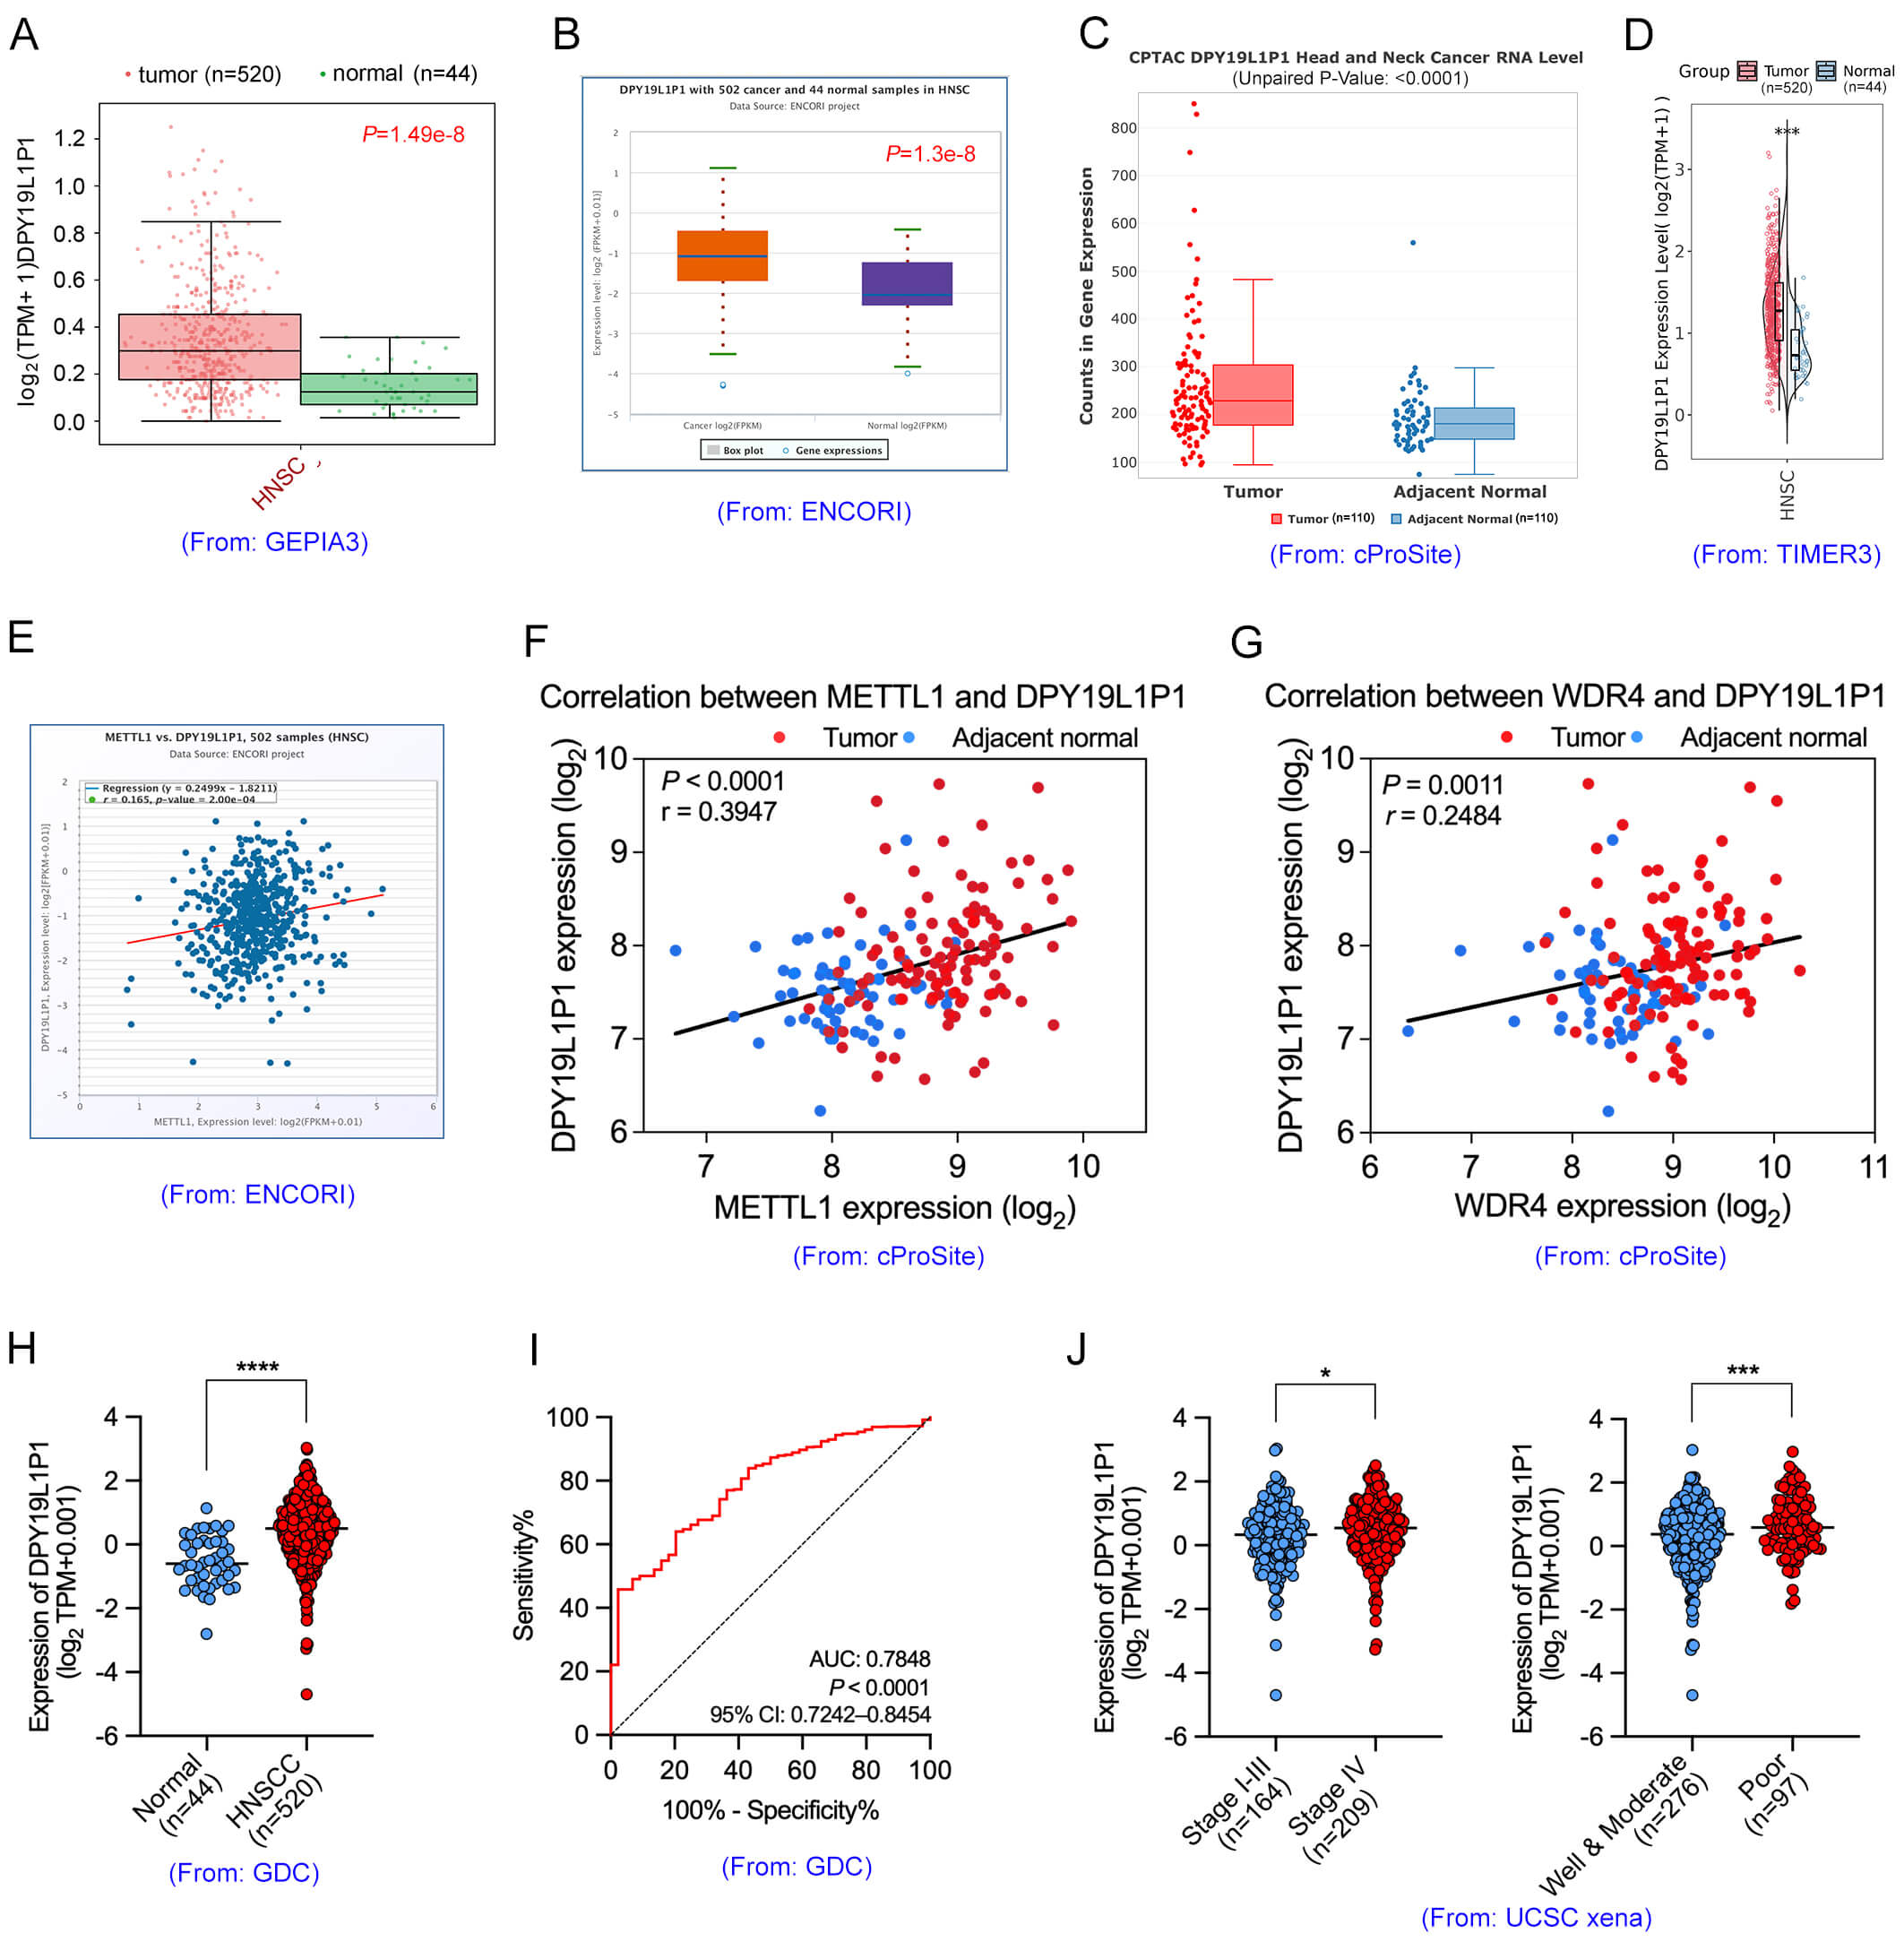 Fig. 4.
Clinical characterization and expression patterns of
DPY19L1P1 in OSCC. (A–D) DPY19L1P1 expression was
significantly upregulated in head and neck squamous cell carcinoma (HNSCC)
tissues compared to normal tissues, as shown by GEPIA3 (A), ENCORI (B), cProSite
(C), and TIMER3 (D) databases. (E) Pearson correlation analysis based on the
ENCORI database revealed a strong positive association between METTL1 and
DPY19L1P1 expression levels in HNSCC samples. (F,G) Correlation analysis
using cProSite showed a positive relationship between DPY19L1P1
expression and METTL1 (F) or WDR4 (G) expression in tumor tissues. (H) Analysis
of the GDC (TCGA) database further confirmed the elevated expression of
DPY19L1P1 in HNSCC tissues (n = 520) versus normal controls (n = 44).
(I) Receiver operating characteristic (ROC) curve analysis revealed that
DPY19L1P1 has good diagnostic performance for HNSCC, with an AUC of
0.7848 (95% CI: 0.7242–0.8454, p
Expression data from the GDC portal (https://portal.gdc.cancer.gov) [37] and the UCSC Xena Browser (http://xena.ucsc.edu/) [38] further confirmed that DPY19L1P1 is significantly upregulated in HNSCC tissues (Fig. 4H; Supplementary Fig. 3D,E). Moreover, receiver operating characteristic (ROC) curve analysis yielded an AUC of 0.7848, indicating that diagnostic potential of DPY19L1P1 in HNSCC (Fig. 4I). Elevated DPY19L1P1 expression correlated significantly with higher clinical stage (Stage IV) and poor tumor grade (Fig. 4J).
Collectively, these results suggest that DPY19L1P1 is a hyper-m7G-modified lncRNA with potential clinical utility as a diagnostic and prognostic biomarker in HNSCC.
The expression level of DPY19L1P1 was evaluated across commonly used OSCC cell lines. The results showed that DPY19L1P1 was markedly upregulated in OSCC cells, with CAL-27 and HN30 exhibiting the highest expression levels (Fig. 5A). Consequently, these two lines were adopted as model systems to elucidate how the m7G methyltransferases METTL1 and WDR4 influence both the expression and m7G modification of DPY19L1P1. In OSCC cell lines, knockdown or overexpression of METTL1 or WDR4 resulted in consistent changes in DPY19L1P1 expression, indicating a regulatory relationship (Fig. 5B,C).
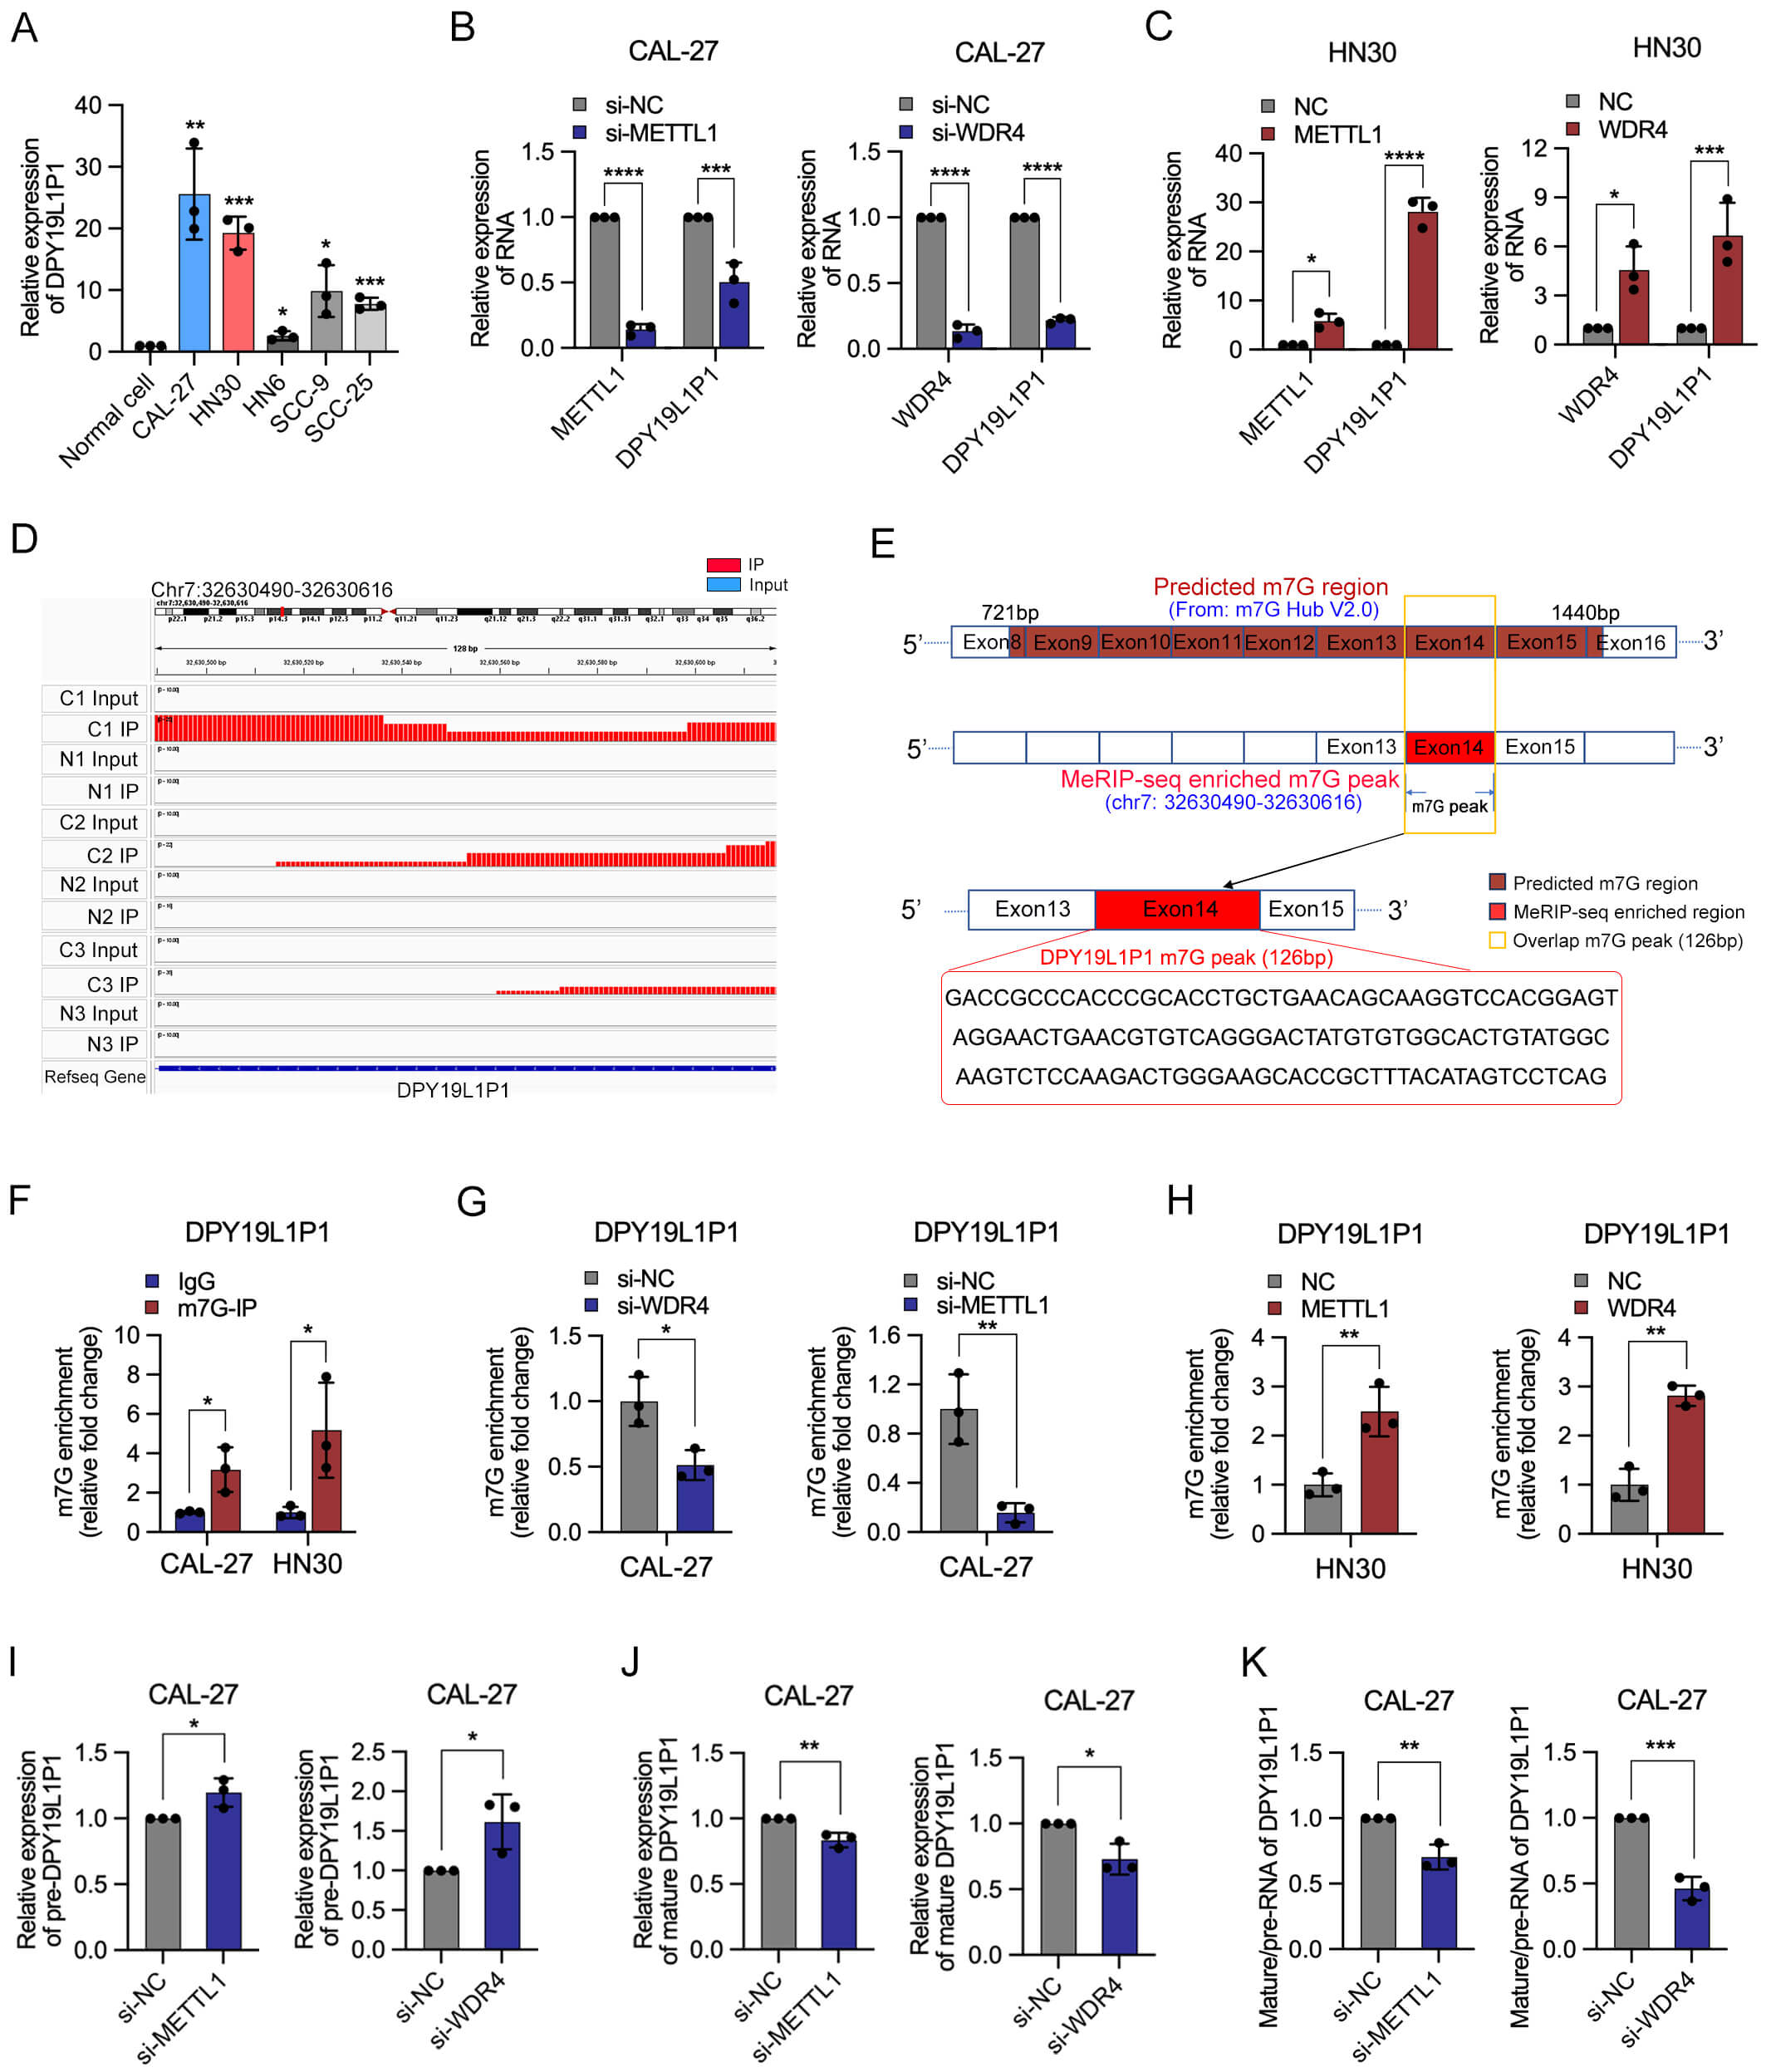 Fig. 5.
METTL1/WDR4 regulates the expression and m7G
modification of DPY19L1P1 in OSCC. (A) qPCR analysis of
DPY19L1P1 expression in normal oral epithelial cells and OSCC cell lines
(CAL-27, HN30, HN6, SCC9, and SCC25). (B) qPCR showing that knockdown of METTL1
or WDR4 significantly reduced DPY19L1P1 expression in CAL-27 cells. (C)
qPCR showing that overexpression of METTL1 or WDR4 significantly increased
DPY19L1P1 expression in HN30 cells. (D) Integrative Genomics Viewer
(IGV) visualization of MeRIP-seq reads mapping to the DPY19L1P1 locus in
OSCC tissues (C1–C3) and normal tissues (N1–N3), revealing enriched m7G peaks
specifically in OSCC samples. (E) Schematic illustration of the predicted m7G
modification sites in the DPY19L1P1 transcript based on m7G Hub data and
MeRIP-seq peaks, highlighting the overlapping region and its sequence. (F)
MeRIP-qPCR showing significant enrichment of m7G-modified DPY19L1P1
relative to IgG in CAL-27 and HN30 cells. (G) MeRIP-qPCR showing reduced m7G
enrichment of DPY19L1P1 following METTL1 or WDR4 knockdown in CAL-27
cells. (H) MeRIP-qPCR showing increased m7G enrichment of DPY19L1P1
following METTL1 or WDR4 overexpression in HN30 cells. (I) qPCR analysis of
precursor DPY19L1P1 transcript level after METTL1 or WDR4 knockdown in
CAL-27 cells. (J) qPCR analysis of mature DPY19L1P1 transcript levels
following METTL1 or WDR4 knockdown. (K) Splicing efficiency represented by the
ratio of mature DPY19L1P1 to precursor DPY19L1P1 transcripts.
siRNA, small interfering RNA; NC, Negative Control; IP, immunoprecipitation;
pre-DPY19L1P1, precursor DPY19L1P1. *p
To further characterize the m7G methylation status of DPY19L1P1, m7G peaks within its transcripts were visualized in OSCC and normal tissues using Integrative Genomics Viewer (IGV) (Fig. 5D). On the basis of predictions from the m7G Hub V2.0 database combined with MeRIP-seq data, exon 14 of DPY19L1P1 was identified as the major m7G-modified region of DPY19L1P1, spanning 126 base pairs (Fig. 5E). Primers targeting the peak region were designed accordingly (Supplementary Table 1), and MeRIP-qPCR analysis confirmed that DPY19L1P1 is hyper-m7G-modified in OSCC cells (Fig. 5F). Importantly, m7G enrichment on DPY19L1P1 decreased significantly following METTL1 or WDR4 knockdown, whereas overexpression of either enzyme enhanced m7G methylation (Fig. 5G,H). Together, these findings indicate that the METTL1/WDR4 methyltransferase complex modulates both the expression and m7G methylation level of DPY19L1P1 in OSCC.
To further investigate the regulatory mechanism by which METTL1/WDR4 modulates DPY19L1P1 expression, we examined the levels of precursor and mature transcripts. Knockdown of METTL1 or WDR4 significantly increased the expression of DPY19L1P1 precursor RNA (Fig. 5I), while markedly reducing the levels of mature RNA (Fig. 5J), resulting in a notable elevation of the precursor-to-mature RNA ratio, indicative of impaired splicing efficiency (Fig. 5K). These findings suggest that METTL1/WDR4 regulates DPY19L1P1 at the post-transcriptional level by modulating its splicing efficiency.
Nuclear/cytoplasmic fractionation analysis in CAL-27 cells revealed that
DPY19L1P1 was predominantly localized in the nucleus, with a
nuclear/cytoplasmic distribution ratio of 75.06
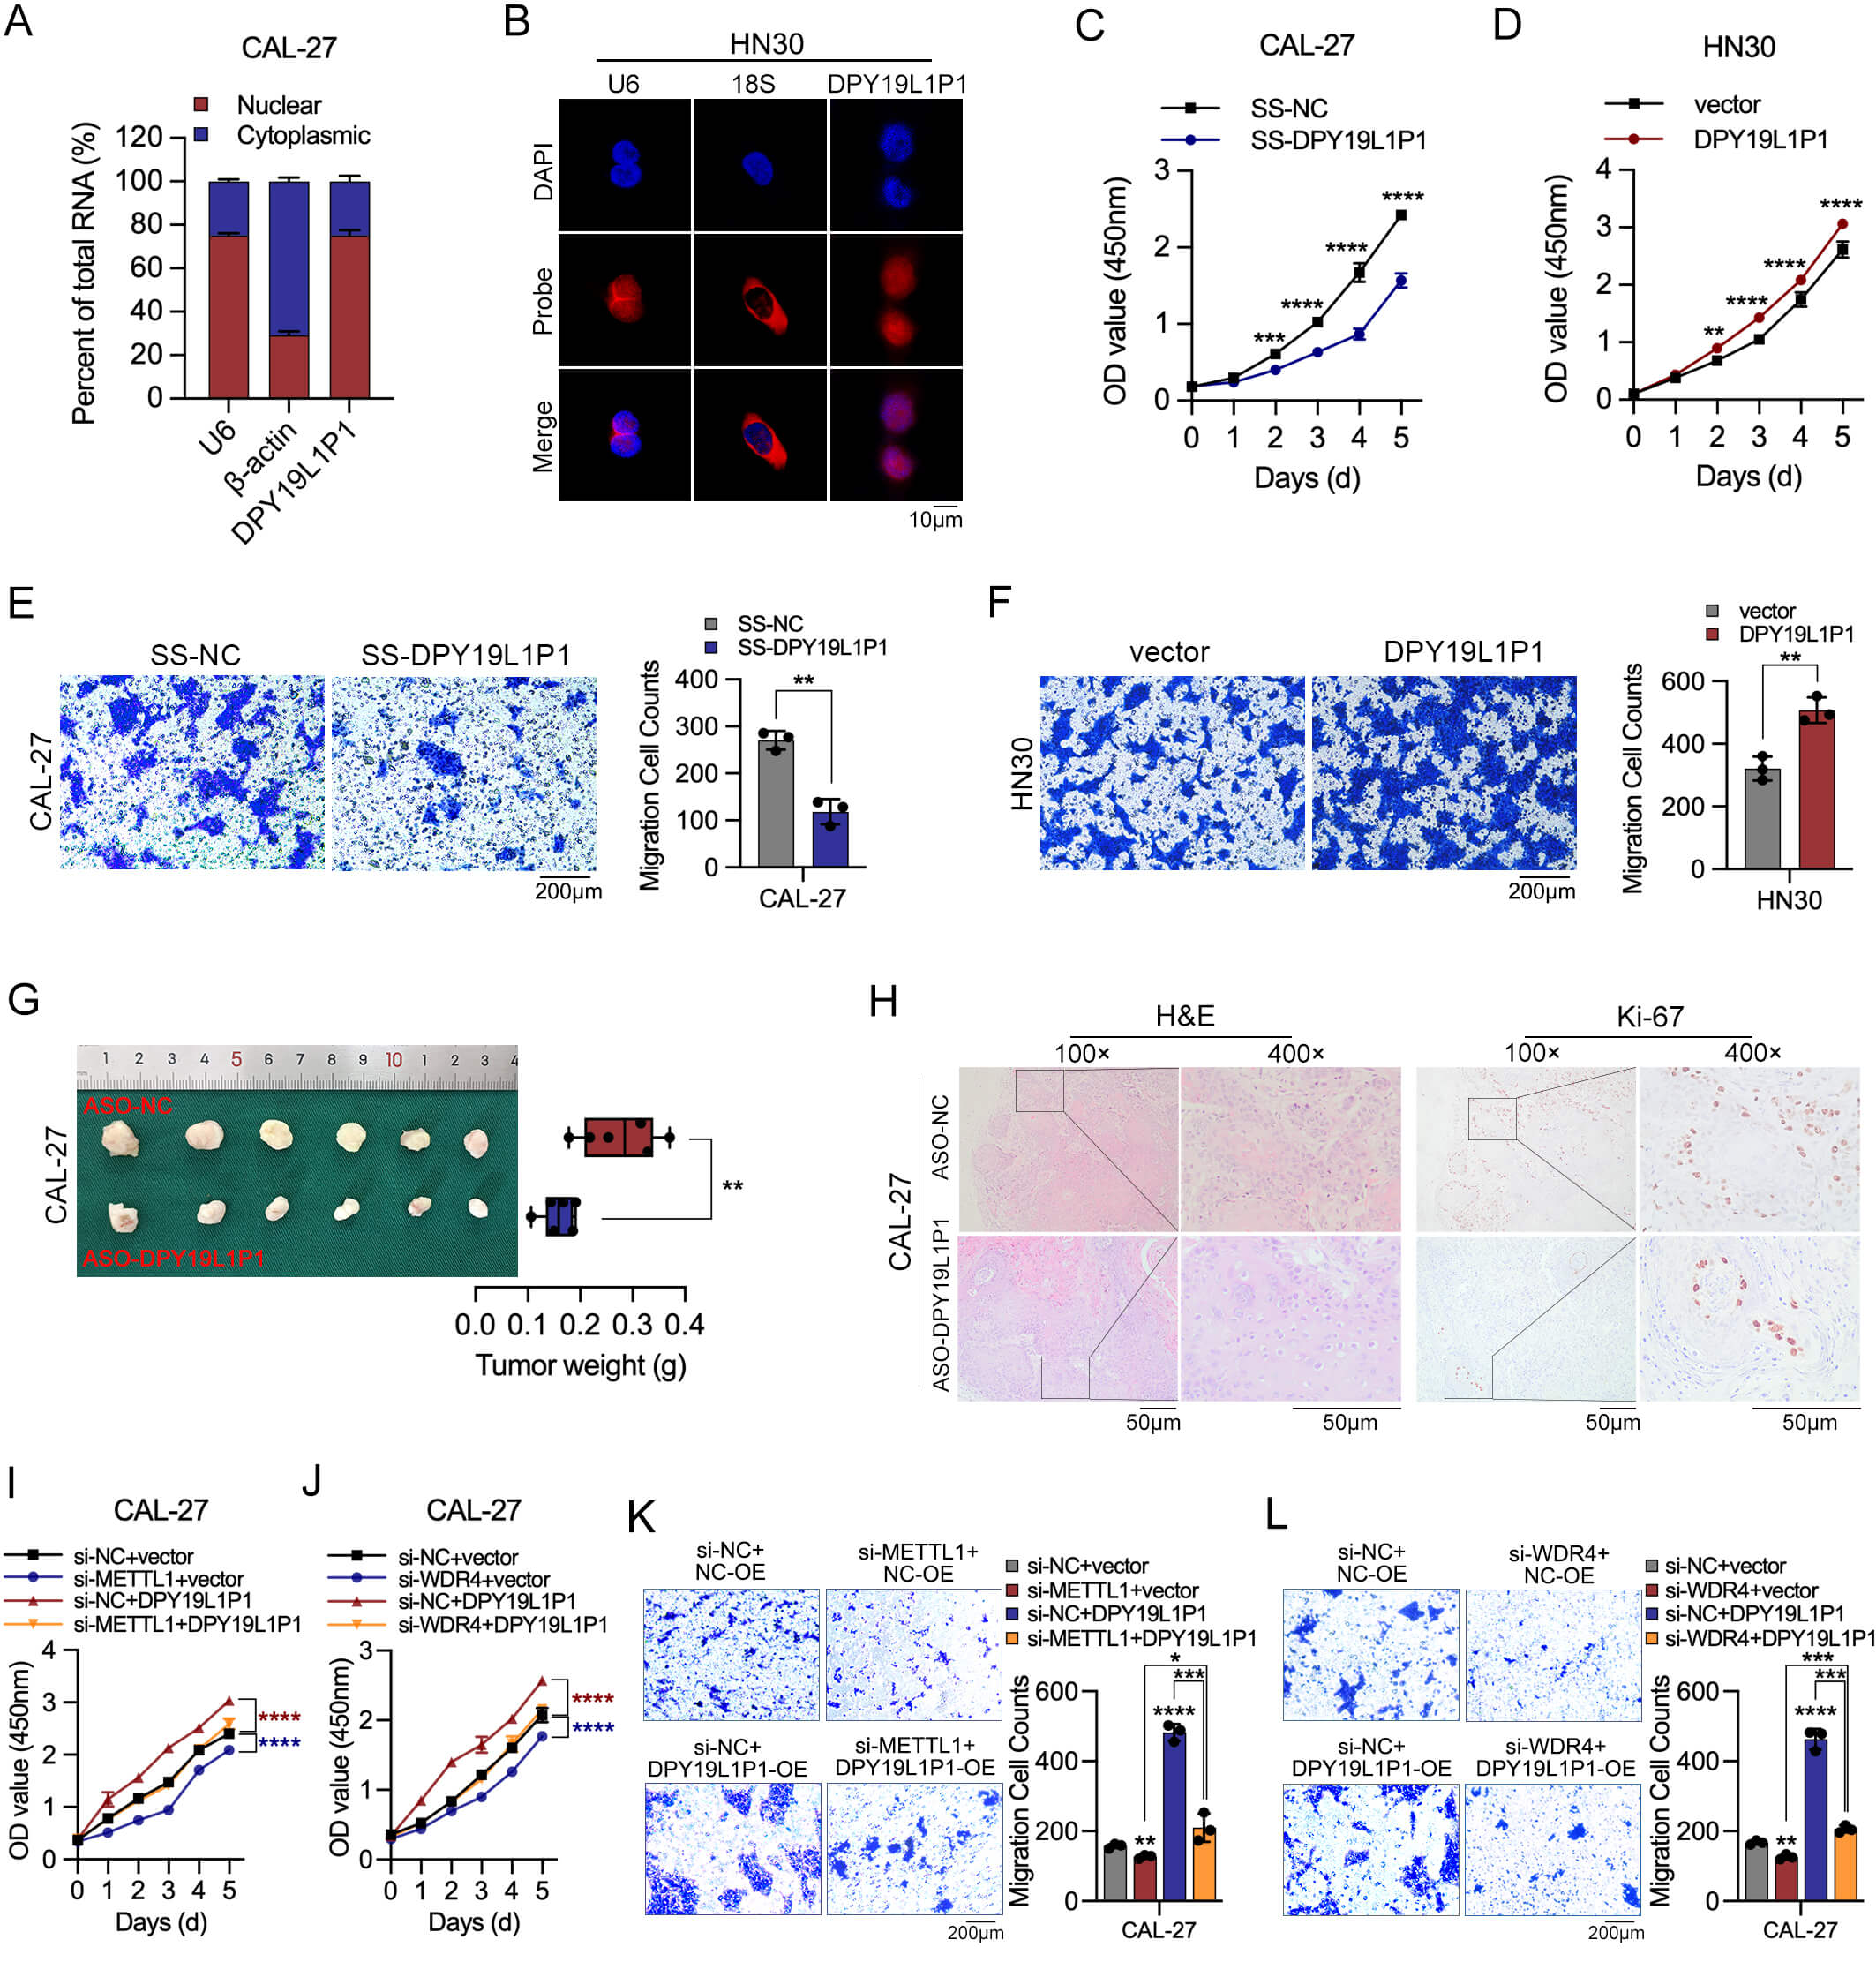 Fig. 6.
DPY19L1P1 enhances OSCC progression and
functionally cooperates with METTL1/WDR4. (A) The subcellular localization of
DPY19L1P1 was determined by nuclear/cytoplasmic fractionation in CAL-27
cells. U6 and
It has been well documented that METTL1/WDR4 functions as a key driver in facilitating the growth and motility of OSCC cells [7]. To determine whether DPY19L1P1 functions downstream of METTL1/WDR4, we conducted rescue experiments. Overexpression of DPY19L1P1 partially reversed the reduced proliferative (Fig. 6I,J) and migratory (Fig. 6K,L) abilities caused by METTL1 or WDR4 knockdown. These results support the notion that DPY19L1P1 acts as a downstream effector of the METTL1/WDR4 complex, mediating its oncogenic effects in OSCC progression.
Given that previous GO and KEGG analyses revealed enrichment of hyper-m7G-modified and upregulated genes in functions and pathways related to metabolism and cell adhesion, we further investigated whether DPY19L1P1 is involved in metabolic processes and EMT.
We first assessed changes in intracellular ATP levels following DPY19L1P1 knockdown or overexpression. ATP quantification assays showed that silencing DPY19L1P1 significantly reduced ATP levels in CAL-27 cells, whereas its overexpression markedly increased ATP production in HN30 cells, indicating that DPY19L1P1 is involved in cellular energy metabolism (Fig. 7A). Furthermore, glucose uptake and lactate production assays confirmed that DPY19L1P1 knockdown decreased glucose consumption and lactate generation, while its overexpression enhanced both parameters (Fig. 7B,C). These results suggest that DPY19L1P1 promotes a shift toward glycolytic metabolism. In line with this, qPCR analysis revealed that DPY19L1P1 overexpression upregulated the mRNA level of key glycolytic genes, including HIF1A, GLUT1, HK2, PFKFB3, PKM, LDHA, PDK1, and PGK1 (Fig. 7D), implying a role in promoting aerobic glycolysis (the Warburg effect) and metabolic reprogramming in OSCC cells.
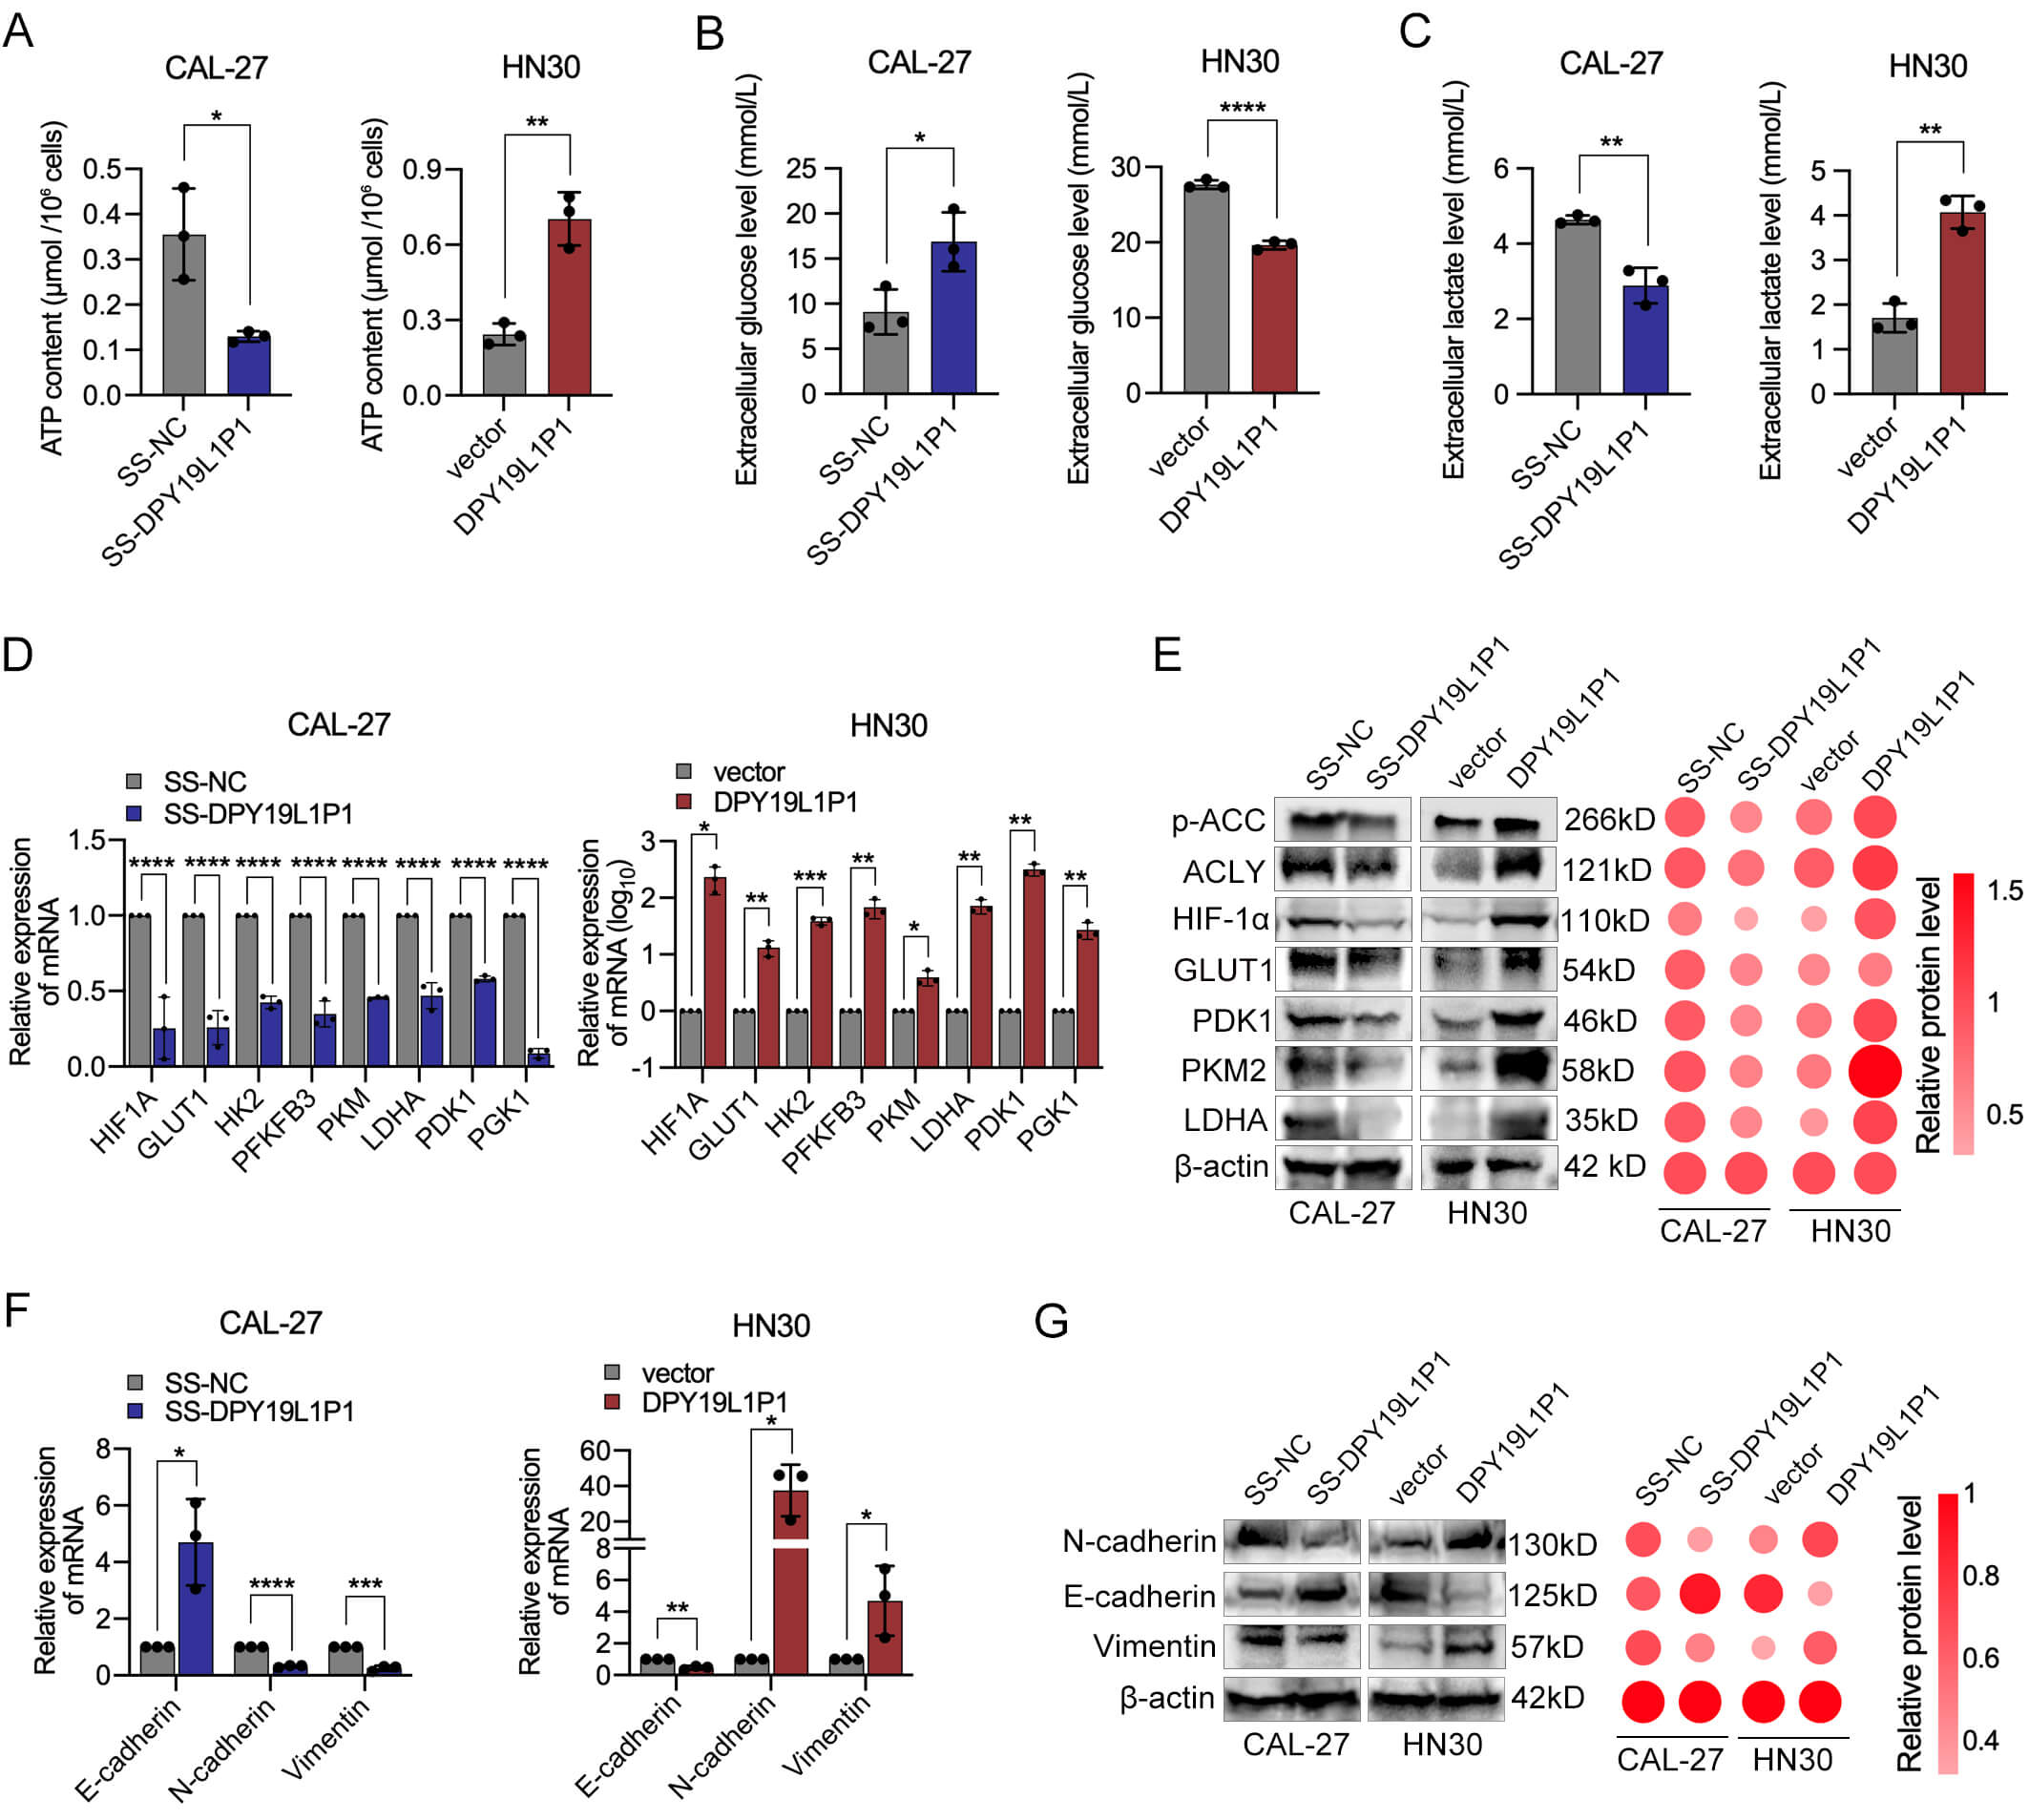 Fig. 7.
DPY19L1P1 promotes glycolytic metabolism and
EMT in OSCC cells. (A) Intracellular ATP levels were measured in CAL-27 cells
with DPY19L1P1 knockdown and HN30 cells with DPY19L1P1
overexpression. (B) Glucose uptake was assessed in CAL-27 cells with
DPY19L1P1 knockdown and HN30 cells with DPY19L1P1 overexpression. (C) Lactate production was quantified in CAL-27 cells
with DPY19L1P1 knockdown and HN30 cells with DPY19L1P1 overexpression. (D) qPCR analysis of key glycolytic pathway genes
(HIF1A, GLUT1, HK2, PKM, LDHA, etc.) in CAL-27 cells with DPY19L1P1 knockdown and HN30 cells with DPY19L1P1 overexpression. (E) Western blot analysis of glycolysis- and lipid
metabolism–related proteins (HIF-1
Consistently, Western blot analysis confirmed that DPY19L1P1 positively
regulates glycolytic markers (HIF-1
Additionally, we investigated the role of DPY19L1P1 in EMT. qPCR and Western blot analysis revealed that DPY19L1P1 knockdown caused increased E-cadherin and decreased N-cadherin and vimentin expression, while its overexpression produced the opposite effect (Fig. 7F,G). These findings indicate that DPY19L1P1 facilitates EMT progression in OSCC cells, potentially contributing to enhanced migratory and invasive capabilities.
m7G modification is among the most prevalent post-transcriptional RNA modifications and plays a pivotal role in promoting malignant tumor progression by modulating RNA metabolism and gene expression [7, 39]. METTL1 and WDR4, the key methyltransferases responsible for internal m7G methylation of mRNAs and lncRNAs, have been shown to contribute significantly to cancer progression, including in OSCC, where their overexpression correlates with poor prognosis [7, 13, 40].
Emerging evidence underscores the regulatory importance of m7G-modified lncRNAs in diverse cancer types, where they influence critical biological processes such as metabolic reprogramming, proliferation, and metastasis [41]. In particular, m7G-related lncRNAs have recently emerged as potential biomarkers prognostic and prediction of immune response in several malignancies, including colorectal, endometrial, lung, liver, bladder, and pancreatic cancers [42, 43, 44, 45, 46, 47]. Although bioinformatics analyses have suggested similar roles for m7G-related lncRNAs in OSCC [18], direct experimental validation remains lacking.
In this study, we performed a comprehensive analysis of m7G-modified lncRNAs based on m7G MeRIP-seq and RNA-seq in paired OSCC and adjacent normal tissues. We found that lncRNAs with high m7G modification level were significantly enriched in OSCC tissues. Notably, peak lengths of m7G-modified regions differed significantly between tumor and normal samples, and hyper-m7G was the dominant modification pattern. Genes associated with hyper-m7G and/or upregulated lncRNAs were shown enrichment in pathways related to metabolism and cell migration, suggesting that these lncRNAs may play oncogenic roles in OSCC. However, we acknowledge the limited sample size (n = 3 pairs), which may affect representativeness and biological variability. Future studies involving larger clinical cohorts are needed to validate these findings.
Among the hyper-m7G-modified and upregulated lncRNAs, we focused on DPY19L1P1, which was clearly annotated as non-coding and exhibited the most prominent m7G peak signal in OSCC. DPY19L1P1 is classified as an unprocessed pseudogene of DPY19L1, a gene encoding a C-mannosyltransferase that catalyzes the C-mannosylation of tryptophan residues in proteins and may influence cancer cell behavior by modifying receptor tyrosine kinases [48]. Despite the shared nomenclature, there is no evidence indicating any regulatory or functional interaction between DPY19L1P1 and DPY19L1. Functionally, DPY19L1P1 acts as a regulatory lncRNA and has been implicated in various disease contexts, including cryptococcal meningitis [49], acute myeloid leukemia [50], and epicardial fat tissue inflammation associated with atrial fibrillation [51]. However, to date, no studies have explored the functional role of DPY19L1P1 in OSCC or other solid tumors.
Our data demonstrate that DPY19L1P1 is significantly upregulated in OSCC and correlates with advanced tumor stage and poor differentiation, suggesting clinical significance and diagnostic value. Mechanistically, METTL1 and WDR4 cooperatively regulate both the expression and m7G methylation level of DPY19L1P1, likely by enhancing its splicing efficiency. This aligns with known post-transcriptional effects of m7G modification and provides a plausible explanation for DPY19L1P1 overexpression in OSCC. Functional assays confirmed that DPY19L1P1 promotes OSCC cell proliferation, migration, and metabolic reprogramming, consistent with the known oncogenic roles of METTL1/WDR4 [7, 14]. Notably, DPY19L1P1 was predominantly localized in the nucleus, where it transcriptionally modulated EMT and metabolic genes. This suggests a mechanism involving nuclear lncRNA-mediated recruitment of transcription factors or RNA-binding proteins to specific promoters [52]. However, this hypothesis warrants further investigation.
Although our findings indicate that DPY19L1P1 functions downstream of METTL1/WDR4 in OSCC, whether its oncogenic role is directly dependent on m7G modification remains to be fully determined. In future studies, we aim to map the precise m7G modification sites on DPY19L1P1 and determine whether the oncogenic activity of DPY19L1P1 is dependent on METTL1/WDR4-mediated m7G methylation.
Importantly, we recognize that m7G is not the only modification potentially regulating DPY19L1P1. Systematic profiling of its full epitranscriptomic landscape will be crucial to explore potential crosstalk among different RNA modifications. Such research will deepen our understanding of lncRNA-mediated oncogenesis and may uncover new therapeutic strategies targeting RNA modifications.
This study systematically characterized the m7G methylation landscape of lncRNAs in OSCC and identified a subset of lncRNAs that were both highly expressed and hyper-m7G-modified in tumor tissues. These lncRNAs were closely associated with OSCC progression, particularly through pathways involving metabolic reprogramming and EMT. Among them, DPY19L1P1 was identified as a representative hyper-m7G-modified oncogenic lncRNA, regulated by the METTL1/WDR4 complex, and shown to promote OSCC cell proliferation, migration, and glycolysis. These findings suggest that m7G-modified lncRNAs—particularly DPY19L1P1—may serve as potential biomarkers and treatment targets in OSCC.
m7G, N7-methylguanosine; OSCC, oral squamous cell carcinoma; lncRNA, long non-coding RNA; METTL1, methyltransferase-like 1; WDR4, WD repeat domain 4; MeRIP-seq, methylated RNA immunoprecipitation sequencing; ECL, enhanced chemiluminescence; GO, Gene Ontology; BP, biological process; CC, cellular component; MF, molecular function; KEGG, Kyoto Encyclopedia of Genes and Genomes; FC, fold change; qPCR, quantitative real-time PCR; FISH, Fluorescence In Situ Hybridization; CCK-8, Cell Counting Kit-8; m6A, N6-methyladenosine; m1A, N1-methyladenosine; m5C, 5-methylcytosine; SS, Smart Silencer; HNSCC, head and neck squamous cell carcinoma; tRNA, transfer RNA; EMT, epithelial‒mesenchymal transition; HE, Hematoxylin and Eosin; ASO, antisense oligonucleotide; siRNA, small interfering RNA; AUC, area under the ROC curve; ROC, receiver operating characteristic; IGV, Integrative Genomics Viewer.
The datasets used and analyzed during the current study are available from the corresponding author on reasonable request.
YJ conceived the project, designed the research and contributed to the manuscript preparation. KL and HG performed the research. SB, HX and RZ performed the data analysis. JH, YW and YZ contributed to data acquisition and manuscript revision. All authors contributed to editorial changes in the manuscript. All authors read and approved the final manuscript. All authors have participated sufficiently in the work and agreed to be accountable for all aspects of the work.
Tissue samples for research were collected in accordance with the Declaration of Helsinki and were approved by the Medical Ethics Committee of Weifang Medical University (Ethics No. 2022YX007). Informed consent was obtained from all patients. All animal studies were approved by the Animal Care and Use Committee of Weifang Medical University (Approval No. 2023SDL332). All animal experiments were conducted in accordance with the ARRIVE guidelines and the principles of the 3Rs (Replacement, Reduction, and Refinement). Weifang Medical University has since been renamed Shandong Second Medical University, and the corresponding ethics committees have been institutionally renamed accordingly. All approvals remain fully valid under the original protocols.
The authors wish to thank Ning Song and Minmin Li for their assistance in image organization.
This study was supported by grants from Shandong Provincial Natural Science Foundation (ZR2023LSW019), the Graduate Student Research Grant from Shandong Second Medical University (2024YJSCX004, 2023YJSCX005), and College students Innovation and Entrepreneurship Training Program of Shandong Second Medical University (X2025205, X2025206, X2025208).
The authors declare no conflict of interest.
Supplementary material associated with this article can be found, in the online version, at https://doi.org/10.31083/FBL48929.
References
Publisher’s Note: IMR Press stays neutral with regard to jurisdictional claims in published maps and institutional affiliations.