


1 Department of Gastroenterology, The First Affiliated Hospital of Harbin Medical University, 150001 Harbin, Heilongjiang, China
2 Department of Gastroenterology, Heilongjiang Provincial Hospital, 150036 Harbin, Heilongjiang, China
3 Fifth Department of Medicine (Nephrology/Endocrinology/Rheumatology, Pneumonology), University Medical Center Mannheim, University of Heidelberg, 68167 Mannheim, Baden-Wurttemberg, Germany
†These authors contributed equally.
Abstract
Gastric cancer (GC) is among the most frequently diagnosed malignancies worldwide. Identifying novel therapeutic targets is of great significance.
GC-related RNA-seq data and matched clinical information were retrieved from the publicly available The Cancer Genome Atlas (TCGA) database. The epithelial-mesenchymal transition (EMT) scores of GC and normal tissues were calculated using the gene set variation analysis (GSVA) package. Weighted gene coexpression network analysis (WGCNA) was applied to identify modules associated with EMT. The survival and clinical relevance of EMT-related core genes were analyzed, and carbohydrate sulfotransferase 1 (CHST1) was selected for further investigation. CHST1 expression was validated in patient-derived GC tissues and GC cell lines. Subsequently, CHST1 expression and mitogen-activated protein kinase (MAPK)/extracellular signal-regulated kinase (ERK) signaling pathway activity were modulated in AGS cells to evaluate their effects on cell proliferation, apoptosis, migration, and EMT. In vivo experiments were conducted to elucidate the involvement of CHST1 expression in GC growth.
The EMT score was markedly higher in GC tissues than in normal tissues. Within the EMT-related module, 7 hub genes (CHST1, GPR176, OLFML2B, P4HA3, PDGFRB, SPARC, and VCAN) were closely associated with GC prognosis. CHST1 expression was strongly correlated with both the EMT score and T stage. As revealed by survival analysis, patients with high CHST1 expression had shorter overall survival than those with low expression. A marked up-regulation of CHST1 protein expression was observed in clinical GC tissues compared with normal tissues. In vitro, CHST1 expression was significantly elevated in GC cell lines. Inhibiting CHST1 expression in AGS and HGC27 cells suppressed cell proliferation, migration, as well as EMT, while simultaneously promoting apoptosis. In AGS cells, CHST1 regulated cell proliferation, apoptosis, migration, and EMT through the MAPK/ERK signaling pathway. In vivo, CHST1 significantly promoted GC growth and increased the activity of the MAPK/ERK signaling pathway.
CHST1 is highly expressed in GC and may influence GC progression by regulating the MAPK/ERK signaling pathway.
Keywords
- CHST1
- gastric cancer
- epithelial-mesenchymal transition
- prognosis
Gastric cancer (GC) represents a critical public health concern globally, with an extremely high incidence and a correspondingly high mortality rate. Each year, over one million individuals are diagnosed with GC, making it ranks fifth in incidence and fourth in mortality among all cancers worldwide [1]. The incidence of GC exhibits marked geographic variation, with East Asia demonstrating the highest prevalence and Eastern and Central Europe ranking second [2]. Among countries worldwide, a high incidence of GC has been reported in China, posing a markedly serious threat to population health and survival [3]. Advanced age, Helicobacter pylori infection, high salt intake, as well as diets deficient in fruits and vegetables are recognized as major risk factors for GC. In recent years, a gradual reduction has been observed in both the frequency of new GC cases and the associated mortality [4]. Nevertheless, it is anticipated that the prevalence of GC would increase due to the aging of the global population. The overall prognosis of GC patients varies according to disease severity. For patients with early-stage GC, radical surgical resection remains the optimal treatment, achieving a 5-year survival rate of over 90% [5]. However, the absence of clear clinical manifestations in the initial phase of GC and patients’ insufficient disease awareness result in nearly 70% of patients being diagnosed at a progressive or advanced stage. Approximately 30% of these patients have already lost the opportunity for radical surgical resection. Consequently, these patients face a dismal prognosis, with a median overall survival of only 3–4 months and an extremely low 5-year survival rate (only 3.17%) [6]. Unfortunately, current therapeutic options available for advanced GC are limited in their ability to substantially improve patient outcomes. As such, there is a pressing need to explore novel therapeutic approaches to address this unmet medical challenge.
Epithelial-mesenchymal transition (EMT) describes the process of epithelial cells’ transdifferentiation into mesenchymal cells in response to certain physiological and pathological stimuli. EMT fulfills three major roles in the human body: (1) embryogenesis and organ development; (2) repair and healing of tissue injury; and (3) modulation of interactions between tumor cells, as well as between tumor cells and stroma, thereby promoting the invasion and metastasis of tumor cells [7]. Enhanced EMT has been reported to promote the invasion and progression of several types of tumors, including GC [8]. These findings demonstrate a strong correlation between EMT and progression of GC, offering key knowledge to facilitate the advancement of cutting-edge therapeutic approaches for the management of GC. The carbohydrate sulfotransferases (CHSTs) family comprises 15 members (CHST1–15), which are enzymes that catalyze the transfer of sulfate groups to glycosaminoglycans and other complex carbohydrates. CHSTs primarily reside in the cell membrane and cytoplasm, where they also function as structural components of the extracellular matrix (ECM) and facilitate tissue remodeling [9]. A study by Zhan et al. [9] reported that most CHSTs (CHST1, 2, 4, 5, 6, 11, 12, 13, 14, and 15) showed high expression in GC, suggesting their potential involvement in the progression of GC.
Tumors are pathological conditions that arise from genetic mutations, leading to uncontrolled cell proliferation. Advances in sequencing technologies and the advent of the genomic era have enabled molecular biologists to comprehensively analyze tumor genomes. Bioinformatics analysis of tumor genomes is capable of identifying new proto-oncogenes or oncogenes, thereby providing new methods for tumor diagnosis, clinical outcome prediction, and targeted therapy. Ultimately, these approaches offer valuable evidence to support the implementation of individualized tumor therapy [10]. In this study, a range of bioinformatics techniques were employed to determine key genes linked to the prognosis of GC. Critically, the link between CHST1 and GC progression was experimentally validated. Furthermore, we identified the regulatory role of CHST1 in the mitogen-activated protein kinase (MAPK)/extracellular signal-regulated kinase (ERK) signaling pathway. As is known, the MAPK signaling pathway is a widely conserved intracellular signal transduction mechanism. Its classical components include ERK1/2, JNK, p38 MAPK, and ERK5 [11]. Among these, ERK1 and ERK2 can recognize a variety of substrates, including transcription factors, protein kinases, and phosphatases [12]. Overactive MAPK signaling is observed in more than 85% of cancers, including HCC, GC [12, 13, 14]. Accumulating evidence suggests the involvement of the MAPK pathway in key cellular mechanisms of GC, including proliferation, invasion, migration, and metastasis, and that dysregulation of this signaling pathway contribute to the pathogenesis of GC [15]. Based on the aforementioned findings, the current study attempts to further clarify CHST1’s role in GC and the potential underlying molecular mechanisms.
RNA-seq data and associated clinical data for GC were obtained from the publicly accessible The Cancer Genome Atlas-Stomach Adenocarcinoma (TCGA-STAD) project (https://portal.gdc.cancer.gov). This study included 448 samples in total, consisting of 36 control samples and 412 tumor samples. Only protein-coding genes were retained, and the expression of duplicates was averaged and normalization performed.
The edgeR package in R (v 4.3.0, Walter and Eliza Hall Institute of Medical
Research, Melbourne, VIC, Australia) was employed for conducting differential
expression analysis on the TCGA-STAD samples, with
The clusterProfiler (v 4.18.4, R package, Guangchuang Yu, Southern Medical
University, Guangzhou, Guangdong, China) and org.Hs.eg.db (v 3.22, R package,
Marc Carlson, Fred Hutchinson Cancer Center, Seattle, WA, USA) packages were
applied for performing Gene Ontology (GO) and Kyoto Encyclopedia of Genes and
Genomes (KEGG) enrichment analyses, with the significance threshold set at
p
EMT score calculation was performed using the GSVA package (v 3.22, R package, Robert Castelo, Universitat Pompeu Fabra, Barcelona, Catalonia, Spain) employing the HALLMARK_EPITHELIAL_MESENCHYMAL_TRANSITION gene set from the Molecular Signatures Database.
DEGs were subjected to weighted gene co-expression network analysis (WGCNA) via
the WGCNA package (v 1.72-5, R package, Peter Langfelder and Steve Horvath,
University of California, Los Angeles, CA, USA). Samples were
clustered and analyzed for independence and average connectivity. Subsequently, a
weighted co-expression network was constructed, and the green module (cor = 0.8,
p
Key module genes were identified using criteria of Gene Significance (GS)
The identified key module genes were subjected to survival analysis via the survival package (v 3.7, R package, Terry M. Therneau, Mayo Clinic, Rochester, MN, USA) in R. Kaplan–Meier curves were plotted with the ggsurvplot function. Genes showing significant association with survival time and rate were screened using the log-rank test, with a p value threshold of 0.01.
Analysis of gene expression was carried out based on the TCGA-STAD dataset. CHST1 expression-EMT score correlation was analyzed using the ggpubr package (v 0.6.0, R package, Alboukadel Kassambara, University of Debrecen, Debrecen, Hungary). Scatter plots were generated with the ggscatter function, incorporating a regression line, the Pearson correlation coefficient, along with its corresponding p-value. The sign and magnitude of the coefficient represent the direction and strength of the correlation between CHST1 expression and EMT, respectively.
Wilcoxon rank sum test was employed to analyze the correlation between the CHST1 gene and relevant clinical characteristics in TCGA-STAD using the ggpubr package. In addition, based on the GSE84437 dataset from the Gene Expression Omnibus database, the correlation between CHST1 expression and clinical characteristics was further assessed, and survival analysis was conducted to examine the link between CHST1 expression and the overall survival in GC patients.
CHST1 expression was validated in tumor tissue samples obtained from patients with GC. The GC tissue samples were provided by the Department of Gastroenterology, The First Affiliated Hospital of Harbin Medical University. Ethical approval for the current study was granted by the Ethics Committee of The First Affiliated Hospital of Harbin Medical University (Approval No.: 2024314). All study participants voluntarily provided informed consent.
Tumor sections embedded in paraffin underwent deparaffinization and rehydration, followed by antigen retrieval via microwave heating. Subsequently, the activity of endogenous peroxidase was blocked with hydrogen peroxide, and non-specific binding was reduced by incubation with normal goat serum. Subsequently, the sections were incubated sequentially with a primary anti-CHST1 antibody (1/200, 44627) overnight at 4 °C and a corresponding HRP-conjugated secondary antibody (Rabbit, 8114) at room temperature. Visualization was performed using DAB (P0202, Beyotime, China), with the reaction monitored under a microscope until distinct brownish-yellow granular staining was observed. Finally, the nuclei were counterstained with hematoxylin (C0107-100 mL, Beyotime, China). After dehydration and clearing, the sections were mounted with neutral resin and examined under a microscope (MoticAE 2000, MOTIC, China). Both antibodies for this experiment were acquired from Cell Signaling Technology, Inc. (CST, Danvers, MA, USA).
Approval for establishing the subcutaneous graft tumor model was granted by the
Experimental Animal Welfare Ethics Committee of the First Affiliated Hospital of
Harbin Medical University (IACUC NO. 2023068). 4–5-week-old male BALB/c nude
mice (16–18 g) used in this experiment were supplied by Beijing Vital River
Laboratory Animal Technology Co. Ltd. (China). These experimental mice were kept
in pairs under standardized housing conditions and provided with autoclaved food
and sterile water. The animal facility maintained controlled environmental
parameters: temperature of 22
Human GC cell lines (MKN28, HGC27, and AGS) and the human gastric mucosal epithelial cell line GES-1 were supplied by Wuhan Procell Life Sciences Co., Ltd. (China). All these cell lines underwent STR profiling for authentication and were tested negative for mycoplasma. They were cultured in DMEM (C11995500BT, Thermo Fisher Scientific, Waltham, MA, USA) containing 10% fetal bovine serum (NFBS-2500A, Noverse, USA), 100 U/mL penicillin (ST488-1, Beyotime, China), and 100 µg/mL streptomycin (ST488-2, Beyotime, China), and maintained at 37 °C in an incubator with 5% CO2.
96-well plates were seeded with logarithmically growing HGC27 cells (5000 cells/well) and AGS cells (3000 cells/per well) in 100 µL of culture medium. After 24, 48, or 72 h of incubation, 10 µL of CCK-8 solution (CK04, Solarbio, China) was added to each well, and the plates were further incubated at 37 °C for 2 h. MK-3 Microplate Reader (Thermo Fisher Scientific, USA) was employed to detect absorbance at 450 nm.
Lentivirus expressing sh-CHST1 or shRNA (negative control), along with CHST1 overexpression plasmid (OE-CHST1) or the corresponding empty plasmid (OE-NC), was obtained from OBiO Technology (Shanghai) Corp., Ltd. (China). Lentivirus transfection was performed to achieve CHST1 knockdown in AGS and HGC27 cells. Accordingly, AGS and HGC27 cells were categorized into two groups: a negative control group (AGS+shRNA and HGC27+shRNA); and a CHST1 intervention group (AGS+sh-CHST1, HGC27+sh-CHST1). CHST1 was overexpressed in AGS cells using Lipofectamine™ 3000 transfection reagent (L3000015, Thermo Fisher Scientific, USA) with OE-CHST1. AGS cells were subsequently allocated into the following experimental groups: Control, SB203580, and SB203580+OE-CHST1. Both AGS cells and CHST1-overexpressing AGS cells were treated with 20 µmol/L SB203580 (a p38 MAPK inhibitor, HY-10256, MedChemExpress, USA).
The extracted total proteins from tissue or cell lysates in each group were quantified using a BCA assay kit (P0011, Beyotime, China). The collected protein samples were separated by electrophoresis using SDS-PAGE gels (12%) (P1200-25T, Solarbio, China) and next transferred onto polyvinylidene fluoride membranes (ISEQ00010, Millipore, Burlington, MA, USA). After being blocked in 5% skim milk, the membranes were subjected to an overnight incubation with primary antibodies (Table 1) at 4 °C, and subsequently with 1 h of incubation with the corresponding secondary antibody at room temperature. Target proteins were then detected using the chemiluminescent detection substrate (WBULS0500, Millipore, USA).
| Antibody | Dilution | Catalog number | Brand |
| GAPDH | 1:1000 | 2118 | CST |
| CHST1 | 1:800 | 44627 | CST |
| E-cadherin | 1:800 | 3195 | CST |
| N-cadherin | 1:800 | 13116 | CST |
| vimentin | 1:800 | 5741 | CST |
| snail | 1:800 | 3879 | CST |
| p38 MAPK | 1:1000 | 2410 | CST |
| Phospho (p)-p38 MAPK | 1:1000 | 4511 | CST |
| ERK | 1:1000 | 4695 | CST |
| p-ERK | 1:1000 | 9101 | CST |
GC cells of each strain (MKN28, HGC27, and AGS) and human gastric mucosal epithelial cells (GES-1) were inoculated onto anti-degradation slides. Cells were treated with 4% paraformaldehyde (BL539A, Biosharp, Hefei, Anhui, China) for fixation, followed by permeabilization with Triton X-100 (BS084-100 mL, Biosharp, China). After being blocked with 10% goat serum, the cells underwent an overnight incubation with primary antibodies against CHST1 (1:200, CST, USA), E-cadherin (1:200, CST, USA), vimentin (1:100, CST, USA), N-cadherin (1:400, CST, USA), and snail (1:200, CST, USA) at 4 °C, and then 1 h of incubation with fluorescently coupled secondary antibodies (4412, 1:1000, Alexa Fluor® 488, CST, USA) at room temperature. Subsequently, the cell nuclei were stained with DAPI (D9542, Millipore, USA) and photographed using a fluorescence microscope (Axio Observer. A1, Zeiss, Germany).
RNA of the control and CHST1-intervention groups were extracted using Trizol
solution (15596026, Thermo Fisher Scientific, USA) and then reverse-transcribed
into cDNA (RR037Q, Takara, China). qPCR (CN830S, Takara, China) was performed,
with PCR reaction conditions as follows: 95 °C for 10 min, followed by 40 cycles
of 95 °C for 30 s, 60 °C for 30 s, and 72 °C for 1 min. The
2-ΔΔCt method was applied for calculating the relative
level of CHST1 expression. The primer sequences were as follows: CHST1-F:
GGTGGGTCTGGGTCTAGGAT; CHST1-R: GGGAGGAAGCACAGCAGATT;
During the logarithmic growth phase, AGS and HGC27 cells were inoculated in
6-well plates (1
Cells were seeded into 6-well plates and grown to approximately 90% confluence. A scratch perpendicular to the labeled line was created using a 100 µL sterile pipette. Images of the scratch were captured at the same observation point. The width of the scratch was measured at 0 and 24 h, followed by calculation of the wound healing rate.
Flow cytometry (FACS Calibur, BD, USA) was used to quantify apoptosis. After resuspension in 300 µL of binding buffer, cells were treated with Annexin V-FITC (5 µL) and incubated for 10 min. Subsequently, propidium iodide (5 µL) staining was performed for 5 min in the dark, and FlowJo V10 software (BD Biosciences, Ashland, OR, USA) was applied to analyze apoptosis.
R software was employed for performing bioinformatics analysis. No
pre-established exclusion criteria were defined for animals or data points in
this experiment. All analyses were performed using the original complete dataset.
For statistical purposes, each group included three independent cell data or the
data of six mice. During the experimental procedures, the first author was aware
of the group allocations. The data were subjected to statistical analysis using
SPSS 22.0 (IBM Corp., Armonk, NY, USA). The data were reported as mean
Comparative analysis between tumor and normal samples revealed 4765 DEGs in total. Among these DEGs, there were 2542 up-regulated and 2223 down-regulated genes (Fig. 1A). Heatmap showing the top 20 up- and down-regulated genes is presented in Fig. 1B. Functional enrichment analyses were subsequently conducted on these identified DEGs. GO enrichment analysis revealed that, the DEGs were mainly enriched in ECM and extracellular structure organization (BP category); collagen-containing ECM (CC category); and receptor ligand activity and signaling receptor activator activity (MF category) (Fig. 1C). KEGG pathway analysis indicated enrichment of these DEGs in the neuroactive ligand-receptor interaction (Fig. 1D).
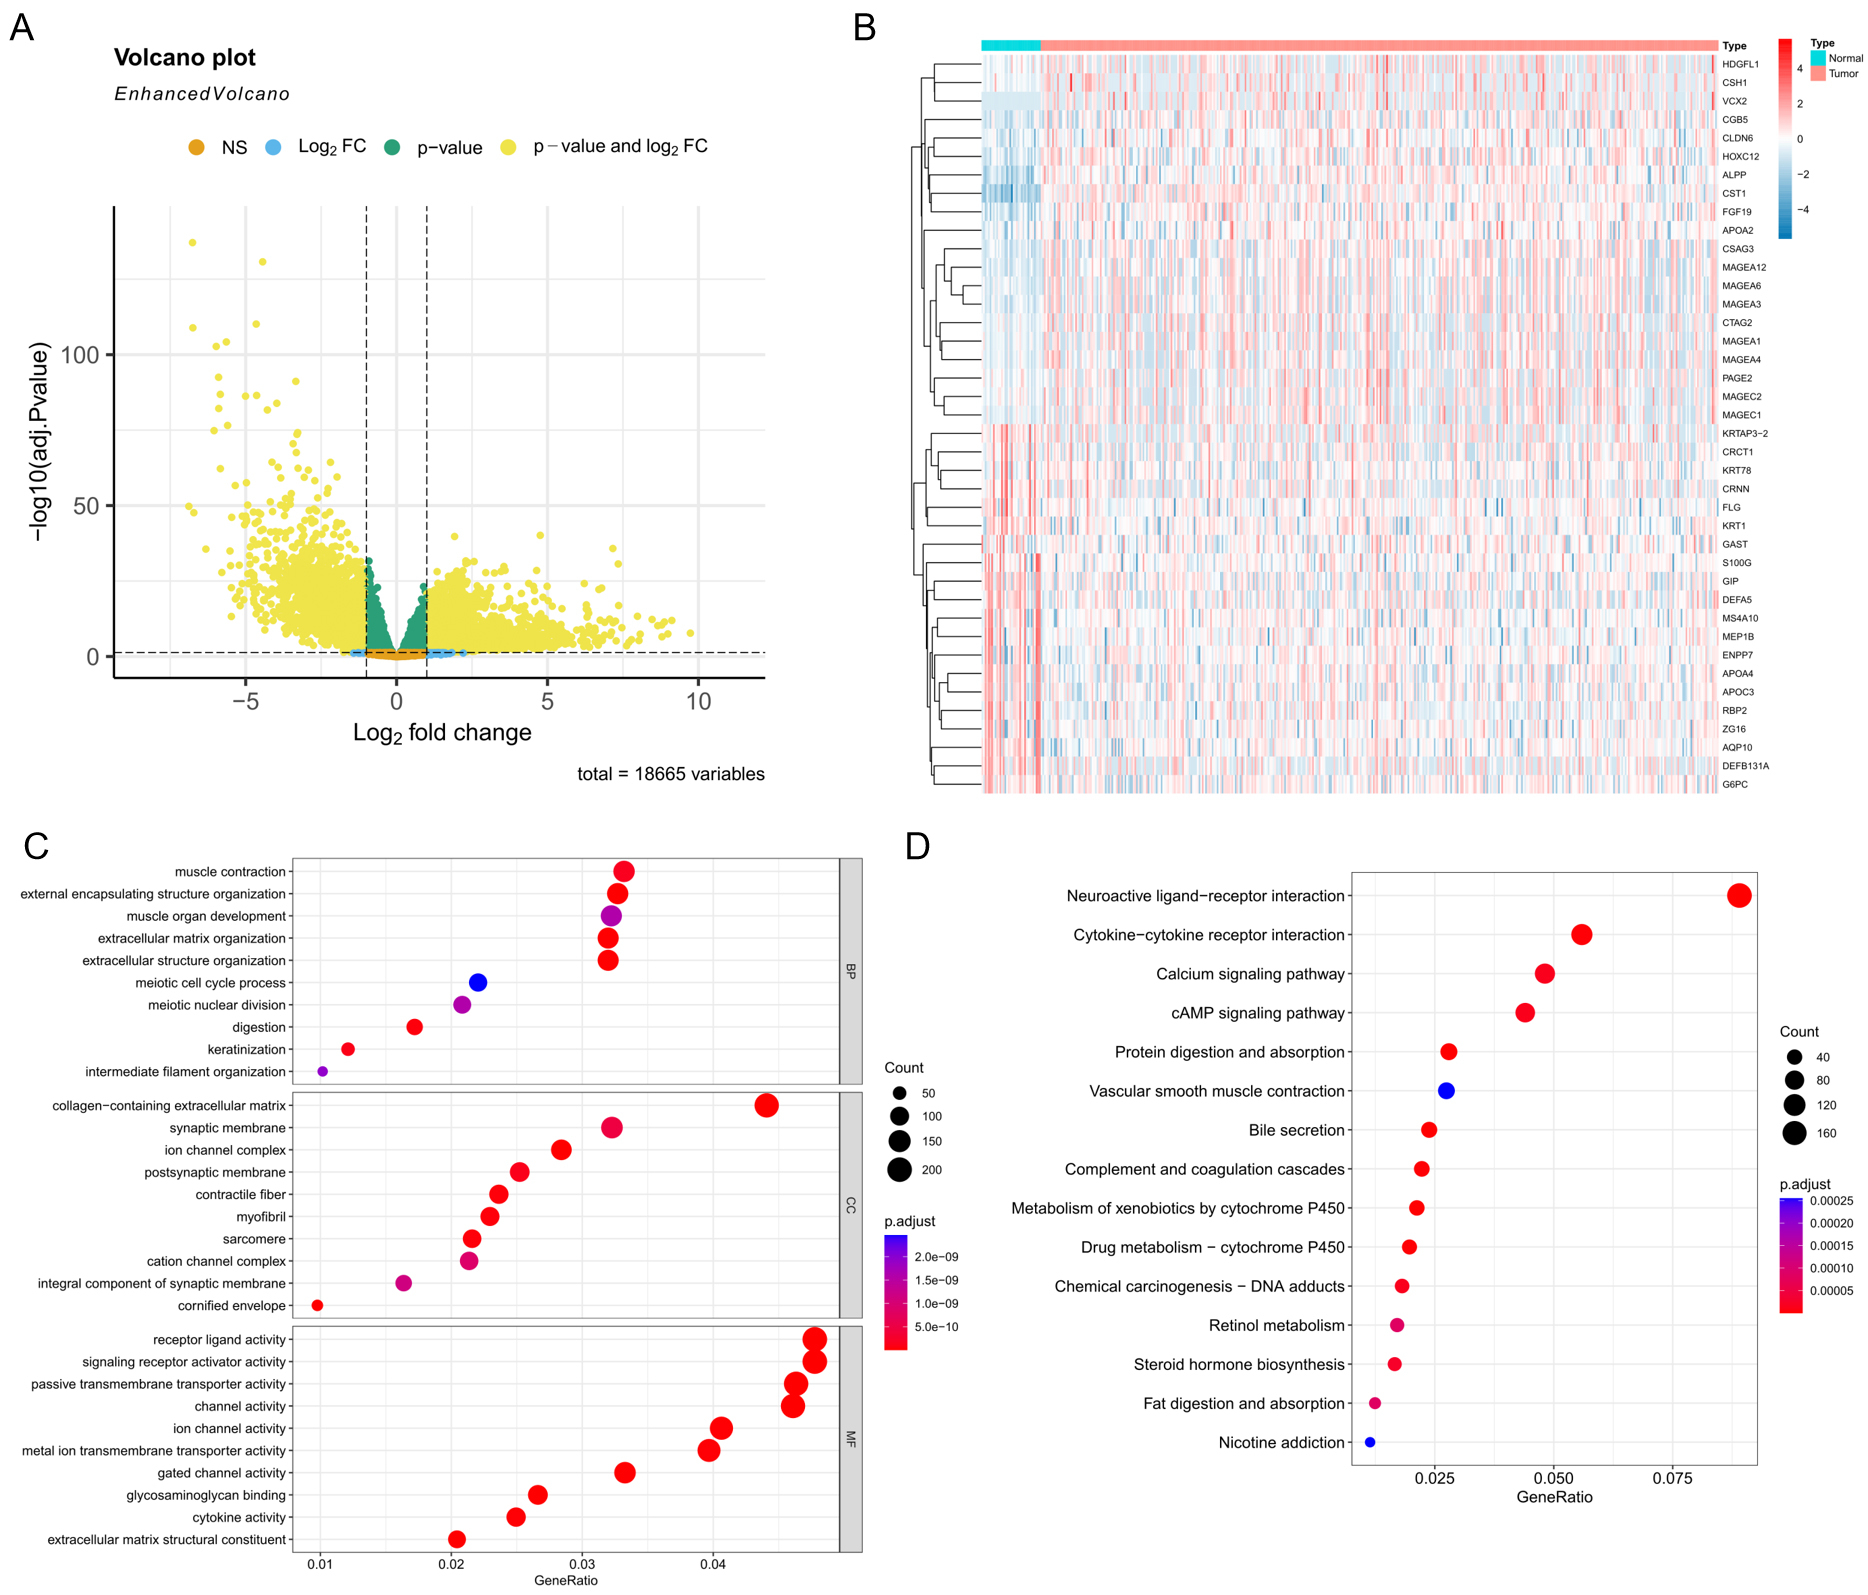 Fig. 1.
Screening and enrichment analysis of DEGs in GC. (A) Volcano plot of DEGs. (B) Heatmap of the top 20 up- and down-regulated DEGs. (C) GO enrichment analysis of DEGs. (D) KEGG pathway enrichment analysis of DEGs. DEGs, Differentially Expressed Genes; GC, gastric cancer; GO, Gene Ontology; KEGG, Kyoto Encyclopedia of Genes and Genomes.
The EMT score was calculated for all samples, revealing a marked elevation in
tumor group relative to normal group (p
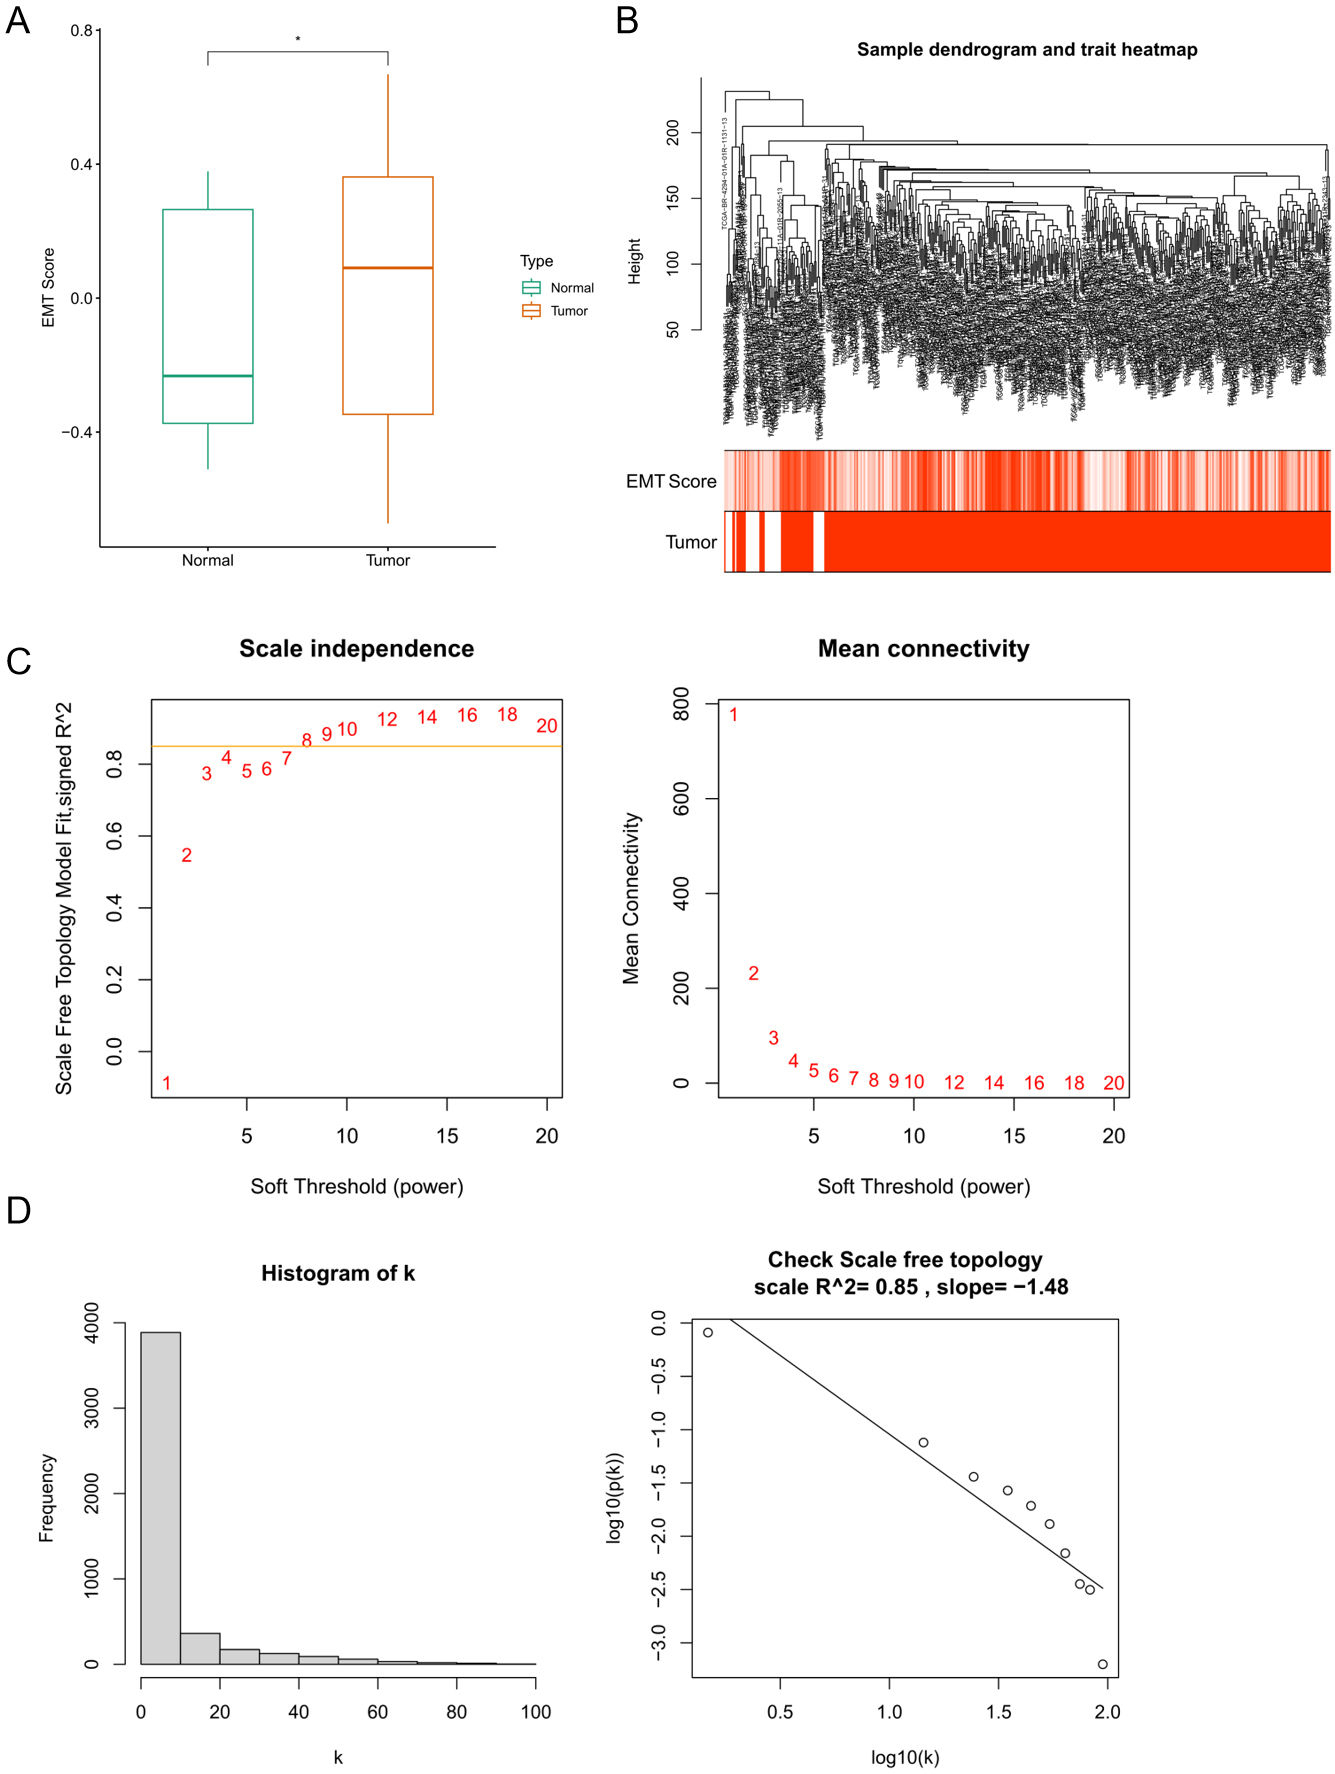 Fig. 2.
EMT score and WGCNA. (A) Comparison of EMT scores between tumor
and normal tissues. (B–D) WGCNA of DEGs in GC. *p
A weighted gene co-expression network (Fig. 3A) was constructed, and the
transcriptome overview map plots (Fig. 3B) and correlation heatmaps between
modules (Fig. 3C) were generated. Subsequently, correlation analysis between
sample characteristics (EMT score, tumor) and the modules was performed (Fig. 3D). The results showed that, among all modules, the green module (cor = 0.8,
p
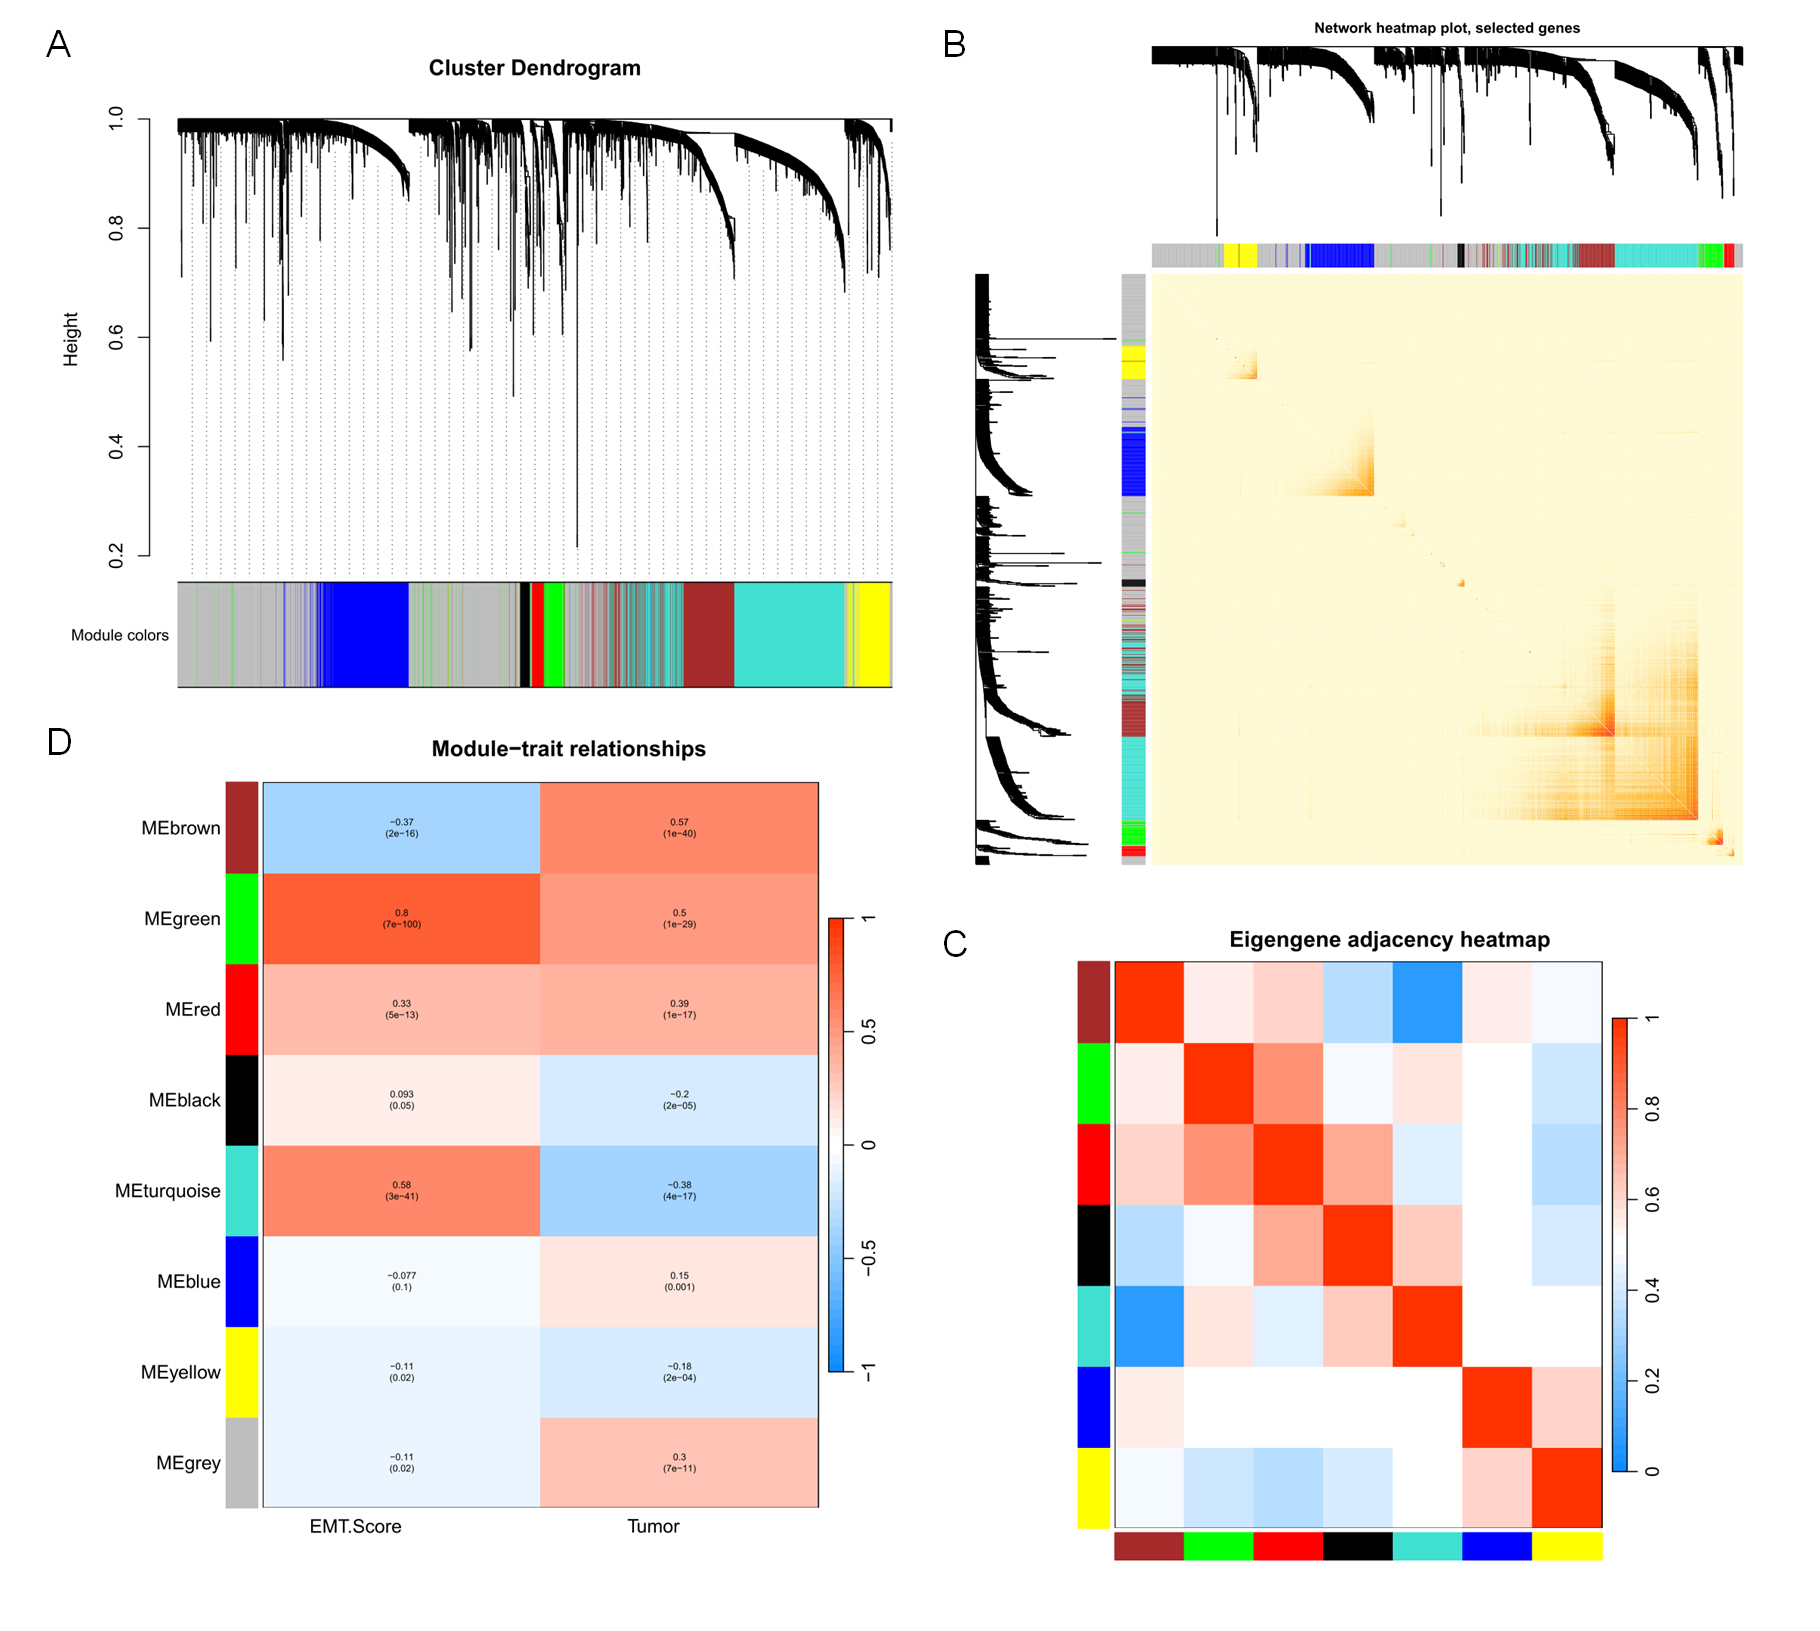 Fig. 3.
Screening of EMT-related modules. (A–C) Weighted gene co-expression network and heatmap of correlation between modules. (D) Correlation analysis of each module with EMT score and tumor.
GS vs. MM analysis (Fig. 4A) was performed on the key module, and 50
key module genes were obtained by filtering with thresholds of GS
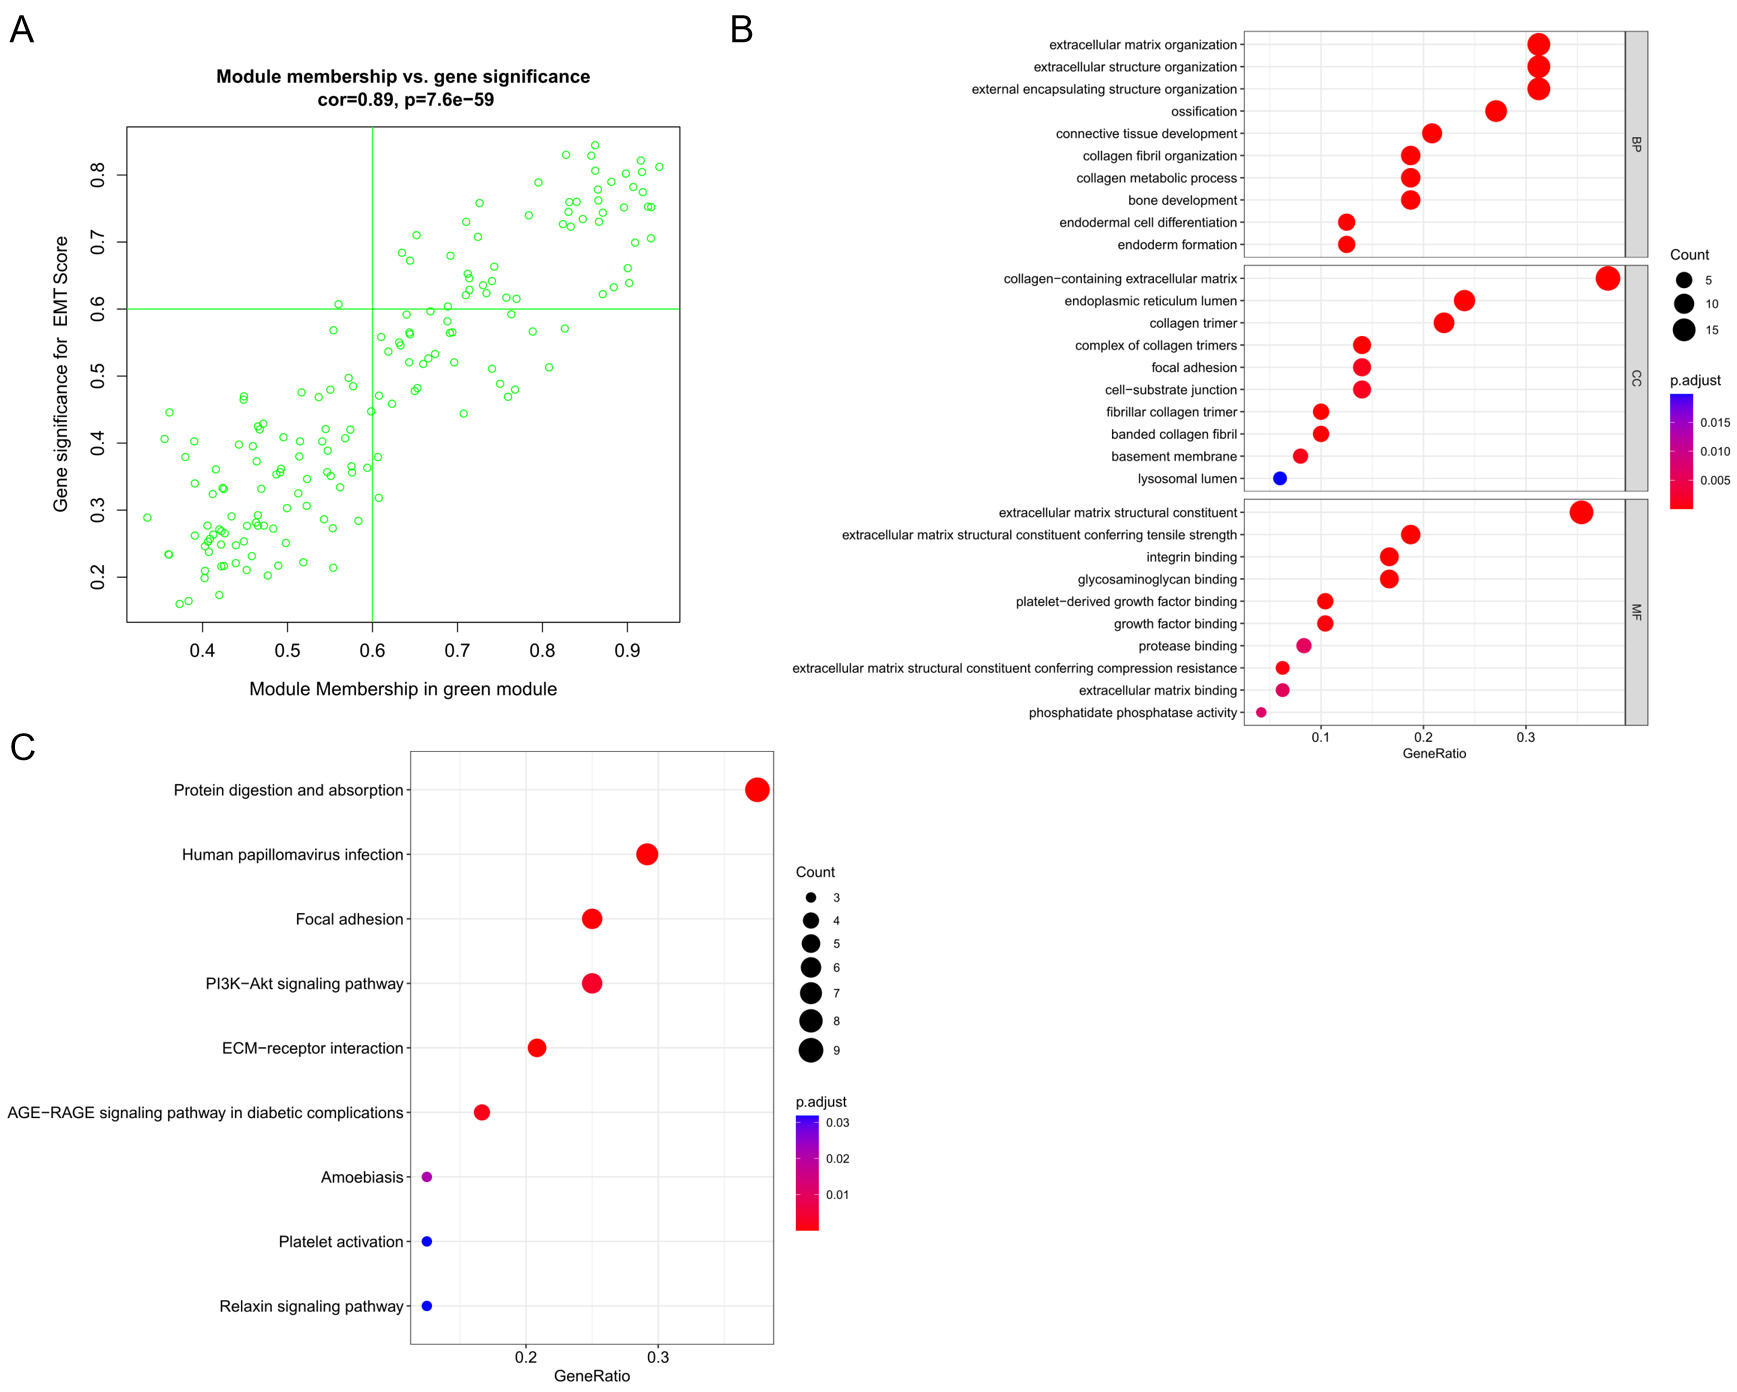 Fig. 4.
Screening of EMT-related genes and functional enrichment analysis. (A) Screening of EMT-related genes. (B) GO enrichment analysis of EMT-related genes. (C) KEGG pathway enrichment analysis of EMT-related genes.
Survival analysis of the 50 EMT-related genes (Fig. 5) revealed seven genes significantly associated with survival: CHST1, GPR176, OLFML2B, P4HA3, PDGFRB, SPARC, and VCAN, which were defined as hub genes. Among these, CHST1 demonstrates high expression in GC tissues; nevertheless, the underlying mechanism remains unclear. As such, CHST1 was selected for subsequent analysis in this study.
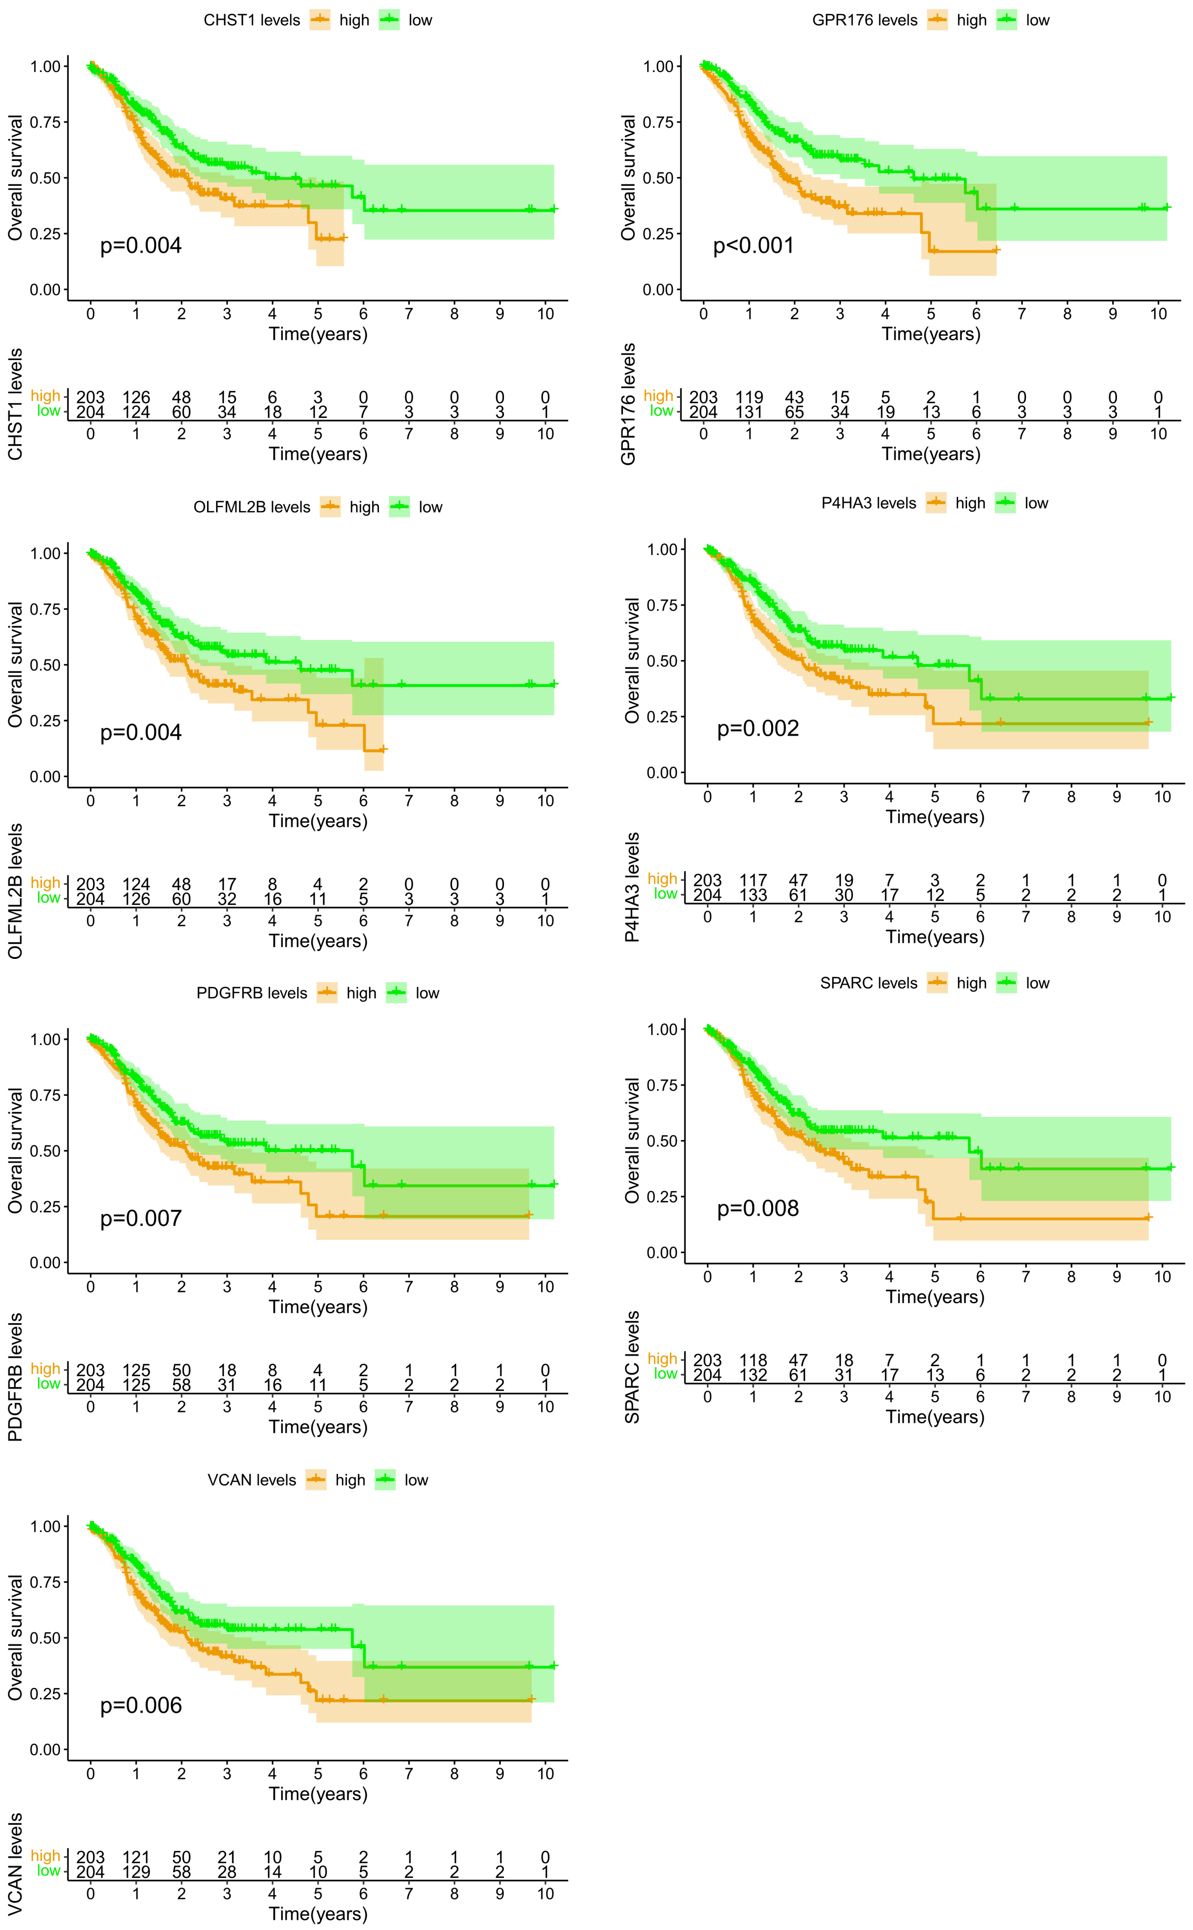 Fig. 5.
Prognostic analysis of EMT-related genes. CHST1, carbohydrate sulfotransferase 1; GPR176, G protein-coupled receptor 176; OLFML2B, olfactomedin-like 2B; P4HA3, prolyl 4-hydroxylase subunit alpha 3; PDGFRB, platelet-derived growth factor receptor beta; SPARC, secreted protein acidic and cysteine rich; VCAN, versican.
Significant expression of CHST1 was found in the tumor group in comparison to
the normal group (p
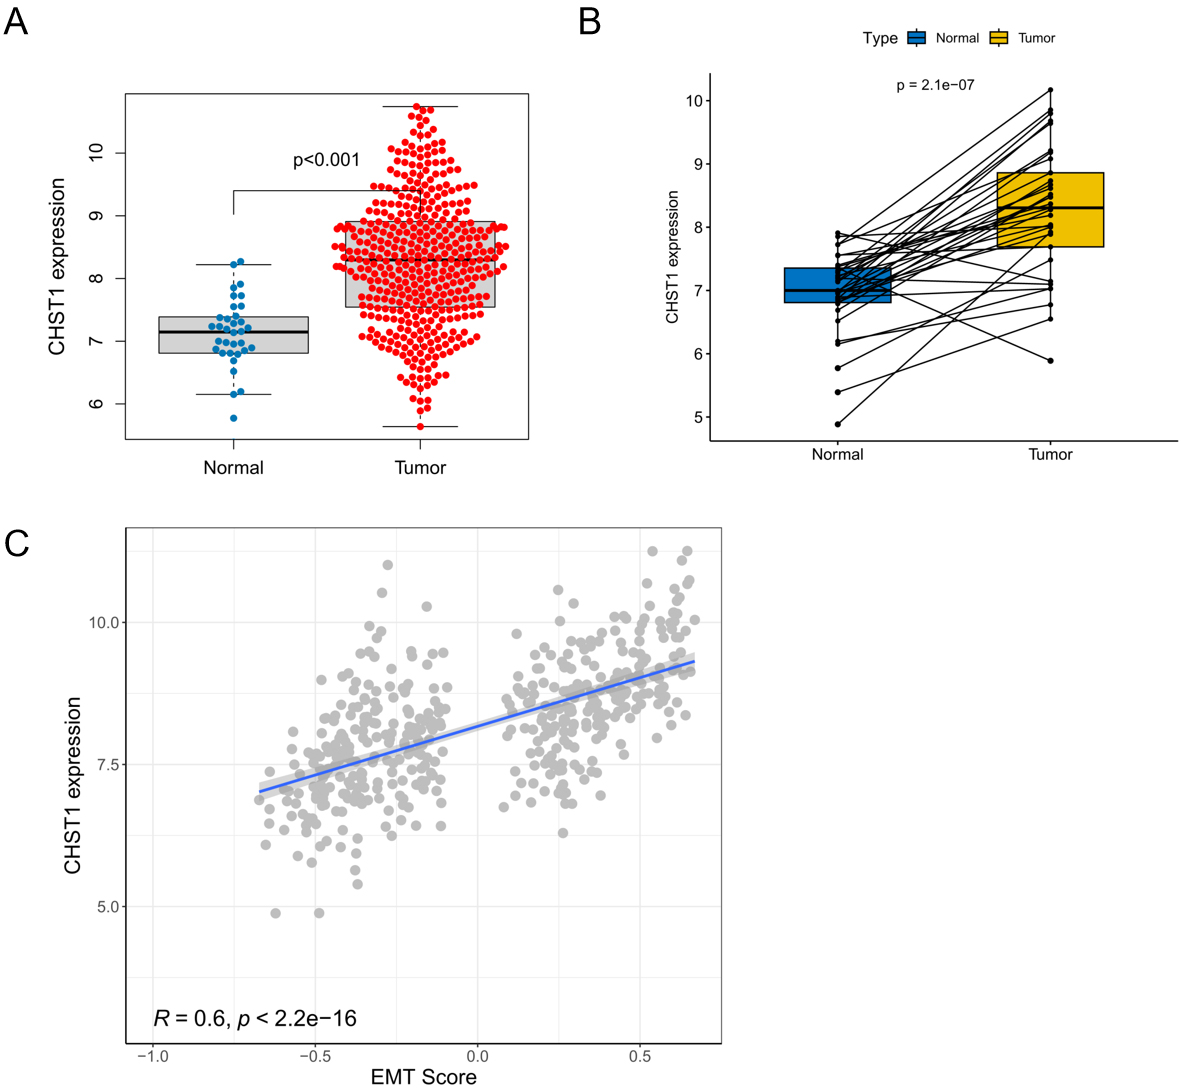 Fig. 6.
Correlation analysis between CHST1 and EMT score. (A,B) Comparison of CHST1 expression between the tumor and normal groups. (C) Correlation analysis of CHST1 expression with EMT Score. CHST1, carbohydrate sulfotransferase 1; EMT, epithelial-mesenchymal transition.
Clinical correlation analysis demonstrated a significant correlation between
CHST1 expression and T-stage (p
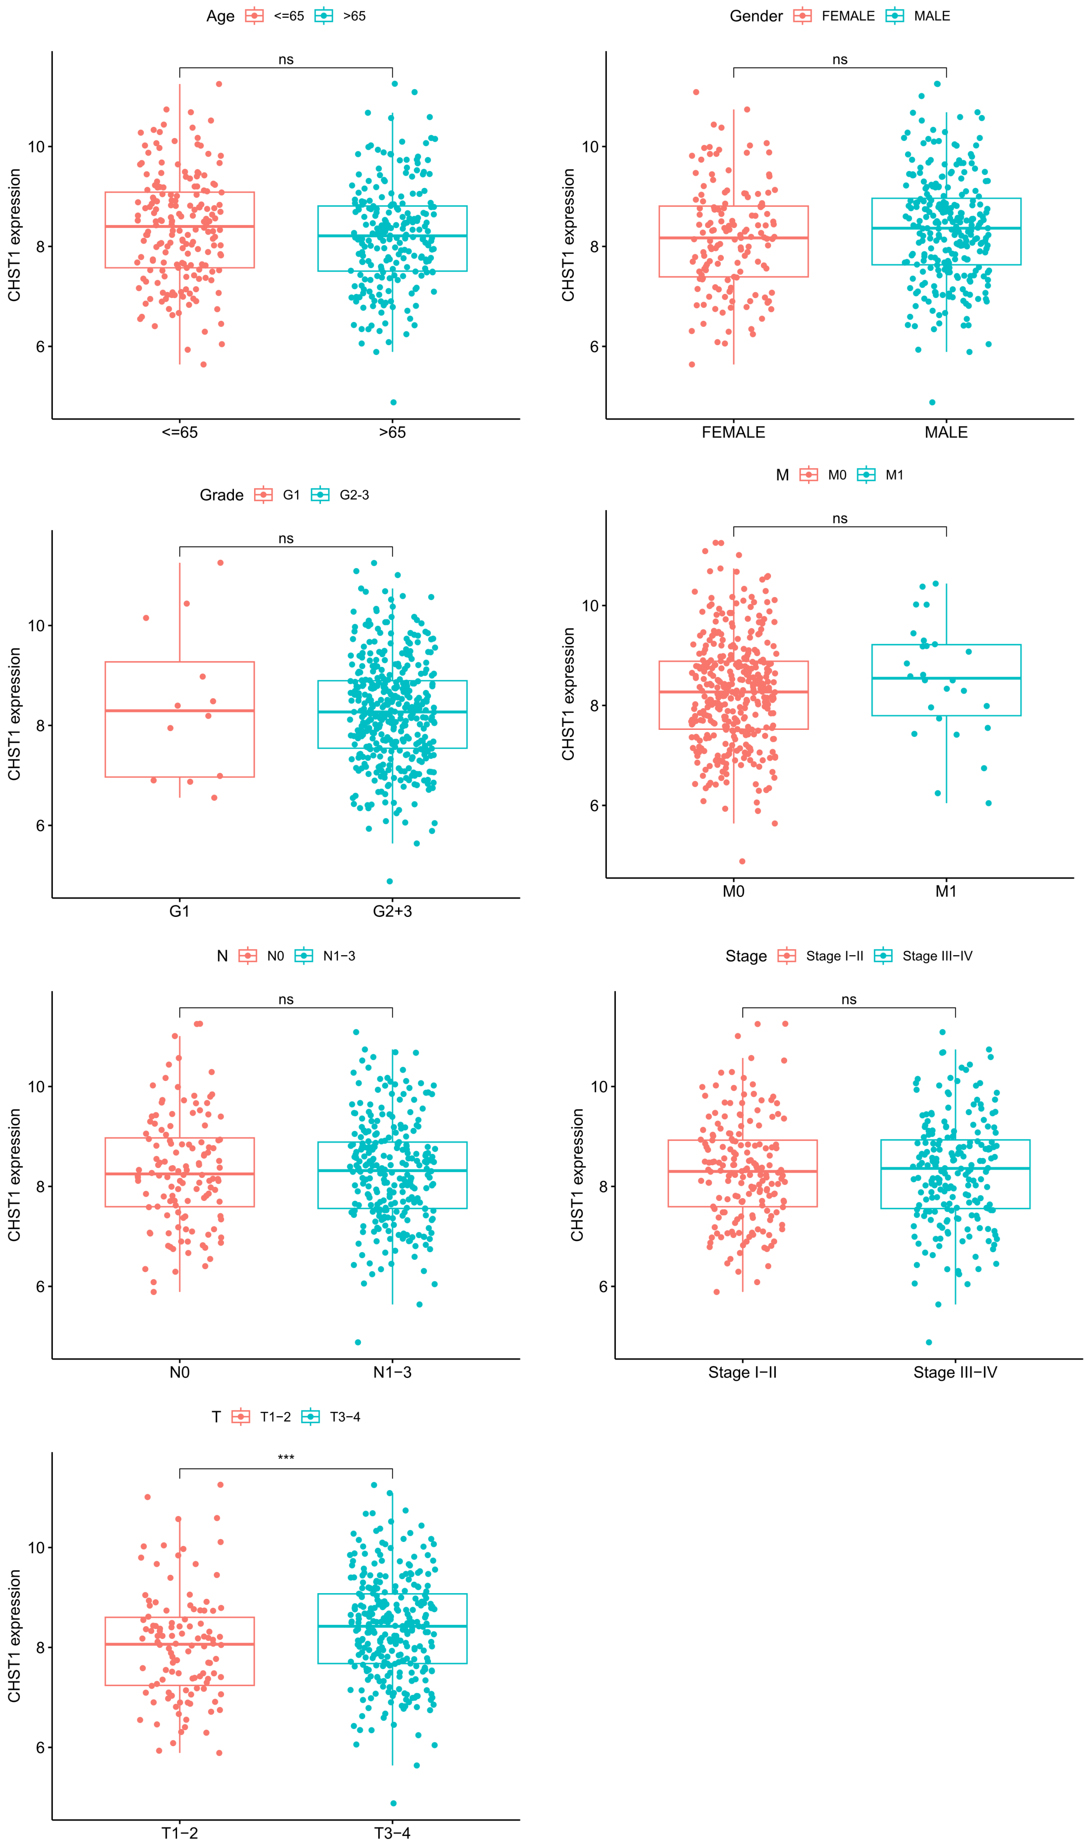 Fig. 7.
Clinical correlation analysis of CHST1. ns: p
Subsequently, the GSE84437 dataset (comprising 433 GC samples) was analyzed to
evaluate the association between CHST1 expression and clinical
characteristics/patient survival. It was revealed through analysis of clinical
features that CHST1 expression was markedly associated with T-stage but not with
age, gender, or N-stage (p
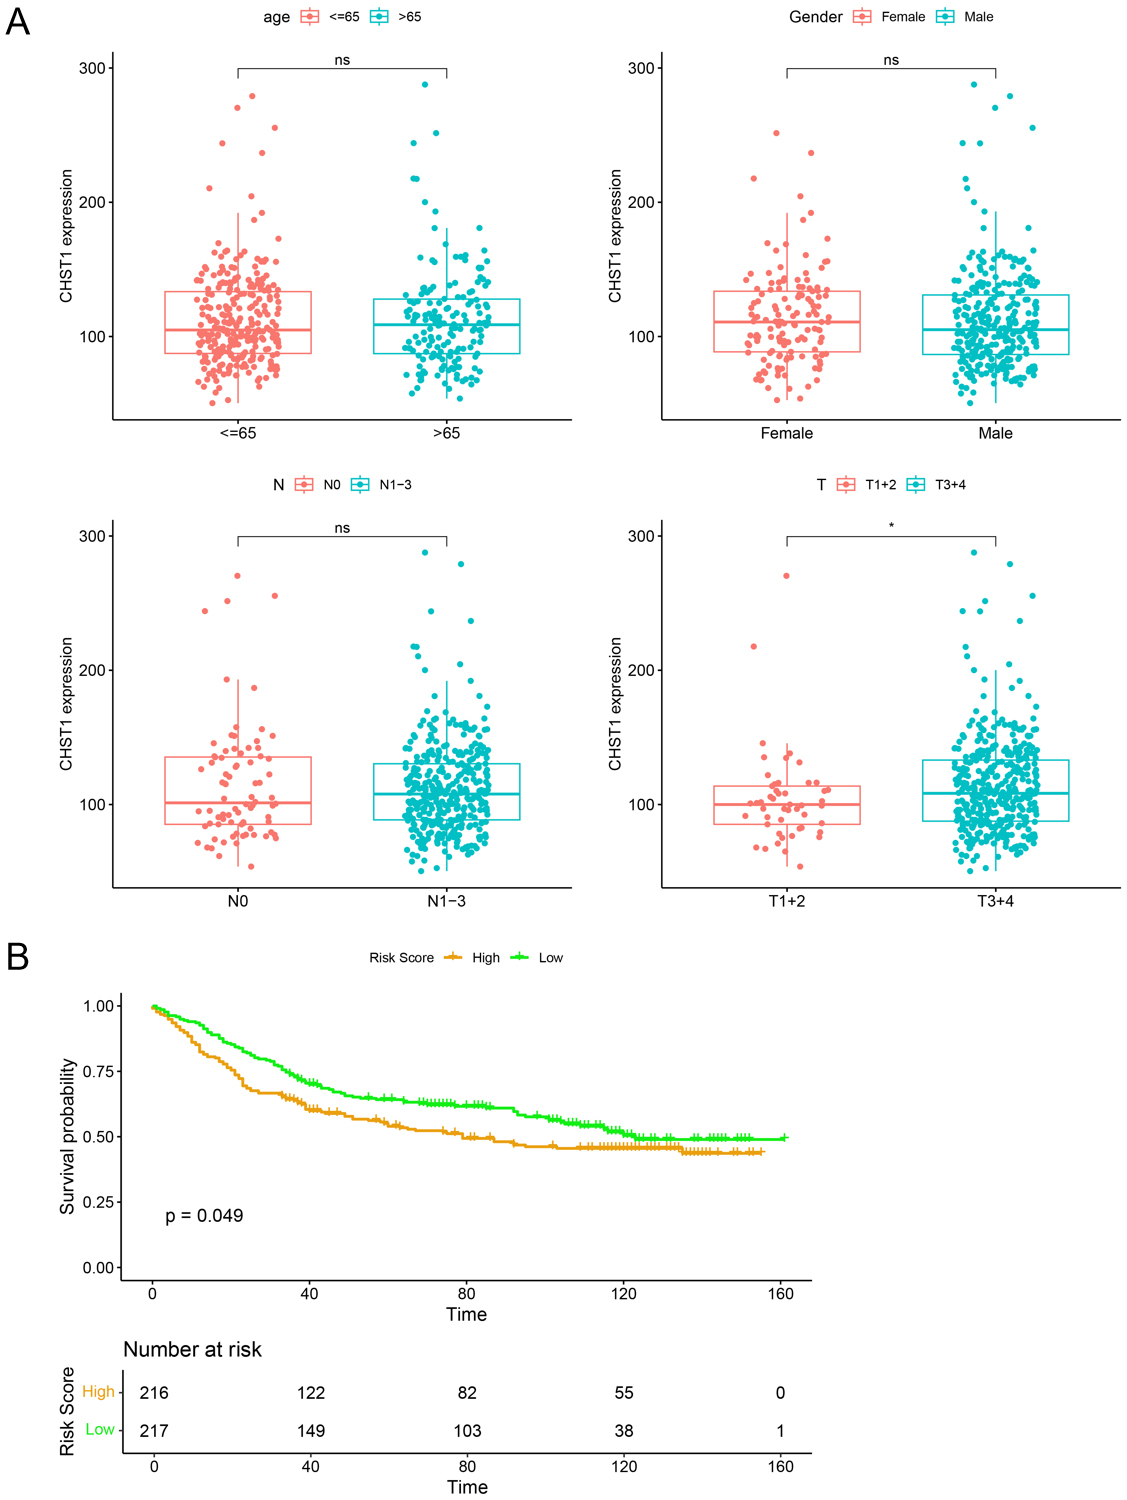 Fig. 8.
Clinical correlation analysis and survival analysis of CHST1.
(A) Correlation analysis of CHST1 expression with age, gender, N-stage, and
T-stage in GC patients. (B) Survival analysis of CHST1. ns: p
CHST1 expression in patient-derived GC tissues was validated through IHC (Fig. 9A) and Western blot analysis (Fig. 9B). It was revealed that CHST1 protein
expression was markedly increased in GC tissues versus normal tissues (p
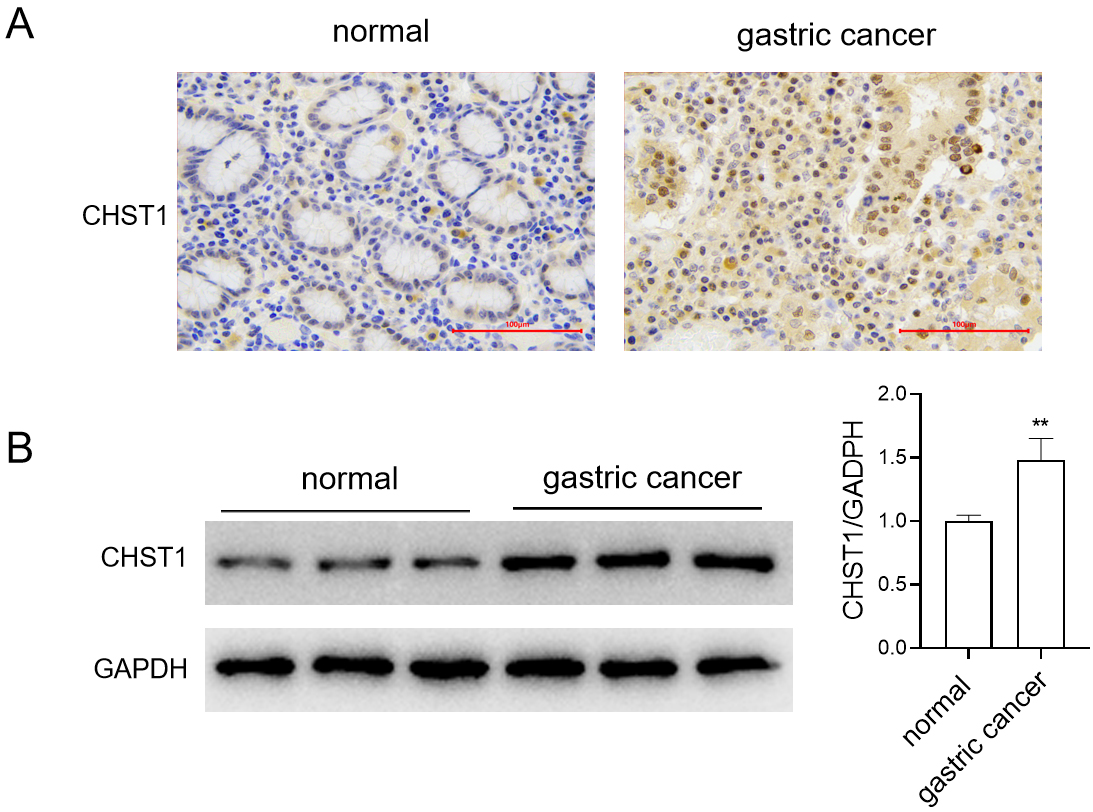 Fig. 9.
Validation of CHST1 expression. (A) IHC validation of CHST1
expression in GC tissues. Scale bar = 100 µm. (B) WB analysis of CHST1
expression in GC tissues. Values are reported as mean
We found high CHST1 expression in GC cell lines (MKN28, HGC27, and AGS) relative
to the gastric epithelial cell line GES-1 (p
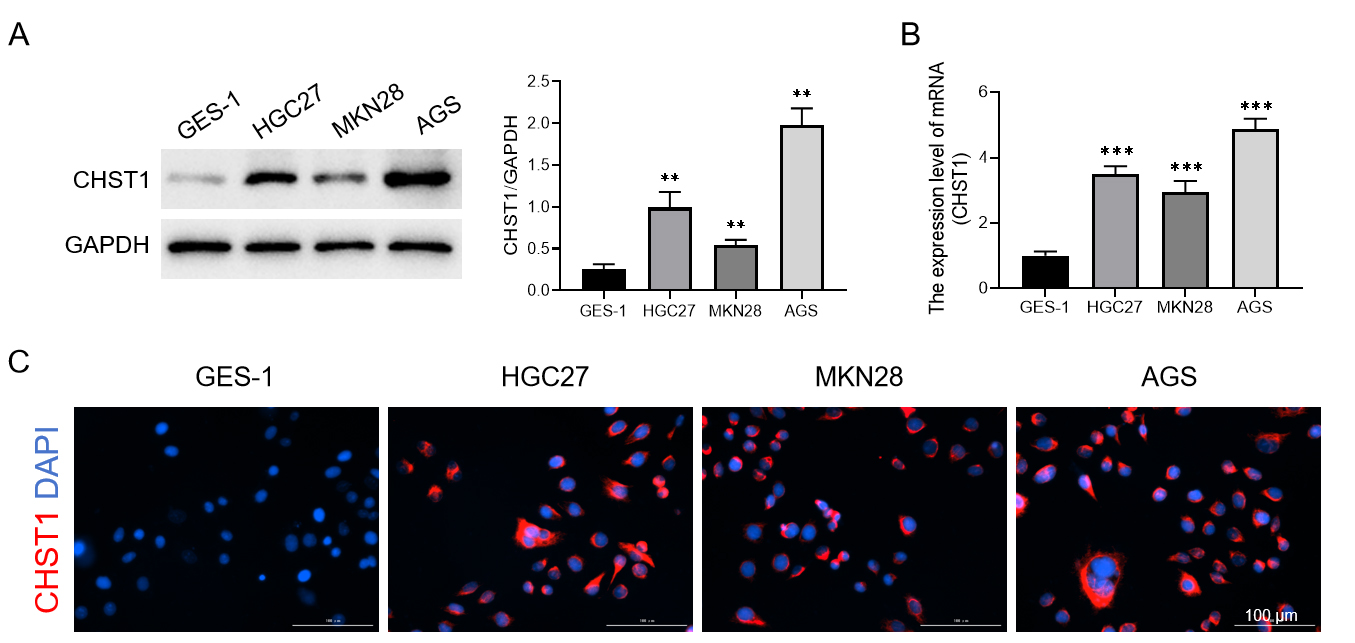 Fig. 10.
Analysis of CHST1 expression in GC cell lines. (A) WB
detection of CHST1 expression. (B) qRT-PCR detection of CHST1 expression. Values
are reported as mean
Given the highest CHST1 expression observed in AGS and HGC27 cells, these two
cell lines were selected for carrying out subsequent experiments. Our findings
showed that CHST1 protein expression was markedly lower in AGS and HGC27 cells in
the sh-CHST1 group relative to the shRNA group (p
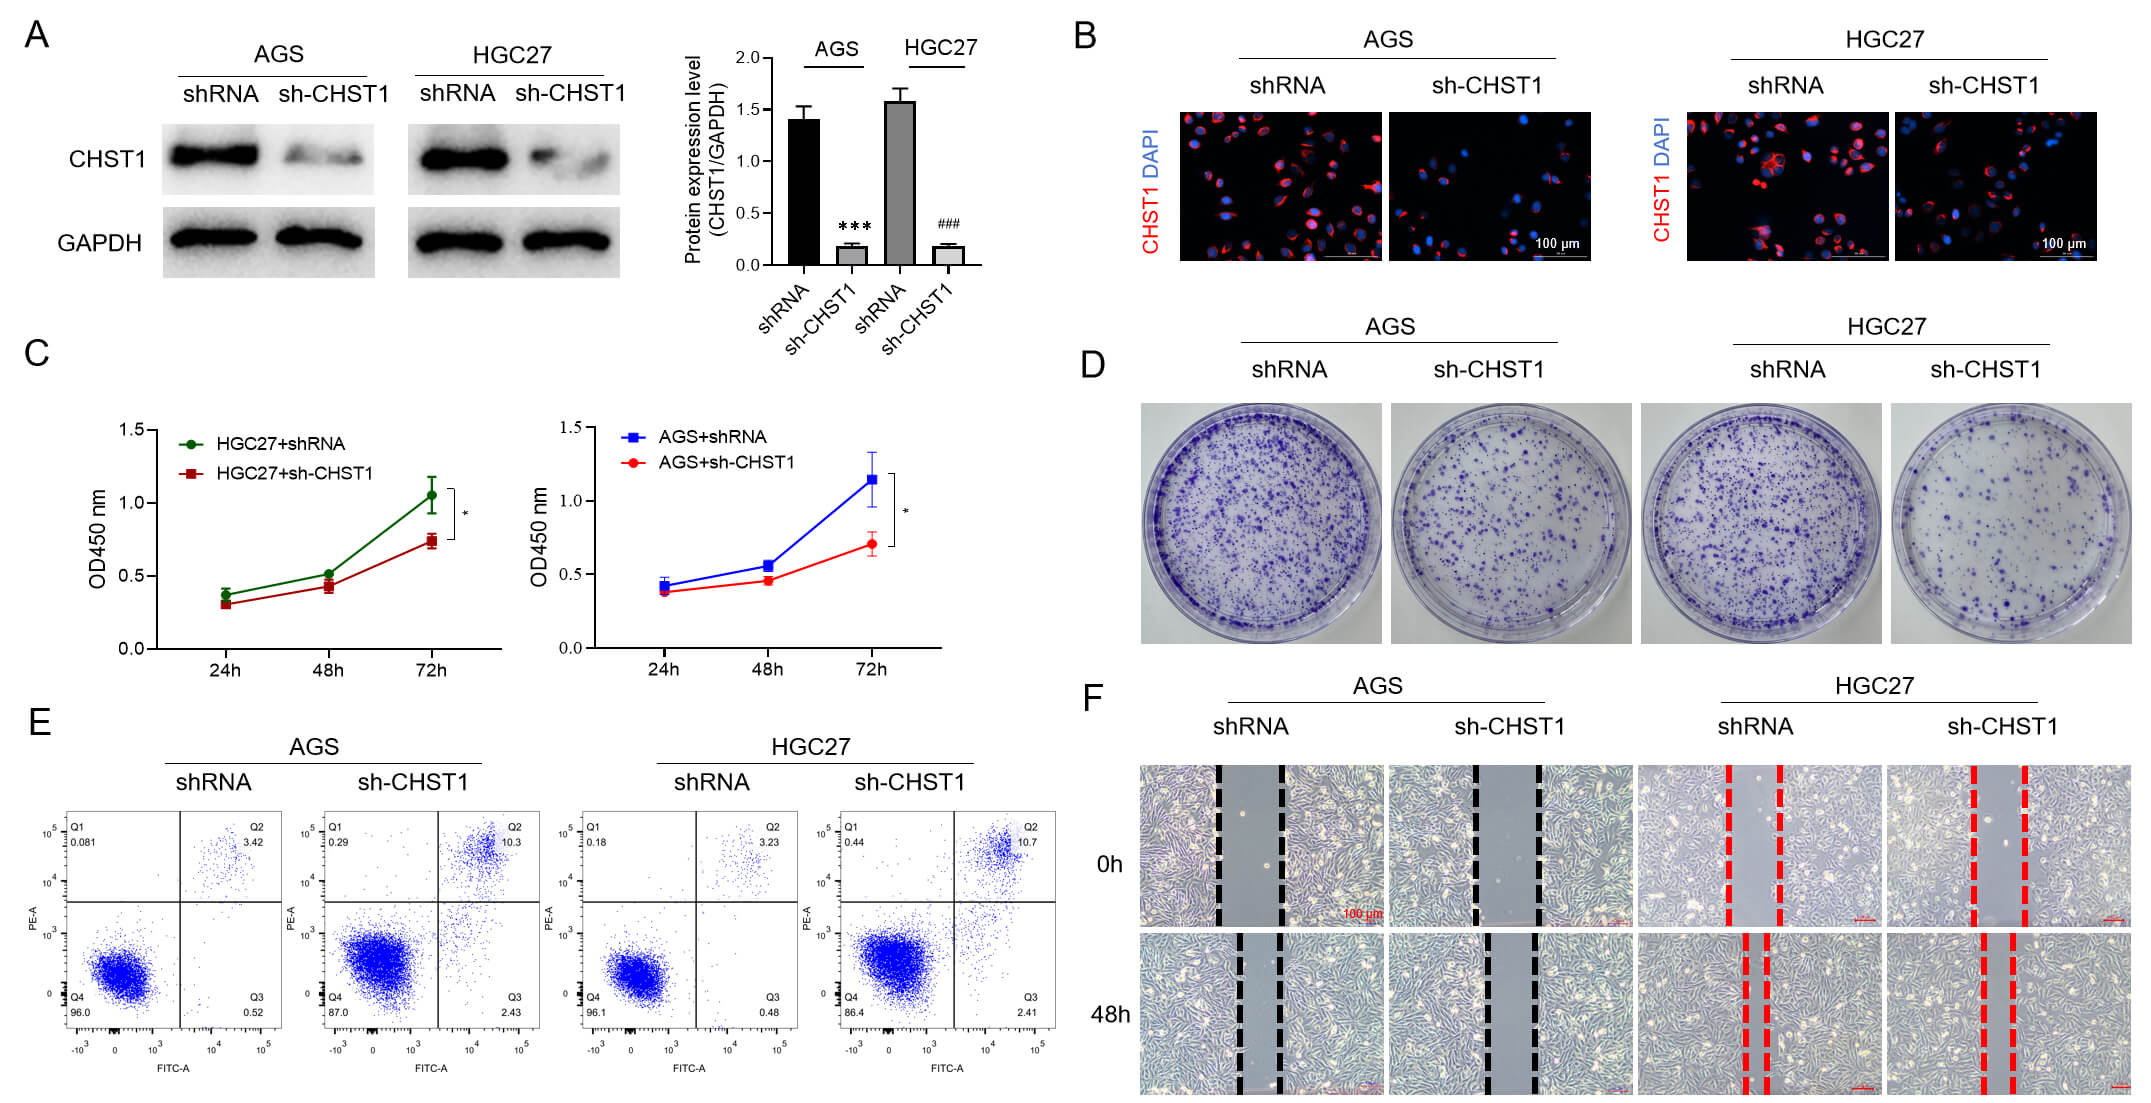 Fig. 11.
Effects of CHST1 on the biofunctionality of AGS and HGC27
cells. (A) WB analysis to determine CHST1 expression. Values are reported as the
mean
Enhanced expression of the EMT-related protein E-cadherin and attenuated
expression of N-cadherin, vimentin, and snail were found in the sh-CHST1 group
relative to the shRNA group (p
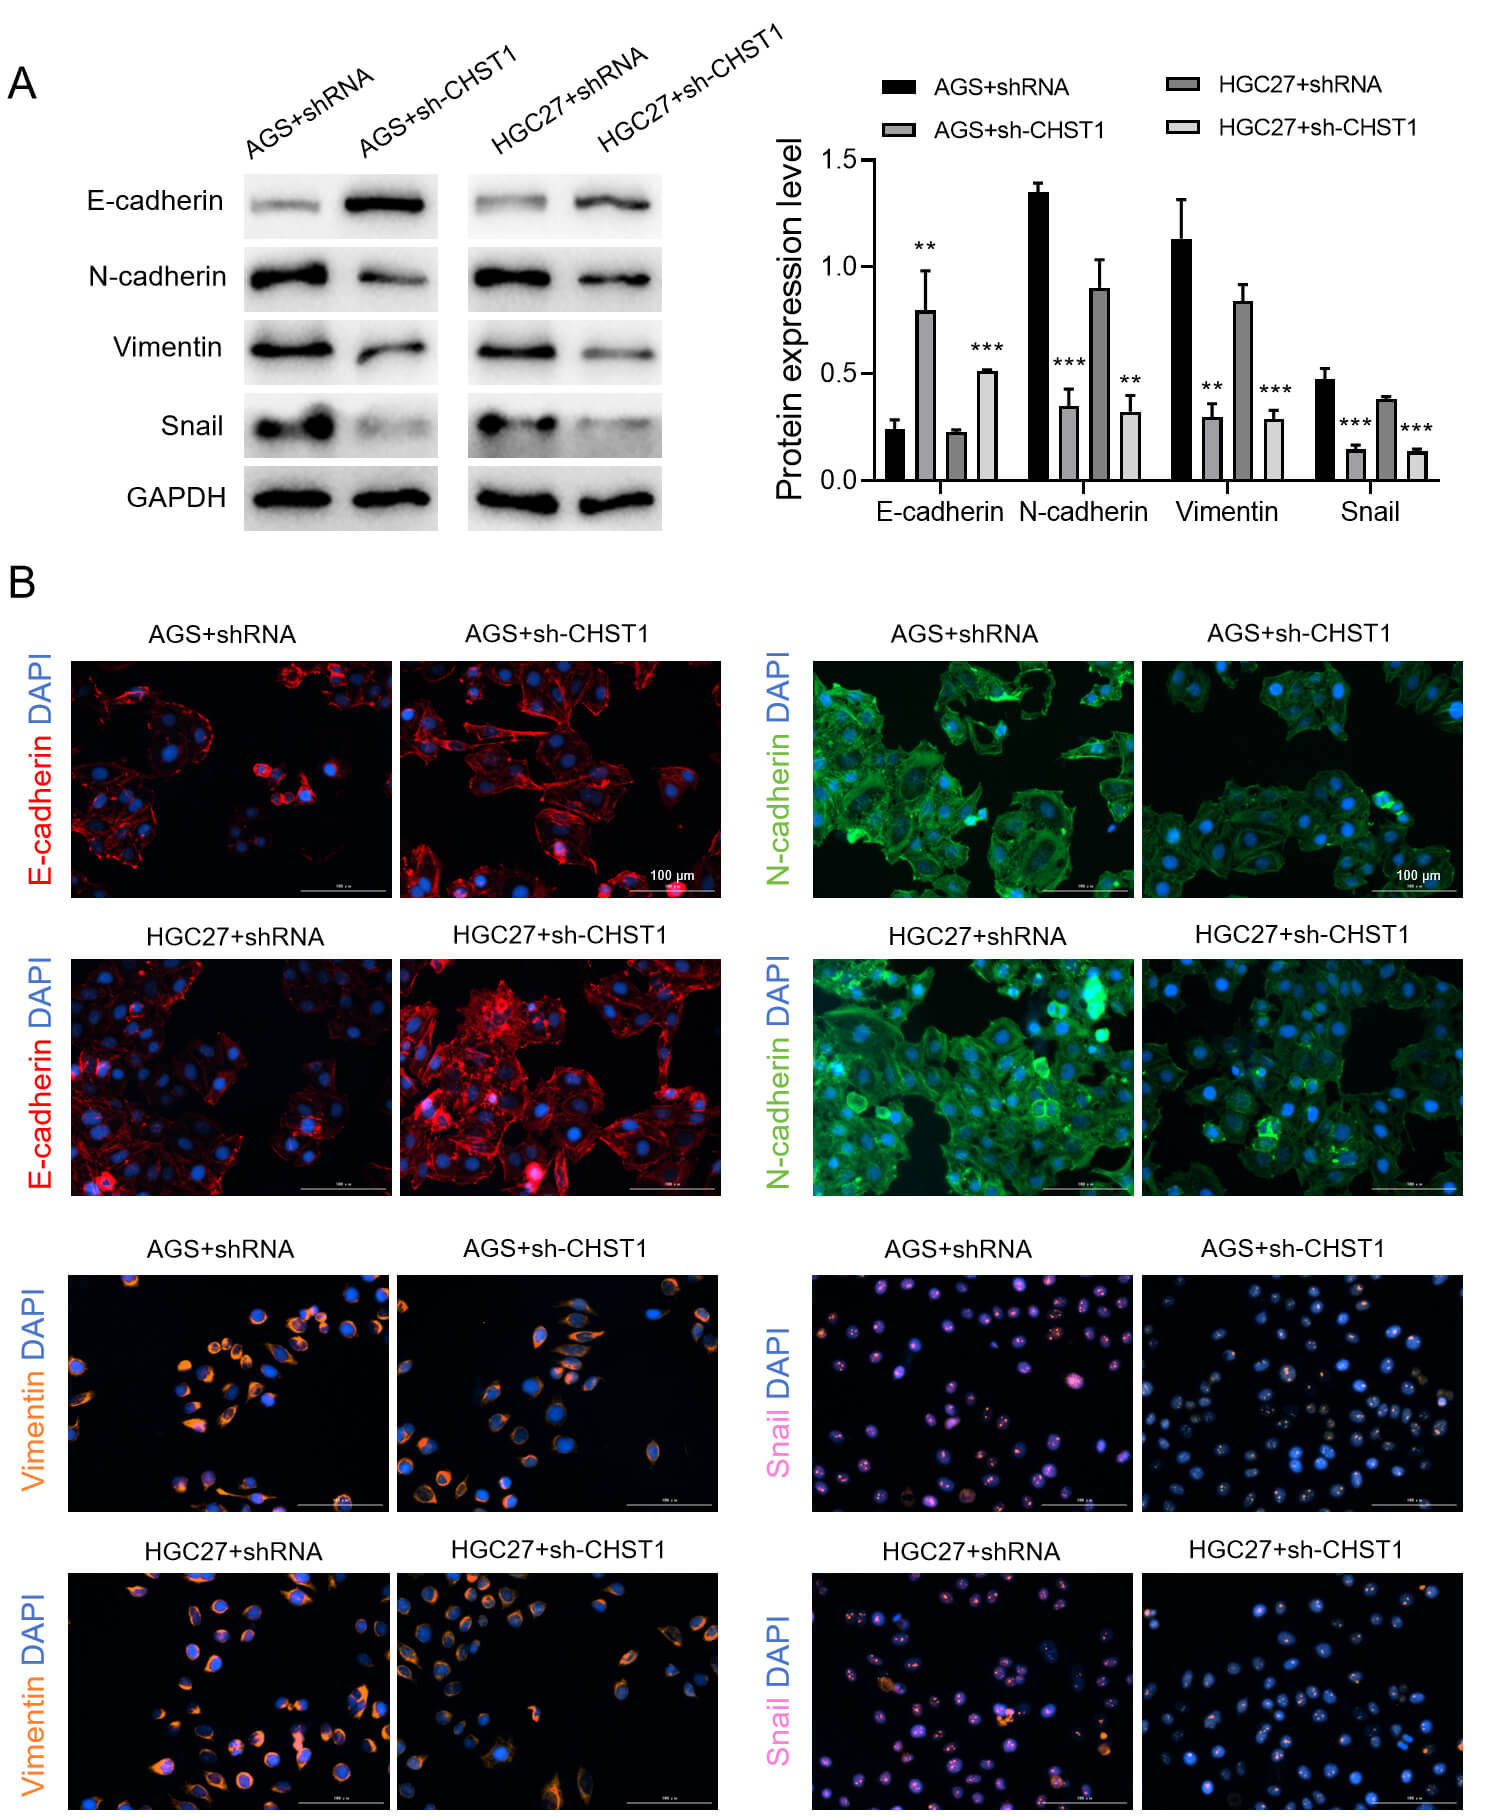 Fig. 12.
Effects of CHST1 on the EMT of AGS and HGC27 cells. (A) WB
analysis to determine the expression levels of EMT-related proteins. Values are
reported as mean
Low expression of CHST1 suppressed the phosphorylation of p38 MAPK and ERK
proteins in AGS cells (p
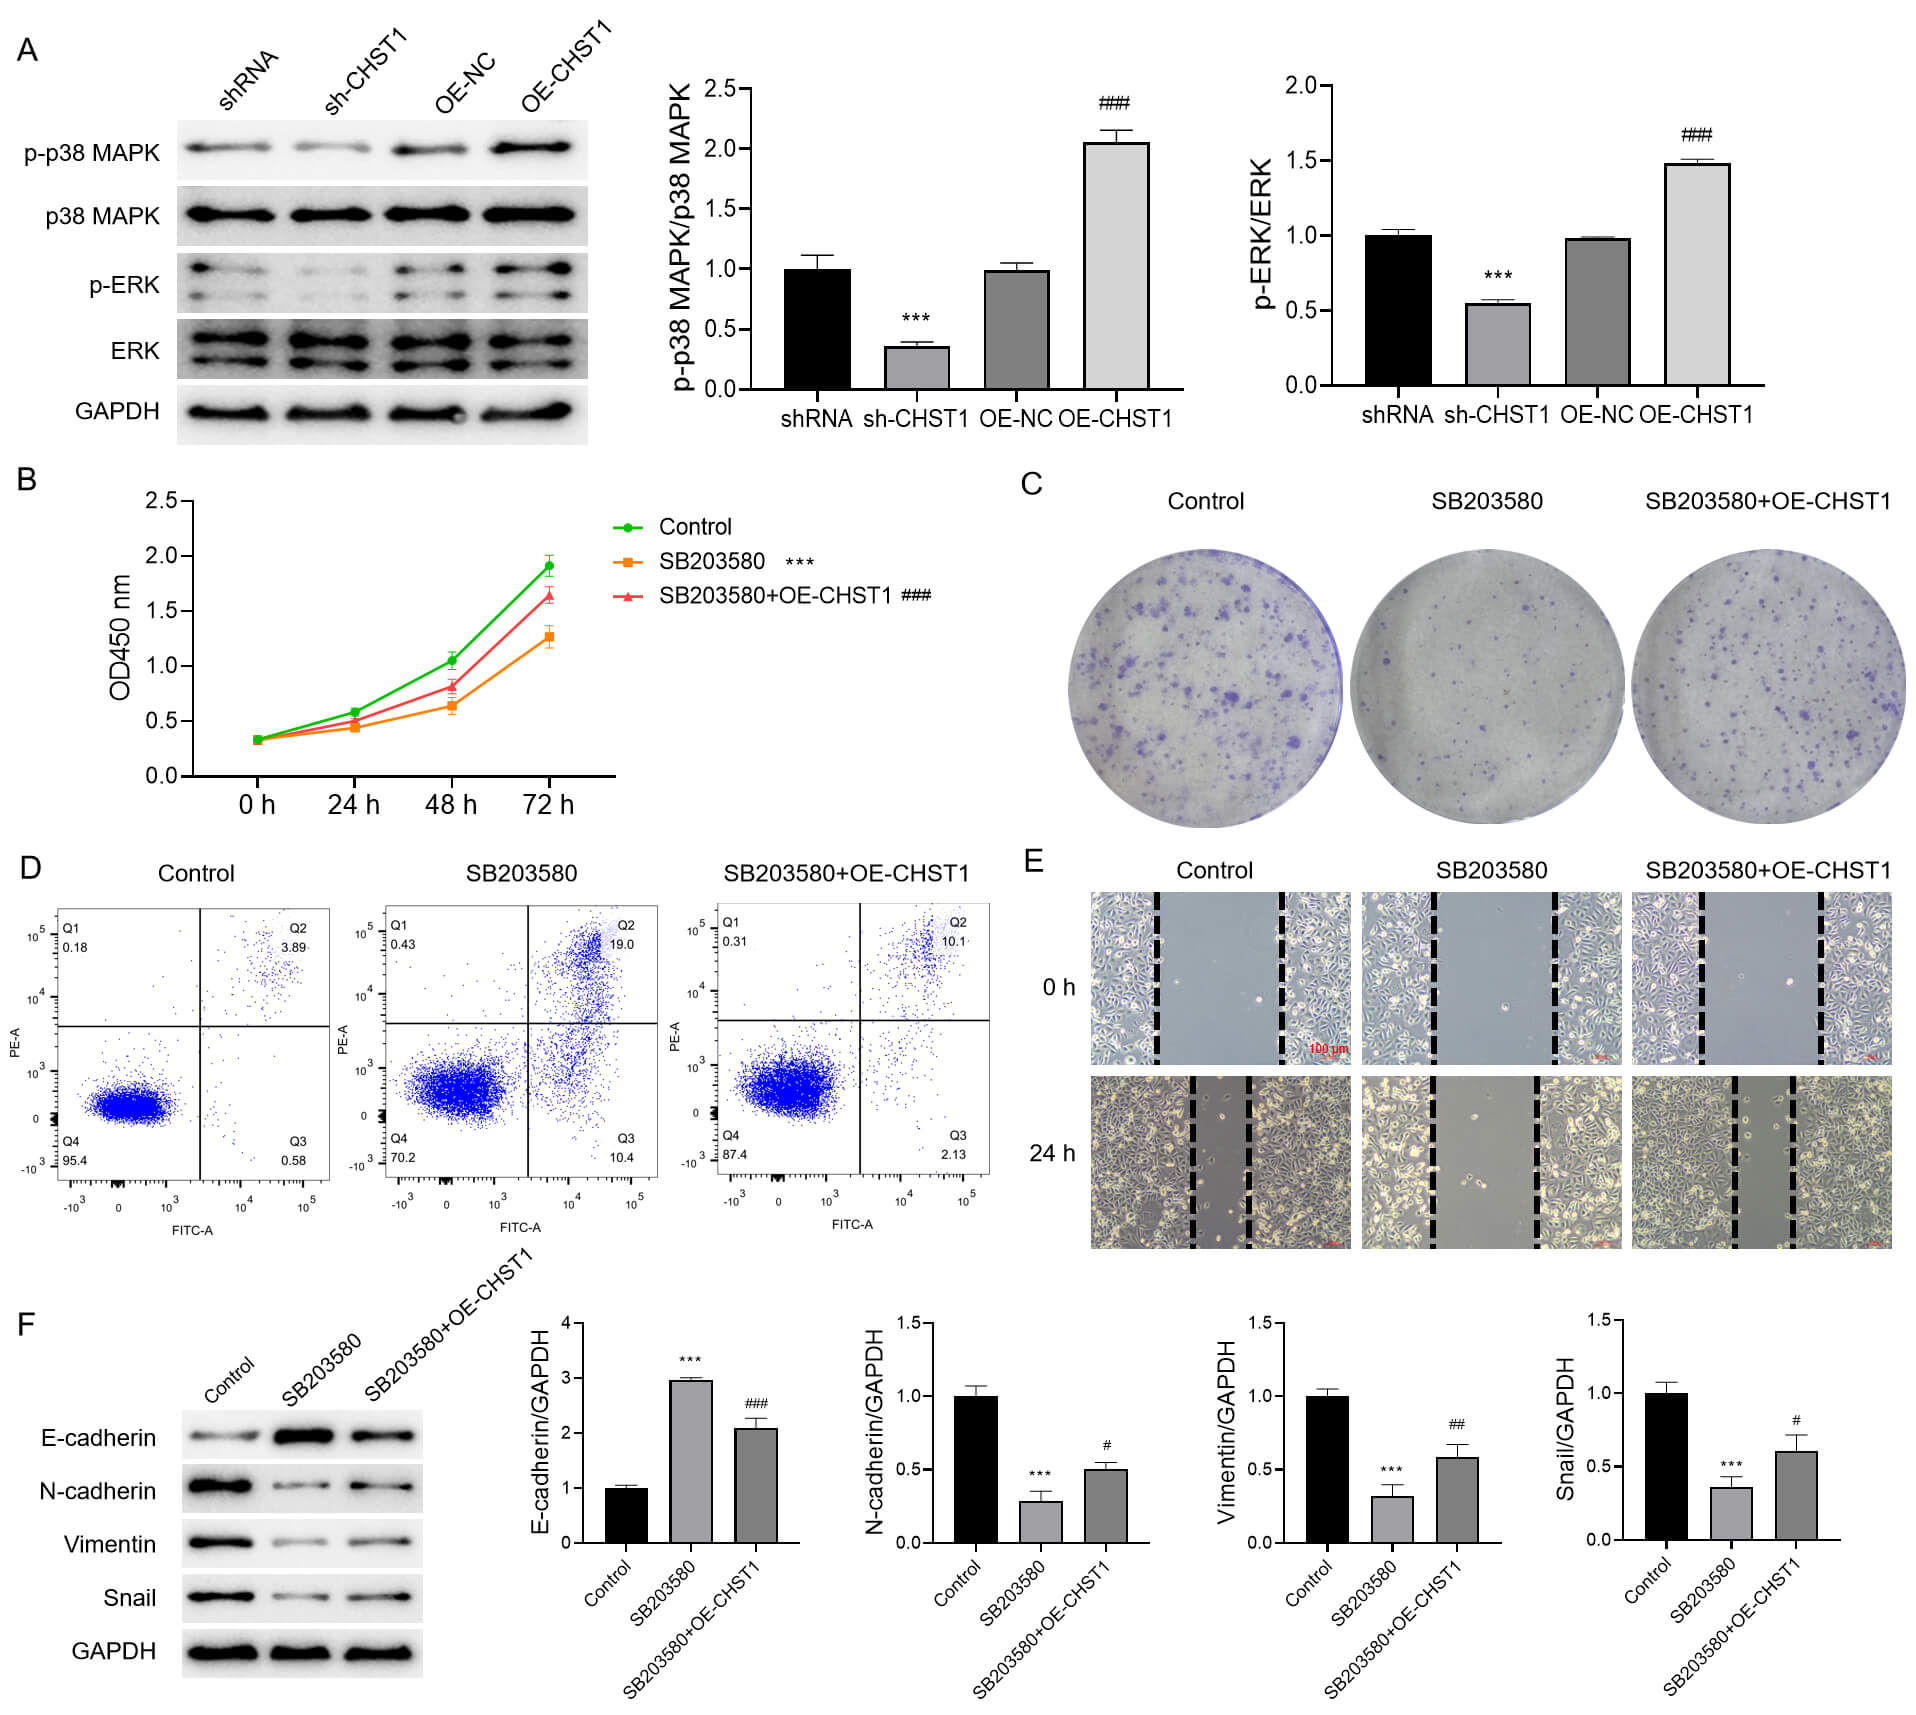 Fig. 13.
CHST1 modulates EMT and malignant phenotypes in AGS cells via
regulation of the MAPK/ERK signaling pathway. (A) WB analysis of CHST1’s effect
on the MAPK/ERK signaling pathway. Values are reported as mean
Subcutaneous tumor formation experiments in nude mice showed (Fig. 14A) that
both the tumor volume and weight were higher in the AGS+shRNA group relative to
the AGS+sh-CHST1 group (p
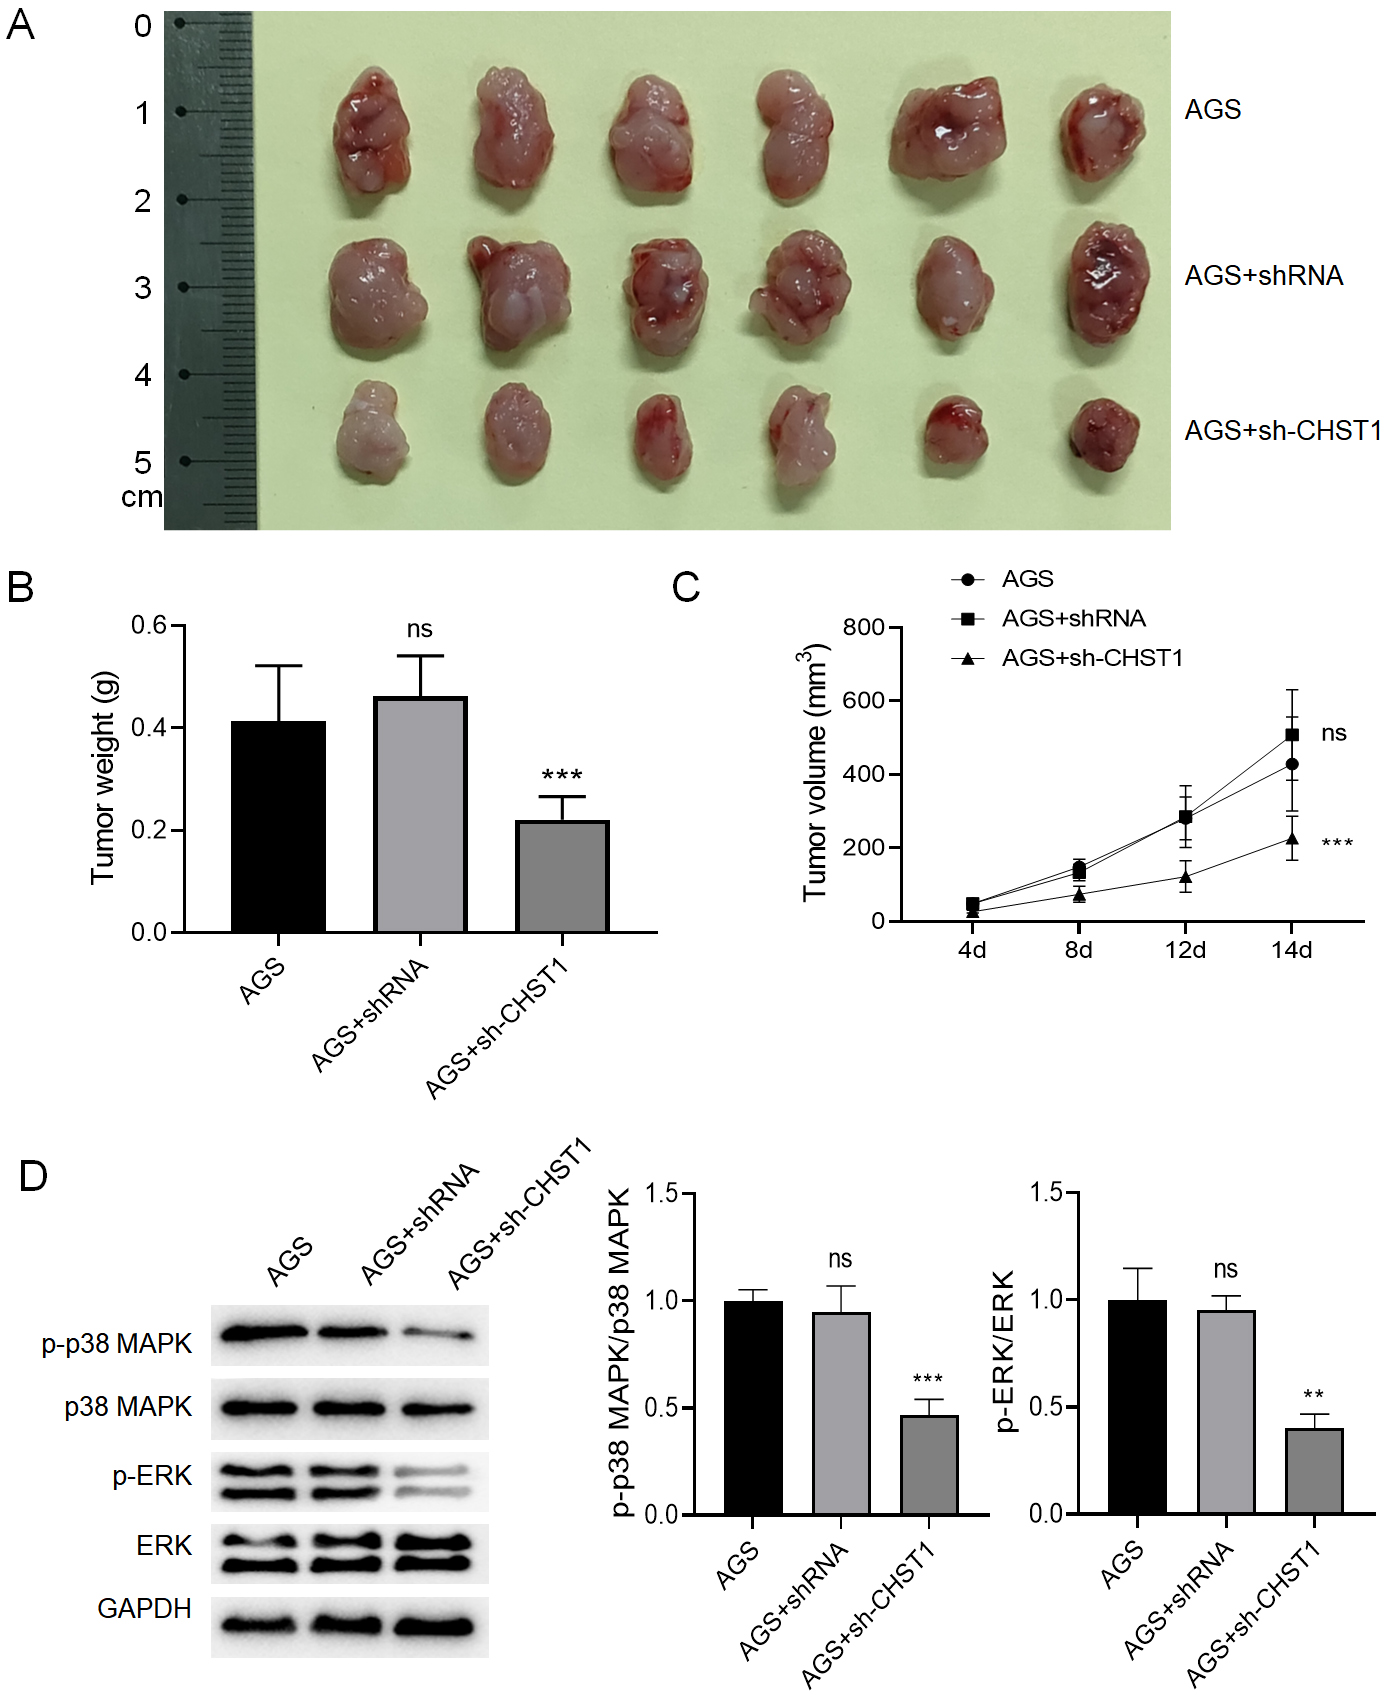 Fig. 14.
Subcutaneous tumor formation in nude mice. (A) Morphology of
subcutaneous tumor formation. (B) Comparison of the weight of subcutaneous tumor
formation. Values are reported as mean
In recent years, early detection and treatment of GC have progressed rapidly in China, owing to the standardization and promotion of this cancer [16]. However, effective therapeutic options remain limited for individuals with advanced GC who have missed the opportunity for radical surgical resection [17]. Therefore, developing novel therapies for GC remains crucial.
In this study, publicly available transcriptomic data associated with GC were retrieved from TCGA. Bioinformatics analyses revealed a total of 4765 DEGs in GC tissues relative to normal tissues. Subsequent enrichment analysis illustrated that the predominant enrichment of these DEGs were linked to the ECM, which is closely related to EMT. It has been found that remodeling of the ECM can trigger EMT, as various EMT-inducing factors up-regulate the expression levels of proteases (e.g., matrix metalloproteinases) and some other ECM remodeling enzymes [18, 19, 20]. EMT represents an essential biological process through which malignant tumor cells derived from epithelial tissues, including those in GC, acquire migratory and invasive capabilities [21].
Therefore, we further investigated the correlation between GC tissues and EMT scores, revealing that the EMT score of GC tissues was highly significant in comparison to the normal tissues, suggesting a potential close association between GC and EMT. Subsequent WGCNA identified EMT-related modules and 50 key module genes. Functional enrichment analysis showed predominant enrichment of these key module genes in ECM, collagen, and protein uptake, which was consistent with the previous results. Finally, survival analysis identified seven significant survival-related genes, defined as hub genes (CHST1, GPR176, OLFML2B, P4HA3, PDGFRB, SPARC, and VCAN). Among these, CHST1 has been reported in several studies to be expressed at high levels in GC tissues [22, 23, 24]; however, the exact mechanism remains unclear.
In the subsequent analyses of this study, our findings illustrated that CHST1 was not only significantly and positively correlated with EMT, but also closely linked with the T-stage of GC. In summary, we hypothesized that CHST1 might modulate the EMT in GC tissues, thereby contributing to poor GC prognosis. To test the hypothesis, a series of cellular experiments was performed, which revealed high levels of CHST1 expression across GC cell lines. Knockdown of CHST1 suppressed the proliferation, colony formation, as well as migration of both AGS and HGC27 cells, while simultaneously promoting apoptosis. Additionally, inhibiting CHST1 led to up-regulation of E-cadherin (the epithelial-derived marker) and down-regulation of N-cadherin, vimentin, and snail (the mesenchymal-derived markers), indicating suppression of EMT and suggesting a close involvement of CHST1 in this process. The recent study has also reported that CHST1 promotes GC cell proliferation and metastasis [25], which aligns well with our experimental observations. Hence, it may be deduced that CHST1 holds potential as a novel therapeutic target in GC.
Recent investigations highlight the MAPK pathway as an important element in GC and a potential target for GC treatment [26, 27, 28]. Moreover, the MAPK pathway is also involved in regulating EMT across different types of cancers [29, 30, 31]. It can induce EMT by activating multiple transcription factors, thereby enhancing GC cell invasion and metastasis [32]. Our in vitro experiments revealed that CHST1 promotes MAPK/ERK pathway activity. More importantly, overexpression of CHST1 partially reversed SB203580’s inhibitory effects on the proliferation, invasion, migration, and EMT of AGS cells, while also suppressing apoptosis triggered by SB203580. Our findings imply that CHST1 potentially promotes malignant behaviors, particularly EMT, by activating the MAPK/ERK pathway in GC cells. However, a limitation of this study is that the proposed mechanism has not yet been validated in vivo.
While this study establishes a key role for CHST1 in regulating the MAPK/ERK signaling pathway, a critical unresolved question is whether this function depends on its canonical glycosaminoglycan sulfotransferase activity. According to the enzyme activity-dependent hypothesis, CHST1 may influence receptor tyrosine kinase signaling indirectly by sulfating extracellular matrix or membrane-associated proteoglycans, thereby modulating ligand-receptor interactions or receptor clustering. Alternatively, the non-catalytic scaffolding hypothesis proposes that the CHST1 protein itself could act as an adaptor molecule, participating directly in the assembly of intracellular signaling complexes independent of its enzymatic function. Future investigations, such as functional comparisons between wild-type CHST1 and catalytically inactive point mutants, will be essential to delineate the underlying mechanism. Resolving this distinction is crucial for the rational development of CHST1-targeted therapeutic strategies aimed at precisely modulating relevant diseases, including cancer and fibrosis.
Through a detailed analysis of both GC and normal tissue samples obtained from TCGA using bioinformatics approaches, we successfully identified CHST1 as a key EMT-related gene linked with poor prognosis of GC. Through subsequent cellular experiments, CHST1 was confirmed to regulate EMT and malignant phenotypes via modulation of the MAPK/ERK pathway. The findings of this study provide a potential target for GC treatment. Nevertheless, the current study carries specific limitations that should be acknowledged. Further clinical and basic studies are required to confirm our finding that CHST1 enhances the poor prognosis of GC by modulating EMT. Our research team plans to explore this mechanism more deeply in subsequent studies.
GC, Gastric cancer; CHST1, carbohydrate sulfotransferase 1; MAPK, mitogen-activated protein kinase; ERK, extracellular signal-regulated kinase; RNA-seq, RNA sequencing; TCGA, The Cancer Genome Atlas; WGCNA, weighted gene co-expression network analysis; EMT, Epithelial-mesenchymal transition; DEGs, Differentially Expressed Genes; GO, Gene Ontology; KEGG, Kyoto Encyclopedia of Genes and Genomes; CCK-8, Cell Counting Kit-8; sh-CHST1, CHST1 shRNA; GS, Gene Significance; MM, Module Membership.
The datasets used and analysed during the current study are available from the corresponding author on reasonable request.
XQ and YH: Conceptualization, Methodology, Formal Analysis, Validation, Writing—original draft; ZW: Data curation, Formal Analysis, Validation, Writing—review & editing; XZ: Investigation, Data curation, Visualization, Writing—review & editing; LS: Methodology, Supervision, Resources, Project administration, Writing—review & editing. All authors contributed to editorial changes in the manuscript. All authors read and approved the final manuscript. All authors have participated sufficiently in the work and agreed to be accountable for all aspects of the work.
All animal experiments were approved by the Experimental Animal Welfare Ethics Committee of the First Affiliated Hospital of Harbin Medical University (IACUC No. 2023068). All efforts were made to minimize suffering and reduce the number of animals used in accordance with the 3R principle. The use of human tissue samples was reviewed and approved by the Ethics Committee of the First Affiliated Hospital of Harbin Medical University (Approval No. 2024314). The gastric cancer tissue samples were provided by the Department of Gastroenterology, The First Affiliated Hospital of Harbin Medical University. Informed consent was obtained. The study was carried out in accordance with the guidelines of the Declaration of Helsinki.
Not applicable.
This work was supported by the Scientific Research Innovation Fund of The First Affiliated Hospital of Harbin Medical University (Grant number 2024M35).
The authors declare no conflict of interest.
References
Publisher’s Note: IMR Press stays neutral with regard to jurisdictional claims in published maps and institutional affiliations.