


 , Jessica Neubauer 1, Sarah Rudigkeit 1, Judith Reindl 1,2
1 Institute for Applied Physics and Measurement Technology, University of the Bundeswehr Munich, 85577 Neubiberg, Germany
2 Department of Physics, University of Oslo, 0316 Oslo, Norway
Abstract
Developing therapy resistance and exhibiting high invasiveness are significant challenges in treating aggressive cancers, such as glioblastoma, where intercellular communication plays a crucial role in cellular organization, survival, and resistance to treatment. Tunneling nanotubes (TNTs), nanometer-sized membranous channels that connect distant cells, have emerged as an efficient form of intercellular communication that may enable cancer cells to evade therapeutic interventions.
In this study, we investigated the responses of TNT networks to low linear energy transfer (low-LET) X-ray irradiation in two established glioblastoma cell lines, U87 MG and LN229. Initially, we assessed radiosensitivity using colony formation assays to measure cell survival. Then, we used confocal live-cell microscopy to monitor TNT network dynamics over a 24-hour period following irradiation and performed co-staining experiments to identify cargoes transported through TNTs.
We observed a significant increase in TNT-mediated cellular connectivity 6 to 10 hours after 1.8 Gy X-ray irradiation in both cell lines. In contrast, cells treated with a higher radiation dose (3.9 Gy) exhibited reduced TNT connectivity; however, it remained slightly elevated compared to sham-irradiated controls. The co-staining experiments revealed the presence of calcium and mitochondria within TNTs. These cargoes are known to facilitate cancer cell migration and survival, potentially contributing to treatment resistance.
Taken together, these results strongly suggest that TNT-mediated intercellular communication may be a critical mechanism that supports glioblastoma resistance to radiotherapy.
Keywords
- tunneling nanotubes
- X-rays
- cell communication
- glioblastoma
- cell survival
- radiation tolerance
- mitochondria
- calcium
Cancer remains the second leading cause of death worldwide [1]. Based on the 2022 incidence and mortality rates, it is estimated that approximately one in five people will develop cancer in their lifetime and that one in nine men and one in twelve women will die from the disease [2]. These statistics highlight the significant global health challenge posed by cancer, driving intense research efforts to develop more effective therapeutic strategies. Among various cancer types, highly aggressive forms such as glioblastoma, the most common type of malignant brain tumor, are the focus of current research to enhance their treatment and thus increase the chances of survival for affected patients. Classified as a grade 4 tumor of the central nervous system, glioblastoma is characterized by a dismal prognosis, with median survival rates below 15 months and five-year survival rates under 10% [3, 4]. Key malignant features of glioblastoma include significant genomic instability, pronounced intratumoral heterogeneity, uncontrolled cell proliferation, extensive infiltration of surrounding tissues, and resistance to conventional therapies, such as radiotherapy and chemotherapy [5, 6, 7, 8, 9]. In many cases, the tumor recurs within 1–2 cm of the primary tumor despite a multimodal therapeutic approach combining surgery, radiation therapy using photons, and the administration of temozolomide, a chemotherapeutic agent that can cross the blood-brain barrier [10]. However, the molecular mechanisms driving glioblastoma’s aggressive infiltration and development of therapy resistance remain unclear.
Intercellular communication is a critical factor that potentially contributes to cancer cell survival and therapy resistance. For several decades, it has been known that cellular communication is essential for cell survival [11, 12]. This phenomenon is not solely attributable to the necessity for cells to communicate with one another in order to organize and coordinate themselves into complex systems, such as tissue [13], but also because the transfer of cellular organelles, proteins, or signals from healthy cells to unhealthy cells can enhance survival [14, 15]. Studies have shown that brain tumors have large functional intercellular communication networks consisting of membranous connections between distant cells. These networks may act as a resistant system, facilitating the development of therapy resistance [16, 17]. These membranous connections, termed tunneling nanotubes (TNTs), are straight, filamentous structures with diameters of less than 1 µm, functioning as efficient “nanotubular highways” for rapid intercellular exchange [18]. TNTs were first identified in 2004 in rat pheochromocytoma PC12 cells using advanced 3D live-cell microscopy techniques [18]. Since then, TNTs have been observed in various cell types, exhibiting diverse functional roles, compositions, and morphological characteristics [19, 20, 21]. Notably, TNT-like structures have also been documented in various tissue types, including brain tissue [22, 23, 24].
Despite these insights, the precise mechanisms of cellular communication via TNTs and their specific roles in cancer progression are still not well understood. Further investigation into TNT-mediated cellular communication could significantly improve our understanding of tumor microenvironment interactions, invasive cancer behavior, and tumor progression. Due to their prevalence in glioblastoma cells and brain tissue, targeting TNTs is a promising novel therapeutic strategy that could improve clinical outcomes for patients affected by this devastating disease [25, 26, 27].
The objective of this study was to investigate the response of TNT networks in
two established glioblastoma cell lines (U87 MG and LN229) to X-ray irradiation.
Initially, colony formation assays (CFAs) were conducted with LN229 cells to
evaluate their sensitivity to X-rays. To facilitate comparison of TNT network
responses to low-LET (Linear energy transfer (LET)
The human glioblastoma cell lines U87 MG (ATCC, Manassas, VA, USA, HTB-14) and LN229 (ATCC, Manassas, VA, USA, CRL-2611) were kindly provided by the Institute of Radiation Medicine (Helmholtz Zentrum München, 85764 Neuherberg, Germany) and the Department of Radiation Oncology (Ludwig-Maximilian-Universität München, Munich, Germany), respectively. Cells were cultured in Dulbecco’s Modified Eagle Medium (DMEM), high glucose medium (Sigma-Aldrich, St. Louis, MO, USA, D6429) supplemented with 10% FCS (Sigma-Aldrich, St. Louis, MO, USA, F7524) and 1% penicillin/streptomycin Sigma-Aldrich, St. Louis, MO, USA, P4333), and maintained at 37 °C in a controlled atmosphere of 5% CO2 and 95% humidity. All cell lines were validated by STR profiling and tested negative for mycoplasma.
To validate sample pooling, statistical comparisons of the same types of
measurements were conducted using analysis of variance (One-Way ANOVA Calculator,
Statistic Kingdom, Melbourne, Australia). To identify significant differences,
two-sample t-tests (GraphPad Software, QuickCalcs, version 9, Boston,
MA, USA) and two-way ANOVAs with repeated measures followed by Bonferroni post
hoc tests (IBM SPSS Statistics, version 29, International Business Machines
Corporation (IBM), Armonk, NY, USA) were performed. A p-value of
To enable comparison of cell survival after low-LET X-ray exposure and high-LET
Cell irradiation with low-LET X-rays was performed using a CellRad X-ray irradiation system (Precision X-Ray Inc., Madison, WI, USA) at a dose rate of 1.6 Gy/min (5 mA, 130 kV, 0.5 mm aluminium filter). The sample had to be placed centrally on the detector in the X-ray cabinet so that all cells in the ring system were irradiated and no shadowing effects occurred due to the high walls of the ring system. To track the exact dose irradiated during the cell survival experiments, dosimetry measurements were performed using XR-RV3 Gafchromic™ films (Ashland Inc., Wilmington, DE, USA, 832486) for each sample. For each dose (Sham, 1 Gy, 2 Gy, 3.7 Gy, 5.2 Gy, and 7.2 Gy), five to six samples were irradiated in the cell survival experiments.
Cell survival was determined by performing CFA as established in Wank et
al. [29]. After irradiation, the cells were detached from the foil using trypsin
(Sigma-Aldrich, St. Louis, MO, USA, T4299-100) and counted twice in a
Fuchs-Rosenthal C-Chip (NanoEnTek, Seoul, Korea, DHC-F01). A total of 284 to 1198
cells were counted per sample. The cell suspension was diluted to the desired
cell density (see Table 1) and seeded into 12-well plates (Greiner Bio-One GmbH,
Frickenhausen, Germany, 665180). Per sample, three 12-well plates were seeded.
After seeding, the samples were incubated for 12 days at 37 °C, 5%
CO2, and 95% humidity. At the end of this incubation period, the cells were
fixed with ice-cold methanol (Carl Roth GmbH + Co. KG, Karlsruhe, Germany,
CP43.3) and stained with a 0.1% (w/v) crystal violet solution (Sigma-Aldrich,
St. Louis, MO, USA, C0775). The plates were scanned with a
GelCount™ platform (Oxford Optronix Ltd., Adderbury, UK), and the
numbers of colonies were counted by hand. A colony was counted as one if it
consisted of
| Dose [Gy] | Cell concentration [cells/mL] |
| 0 | 100 |
| 1 | 100 |
| 2 | 100 |
| 3.7 | 300 and/or 900 |
| 5.2 | 600 and/or 1800 |
| 7.2 | 1200 and/or 3600 |
Per well, 1 mL of cell suspension was used. In the first experiment, the lower cell concentration listed was used (for the three higher doses). In the second experiment, both cell concentrations listed were seeded for each irradiated sample to increase the resulting number of colonies. CFA, colony formation assay.
The plating efficiency (PE) was determined for each sample. PE is defined as the percentage of seeded cells that grow to a colony:
The survival fraction (SF) of cells treated with a given dose was calculated by dividing the mean PEirr of the irradiated samples by the mean PEsham of the sham-irradiated samples (control):
The uncertainties of the SF values were calculated by Gaussian error propagation, and finally, the survival curves were fitted by the linear-quadratic (LQ) model:
where D is the dose,
Two independent experiments were performed. The first experiment yielded a mean
PE
For TNT network analysis, the cells were seeded in a glass-bottom CELLview cell
culture dish 35
Before X-ray irradiation, the cellular membrane was stained with a 1.5X CellMask™ Plasma Membrane staining solution (Thermo Fisher Scientific Inc., Waltham, MA, USA, C3760 for green, C10045 for orange) dissolved in growth medium. After 10 minutes of incubation at 37 °C, 95% humidity, and 5% CO2, the cells were washed three times with growth medium, followed by imaging in growth medium. The green dye was used for co-staining experiments, and the orange dye was used for acquiring live-cell videos for TNT network analysis, as this dye is more photostable [30].
Cell irradiation with low-LET X-rays was performed using the same CellRad X-ray
irradiation system (Precision X-Ray Inc., Madison, WI, USA) at a dose rate of 1.6
Gy/min (5 mA, 130 kV, 0.5 mm aluminium filter) as for the cell survival
experiments. For each experiment, one four-well dish was used. To enable direct
comparison of samples treated with different doses in TNT-network experiments,
two wells were irradiated with 1.8 Gy (corresponding to 50% cell survival), and
the other two wells were irradiated with 3.9 Gy (corresponding to approximately
10% cell survival). A tungsten shield ensured that each well received only its
target dose. The experiment was performed in triplicate, resulting in six samples
per dose (two samples per dose per experiment). Since dose measurements using
XR-RV3 Gafchromic™ films with the 5 mm thick tungsten shield used
resulted in a radiation dose penetration of (4.2
Confocal live-cell imaging was performed using a Leica TCS SP8 3X confocal microscope (Leica Microsystems CMS GmbH, Mannheim, Germany) equipped with a live-cell imaging unit consisting of a climate box and CO2 supply with a humidifier (“The Cube & the Box”, Life Imaging Services GmbH, Basel, Switzerland). Cells were imaged under live-cell conditions of 37 °C and 5% CO2. For imaging, a 63x oil objective (Leica Microsystems CMS GmbH, Mannheim, Germany) with a high numerical aperture of 1.4 and the halogen- and fluorescence-free immersion oil Immersol™ 518 F/37 °C from Zeiss (Carl Zeiss Microscopy Deutschland GmbH, Oberkochen, Germany, 444970-9010-000) with a refractive index of 1.518 at 37 °C were used. The power of the white light laser (WLL) was kept as low as possible during the live-cell imaging to reduce cell stress. The laser power used for excitation was approximately 1 mW. A scanning speed of 600 Hz was chosen. Additionally, the cells were scanned bidirectionally to reduce motion artifacts and cell stress due to long light exposures. The fluorescence signal was detected using a hybrid detector (HyD, Leica Microsystems CMS GmbH, Mannheim, Germany), which combines the sensitivity of a photomultiplier with the noise suppression of an avalanche photodiode.
For the TNT network analysis, cell videos were acquired up to 24 hours after
irradiation. The time needed to prepare and check the microscope settings for
acquiring videos immediately after cell irradiation was minimized. Defining the
areas to be imaged, creating focus maps for each area, and setting the remaining
parameters took a total of less than 50 minutes. Between the end of the first
irradiation and the start of imaging, a mean time
A 3
| Dye | Dye concentration | Excitation wavelength [nm] | Detector range [nm] |
| CellMask™ Orange Plasma Membrane Stain | 7.5 µg/mL | 554 | 567–635 |
| CellMask™ Green Plasma Membrane Stain | 7.5 µg/mL | 522 | 530–583 |
| BioTracker™ 609 Red Ca2+ AM | 10 µM | 595 | 605–707 |
| Tetramethylrhodamine ethyl ester (TMRE) | 50 nM | 554 | 604–700 |
We identified membrane connections as TNTs if they connected two separate cells and were smaller than 1 µm in diameter, and if they were located above the substrate. This criterion was determined by acquiring z-stacks for imaging and evaluating TNTs using 3D images rather than maximum projections. A previous study [30] thoroughly examined the characteristics of TNTs in U87 MG and LN229 cells, including their morphology, lifetime, formation, dimensions, and the optimized methodology for studying TNTs using suitable confocal live-cell imaging.
To capture potential communication phases during recovery after irradiation, TNT networks were evaluated at multiple time points (1, 3, 10, and 24 hours), as described by Matejka and Reindl [28]. TNTs were manually counted by scrolling through the z-stack image and examining each cell individually. Cells that were connected via TNTs were referred to as “connected cells”. Depending on the number of TNTs establishing the connection between the two cells, the connection was referred to as either a “simple” or a “complex connection”. Connections consisting of one or two TNTs were referred to as simple connections, and connections consisting of three or more TNTs were referred to as complex connections. Two reasons were given for this distinction. First, as reported by Matejka and Reindl [28], the individual TNTs of very dense connections consisting of five or more TNTs were so closely packed that they were indistinguishable and therefore not countable for evaluation purposes. Second, the number of TNTs between two cells can indicate the strength or efficiency of a connection because the more TNTs there are between two cells, the more cargo can be transported at the same time. According to our definition, then, a complex connection could be more efficient than a simple one. Further subclassification by TNT number alone was not recommended because connections containing exactly two, three, or four TNTs are rare.
Cells connected to at least two other cells were classified as “highly connected cells” and used as a proxy for network complexity. For each imaging field, the total number of cells was recorded, and the TNT network was quantified by the following: (i) the percentage of connected cells, (ii) connections per cell (total connections divided by cell count, irrespective of connection type), (iii) the percentage of complex connections, and (iv) the percentage of highly connected cells. Expressing the TNT metrics as percentages (or dividing by the total cell count) normalized the results for differences in cell density between fields. Finally, the irradiated samples were compared with the sham-irradiated controls.
For co-staining experiments, the cells were seeded in glass-bottom dishes
(µ-Dish 35 mm, Ibidi GmbH, Gräfelfing, Germany, 81158) at a
seeding density of 65,000 cells/mL (2 mL total volume; 31,707 cells/cm2) one
day before the experiment. All glass-bottom products used had a glass thickness
of (170
For calcium staining, the BioTracker™ 609 Red Ca2+ AM dye (Sigma-Aldrich, St. Louis, MO, USA, SCT021) was used. The fluorescence intensity of this dye changes reversibly depending on the Calcium (Ca2+) concentration. Cell labeling was performed at a dye concentration of 10 µM with the addition of 0.05% Pluronic F-127 (Thermo Fisher Scientific Inc, Waltham, MA, USA, P6866), a nonionic surfactant polyol that inhibits dye aggregation, and an incubation time of 1 hour to 1.5 hours at 37 °C, 95% humidity, and 5% CO2. A serum-free medium was used as the loading medium, as labeling in normal growth medium failed, and staining in Hanks’ Balanced Salt Solution (HBSS) for 1 hour led to cell death. An incubation time of 30 minutes resulted in a weaker signal, so the incubation time was increased to at least 1 hour.
Mitochondria were stained with Tetramethylrhodamine ethyl ester (Enzo Biochem Inc., Farmingdale, NY, USA, ENZ-52309), tetramethylrhodamine ethyl ester (TMRE) for short. Cells were stained with a 50 nM staining solution with growth medium for 25 minutes at 37 °C, 95% humidity, and 5% CO2. TMRE is a cell-permeable, cationic, red-orange fluorescent dye that accumulates at the negative membrane potential in active mitochondria, but is not cytotoxic [31]. It is therefore highly selective for functional mitochondria and produces a very low background signal in living cells. Non-functional mitochondria that have been depolarised (e.g., by radiation) are not stained by this dye. Due to its ability to stain intact mitochondria specifically and its stable labeling of all cells with a superior signal-to-noise ratio compared to MitoTracker™ Green and MT-mKeima-Red in HeLa cells, TMRE was successfully used in previous experiments investigating mitochondrial depolarization by radiation in our laboratory [32] and was therefore also selected for this study.
The same confocal system, scanning parameters, and objective were used for the co-staining experiment as for the TNT network analysis. For imaging, a system-optimized pixel size of 76 nm and a z-step size of 299 nm were chosen. Confocal microscopy of living cells co-stained with CellMask™ Green Plasma Membrane Stain and BioTracker™ 609 Red Ca2+ AM dye was performed using two hybrid detectors (HyDs) simultaneously. The first HyD detected the plasma membrane signal (CellMask™ Green Plasma Membrane Stain), and the second HyD detected the signal of Ca2+ (BioTracker™ 609 Red Ca2+ AM dye). The selected detector ranges and the excitation wavelengths used are listed in Table 2.
For imaging living cells co-stained with the CellMask™ Green Plasma Membrane Stain and TMRE, sequential microscopy was performed because the fluorescence spectra of the two dyes used are very close. The signal of the membrane dye was recorded in the first sequence, and the signal of TMRE was recorded in the second sequence. The excitation wavelengths and detector ranges used are listed in Table 2. The chosen excitation wavelength and detector range for the TMRE signal are not optimal because they do not cover the maxima. However, these values were chosen to minimize overlap and interference between the two signals. To ensure rapid acquisition and to minimize cell movement during acquisition, the sequence was switched between stacks.
The analysis of the cargo transport inside TNTs was performed using the raw images. For image visualization, however, the images were deconvolved using Huygens Professional Deconvolution software (Scientific Volume Imaging B.V., Hilversum, Netherlands, version 23.04). Based on the microscopy parameters (metadata) used, the software calculated a theoretical point spread function (PSF). Deconvolution was carried out using the Classic Maximum Likelihood Estimation (CMLE) iterative algorithm, which was established in our lab for several approaches. The deconvolution process was performed with a signal-to-noise ratio (SNR) of three to five, an automatic background estimation (estimation mode: lowest), and an area radius of 0.7 µm.
Colony formation assay (CFA) experiments were performed with both low-LET X-ray
and high-LET
Fig. 1 shows the dose-dependent cell survival curve resulting from X-ray
irradiation. The well-known shoulder formation was observed, and the resulting
survival curve was fitted with the linear-quadratic model. The fitting results
are presented in Table 3. Also listed are the doses at which 50% and 10% of the
cells survived after X-ray exposure (D50 and D10, respectively). D50 was
determined to be (1.79
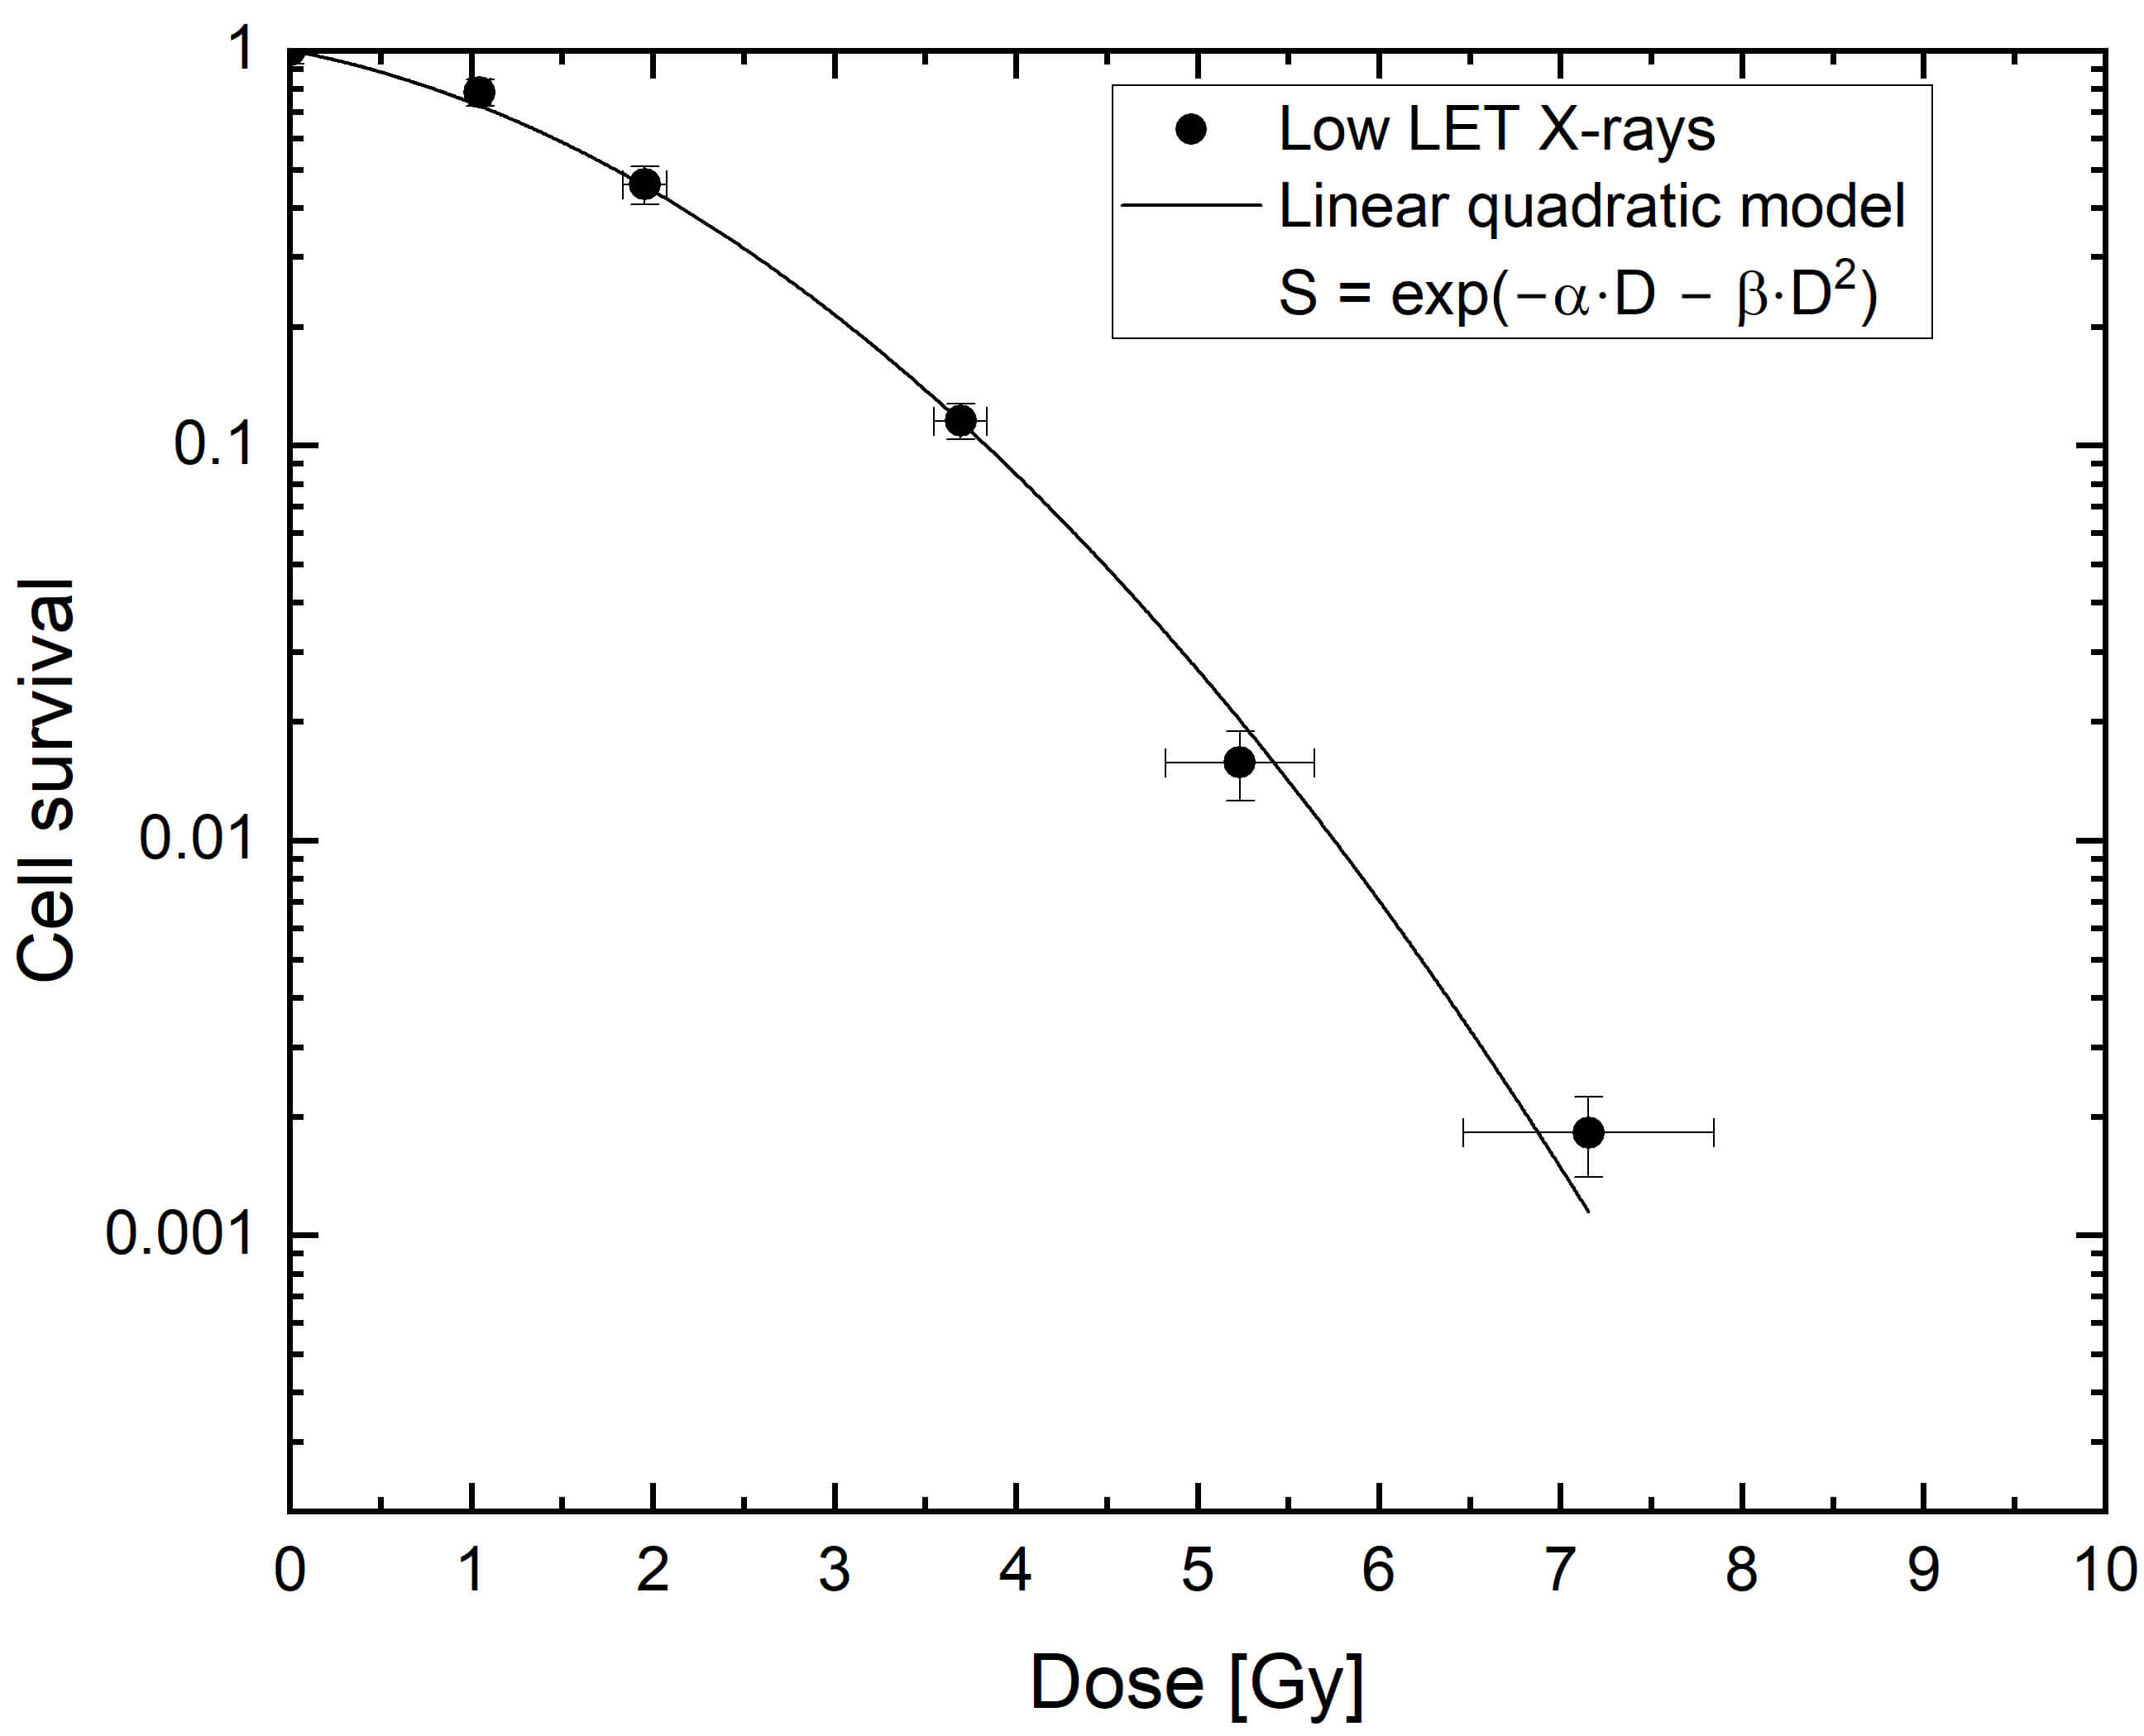 Fig. 1.
LN229 cell survival after exposure to X-rays. Cell survival uncertainties were calculated using Gaussian error propagation of the standard errors (SEMs) of the respective mean plating efficiency (PE) values. Dose uncertainties are the standard deviations of dose measurements using XR-RV3 Gafchromic™ films. Two independent CFA experiments were performed for each radiation type. LET, linear energy transfer.
| Radiation type | Low-LET X-rays |
| Model S = | |
| 0.20 | |
| 0.104 | |
| D50 [Gy] | 1.79 |
| D10 [Gy] | 3.8 |
The uncertainties of D50 and D10 were calculated using Gaussian error propagation of the fit uncertainties.
Glioblastoma patients are usually treated with photon radiotherapy. To understand how cellular communication along TNTs may affect therapeutic outcome, the response of TNT networks to X-ray irradiation was investigated. For this purpose, U87 MG and LN229 cells were imaged using confocal microscopy up to 24 hours after X-ray irradiation. Four-well cell culture dishes were used for the experiments, allowing live cell microscopy of up to four samples in parallel and ensuring good comparability. Before irradiation, the cell membrane was labeled using the CellMask™ Orange plasma membrane stain to visualize the TNTs. Cells were irradiated at the following doses: 1.8 Gy, corresponding to 50% cell survival, and 3.9 Gy, corresponding to approx. 10% cell survival. The TNT networks were analyzed from the obtained cell videos according to their expansion, i.e., how many cells were connected by TNTs and how many connections exist per cell, and their complexity, i.e., how many complex connections consisting of three or more TNTs and how many highly connected cells (cells connected to at least two other cells) are present in the TNT networks. These parameters were determined at 1 hour, 3 hours, 10 hours, and 24 hours after irradiation to capture possible communication phases during the recovery phase after irradiation. Finally, the irradiated samples were compared with sham-irradiated controls.
For the TNT network connectivity, the number of connected cells as well as the number of connections per cell were considered. Fig. 2 shows the results of TNT network expansion in LN229 ((a) and (c)) and U87 MG cells ((b) and (d)) after sham (black), 1.8 Gy (red), and 3.9 Gy (blue) X-ray irradiation. In (a) and (b), the time course of the fraction of connected cells is shown, and in (b) and (c), the time course of the number of connections per cell is shown. An increased TNT network expansion is measurable in both cell lines after 1.8 Gy X-ray irradiation.
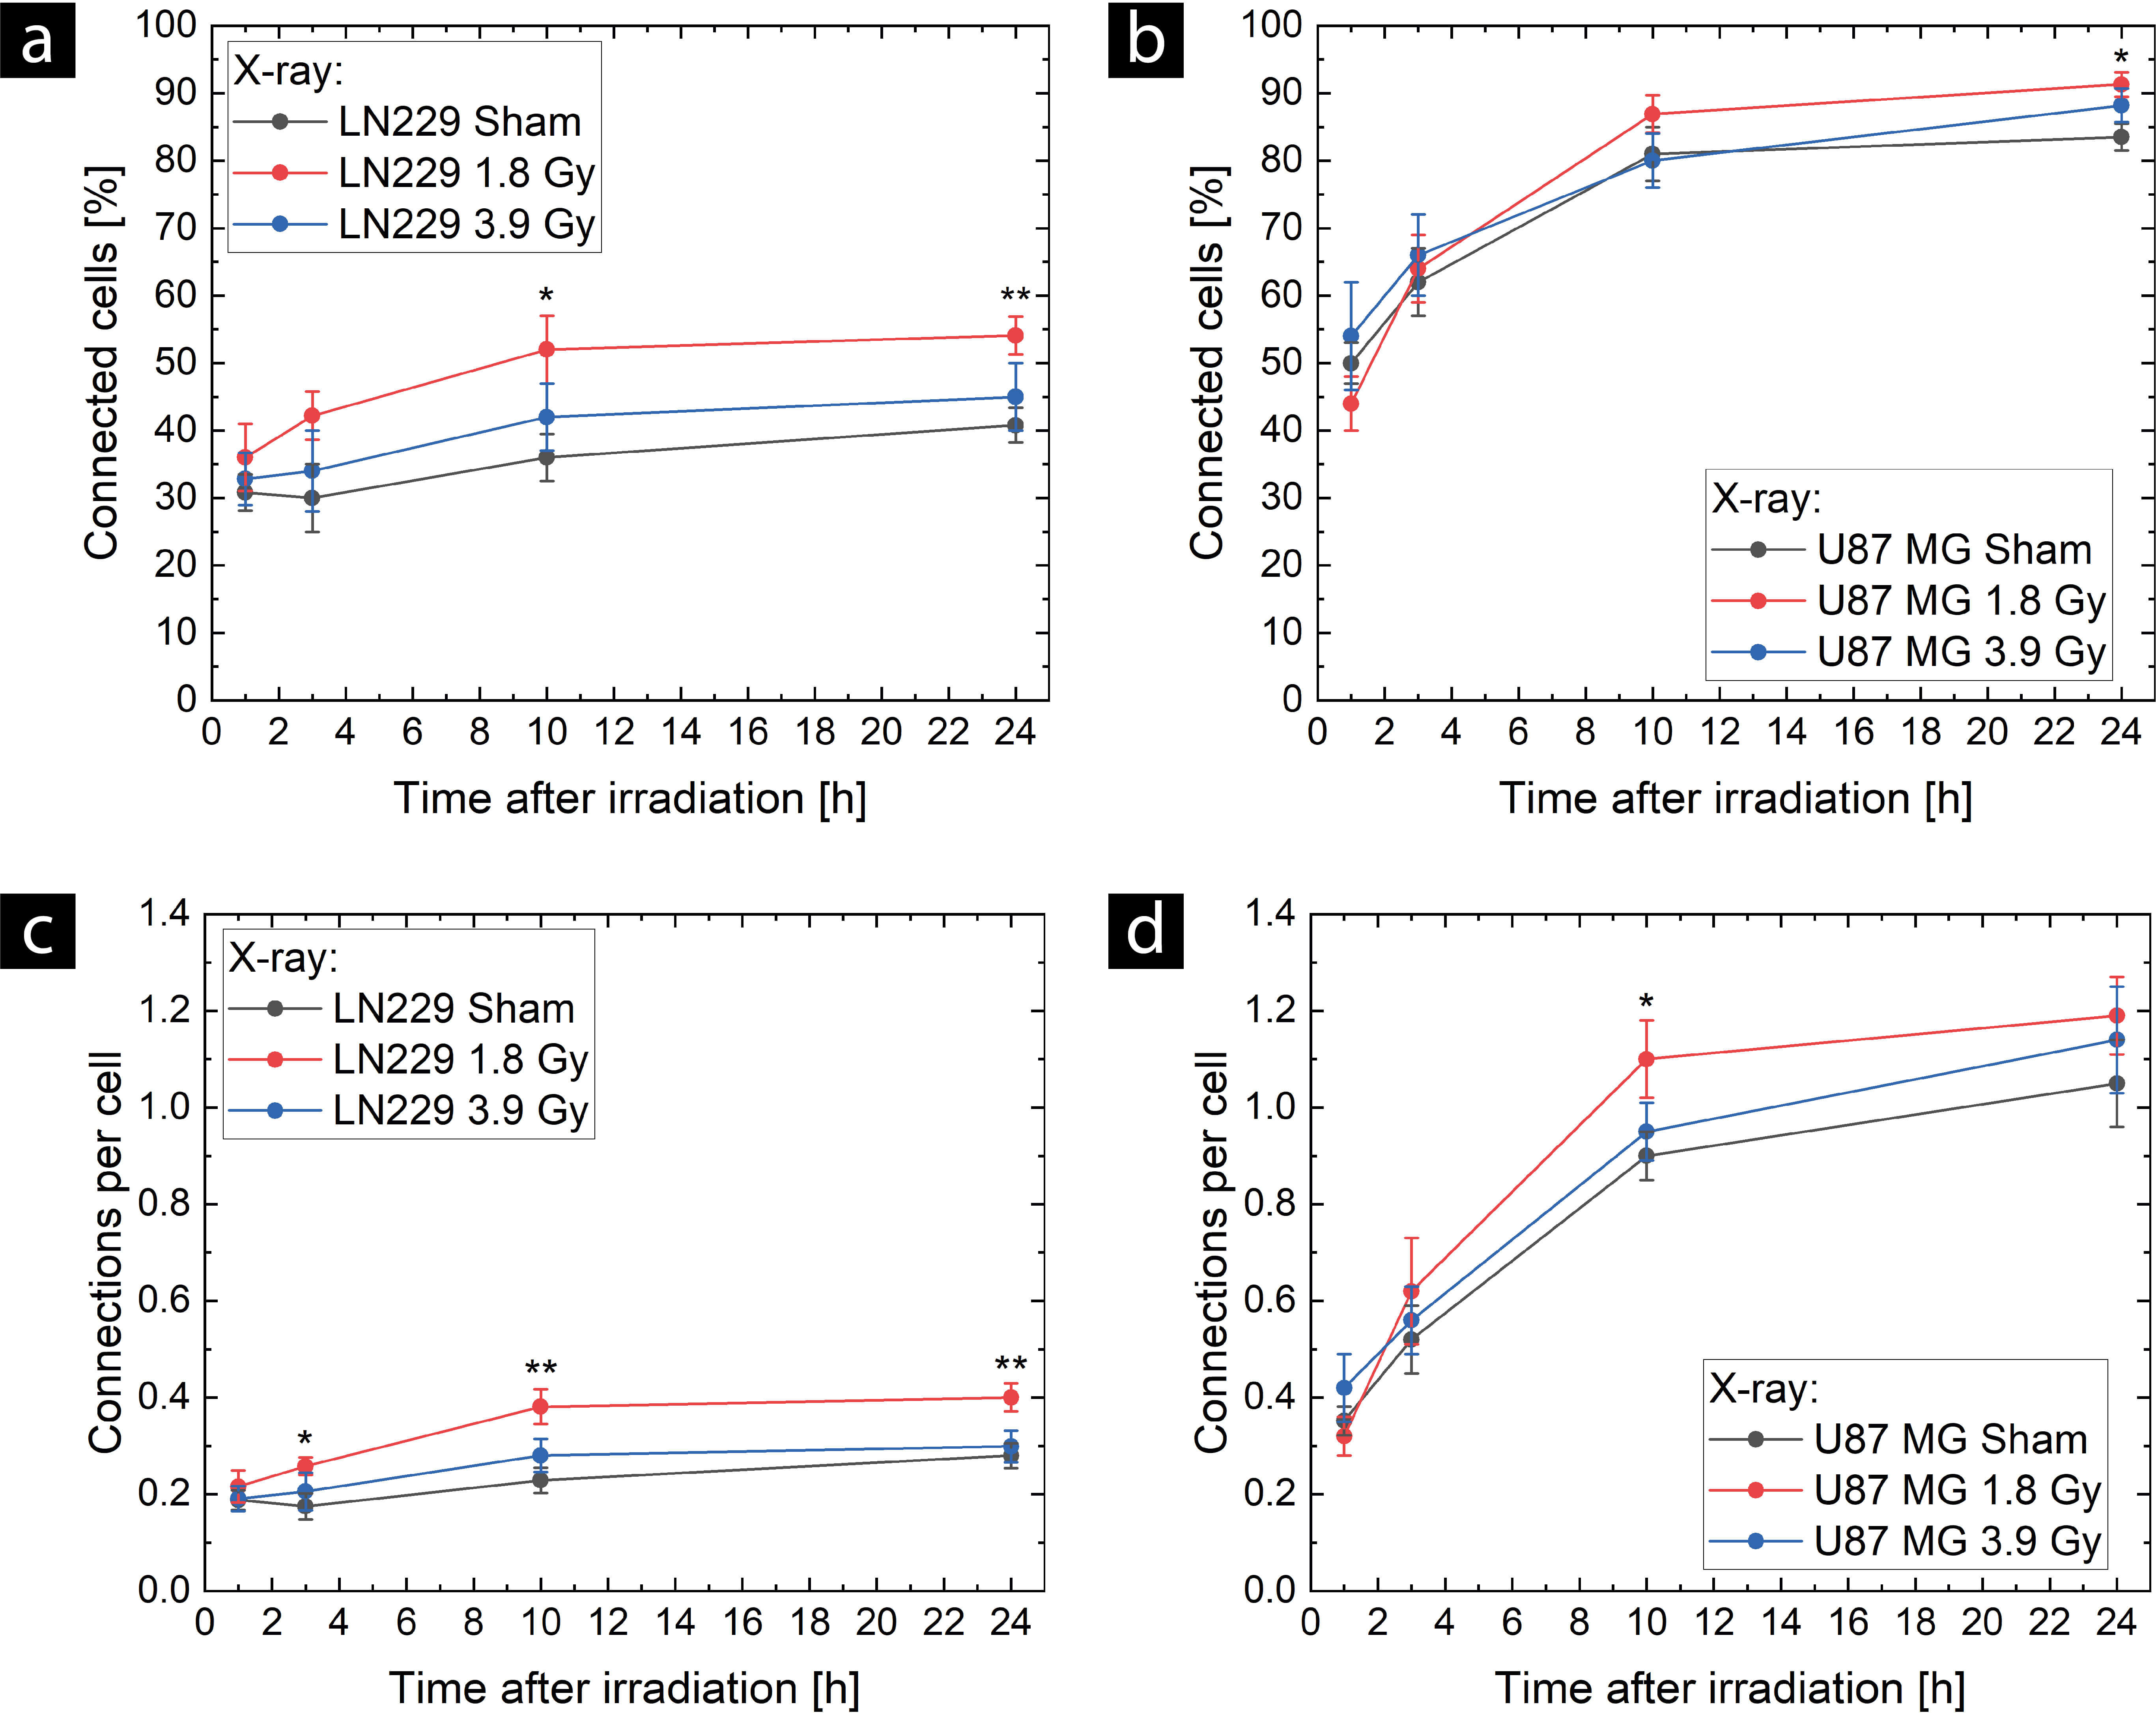 Fig. 2.
Temporal evolution of tunneling nanotube (TNT) network expansion
after X-ray exposure in LN229 cells (a,c) and U87 MG cells (b,d). TNT network
expansion was measured in terms of the proportion of cells connected by TNTs
(a,b) and the number of connections per cell (c,d). For sham controls (black),
eight samples (N = 8), and for the doses of 1.8 Gy (red) and 3.9 Gy (blue), six
samples (N = 6) were evaluated. Means
Considering the LN229 cell line, significantly (p = 0.0264) more LN229
cells were connected by TNTs in the 1.8 Gy irradiated samples compared to the
sham irradiated controls ((52
The increased TNT network expansion was also measurable when considering the
number of connections per cell. In LN229 cells, a significant increase
(two-sample t-test, p = 0.0355) between the 1.8 Gy X-ray
exposure and sham control was already visible 3 hours after exposure. In the
shams, approximately every 6th cell has a connection (i.e., 0.175
In U87 MG cells, a significant (two-sample t-test, p = 0.0459)
1.2-fold higher number of connections per cell was detected 10 hours after 1.8 Gy
irradiation compared to sham (1.10
For the higher dose of 3.9 Gy, no significant differences in TNT network expansion were observed for either cell line. However, the measured values were slightly higher than those for the sham exposure in both cell lines. Supplementary Figs. 3,4 show some representative images of TNT networks 10 hours after irradiation in LN229 cells and U87 MG, respectively.
The TNT network complexity was quantified by the number of highly connected
cells and the proportion of complex connections. Considering the number of highly
connected cells, the significant increase in TNT network expansion at about 10
hours after 1.8 Gy irradiation also resulted in a higher proportion of highly
connected cells in both cell lines (see Fig. 3a,b, respectively), and thus in a
more complex TNT network. At 10 hours and 24 hours after irradiation, there were
almost twice as many highly connected cells in LN229 samples irradiated at a dose
of 1.8 Gy (10 hours: (15.4
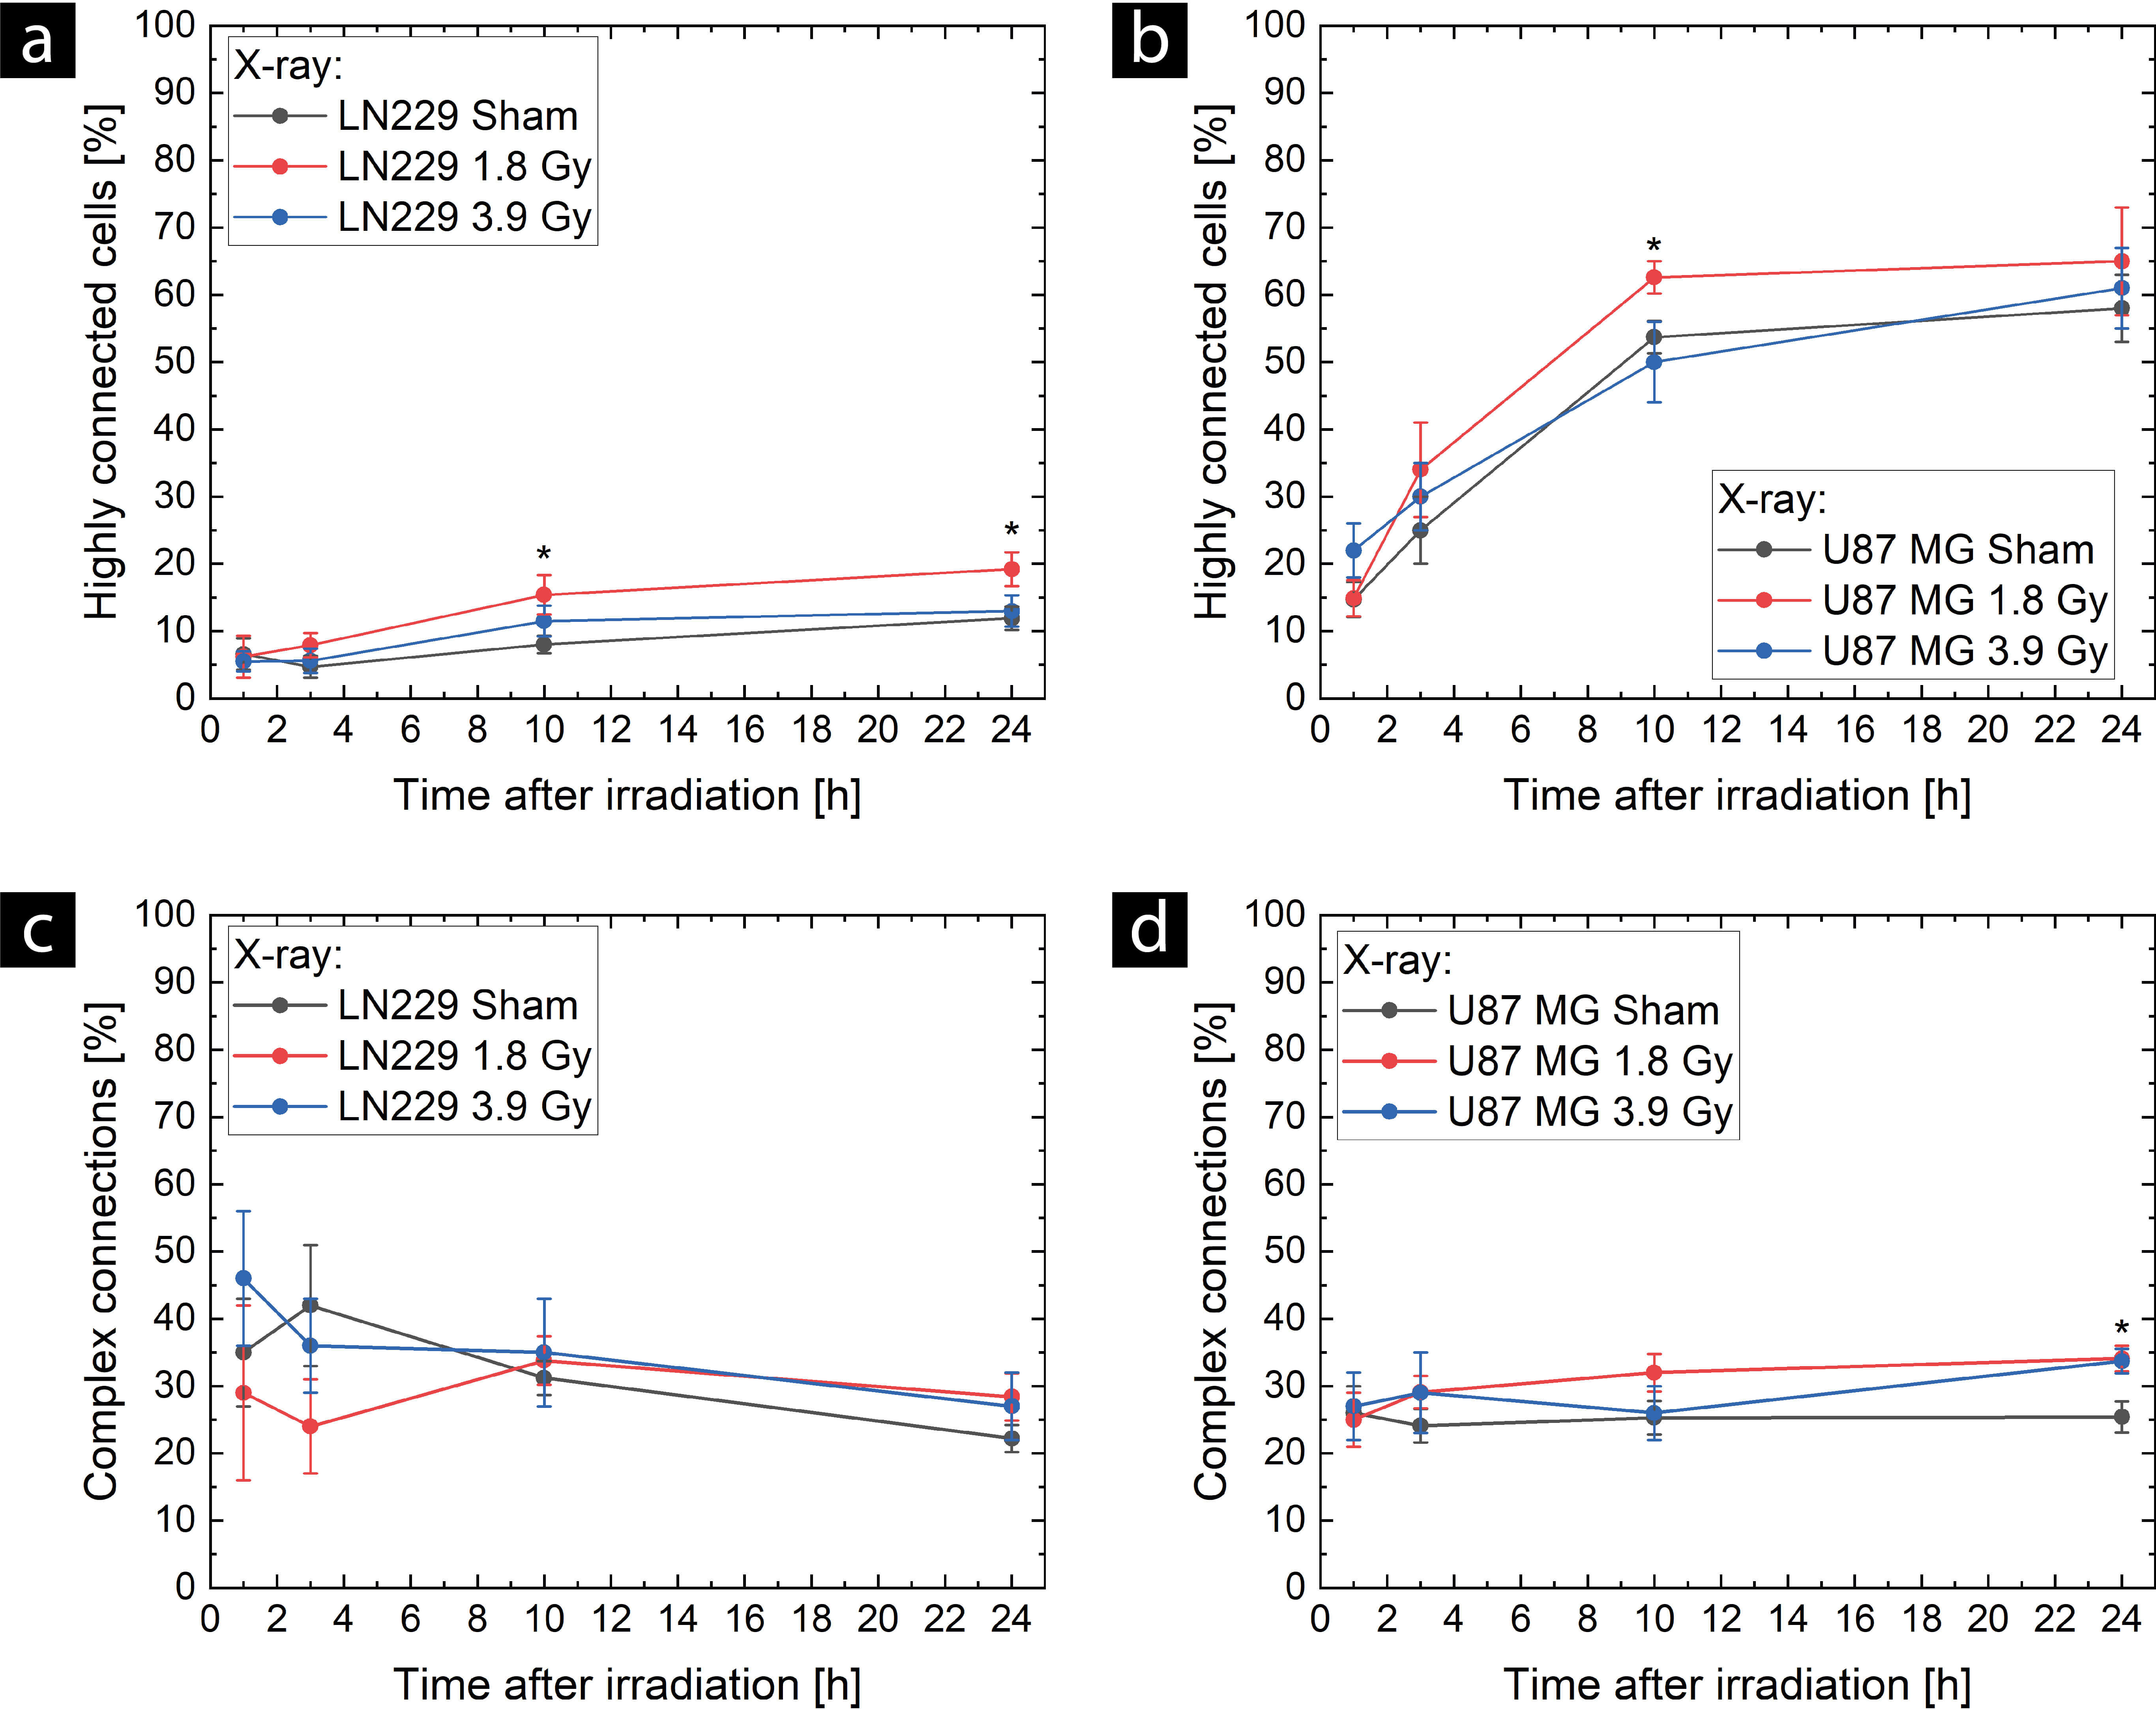 Fig. 3.
Temporal evolution of TNT network complexity after X-ray
exposure in LN229 cells (a,c) and U87 MG cells (b,d). The complexity of the TNT
network was measured by the proportion of highly connected cells (a,b), which
were connected to at least two other cells in the network, and the proportion of
complex connections, which consisted of three or more TNTs (c,d). For sham
controls (black), eight samples (N = 8), and for the doses of 1.8 Gy (red) and
3.9 Gy (blue), six samples (N = 6) were evaluated. Means
The TNT networks of LN229 cells did not show increased complexity with respect to the proportion of complex connections. At the beginning of the cell videos (1 hour and 3 hours after irradiation), high variations (e.g., ranging from 16% to 56% within the error bars at 1) in the proportion of complex connections were measured (see Fig. 3c). These large variations are probably due to the low overall number of TNTs detected in the LN229 cells (2–20 TNTs per sample). The variations became smaller at 10 hours and 24 hours after irradiation (e.g., ranging from 20.2% to 32% within the error bars at 24 hours). At these times, more TNTs were detected (see results on connections per cell shown in Fig. 2c), and therefore, a better statistic regarding the proportion of complex connections was achieved. The proportion of complex connections in LN229 cells seemed to decrease slightly over time.
In U87 MG cells, the proportion of complex connections remained relatively
constant over time, at approximately 25% in sham-irradiated controls (see Fig. 3d). In
contrast, TNT networks in irradiated cells tend to have slightly more complex
connections over time. Starting with (25
In addition to performing a statistical analysis using two-sample t-tests, two-way ANOVAs with repeated measures were conducted to identify significant differences between groups (i.e., the doses). These analyses revealed no significant differences between sham irradiation, 1.8 Gy, and 3.9 Gy X-ray irradiation in U87 MG cells. However, significant differences between the groups (i.e., the doses) were found for LN229 cells in terms of the number of connected cells, the number of connections per cell, and the number of highly connected cells. Subsequent Bonferroni post hoc tests revealed significant differences when comparing sham irradiation and 1.8 Gy X-ray irradiation, with p-values of 0.005, 0.002, and 0.033, respectively, for the number of connected cells, connections per cell, and highly connected cells. According to the two-way ANOVAs with repeated measures, no interactions between treatment and time were found in both cell lines.
To identify cargoes transported by TNTs, co-staining experiments were performed in which the cell substance of interest was labeled, and the cell membrane was additionally co-labeled using the CellMask™ Green Plasma Membrane Stain to identify the TNTs. Two types of possible cargoes were examined: Ca2+ and mitochondria.
Two independent experiments, each with one sample, were performed to investigate
the presence of calcium in the TNTs of unirradiated U87 MG cells. 59 TNTs were
analyzed in the first experiment, and 57 TNTs in the second experiment. In (70
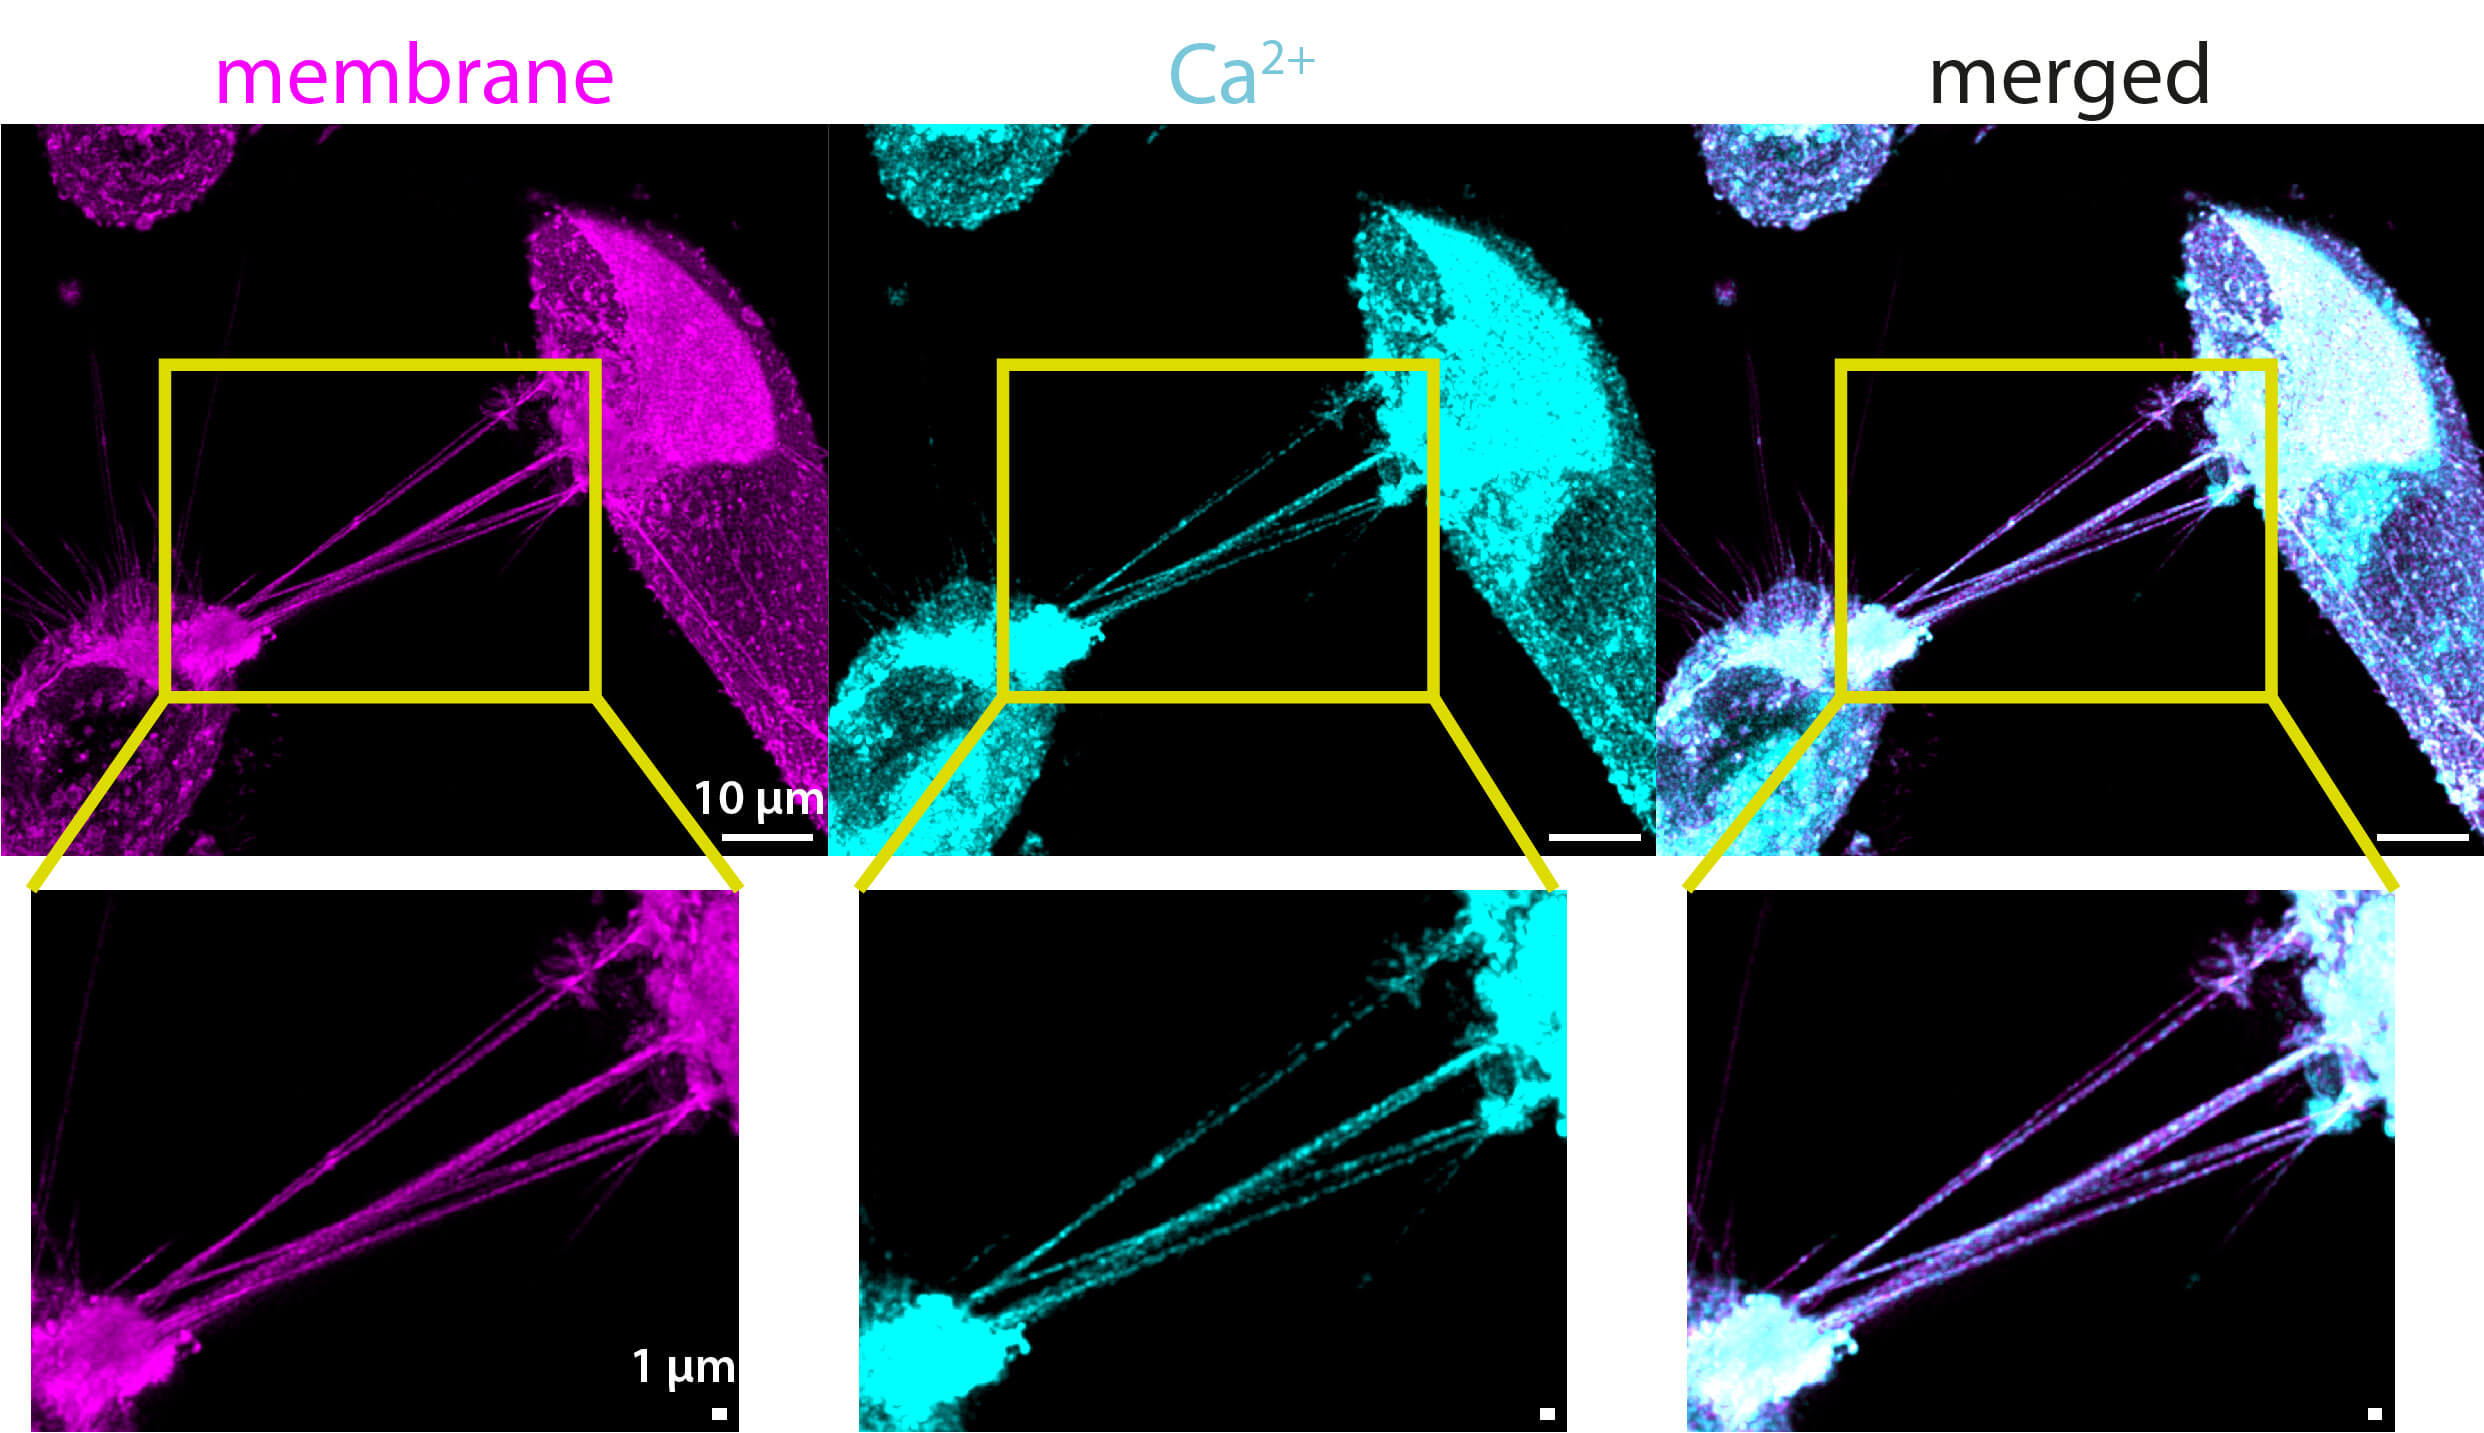 Fig. 4.
Confocal images (maximum projections) of TNTs in unirradiated U87 MG cells containing Ca2+ (cyan). The cells were co-stained with CellMask™ Green Plasma Membrane Stain (magenta) and BioTracker™ 609 Red Ca2+ AM (cyan). The two acquired channels (membrane and calcium) are shown, along with the merged image on the right. Magnifications below allow for a closer look at the TNTs. Calcium is distributed along the entire length of the TNTs, appearing more prevalent at the points where they are thicker. The calcium signal inside the TNTs is weaker than the membrane signal, and the signal strength varies between the TNTs. In this example, all TNTs contain calcium. The full z-stack is provided in the supplementary material (see Supplementary Fig. 6). Scale bars: 10 µm for the overview images and 1 µm for the magnifications.
To investigate the presence of mitochondria in the TNTs of unirradiated LN229 cells, one experiment with one sample was performed. The mitochondria were labeled with TMRE, which accumulates at the negative potential of the mitochondrial membrane, and therefore, the localization of the dye is very selective for mitochondria. Mitochondria were found in the TNTs (see yellow arrows in Figs. 5,6) and filopodia (see Supplementary Fig. 5) of LN229 cells. Filopodia are membrane structures that do not provide cell-to-cell connections and are completely located on the substrate. However, only the TNTs were considered in the analysis, not the filopodia. Only 15 out of 237 TNTs analyzed contain mitochondria, which is 6%. With the chosen microscope settings, there is no signal from the membrane in the mitochondrial channel (see Figs. 5,6). However, the mitochondrial signal is well visible in the membrane channel because the excitation and emission spectra of the TMRE (a stain for polarized mitochondria) overlap with the selected excitation wavelength and detector range of the CellMask™ Green Plasma Membrane Stain. Nevertheless, since no membrane signal was seen in the mitochondrial channel (see Figs. 4,5), it can be concluded that the identified mitochondrial signal is from polarized mitochondria, i.e., from intact mitochondria that retain membrane potential.
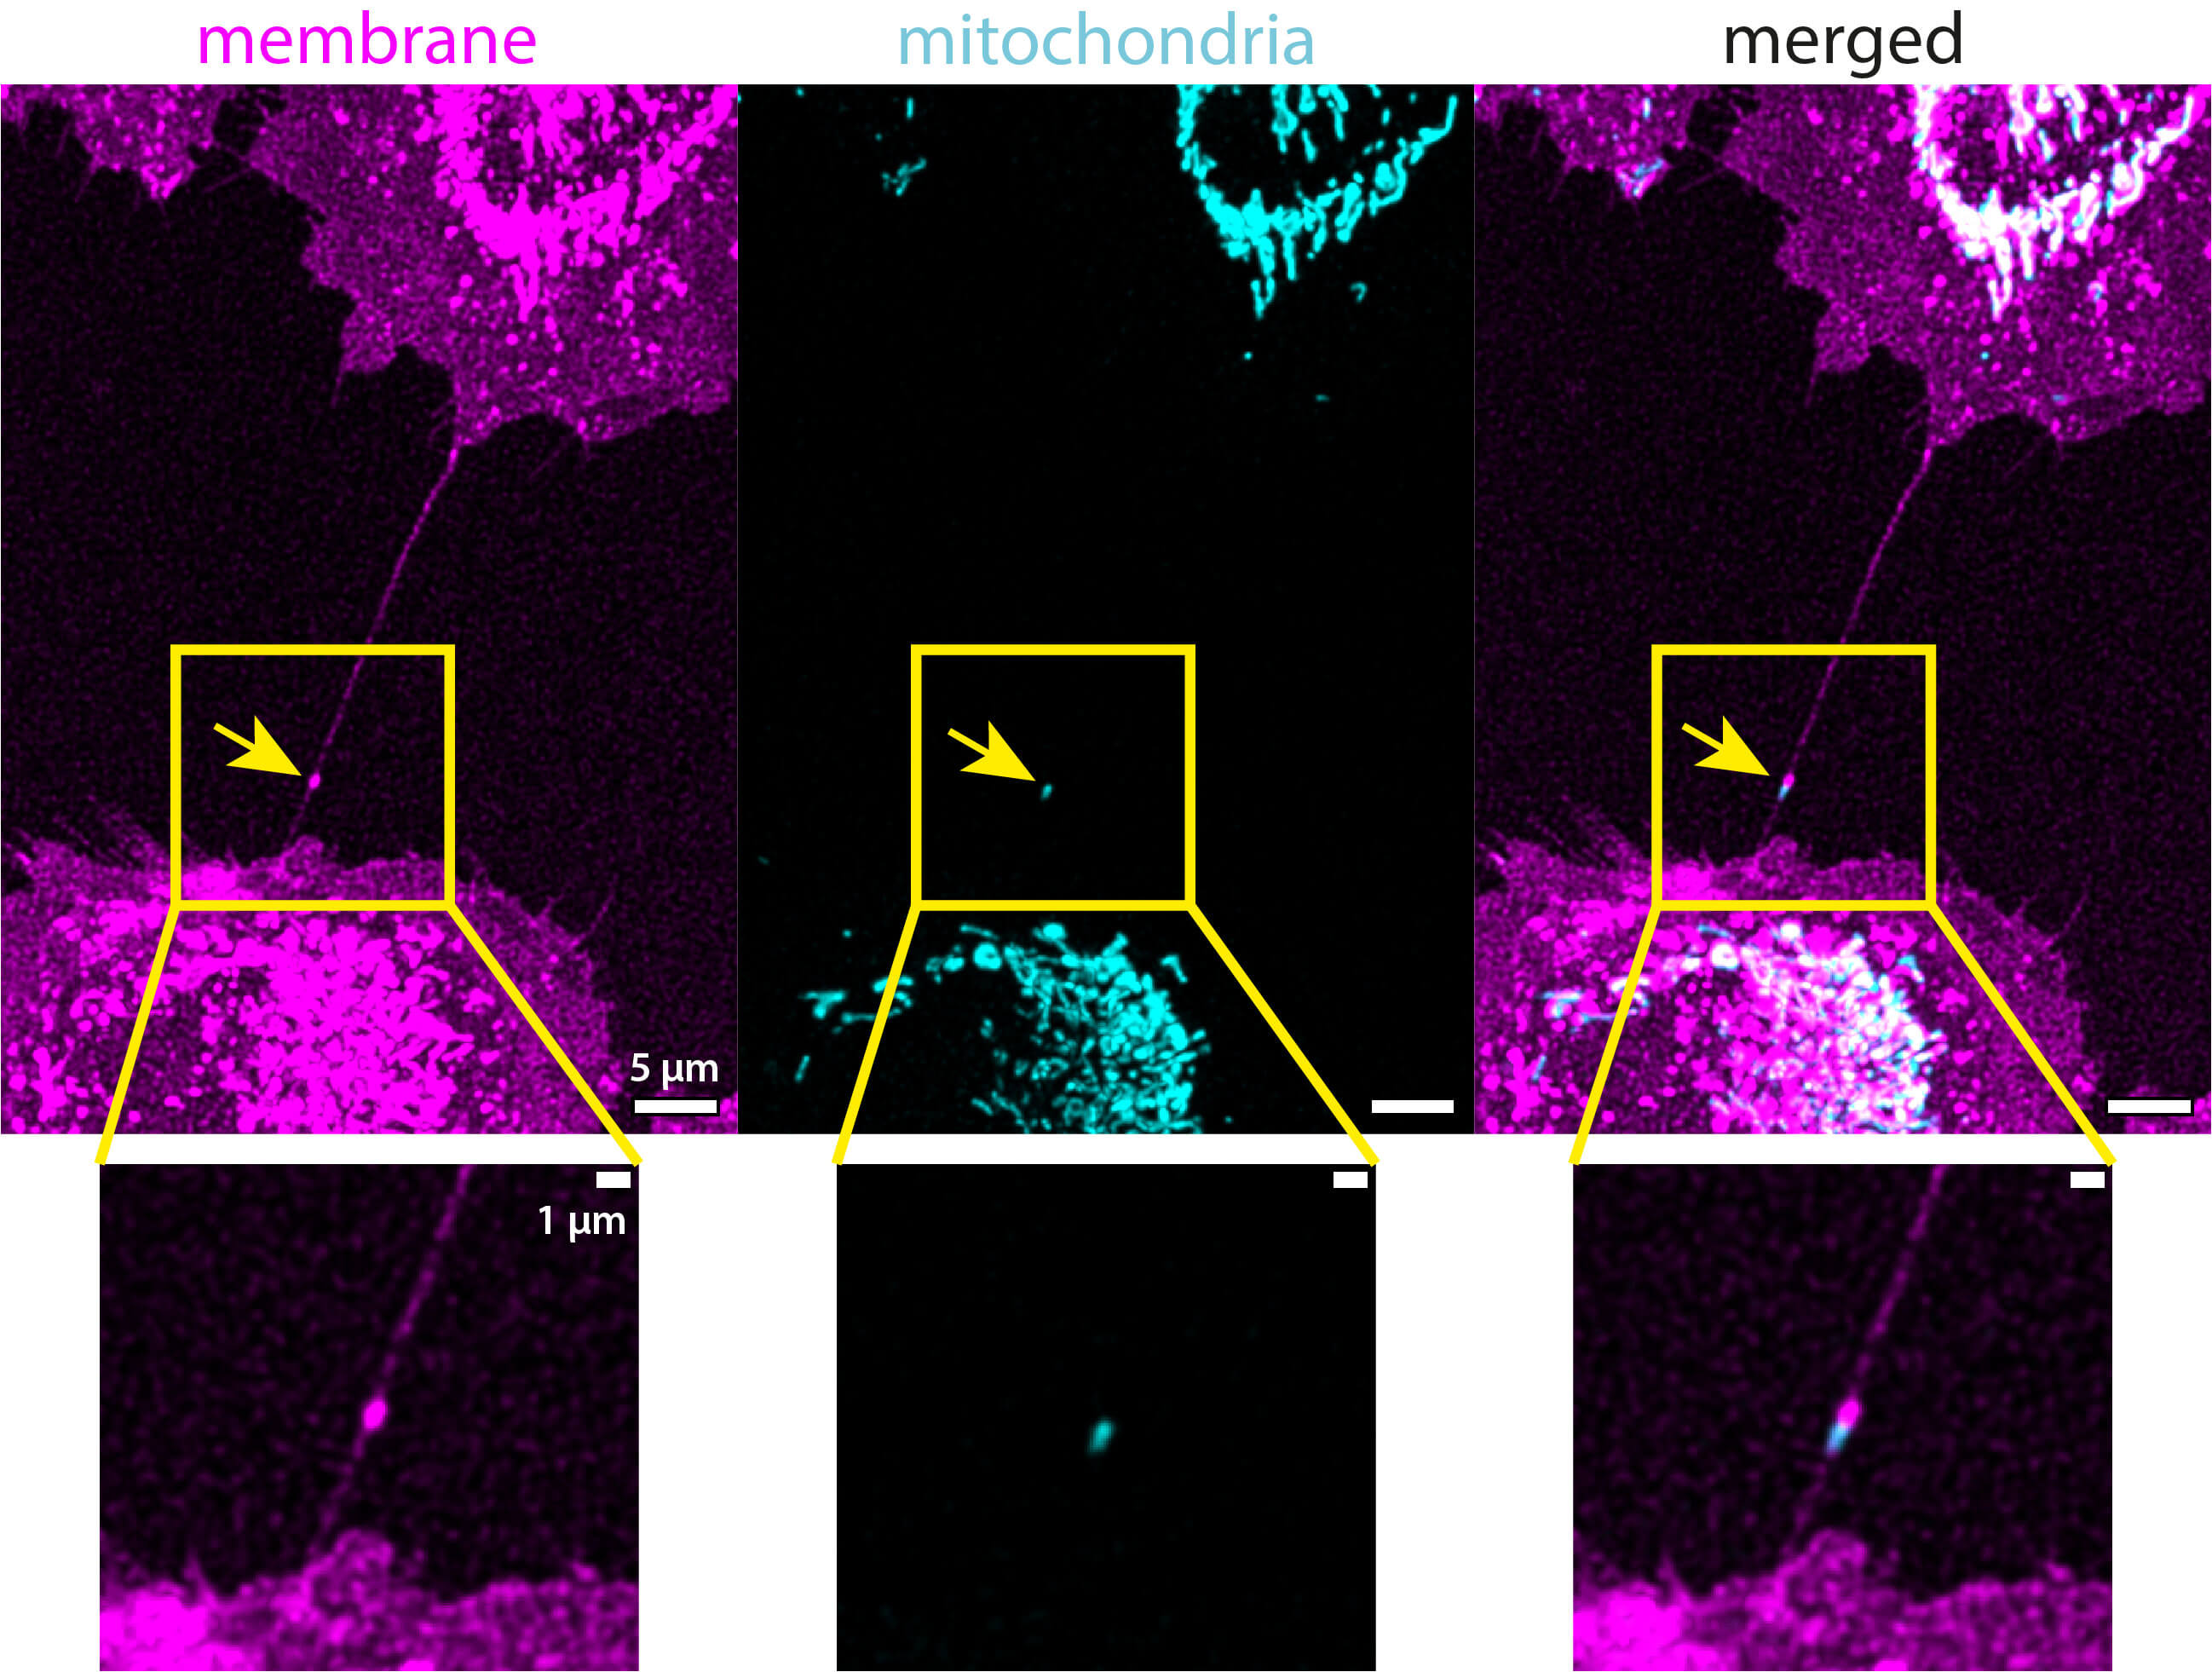 Fig. 5.
Confocal images (maximum projections) of a TNT containing mitochondria in unirradiated LN229 cells that were co-stained with CellMask™ Green Plasma Membrane Stain (magenta) and TMRE (cyan). The two acquired channels (membrane and mitochondria) are shown, along with the merged image on the right. Magnifications below allow for a closer look at the TNTs. The yellow arrows indicate the position of the mitochondrial signal in the TNT. The mitochondrial spot is shifted toward the spot visible in the membrane channel. This is due to the temporal shift of about 30 seconds between acquiring both channels, which was caused by sequential imaging. The full z-stack is provided in the supplementary materials (see Supplementary Fig. 7). Scale bars: 5 µm for the overview images and 1 µm for the magnifications.
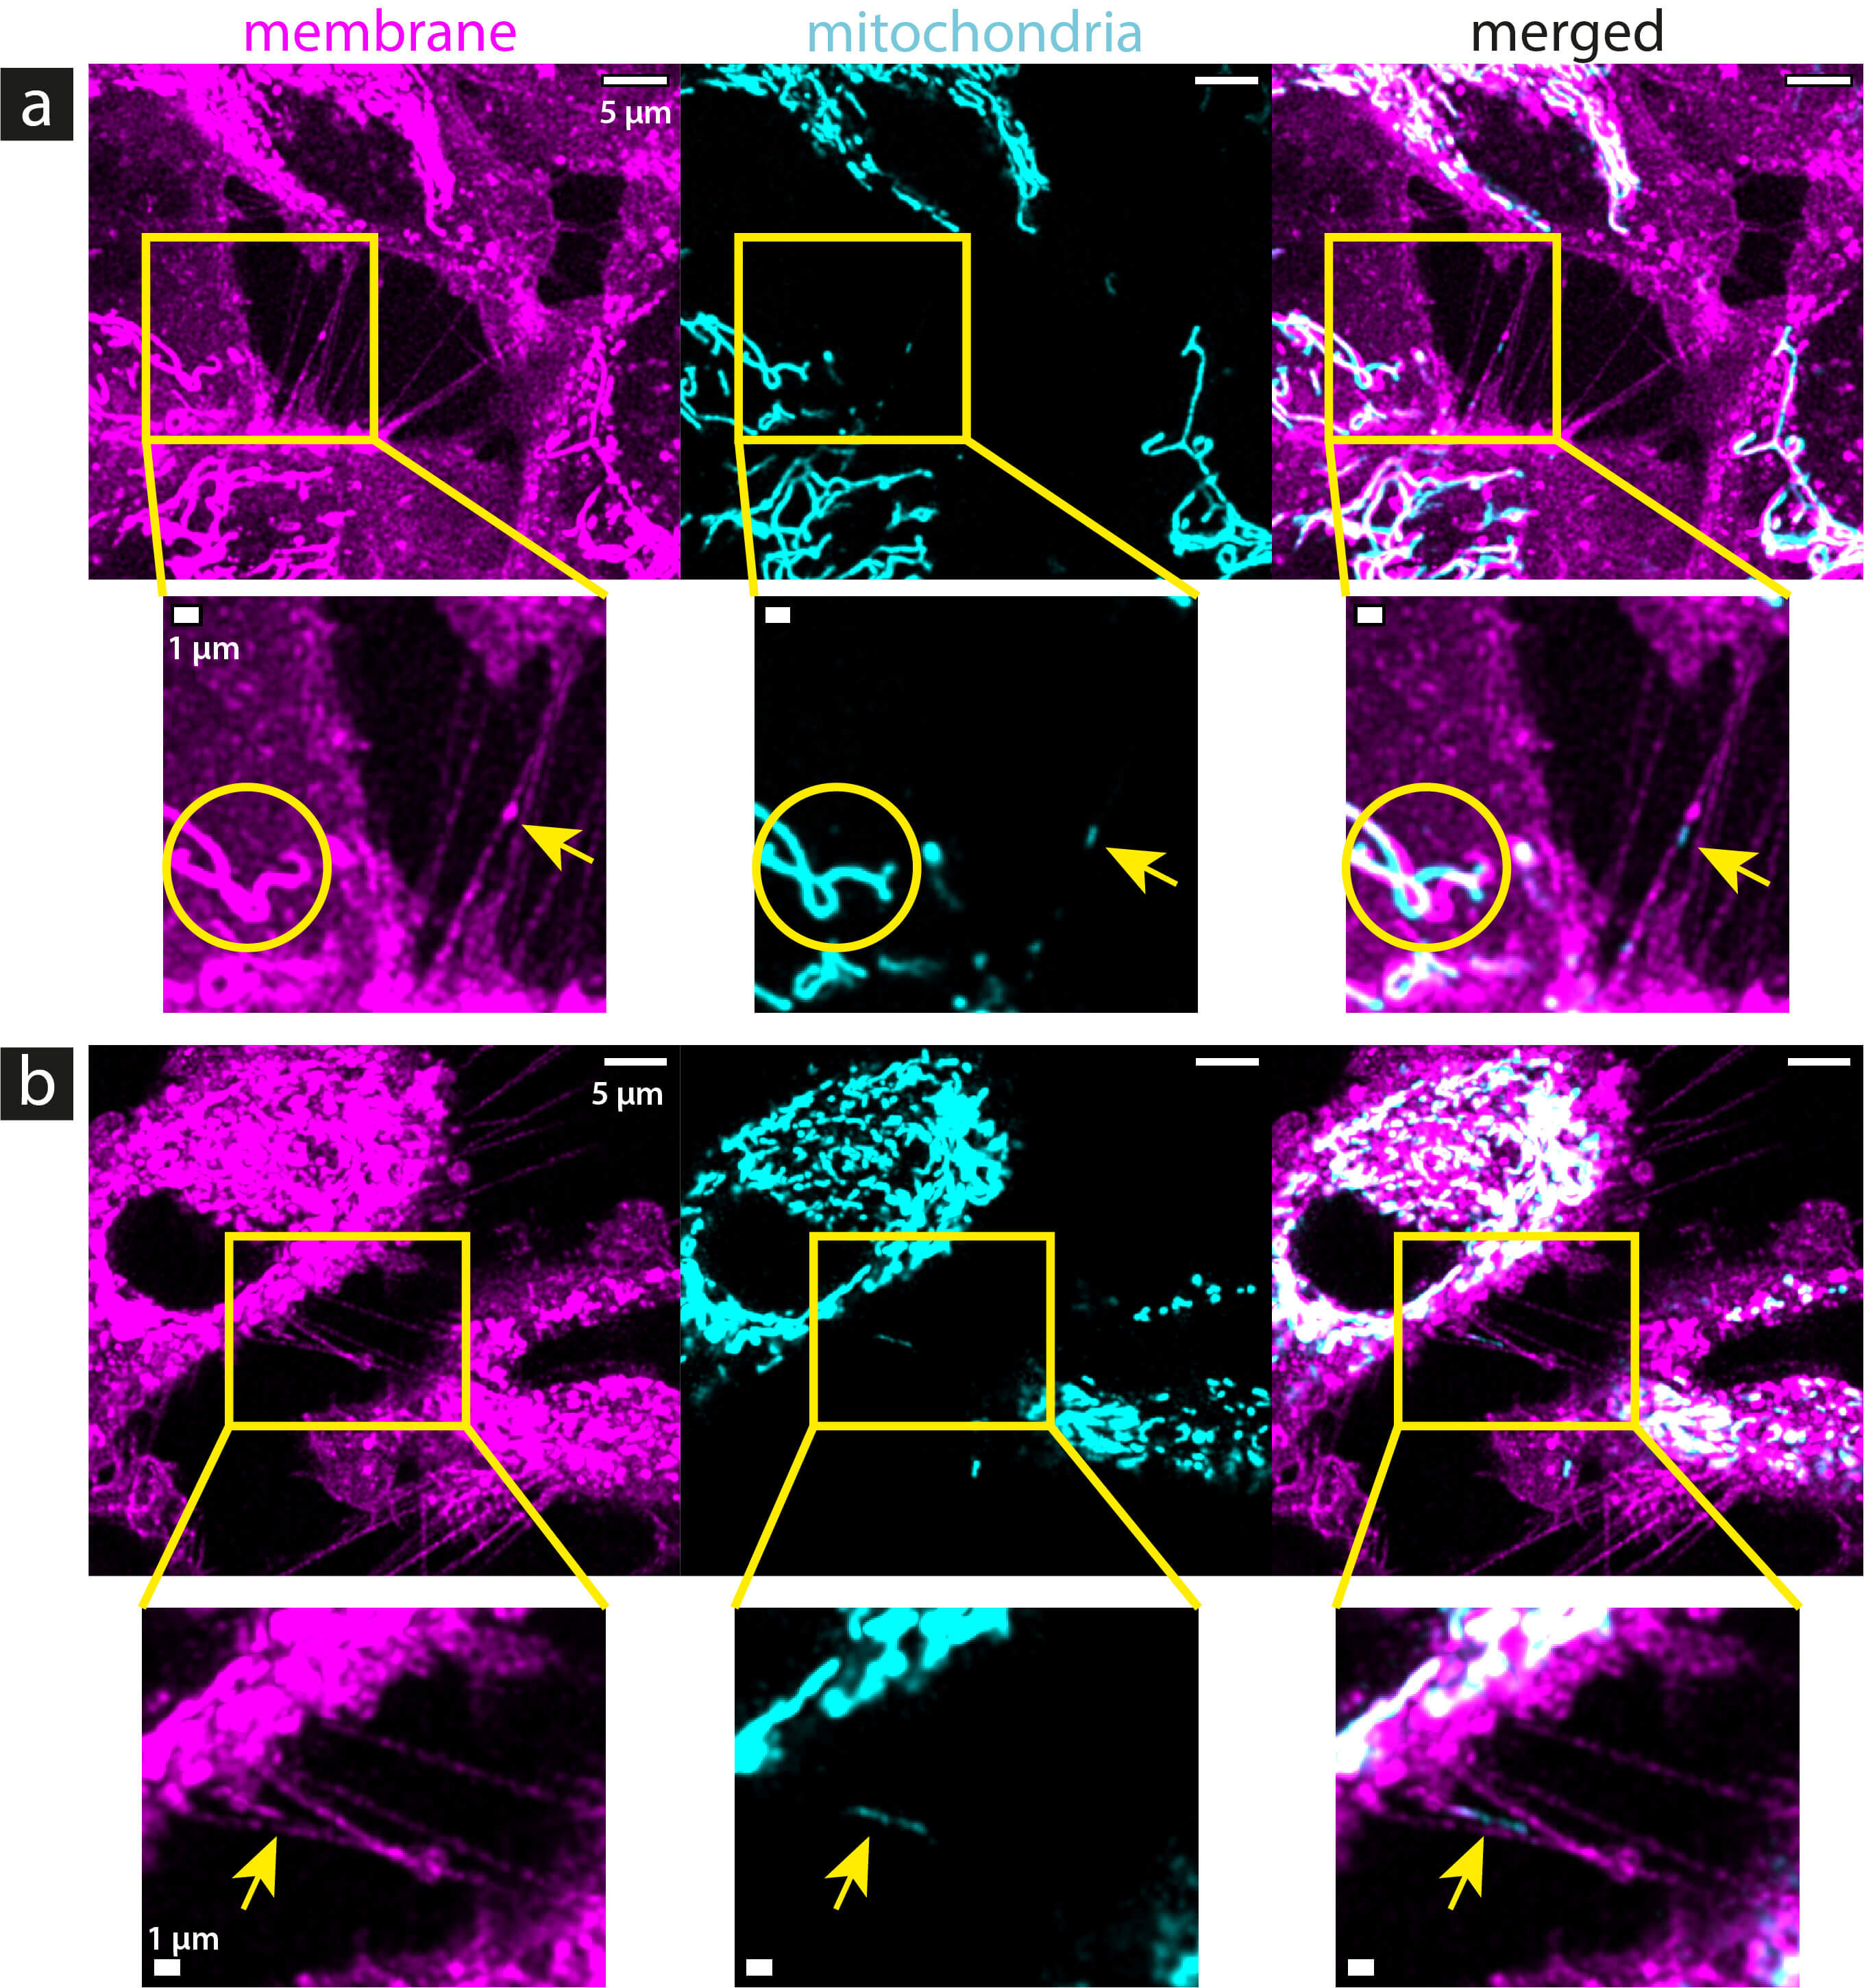 Fig. 6.
Confocal images (maximum projections) of mitochondria inside TNTs in unirradiated LN229 cells that were co-stained with CellMask™ Green Plasma Membrane Stain (magenta) and TMRE (cyan). (a,b) show different representative images of TNTs containing mitochondria. In (a,b), the two acquired channels (membrane and mitochondria) are shown, along with the merged image on the right. Magnifications below the respective images allow for a closer look at the TNTs. Yellow arrows indicate the positions of the mitochondrial signals within the TNTs. In most cases, the mitochondrial signal was found as concentrated spots, as seen in (a), or slightly elongated, as seen in (b). The yellow circles in (a) indicate where movement of the mitochondrial network is visible between acquisitions of the two channels due to signal overlap in the membrane channel. The mitochondrial signal is shifted towards the signal acquired in the membrane channel due to the small temporal shift (about 30 seconds). The full z-stacks are provided in the supplementary materials (see Supplementary Figs. 8,9). Scale bars: 5 µm for the overview images and 1 µm for the magnifications.
Almost all mitochondrial signals found in the TNTs were concentrated in single spots in the respective tubes (see yellow arrows in Figs. 5,6a). Only a few mitochondrial signals are slightly elongated and distributed along the tube (see Fig. 6b). The merged images show that the mitochondrial signal and the overlapping signal of the membrane channel are slightly shifted towards each other. This is probably caused by the movement of the mitochondria inside the tubes between the acquisition of the two channels, due to the sequential imaging (time shift of about 30 seconds). The yellow circles in Fig. 6a mark a position where the movement of the mitochondrial network between acquisition times is well visible. Here, the shape of the mitochondrial network has changed between the acquisition times of the two channels.
The results of the cell survival measurements are consistent with known
radiobiological models concerning the course of the survival curve (e.g.,
shoulder formation for X-ray irradiation) and higher cell survival after low-LET
X-ray irradiation than after high-LET
The TNT network results show that U87 MG cells have a significantly wider and
denser TNT network than LN229 cells. Looking at the cell populations after sham
irradiation, U87 MG cells had significantly more connected cells (two-sample
t-test, p
In a previous study [30], we characterized the TNTs of U87 MG and LN229 cells based on their dimensions and lifespans. We found that, despite having a smaller diameter (U87 MG: 197 nm; LN229: 338 nm), the TNTs of U87 MG cells are twice as long, with a mean length of 40 µm, and have a mean lifetime of 88 minutes, which is twice that of the TNTs of LN229 cells (mean lifetime: 41 minutes). Thus, it appears that U87 TNTs are more stable than LN229 TNTs. This could explain why U87 cells have denser TNT networks with more cell-to-cell connections than LN229 cells. One possible reason for the greater stability of the TNTs in U87 MG cells is that they may have a greater lipid and cytoskeleton reservoir. This would make the TNTs more flexible, allowing them to shrink and expand more dynamically than in LN229 cells, as discussed in the previous study [30]. However, this hypothesis must be proven by first ascertaining TNT stability in cells through elastic measurements using optical tweezers.
Although the TNT networks differ significantly between LN229 and U87 MG cells, the TNT networks of both cell lines show the same response to X-ray irradiation. In both cell lines, a significant increase in TNT network formation was observed 10 hours after irradiation with a dose of 1.8 Gy. Compared to the sham-irradiated samples, the irradiated samples of both cell lines have more connections per cell at this time point. The number of cells connected by TNTs is also increased in both cell lines in irradiated samples at this time point, significantly in LN229 cells and tending to increase in U87 MG cells. The complexity of the TNT networks is also higher in the irradiated samples, as there are more highly connected cells.
An increased or accelerated formation of TNT networks has also been observed in
U87 MG cells after irradiation with high-LET
Both low- and high-LET radiation appear to stimulate the formation of TNT
networks and enhance cellular communication via TNTs. This increase is measurable
within 6 to 10 hours post-irradiation. In irradiated cells, an additional
mechanism that is inactive in sham-irradiated cells seems to accelerate TNT
network development. This accelerated TNT formation likely helps irradiated cells
manage radiation stress and activate survival pathways. The extent to which TNT
communication is enhanced probably depends on the radiation dose. In this X-ray
study, TNT network formation was higher at a lower radiation dose (1.8 Gy)
associated with 50% cell survival. In contrast, the higher dose (3.9 Gy)
resulted in a limited or no significant increase in TNT formation compared to the
sham-irradiated controls. One possible explanation for this observation might be
that a higher dose results in more apoptotic cells, which may focus primarily on
repairing damage. In contrast, lower doses result in less damage, enabling the
cells to interact and support one another more effectively. The applied radiation
dose is a known factor that influences cell fate decisions, including apoptosis
and necrosis [33]. Additionally, cellular communication effects, such as
bystander effects, are more associated with lower doses [34]. However, the above
hypothesis remains to be confirmed by quantifying apoptotic cell populations and
assessing DNA repair capacity at given doses using methods such as caspase
3/7-Sytox assays and
Furthermore, the type of radiation also appears to be relevant. Irradiation with
high-LET
24 hours after irradiation, TNT networks in irradiated cells still tended to be
increased, compared to TNT networks in sham-irradiated cells. In the
In this study, additional co-staining experiments with unirradiated cells were performed to identify cargoes that can be transported by TNTs and to gain insight into the extent to which TNT-mediated cellular communication could contribute to tumor cell survival. Here, the presence of two important cargoes, calcium and mitochondria, was detected in the TNTs of glioblastoma cells.
Ca2+ was frequently found in the TNTs of U87 MG cells, as more than 2/3 of the analyzed TNTs contained Ca2+. Therefore, it can be assumed that calcium can be distributed via TNT networks. Calcium is a very important secondary messenger that regulates a variety of physiological cellular effects. For example, calcium plays a critical role in cell migration and thus in cancer metastasis [37]. During cell migration, Ca2+ signaling regulates both adhesion to the extracellular matrix and remodeling of the cytoskeleton. The locomotion and thus the change in direction of cell migration are determined by the cytosolic calcium gradient within a cell. In a migrating cell, the cytosolic calcium concentration is low at the leading edge and high at the trailing edge. Studies have shown that Ca2+ signaling is related to the invasiveness of glioblastoma and that there are some therapeutic approaches targeting Ca2+ signaling in this context, as reviewed by So et al. [38]. Due to the multitude of calcium-dependent signaling cascades that regulate a wide range of cellular processes, from cell migration to cell synchronization [39] and cell proliferation [40], the calcium homeostasis of a cell requires precise regulation, and the calcium signal must be specifically encoded. The spatial and temporal characteristics of calcium production are the primary means of this encoding. The distribution of calcium along the TNT network could help to maintain the homeostasis of intracellular calcium levels. It has been observed that the intracellular calcium level increases in a dose-dependent manner shortly after radiation exposure and is therefore thought to be an early response to radiation [41]. However, the Ca2+ response is likely to be cell-type dependent as well as radiation-type dependent. Furthermore, it is strongly suspected that Ca2+ contributes to radiation-induced bystander effects [41]. An increased intercellular Ca2+ level can lead to cell apoptosis and is required for several cytotoxic effects caused by chemotherapeutic agents and radiation [42]. In this context, a distribution of calcium within TNT networks may promote both the guidance of tumor cells to the surrounding tissue, which is not or less radio-treated, and thus escape the radio-treatment, and the adaptation to the radio-induced effects by distributing lethal levels of calcium.
Furthermore, it has been demonstrated that calcium regulates glioblastoma tumor growth and survival [43, 44]. The impact of calcium waves on the growth and resistance of glioblastoma tumors has been studied in particular by examining cellular communication networks established by microtubes (MTs) [16, 45]. These MTs are membrane tunnels that are similar to TNTs, but thicker in diameter. Rhythmic Ca2⁺ oscillations propagated through these MT networks and, similarly, through the TNT networks could synchronize damage responses or cell-cycle checkpoints. Thus, the network could optimize repair and survival collectively, bringing cells into a more damage-tolerant, radiation-resistant state before the next radiation treatment [46]. However, quantifying how much radioresistance is specifically due to calcium transfer versus other cargo, such as mitochondria, remains elusive.
In addition to calcium, mitochondria were also localized in the TNTs of LN229 cells. In contrast to the calcium signal, functional mitochondria were often found concentrated at single spots in the tubes. This suggests that mitochondria are only occasionally exchanged across the TNTs. This conclusion is also supported by the fact that only approximately 6% of the TNTs analyzed contained mitochondria. Several reports have demonstrated that damaged cells can be rescued by the exchange of functional mitochondria across TNTs [14]. Furthermore, it has been reported that mitochondrial transfer along TNTs increases invasiveness in bladder cancer cells [47] and promotes chemoresistance when mitochondria were transferred between endothelial cells and cancer cells [48]. These findings and the fact that mitochondria were detected in TNTs in LN229 cells in this study suggest that mitochondrial transfer leading to TNT-associated therapy resistance effects is a critical research topic. In the recorded images, it can be seen that the mitochondria move inside the TNTs due to the time delay between the sequential imaging and the crosstalk of the mitochondrial signal into the membrane channel. No strong thickening or even gondolas (i.e., large membrane bulges containing cytoplasm and other substances) were observed at the positions where the mitochondria were detected in the tubes. This observation, together with the infrequent occurrence of gondolas in the TNTs of U87 MG and LN229 cells [30], suggests that this transport mechanism likely plays a minor role in cellular communication via TNTs in glioblastoma cells. One limitation of this study is that video microscopy was not performed to track calcium and mitochondrial transfer in the TNTs. However, it is important to determine if mitochondria and calcium are actively transported from one cell to another. In this context, determining the transport velocity is essential for identifying possible transport mechanisms, such as molecular motors.
In this study, calcium and functional mitochondria were detected in TNTs in cells that had not been irradiated. However, it is necessary to determine whether these types of cargo are also present in TNTs of irradiated cells and whether the transfer of these cargoes is more pronounced after irradiation. Furthermore, the analysis of mitochondrial transfer was performed only once to demonstrate qualitatively that mitochondria can be detected in TNTs. However, in order to compare the number of TNT-containing mitochondria in irradiated versus unirradiated cells, more replications would be necessary to strengthen this finding and obtain sufficient statistics for prospective comparisons.
Additionally, a key remaining question is the extent to which TNT-mediated cellular communication contributes to non-targeted effects. These effects include the bystander and rescue effects, which may be responsible for the development of treatment resistance. Co-culture experiments could provide more insight into communication between irradiated and non-irradiated cells. Such experiments could address interesting questions, such as which type of cell (irradiated or non-irradiated) communicates more via TNTs. One could also investigate whether non-irradiated cells primarily communicate with other non-irradiated cells, thereby isolating the irradiated cells, or if they attempt to establish TNT connections with irradiated cells to help them recover from irradiation. To answer these questions, the number of TNT connections between irradiated and non-irradiated cells, as well as within each group, must be determined. In these types of experiments, appropriate video microscopy techniques could be used to observe the transfer of cargo and thereby determine how many mitochondria are transferred from non-irradiated cells to irradiated cells, for example, or the propagation of calcium flux along the TNT network. In the latter case, the targeted irradiation of individual cells may be advantageous. Such experiments would allow for a more detailed exploration of the functional implications of cargo transfer via TNTs and, therefore, the functional significance of cargo transfer in the radiation response.
Another interesting follow-up project would involve targeted functional studies in which cellular communication via TNTs is blocked by an appropriate TNT inhibitor. In a previous study, we demonstrated that the actin polymerization inhibitor cytochalasin B reduces cell connectivity via TNTs, with a greater effect at higher concentrations [49]. The general TNT inhibition by actin polymerisation inhibitors such as cytochalasin B and cytochalasin D was also demonstrated in other cell lines [50, 51]. However, since cytochalasin B and other inhibitors that affect the cytoskeleton strongly impact overall cellular behavior, including cell division, morphology, and migration, we believe these substances are not suitable for TNT inhibition in further research. Identifying specific TNT-related genes and molecular regulators required for TNT formation, stability, and cargo transfer will be key to finding or developing a non-toxic, specific TNT inhibitor. Genetic knockdown of these TNT-related genes could provide evidence of the biological relevance of TNT networks in the radiation response of glioblastoma.
This study demonstrates that exposure to clinically relevant X-ray doses (1.8 Gy, corresponding to 50% cell survival) increases the connectivity and complexity of TNT networks in glioblastoma cells. This effect was most pronounced approximately 10 hours post-irradiation, as evidenced by a higher number of connected cells, more connections per cell, and a greater proportion of highly connected cells linked to at least two other cells. Although a higher X-ray dose (3.9 Gy, corresponding to 10% cell survival) showed a similar trend, the increase was less pronounced.
By comparing these findings with those of our previous study on high-LET
The radiation-induced enhancement of TNT networks may help cells to survive radiation stress, coordinate migratory escape, or distribute resistance factors among surviving cell populations. Our co-staining experiments identified frequent Ca2⁺ signaling within TNTs in U87 MG cells and occasional mitochondrial localization within TNTs in LN229 cells. Ca2⁺ signals are important for guiding cell migration, and mitochondria are key cargoes responsible for the observed rescue effects in cell populations. Consequently, both types of cargo may contribute to treatment resistance. Together with the pronounced TNT network formation after radiation treatment, these findings strongly indicate that TNT-mediated cellular communication is a potential mechanism through which glioblastoma cells can resist radiotherapy.
Improving our understanding of how TNT-mediated cellular communication influences glioblastoma cells’ response to therapeutic approaches, particularly radiation treatment, could reveal the key mechanisms underlying therapy resistance. Identifying these mechanisms could lead to radiation therapy strategies that are tailored to each individual tumor. Further research into the molecular pathways by which radiation induces TNT formation is essential for optimizing treatment methods for aggressive cancers.
TNT, tunneling nanotube; TNTs, tunneling nanotubes; DMEM, Dulbecco’s Modified Eagle Medium; FCS, fetal calf serum; CFA, colony formation assay; HBSS, Hanks’ Balanced Salt Solution; TMRE, tetramethylrhodamie; CMLE, classic maximum likelihood estimation; ROS, reactive oxygen species; DSBs, double strand breaks; SSBs, single strand breaks; MT, microtube; MTs, microtubes.
All data reported in this paper will also be shared by the lead contact upon request.
NM and JR conceptualized the experiments. NM, JN, SR, and JR performed the CFA experiments. NM performed the TNT network analysis experiments and the co-staining experiments. NM evaluated and analyzed the data concerning cell survival, TNT network analysis, and co-staining. NM prepared the figures. NM and JR discussed the data. NM and JR performed validation. NM wrote the manuscript. JN, SR, and JR reviewed and edited the manuscript. JR supervised the research. JR acquired funding. JR provided resources. All authors contributed to editorial changes in the manuscript. All authors read and approved the final manuscript. All authors have participated sufficiently in the work and agreed to be accountable for all aspects of the work.
Not applicable.
We thank Asieh Amarlou and Florian Rüdele for their invaluable assistance in our laboratory throughout their internship and bachelor’s thesis work, respectively.
This research was funded by the EU transnational access program RADIATE (grant number 824096) and the BMBF-funded project: ErUM-IFT (grant number 05D23WN1). We acknowledge financial support by Universität der Bundeswehr München.
The authors declare no conflict of interest.
During the preparation of this work, the authors used DeepL (version 25.9.2.18380+7ec3518012ed33fa70aec0ff6c7d297fab0c386f), Grammarly (version v1.2.203.1770), and ChatGPT (version 5) to check spelling and grammar. After using these tools, the authors reviewed and edited the content as needed and take full responsibility for the content of the publication.
Supplementary material associated with this article can be found, in the online version, at https://doi.org/10.31083/FBL47233.
References
Publisher’s Note: IMR Press stays neutral with regard to jurisdictional claims in published maps and institutional affiliations.