


1 Department of Medical Biology, Amsterdam Cardiovascular Sciences, Amsterdam University Medical Center, University of Amsterdam, 1105 AZ Amsterdam, The Netherlands
Abstract
Long-QT syndrome type 2 (LQTS2), which is associated with life-threatening cardiac arrhythmias, is caused by pathogenic heterozygous loss-of-function mutations in the KCNH2 gene. This gene encodes the pore-forming Kv11.1 α-subunit of the ion channel that carries the rapid delayed rectifier potassium current (IKr). Pathogenic loss-of-function mutations reduce the amplitude of IKr, thereby prolonging the action potential (AP) of ventricular cardiomyocytes, and in turn, the QT interval of the electrocardiogram (ECG). The aim of the present in silico study was to test the extent to which allele-specific suppression (‘silencing’) of the mutant KCNH2 allele can alleviate the effects of dominant-negative LQTS2 mutations.
Two recent and comprehensive models of the electrical activity of a single human ventricular cardiomyocyte, i.e., the ‘Bartolucci–Passini–Severi model as published in 2020’ and the ‘Tomek–Rodriguez model following the O’Hara–Rudy dynamic (ORd) model’ (known as the BPS2020 and ToR–ORd models, respectively) were used to assess the effects of mild and severe LQTS2 mutations on the AP duration at 90% repolarization (APD90) and the APD90 restitution obtained with an S1-S2 pacing protocol.
For severe mutations, the mutation-induced prolongation of the APD90 at a stimulation rate of 1 Hz is reduced from 166% to 99% in the BPS2020 model and from 111% to 71% in the ToR–ORd model upon 70% suppression of the mutant allele. For mild mutations, this prolongation is reduced from 77% to 44% and from 57% to 34%, respectively. An even greater effect is observed when the mutant KCNH2 allele is inhibited by up to 90%, but the greater suppression is only marginal for mild mutations. The steepness of the mutant APD90 restitution curves is considerably reduced upon suppression, which may exert an anti-arrhythmic effect.
Silencing of the mutant allele can substantially, but only partially, counteract the effects of mild or severe LQTS2 mutations on IKr. Allele-specific inhibition of the mutant KCNH2 allele alone is not sufficient to fully treat the effects of LQTS2 mutations and should be accompanied by a replacement gene therapy, creating a suppression-and-replacement (“SupRep”) gene therapy.
Keywords
- heart
- human
- ventricle
- long QT syndrome
- KCNH2
- hERG
- rapid delayed rectifier potassium current
- mutations
- cardiac cellular electrophysiology
- computer simulations
Prolongation of the rate-corrected QT interval (QTc interval) on the
electrocardiogram (ECG) may be related to numerous factors and is associated with
an increased risk of malignant ventricular arrhythmias and even sudden cardiac
death [1]. Mutations in at least 17 genes have been associated with congenital
long-QT syndrome (LQTS), with LQTS types 1–3 accounting for the vast majority of
genotype-positive cases and having the strongest evidence as being LQTS-causative
[2]. The estimated prevalence of congenital LQTS is 1:2000 to 1:2500, but the
true prevalence may be higher because of silent mutation carriers [3]. Notably,
LQTS is a leading cause of sudden cardiac death in young, apparently healthy
individuals [3], but proper identification of family members at risk is hampered
because
Long-QT syndrome type 1 (LQTS1 or LQT1) is caused by pathogenic loss-of-function
mutations in the KCNQ1 gene, also known as KvLQT1, which
encodes the pore-forming Kv7.1
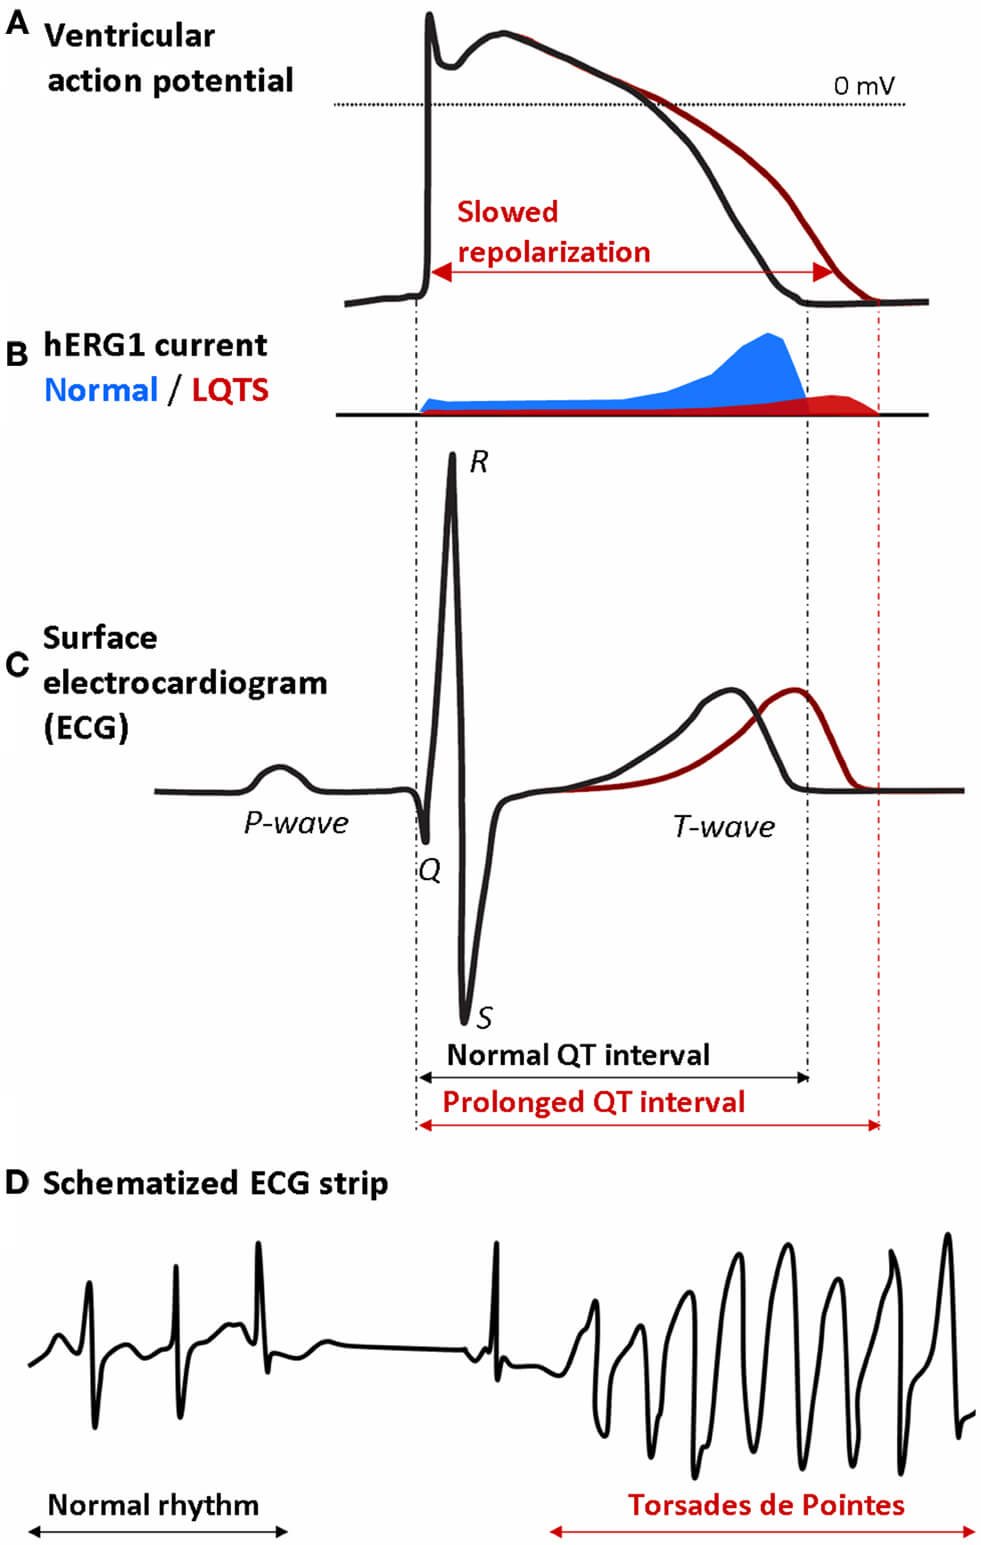 Fig. 1.
Mechanism by which a decrease in the hERG1 current (I𝐊𝐫) may lead to potentially life-threatening Torsades de Pointes in a long-QT syndrome type 2 (LQTS2) patient. (A) Prolongation of the ventricular action potential (AP) due to slowed repolarization. (B) Decrease in the hERG1 current (IKr) underlying the slowed repolarization. (C) Prolongation of the QT interval on the surface electrocardiogram (ECG) of the LQTS2 patient. (D) Onset of Torsades de Pointes: the regular rhythm is followed by a typical pause and then turns into an episode of Torsades de Pointes [7, 8]. Reproduced with permission from Grilo et al., Frontiers in Pharmacology; published by Frontiers Media S.A., Switzerland, 2010 [9].
It has been shown that mutant and wild-type Kv channel subunits randomly co-assemble into functional tetramers [10]. Thus, these tetramers would contain 0 to 4 mutant subunits according to a binomial distribution with parameters n = 4 and p = 0.5, representing all possible combinations of a total of four wild-type or mutant subunits. This explains the common dominant-negative nature of LQTS1 and LQTS2 loss-of-function mutations in the KCNQ1 and KCNH2 genes [11, 12], provided that wild-type (WT) and mutant Kv7.1 and Kv11.1 subunits are similarly translated and processed and then randomly co-assembled into tetramers [6]. Most mutations in KCNH2 result in such a dominant-negative effect, but the severity of the resulting phenotype varies widely [13]. The latter may be envisioned by only 1/16th of the channels (containing only WT subunits) being functional in the case of a severe dominant-negative mutation and 5/16th of the channels (containing at most one mutant subunit) being functional in the case of a mild dominant-negative mutation, not to mention other effects of a mutation, such as changes in channel kinetics or accelerated degradation of the wild-type subunit [14].
Recently, Cócera-Ortega et al. [15] demonstrated, both in
vitro and in silico, that the effects of LQTS1 can be alleviated by a
In the present in silico study, we assessed to which extent allele-specific suppression of the mutant KCNH2 allele per se can alleviate the effects of LQTS2, both in the case of severe dominant-negative mutations and in the case of mild dominant-negative mutations. To this end, we determined the effects of such mutations on APD90 at a stimulation rate of 1 Hz and on the APD90 restitution curve obtained with an S1-S2 pacing protocol. These effects were not only determined without silencing of the mutant allele, but also at suppression levels of 70 and 90%, and with SupRep. Computer simulations were carried out with two different recent and comprehensive models of the electrical activity of a single human ventricular cardiomyocyte, i.e., the ‘Bartolucci–Passini–Severi model as published in 2020’ [19] and the ‘Tomek–Rodriguez model following the O’Hara–Rudy dynamic (ORd) model’ [20]. These models are known as the BPS2020 and ToR–ORd models, respectively. A preliminary version of our study—using the O’Hara–Rudy human ventricular cardiomyocyte model [21], as updated with the IKr formulation by Li et al. [22] (known as the ORd 2017 model)—was presented at the Computing in Cardiology 2022 conference and published as an extended abstract [23].
The electrophysiology of an isolated human ventricular cardiomyocyte was simulated using the TP06, BPS2020, and ToR–ORd models [17, 19, 20]. For the BPS2020 model [19], we used the CellML code—CellML is a markup language for mathematical models of (sub)cellular function [24, 25, 26]—that the developers of the model made publicly available in the CellML Model Repository [27] (https://models.cellml.org/; accessed on March 4, 2025), with the default extracellular calcium concentration set to 1.7 mmol/L instead of 2.7 mmol/L (model update of November 22, 2024). For the ToR–ORd model [20], we used the CellML code made publicly available by the developers of the model on the GitHub platform (https://github.com/jtmff/torord; accessed on March 4, 2025) in an updated version, termed ToR–ORd–dynCl, with a dynamic representation of the intracellular chloride concentration. This updated model behaves very similarly to the original ToR–ORd model, but with a higher stability over long simulations [28].
For the endocardial, midmyocardial, and epicardial versions of the TP06 model [17], we started from the CellML code that was made publicly available on October 15, 2020, by Penny Noble from the University of Oxford in the CellML Model Repository (accessed on November 3, 2025). The fully-activated conductance of IKs (GKs) of the default (endocardial) version of the TP06 model [17] was scaled down by a factor of 12.5 from its value of 0.392 nS/pF in the TP06 model to 0.03136 nS/pF. The rationale for doing so is that the TP06 value of GKs is based on that in the Ten Tusscher et al. model [16], in which experimental voltage clamp data were scaled up by a factor of 12.5 before fitting the model IKs equations to these data in order to obtain specific APD90 values. Conversely, the fully-activated conductance of IKr (GKr) in the default (endocardial) version of the TP06 model [17] was scaled up by a factor of three, from 0.153 to 0.459 nS/pF, to compensate for the reduced IKs and achieve an IKr amplitude similar to that in the BPS2020 and ToR–ORd models [19, 20].
In the midmyocardial version of the TP06 model, GKr was decreased by a factor of 0.8 compared to the default (endocardial) version of the model, as in the BPS2020 and ToR–ORd models [19, 20]. Furthermore, GKs was scaled down by a factor of two, in line with electrophysiological observations [29, 30]. This factor of two differs from the factor of four used in the Ten Tusscher et al. [16, 17] and TP06 models. Ten Tusscher et al. [16] introduced the latter factor of four in order to obtain specific APD90 values. In the epicardial version of the TP06 model, GKr was increased by a factor of 1.2 compared to the default (endocardial) version of the model, similar to the BPS2020 and ToR–ORd models (GKr increased by factors of 1.1 and 1.3 in the epicardial versions of the BPS2020 and ToR–ORd models, respectively), whereas GKs was increased by a factor of 1.4 compared to the default (endocardial) version of the model, similar to the BPS2020 and ToR–ORd models [19, 20].
The CellML code of the models was edited and run in version 0.9.31.1409 of the
Windows-based Cellular Open Resource (COR) environment developed by Garny
et al. [31]. All simulations were run for a simulated period of 100 s,
which appeared to be long enough to achieve steady-state behavior under each
simulated condition. The shown data are from the final two seconds of this 100 s
period. Action potentials were elicited by a 1 ms,
Transmural conduction was studied in a heterogeneous linear strand of 600
transversally coupled human left ventricular myocytes, with the individual
myocytes described by the TP06 model [17], updated as set out above. We recently
used such a strand of TP06 myocytes in a study investigating
SCN10A-short gene therapy for restoring conduction and protecting
against malignant cardiac arrhythmias [33]. This simulated strand has a left
ventricular wall thickness of 1.2 cm (normal range 0.9–1.4 cm [34]), with the
transverse orientation of the left ventricular myocytes based on human and canine
data [35, 36]. The strand was stimulated from the endocardial side by injecting an
The transmural strand model was coded in Fortran 95 and compiled as a 32-bit Windows application using Intel Visual Fortran Composer XE 2013 (Intel Corporation, Santa Clara, CA, USA) and run on an Intel Core i7 processor-based workstation. We applied a simple and efficient Euler-type integration scheme with a 1 µs time step for numerical integration of differential equations [43]. The spatial discretization step in the strand simulations was 20 µm, i.e., the width of a single myocyte, which was treated as isopotential. Stimulus and end effects, which were restricted to no more than a few cells, were minimized by discarding data obtained from the first three and last three cells of the strand when assessing dispersion in repolarization time (RT). All simulations were run for a sufficiently long period to reach steady-state behavior.
If WT and mutant
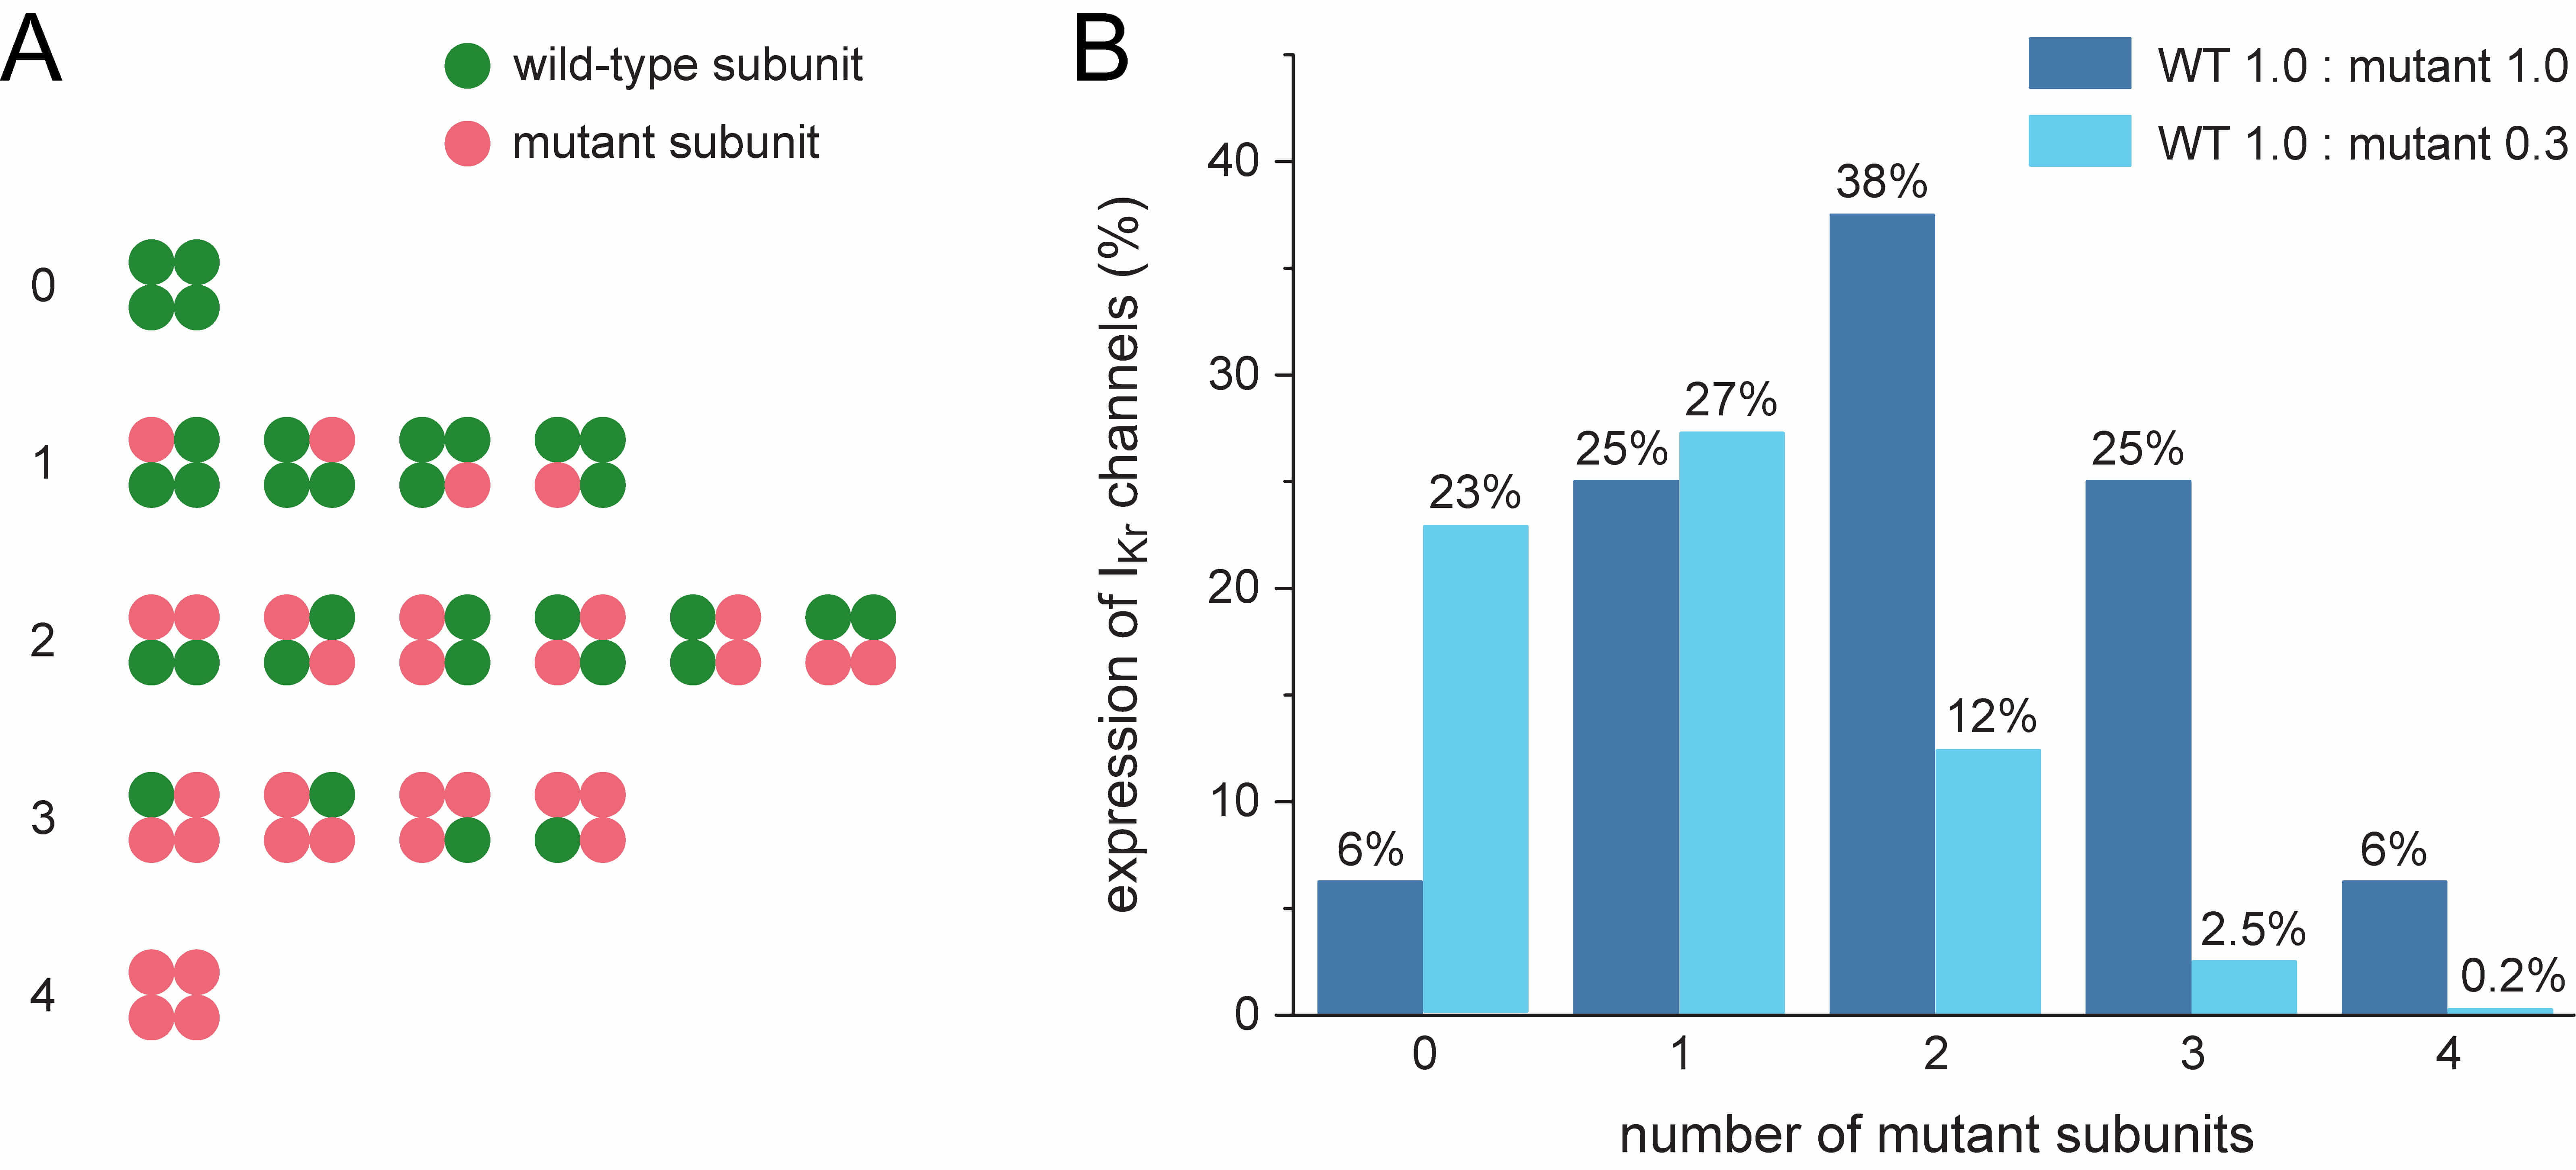 Fig. 2.
Potential ion channel configurations and effects of suppression
of the mutant allele. (A) All 16 configurations possible in the case of random
co-assembly of four wild-type and/or mutant
Allele-specific suppression of the mutant KCNH2 allele reduces the
number of mutant
As set out above, we simulated a severe dominant-negative mutation in
KCNH2 by strongly reducing the fully-activated conductance of IKr
to 1/16th (6.25%) of its control value, representing the case where only
channels composed entirely of WT
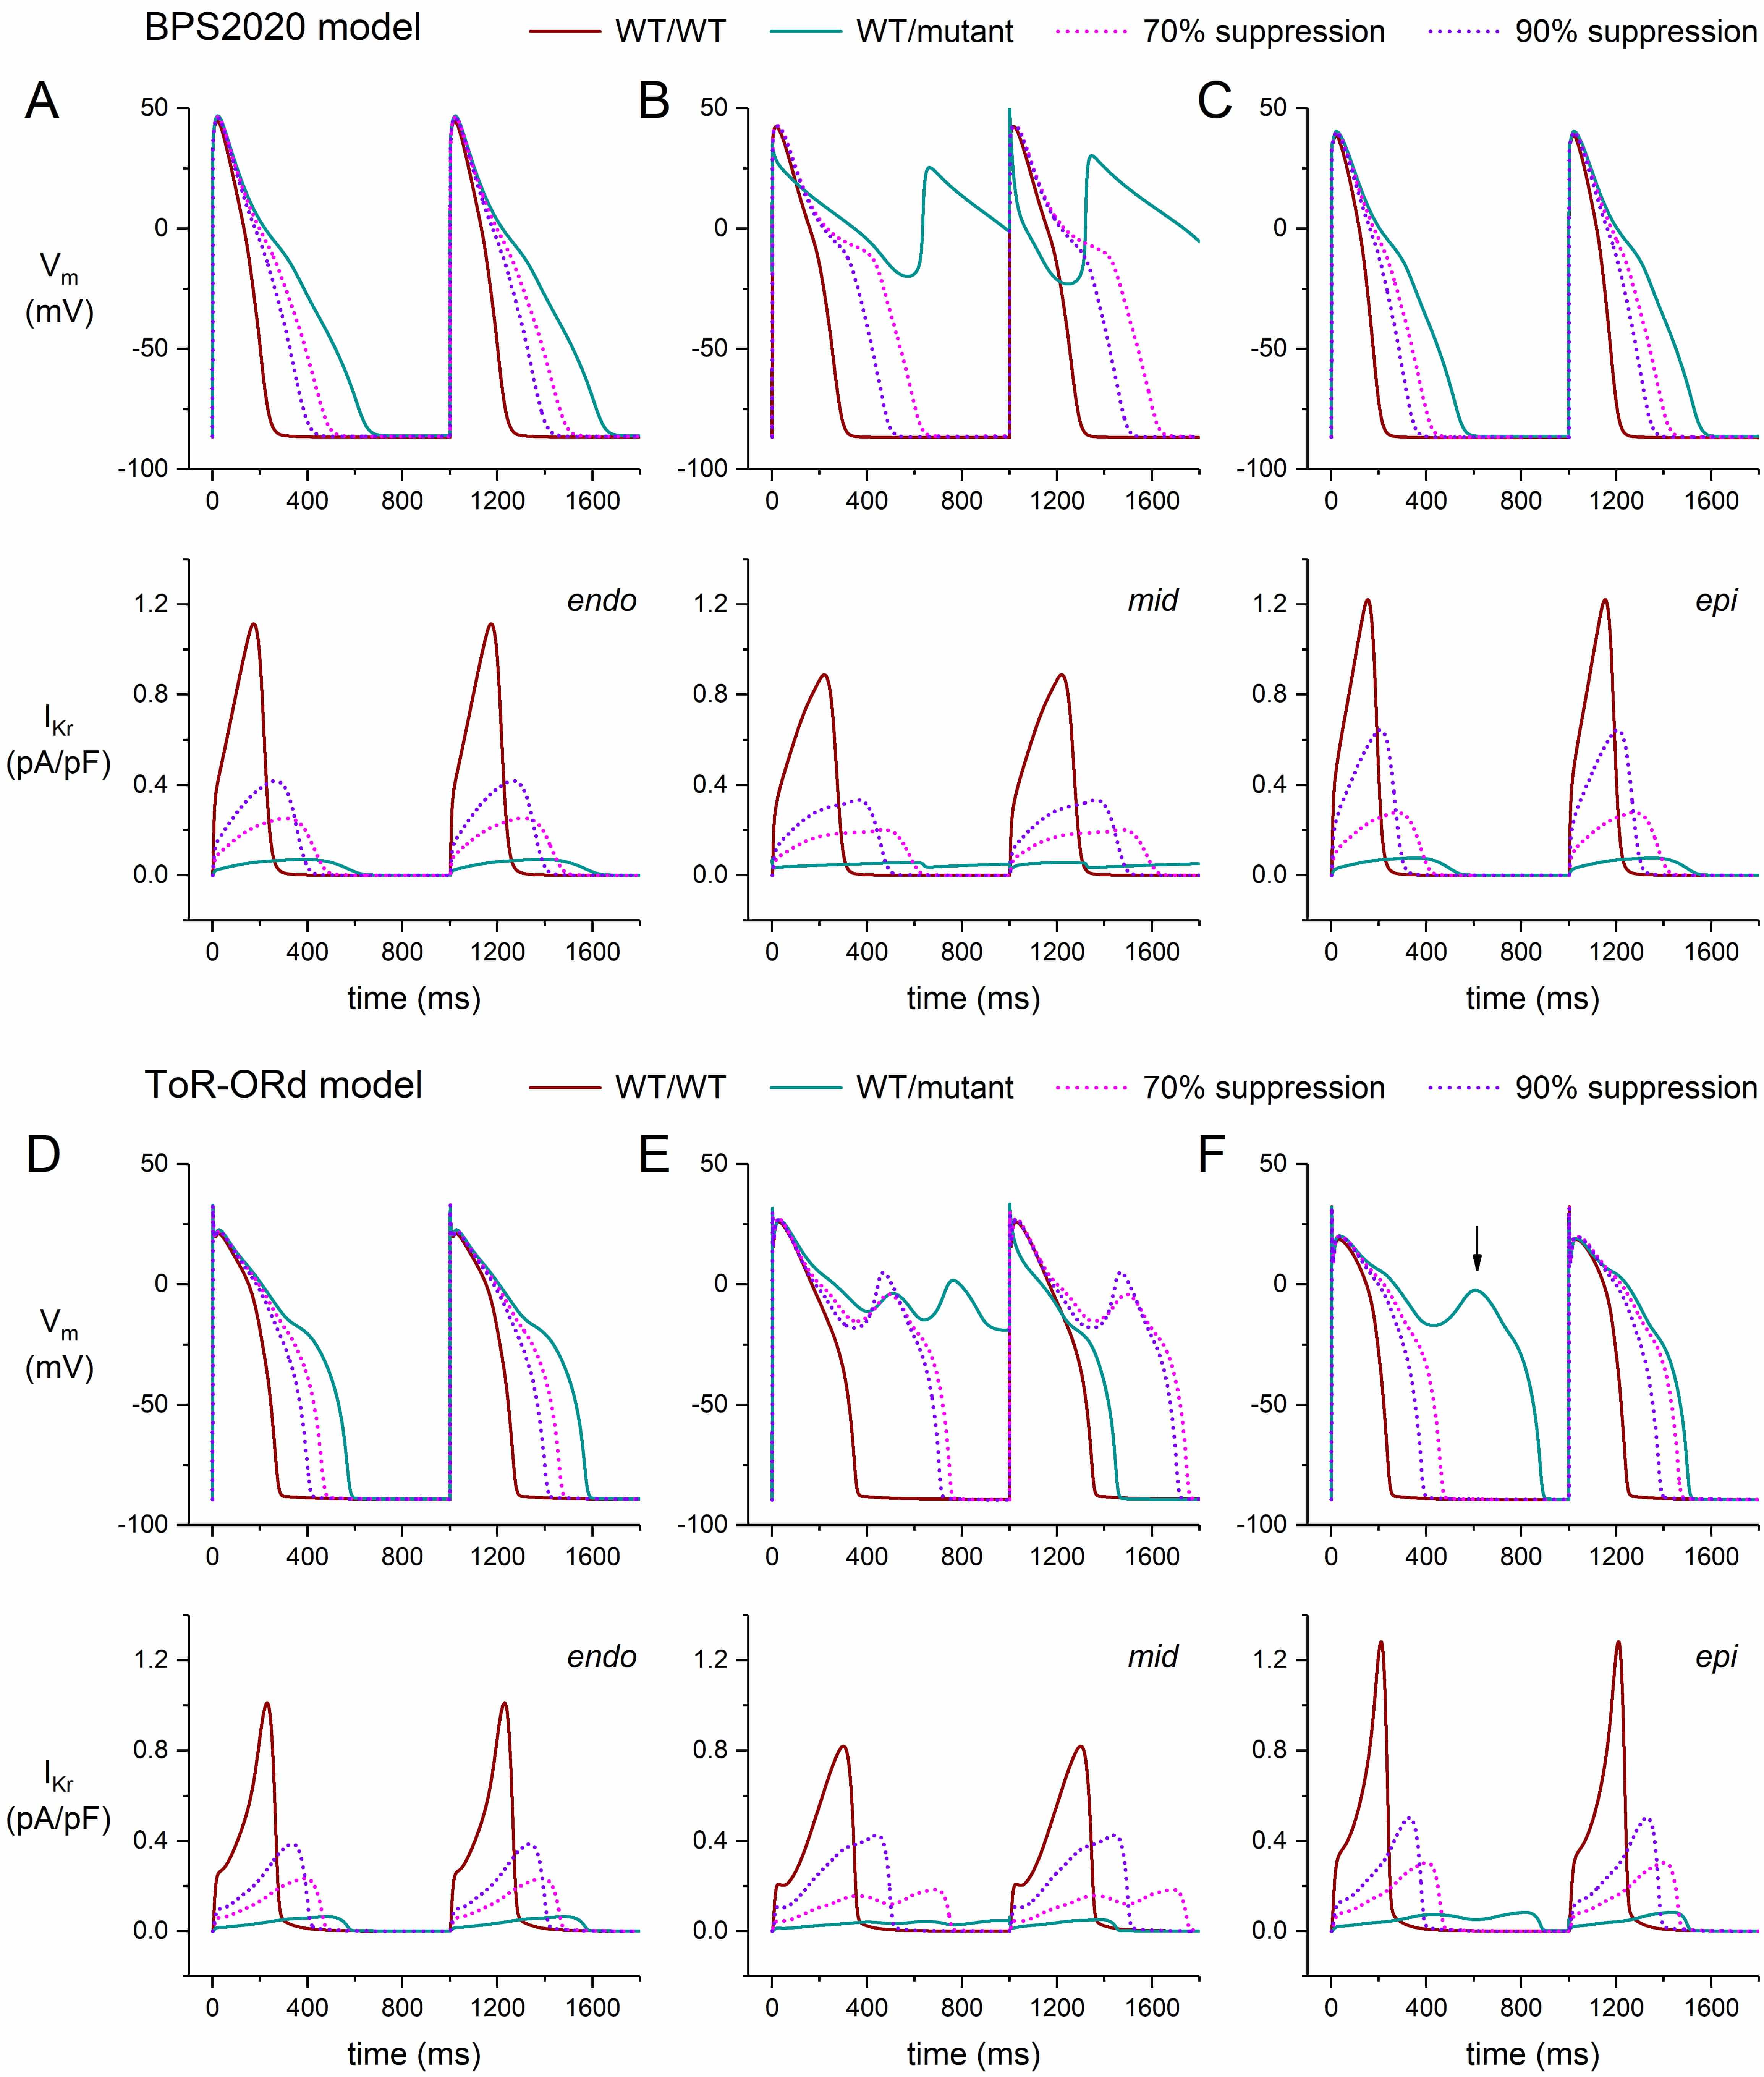 Fig. 3.
Effects of severe dominant-negative LQTS2 mutations on the
electrical activity of human ventricular cardiomyocytes, and effects of mutant
allele silencing. (A–C) Membrane potential (Vm; top) and associated rapid
delayed rectifier potassium current (IKr; bottom) of the BPS2020 model at 1
Hz stimulation. (A) Endocardial version of the model (‘endo’). (B) Midmyocardial
version of the model (‘mid’). (C) Epicardial version of the model (‘epi’). (D–F)
Vm (top) and IKr (bottom) of the ToR–ORd model at 1 Hz stimulation.
(D) Endocardial version of the model (‘endo’). (E) Midmyocardial version of the
model (‘mid’). (F) Epicardial version of the model (‘epi’). The vertical arrow
indicates the early afterdepolarization that occurs every second AP. WT/WT,
control (no mutation); WT/mutant, heterozygous loss-of-function mutation in
KCNH2; 70% suppression, 70% silencing of mutant
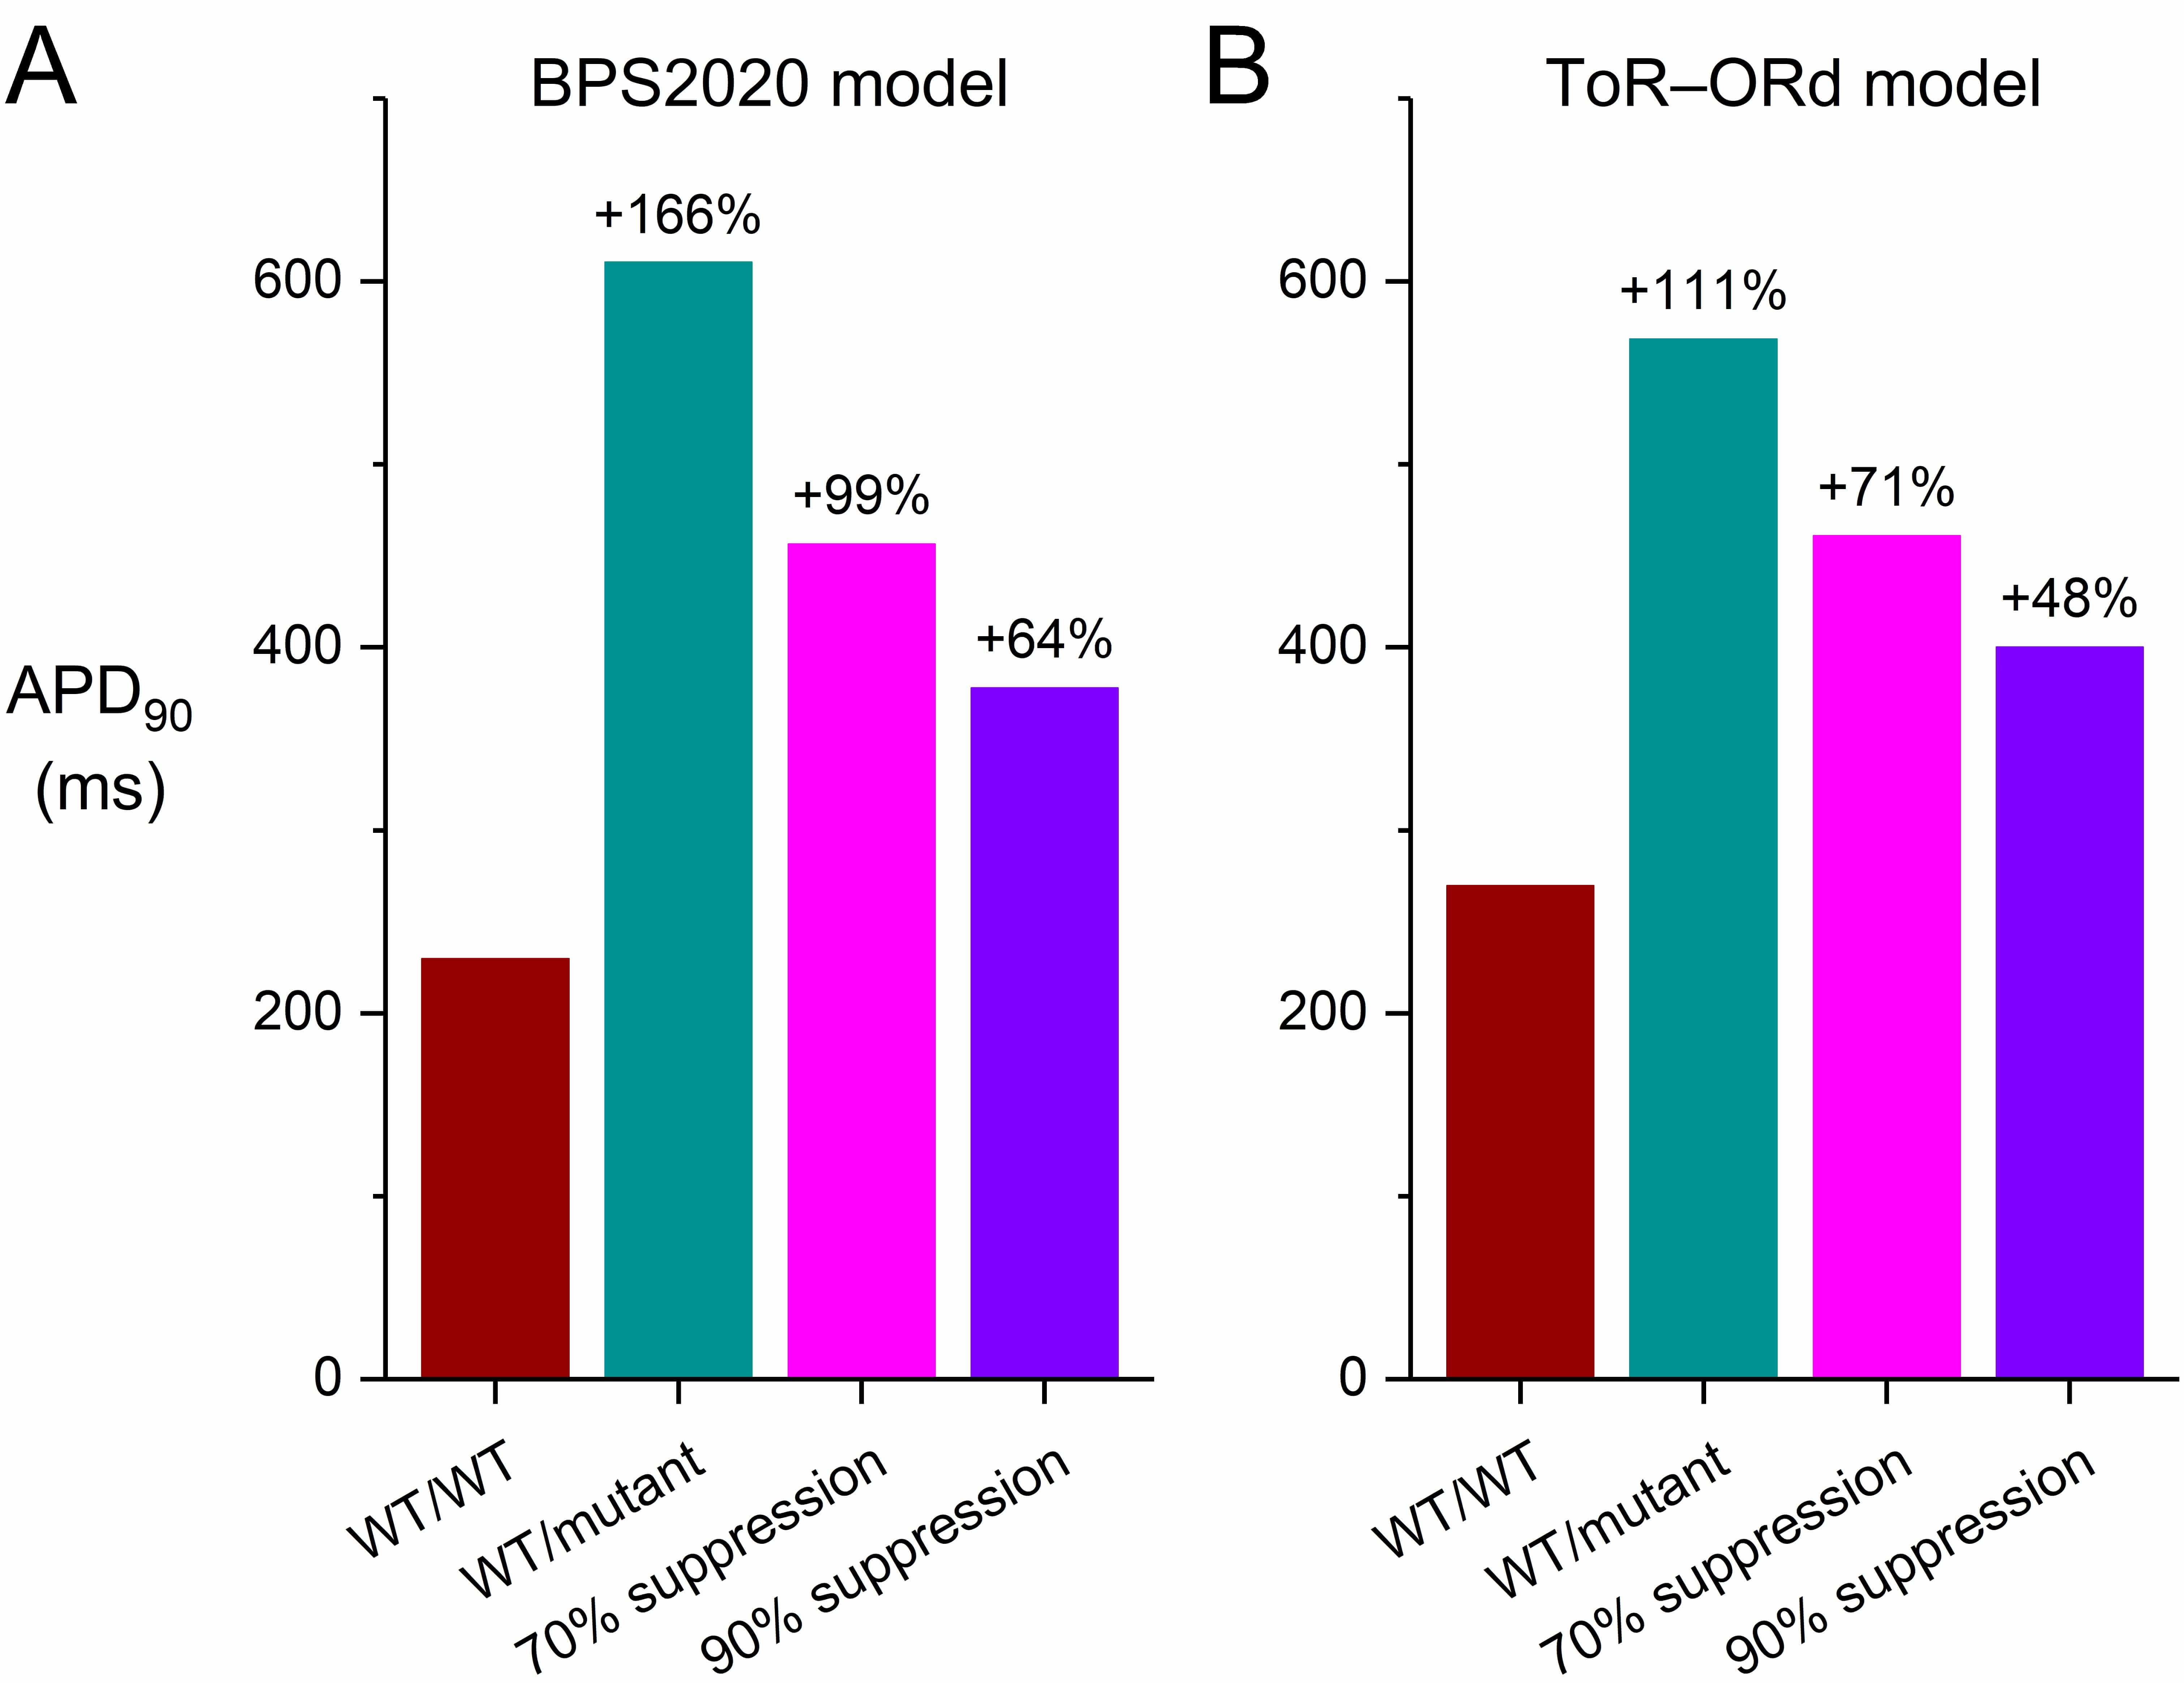 Fig. 4.
Effects of severe dominant-negative LQTS2 mutations on the AP
duration at 90% repolarization (APD90) of human ventricular cardiomyocytes,
and effects of mutant allele silencing. (A) APD90 of the default
(endocardial) version of the BPS2020 model at 1 Hz stimulation. (B) APD90 of
the default (endocardial) version of the ToR–ORd model at 1 Hz stimulation.
WT/WT, control (no mutation); WT/mutant, heterozygous loss-of-function mutation
in KCNH2; 70% suppression, 70% silencing of mutant
In the epicardial version of the BPS2020 model, the cell shows a stronger repolarization than in the default endocardial version. This can, at least partly, be attributed to the larger fully-activated conductance of several outward currents in this version of the model, not only of IKr (+10%) and IKs (+40%), but also of the inward rectifier K+ current (IK1; +20%), so that a larger repolarization current remains in the event of a mutation-induced decrease in IKr. On the other hand, the repolarizing electrogenic Na+/K+ pump current (INaK) and the background K+ current (IKb) are reduced in this version of the model (by 10% and 40%, respectively). The APD90 of the model increases from its control value of 201 to 523 ms (+159%; Fig. 3C, ‘WT/mutant’ vs. ‘WT/WT’ traces). Silencing the mutant allele by 70% reduces the increase in APD90 to 393 ms (+95%; Fig. 3C, ‘70% suppression’ vs. ‘WT/WT’ traces). Silencing by 90% further reduces the increase in APD90 to 328 ms (+63%); Fig. 3C, ‘90% suppression’ vs. ‘WT/WT’ traces).
In the epicardial version of the ToR–ORd model, the conductances of IKr, IKs, and IK1 are also increased (by 30%, 40%, and 20%, respectively), while INaK and IKb are reduced (by 10% and 40%, respectively), as compared to the default endocardial version of the model. Yet, reducing the fully-activated conductance of IKr to 1/16th (6.25%) of its control value to simulate a severe mutation in KCNH2 results in an early afterdepolarization (EAD; Fig. 3F, vertical arrow) that is observed in every second AP of a train of APs (data not shown). The EAD is no longer observed when the mutant allele is silenced by 70% or 90% (Fig. 3F).
Midmyocardial cells (“M cells” [44, 45]) have a longer AP than endocardial and epicardial cells, largely because of their substantially smaller IKs, which reduces their repolarization reserve and makes them more vulnerable to a decrease in IKr. This vulnerability is demonstrated in our simulations of the electrical activity of M cells in the presence of a severe mutation in KCNH2 (Fig. 3B,E, ‘WT/mutant’ traces). In the repetitive pattern of the BPS2020 model, repolarization becomes entirely incomplete (Fig. 3B), whereas it becomes partially incomplete in the repetitive pattern of the ToR–ORd model (Fig. 3E).
The restitution of the AP duration (APD restitution), i.e., the adaptation of the AP to a sudden change in stimulation rate, has been proposed as an important determinant of the occurrence of re-entrant arrhythmias, or at least the stability of such arrhythmias [46]. Such an APD restitution curve plots the APD as a function of the preceding diastolic interval. Both experimental and modelling studies have shown that a steep APD restitution curve can be arrhythmogenic by facilitating wave break and fibrillation [47]. Therefore, we constructed APD restitution curves for the severe mutations, and assessed the effect of silencing the mutant KCNH2 allele on the shape of these curves. We used an S1-S2 protocol to construct our APD restitution curves. We stimulated the cells of interest with a train of 100 S1 stimuli at a given rate of 1 Hz and then applied a premature S2 stimulus over a range of diastolic intervals. Fig. 5 shows the APD90 of the AP elicited by the S2 stimulus as a function of the preceding diastolic interval. We restricted our simulations to the default endocardial versions of the two models.
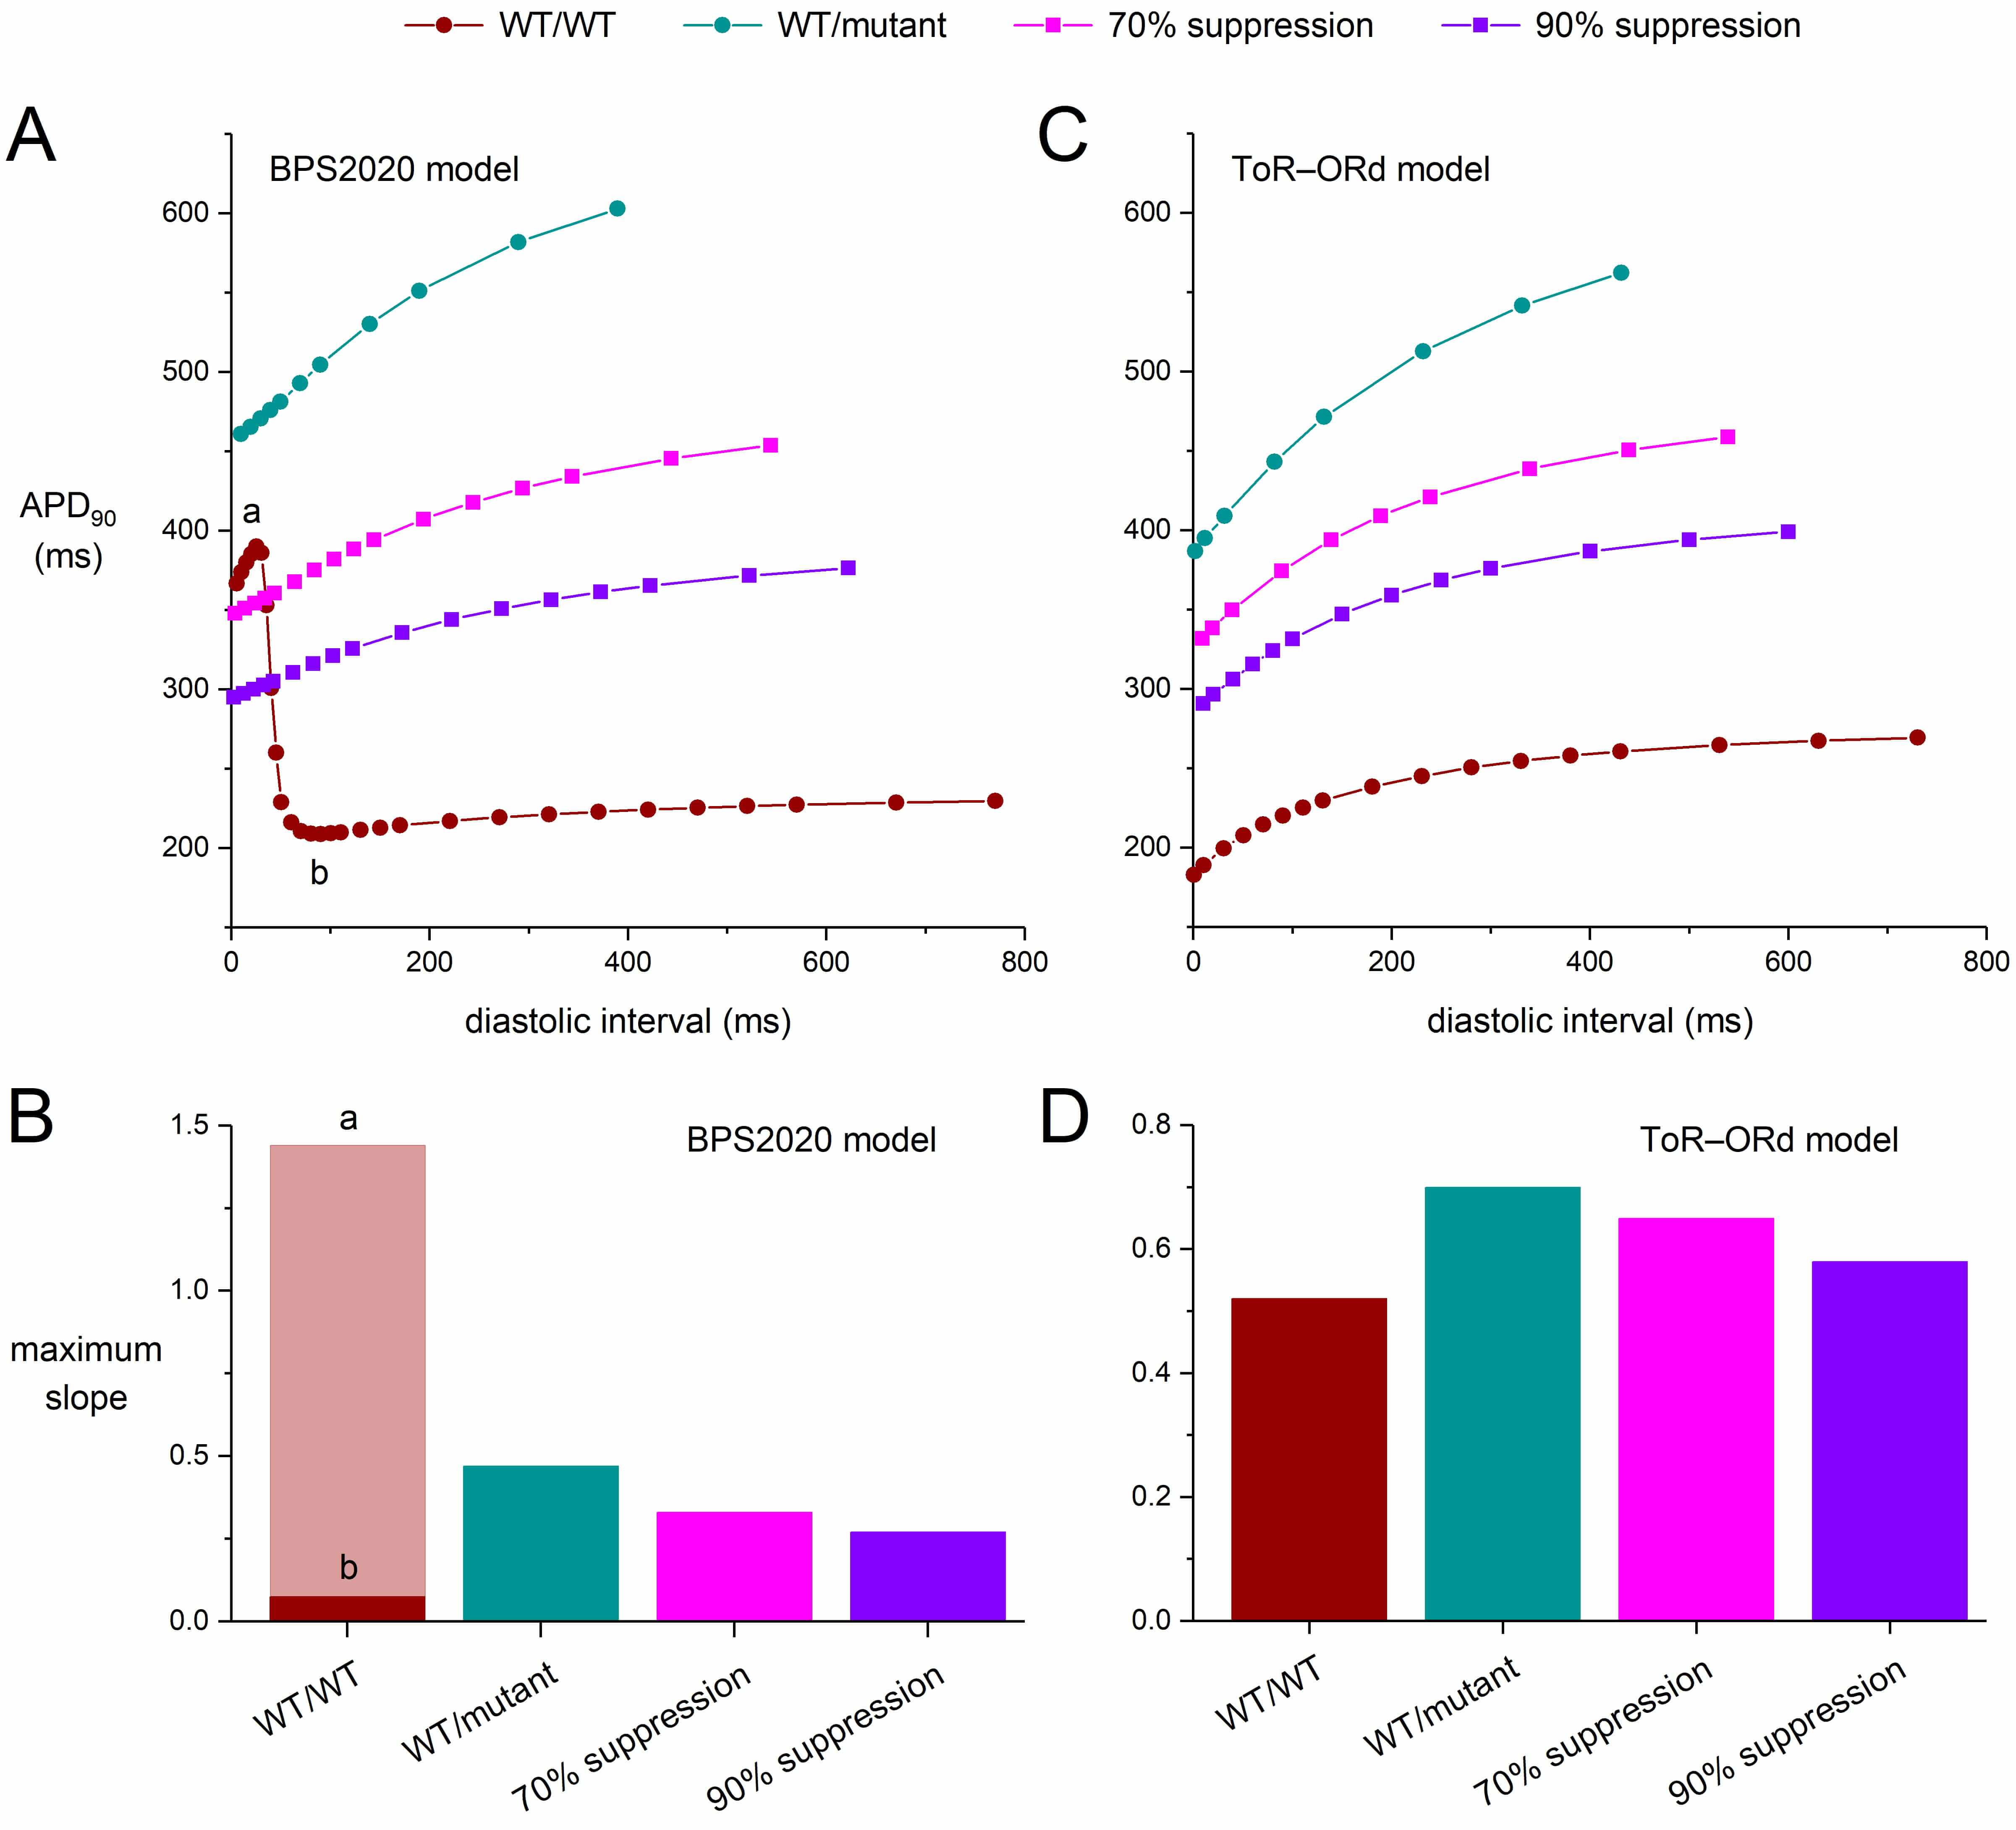 Fig. 5.
Effects of severe dominant-negative LQTS2 mutations on the
APD90 restitution curves of human ventricular cardiomyocytes obtained with
an S1-S2 pacing protocol, and effects of mutant allele silencing. After a train
of 100 S1 stimuli at 1 Hz, an S2 stimulus was applied over a range of diastolic
intervals and the APD90 upon the S2 stimulus was determined. (A) APD90
restitution curves of the default (endocardial) version of the BPS2020 model and
(B) the associated maximum slopes. Note the biphasic shape of the WT/WT curve and
the widely different maximum slopes during its phases labeled ‘a’ and ‘b’. (C)
APD90 restitution curves of the default (endocardial) version of the
ToR–ORd model and (D) the associated maximum slopes. WT/WT, control (no
mutation); WT/mutant, heterozygous loss-of-function mutation in KCNH2;
70% suppression, 70% silencing of mutant
Fig. 5 shows the APD restitution curves for both the BPS2020 and ToR–ORd models (Fig. 5A,C) as well as the maximum slopes of these curves (Fig. 5B,D). The rate adaptation of the APD90 is stronger in the ToR–ORd model than it is in the BPS2020 model. Also, the APD restitution curve of the BPS2020 model is strikingly biphasic under control (WT/WT) conditions, with a huge increase in APD90 at short diastolic intervals (Fig. 5A, ‘WT/WT’ curve). Although such differences between cardiac cell models are not always recognized, they are not uncommon [48]. In either model, the severe mutation clearly steepens the APD restitution curve (Fig. 5A,C; ‘WT/mutant’ vs. ‘WT/WT’ curves), which may exert an arrhythmogenic effect [46].
If we, for the moment, ignore the large APD90 at short diastolic intervals of the BPS2020 model (Fig. 5A, phase ‘a’ of the ‘WT/WT’ curve), the steepening effect of the mutation is also demonstrated by the substantial increase in the maximum slope of the BPS2020 restitution curve. This increase is from 0.075 during phase ‘b’ of the WT/WT curve to 0.47 for the WT/mutant curve (Fig. 5B; ‘WT/mutant’ vs. ‘WT/WT’ bars). However, during phase ‘a’ the maximum slope of the WT/WT curve is as high as 1.44, which would be strongly arrhythmogenic but is unlike control human ventricular APD restitution curves reported in literature [46]. Silencing the mutant allele by 70% or by 90% reduces the steepness of the BPS2020 ‘WT/mutant’ curve (Fig. 5A; ‘70% suppression’ and ‘90% suppression’ vs. ‘WT/mutant’ curves), but with values of 0.33 and 0.27, respectively, their maximum slope remains higher than under WT/WT conditions (Fig. 5B; ‘70% suppression’ and ‘90% suppression’ vs. ‘WT/WT’ phase ‘b’ bars).
Unlike the BPS2020 model, the ToR–ORd model does not show a biphasic APD restitution curve under WT/WT conditions. Otherwise, however, the steepening pattern is qualitatively similar to that of the BPS2020 model but not quantitatively (Fig. 5A,C). The maximum slope of the APD restitution curve under WT/WT conditions is 0.52, which increases to 0.70 with the severe mutation. Silencing the mutant allele by 70% or by 90% reduces the steepness of the ‘WT/mutant’ curve (Fig. 5C; ‘70% suppression’ and ‘90% suppression’ vs. ‘WT/mutant’ curves), but with values of 0.65 and 0.58, respectively, their maximum slope remains higher than under WT/WT conditions (Fig. 5D; ‘70% suppression’ and ‘90% suppression’ vs. ‘WT’ bars).
The strikingly biphasic shape of the APD restitution curve of the BPS2020 model under WT/WT conditions is intriguing and appears to be related to its L-type calcium current (ICaL). As shown in Fig. 6, the AP of the BPS2020 model exhibits a pronounced plateau at short diastolic intervals (Fig. 6A), due to a substantially decreased peak in the intracellular Ca2+ concentration (Fig. 6B) and increased ICaL (Fig. 6C), in the absence of major changes in other plateau currents (data not shown). At the same set of diastolic intervals, the ToR–ORd model does not exhibit such behavior (Fig. 6E–G). In contrast to their fundamentally different rate adaptation of ICaL, their rate adaptation of the fast sodium current (INa) is similar, at least qualitatively (Fig. 6D,H). Although both models originate from the O’Hara–Rudy human ventricular cardiomyocyte model [21], they are essentially different in many respects, including their rather complex intracellular Ca2+ handling and associated ICaL characteristics. Of note, the developers of the BPS2020 model acknowledge in the Limitations section of their paper that the ICaL current-voltage relationship of their model “does not perfectly fit the positive potentials” and that “this shortcoming could lead to ICaL overestimation at positive potentials” [19]. At larger APD90 values, as in case of the ‘WT/mutant’, ‘70% suppression’, and ‘90% suppression’ conditions, the AP no longer exhibits a prominent plateau at short diastolic intervals (data not shown) and the restitution curves are no longer strikingly biphasic (Fig. 5A).
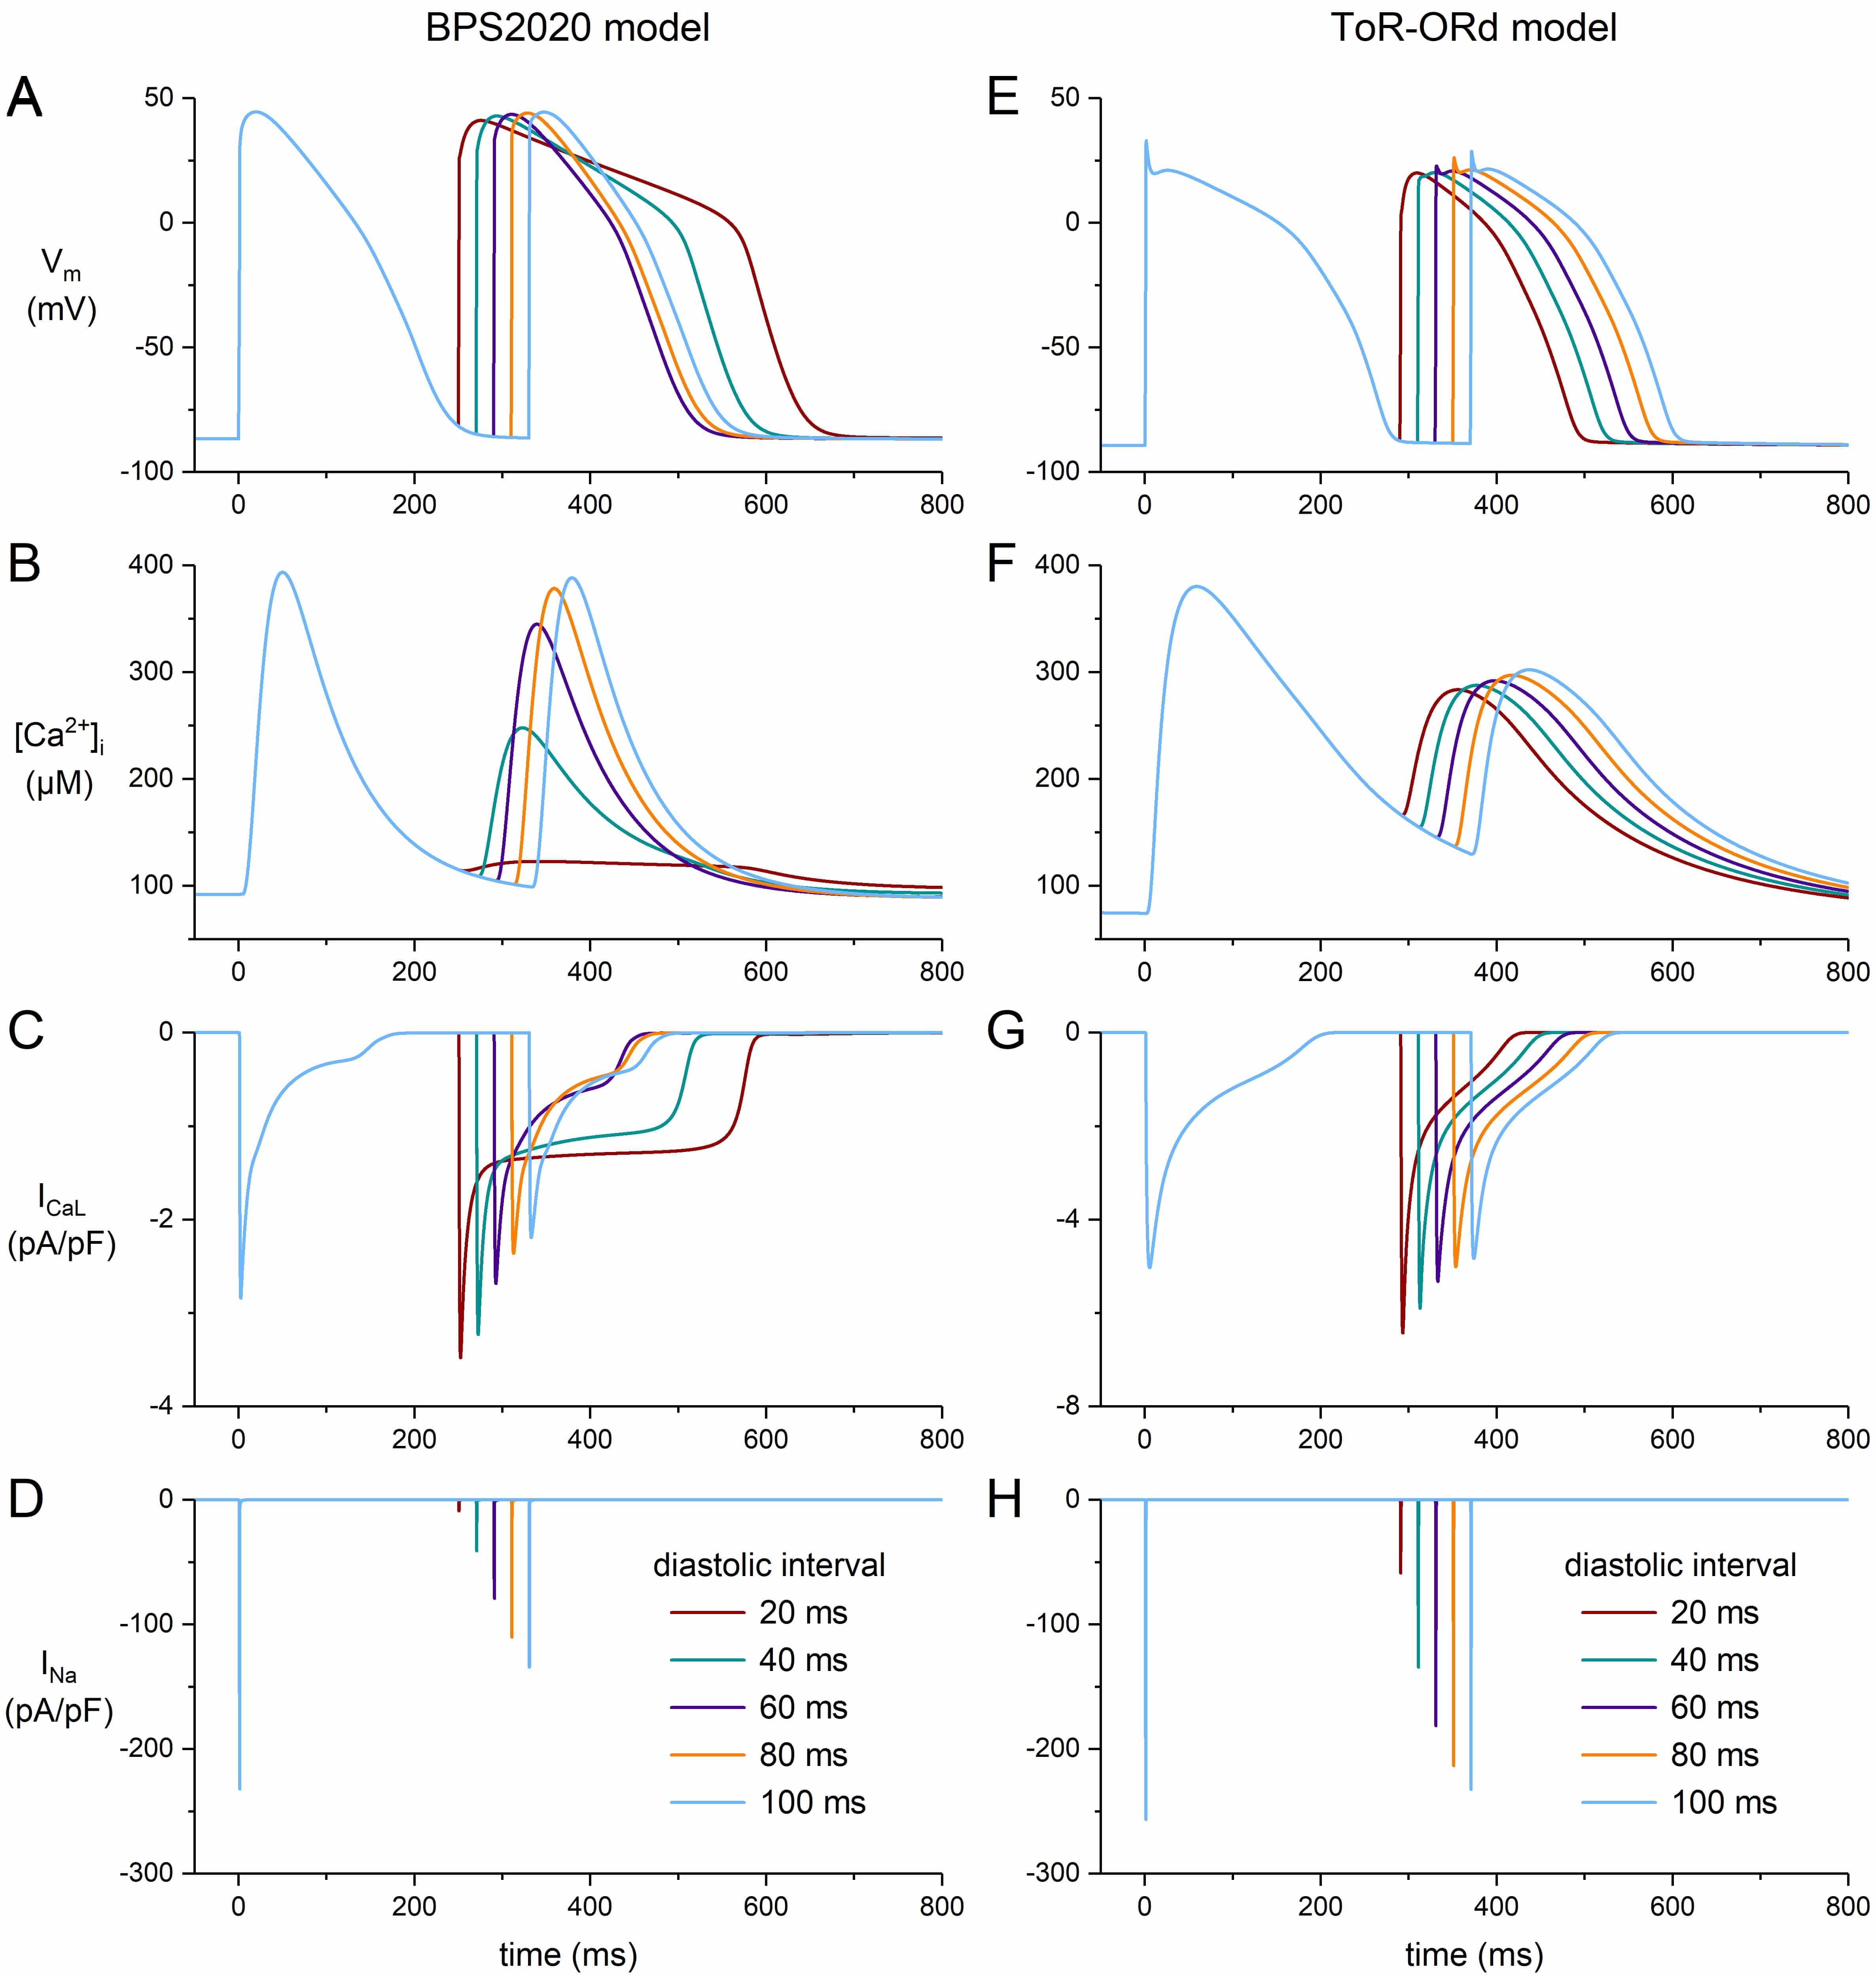 Fig. 6.
Effects of short diastolic intervals on the AP shape of human ventricular cardiomyocytes obtained with an S1-S2 pacing protocol. After a train of 100 S1 stimuli at 1 Hz, an S2 stimulus was applied at diastolic intervals ranging from 20 to 100 ms. (A) Membrane potential (Vm), (B) intracellular calcium concentration ([Ca2+]i), (C) L-type calcium current (ICaL), and (D) fast sodium current (INa) of the default (endocardial) version of the BPS2020 model. (E) Vm, (F) [Ca2+]i, (G) ICaL, and (H) INa of the default (endocardial) version of the ToR–ORd model. Note the difference in ordinate scales between panels (C) and (G).
The mutation-induced prolongation of the action potential leads to alterations in the underlying individual ion currents, including the Na+/K+ pump current (INaK) and the Na+/Ca2+ exchange current (INaCa), as well as the intracellular ion concentrations. Fig. 7 shows the impact of a severe dominant-negative mutation in KCNH2 on INaK, INaCa, and the intracellular concentrations of K+, Na+, and Ca2+ ([K+]i, [Na+]i, and [Ca2+]i, respectively) in the default (endocardial) versions of the BPS2020 and ToR–ORd models. In both models, [K+]i slightly increases with the mutation. Diastolic [K+]i increases by 0.28% in the BPS2020 model (Fig. 7A, top middle panel, left two bars) and by 1.5% in the ToR–ORd model (Fig. 7B, top middle panel, left two bars). In the BPS2020 model, the 0.28% increase in diastolic [K+]i is reduced to 0.18% and 0.12% with 70% and 90% silencing of the mutant allele, respectively (Fig. 7A, top middle panel, right two bars). In the ToR–ORd model, the 1.5% increase is reduced to 0.73% and 0.56%, respectively (Fig. 7B, top middle panel, right two bars). Full 100% silencing reduces the increase further, to 0.09% in the BPS2020 model and 0.37% in the ToR–ORd model (data not shown). Thus, silencing considerably reduces the increase in diastolic [K+]i, but does not completely eliminate it.
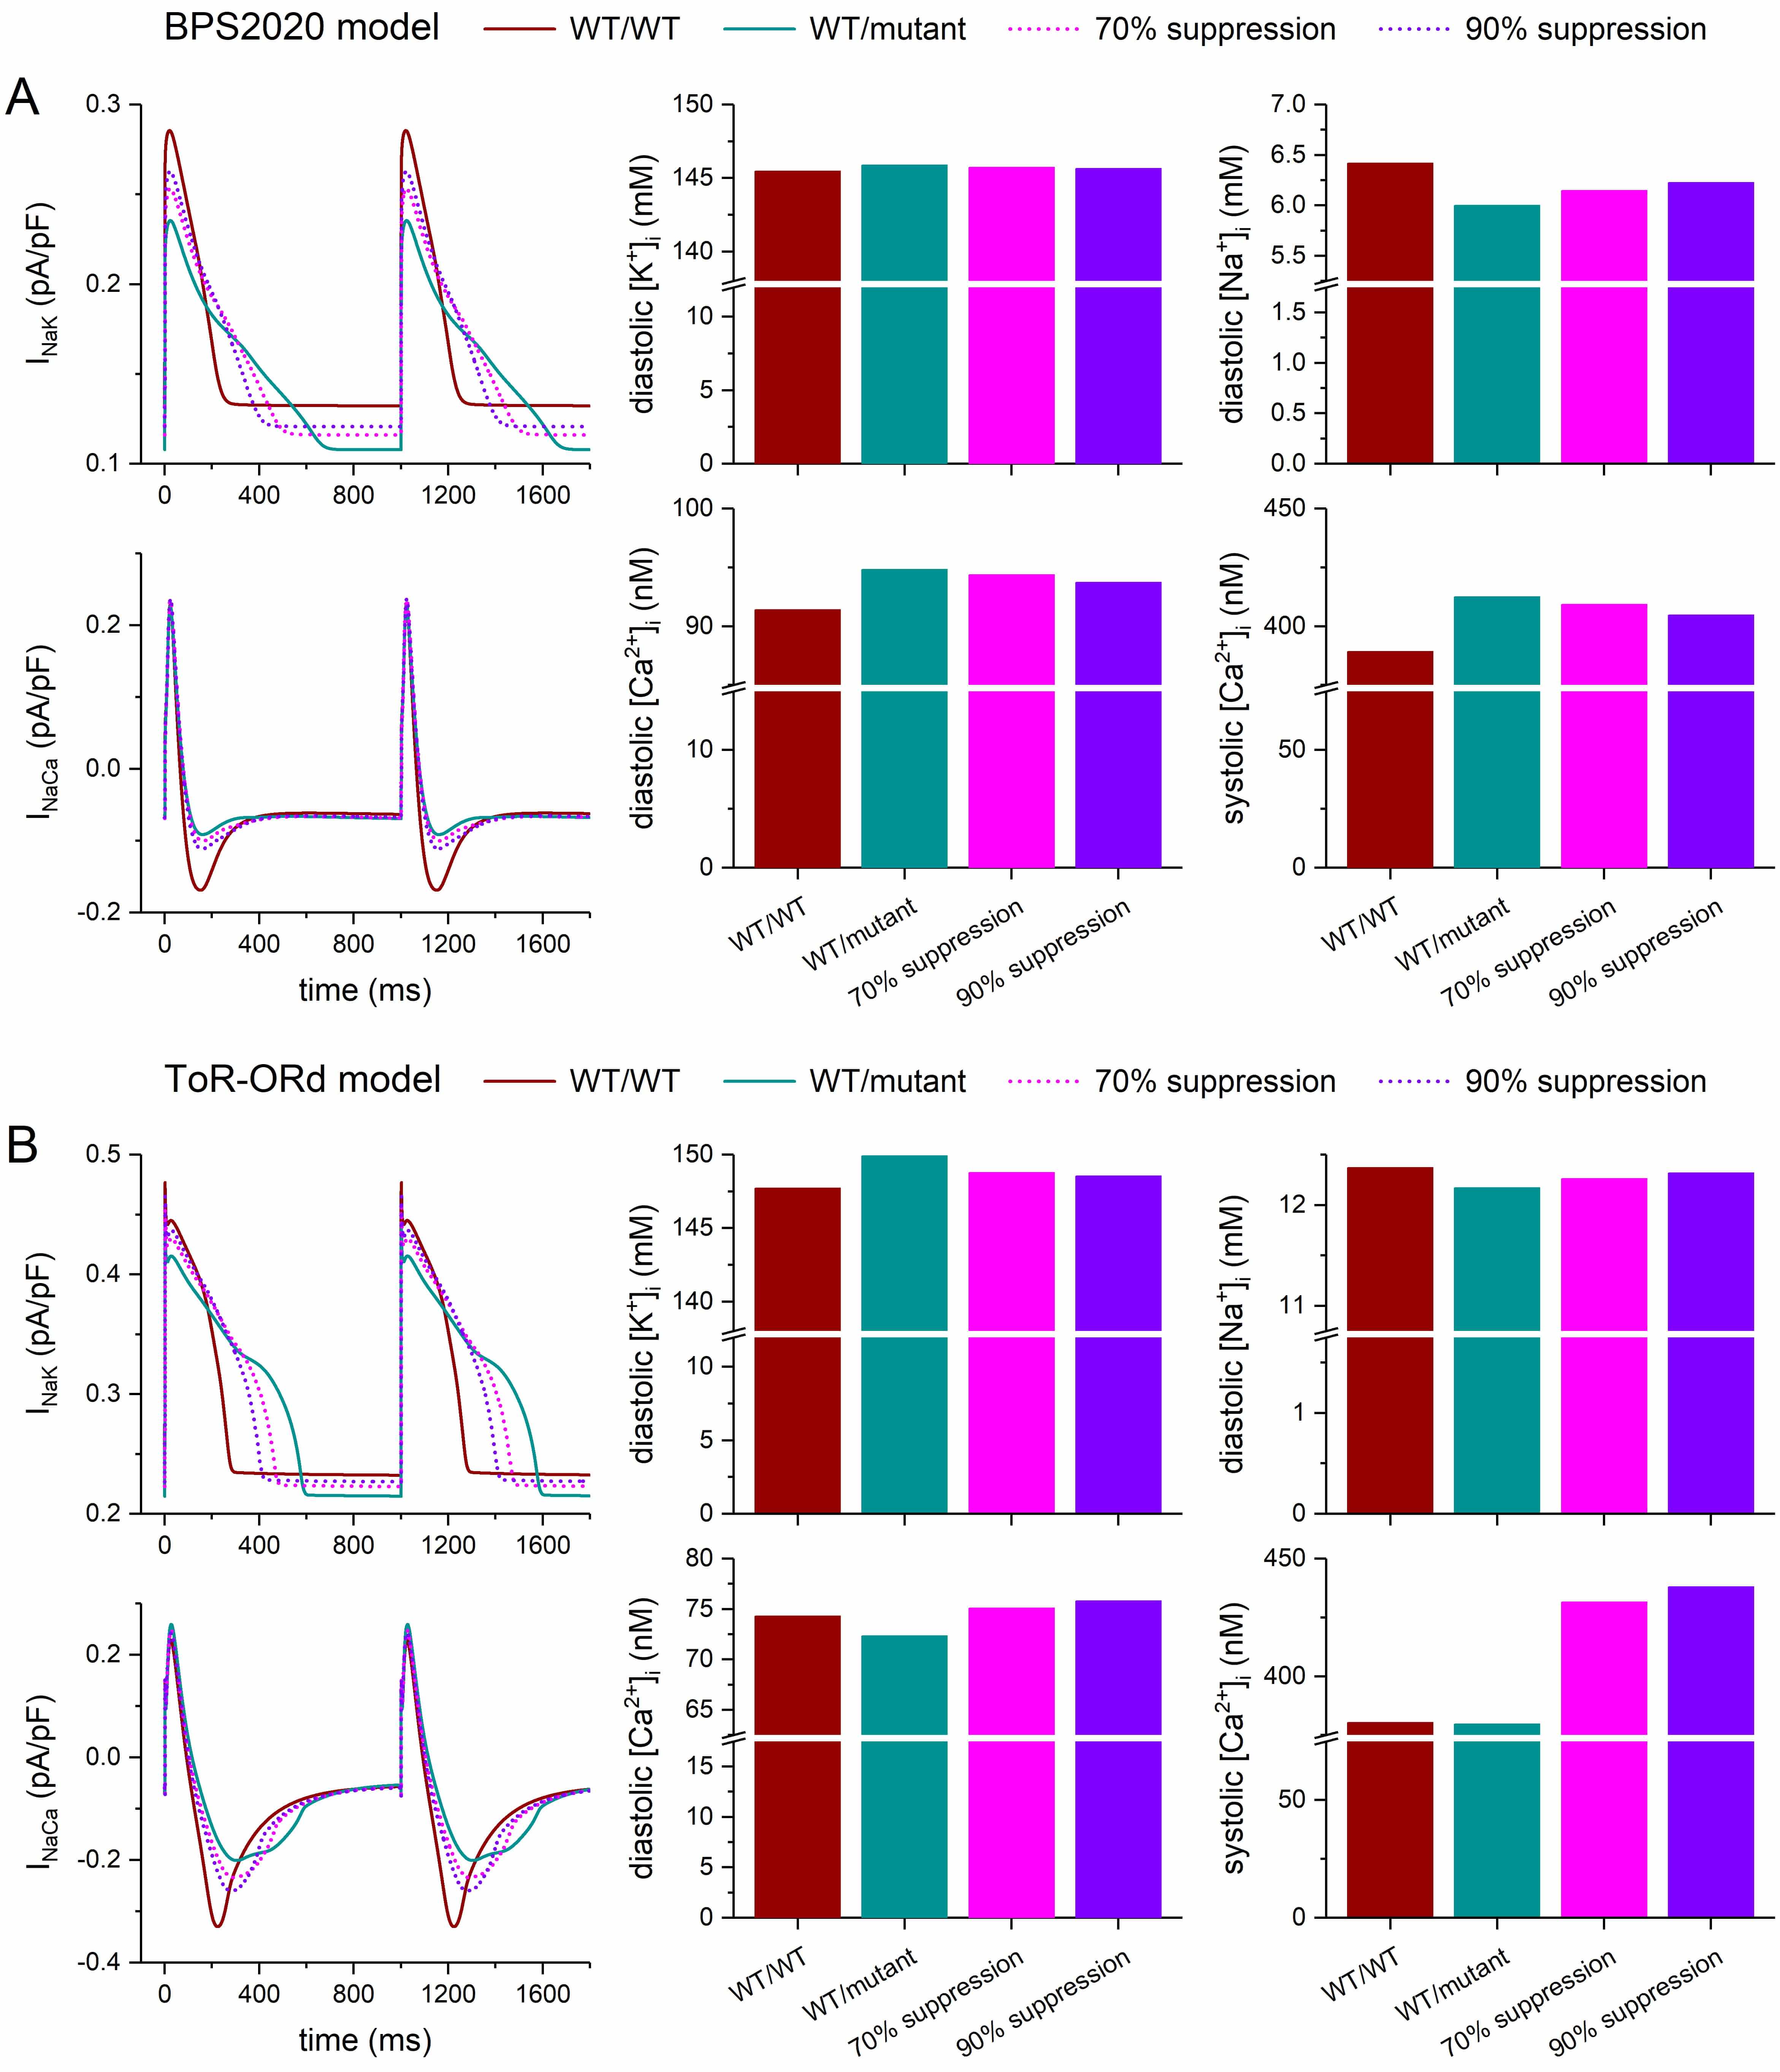 Fig. 7.
Effects of severe dominant-negative LQTS2 mutations on the
intracellular ion concentrations of human ventricular cardiomyocytes, and effects
of mutant allele silencing. (A) Na+/K+ pump current (INaK),
Na+/Ca2+ exchange current (INaCa), and associated intracellular
ion concentrations at 1 Hz stimulation of the default (endocardial) version of
the BPS2020 model. (B) INaK, INaCa, and associated intracellular ion
concentrations at 1 Hz stimulation of the default (endocardial) version of the
ToR–ORd model. WT/WT, control (no mutation); WT/mutant, heterozygous
loss-of-function mutation in KCNH2; 70% suppression, 70% silencing of
mutant
The diastolic [Na+]i, on the other hand, shows a mutation-induced decrease rather than an increase, and this decrease is larger in the BPS2020 model than in the ToR–ORd model. In the BPS2020 model, the decrease amounts to 6.5%, which is reduced to 4.2% and 3.0% with 70% and 90% silencing of the mutant allele, respectively (Fig. 7A, top right panel). In the ToR–ORd model, the decrease is 1.6%, which is reduced to 0.90% and 0.42% with 70% and 90% silencing of the mutant allele, respectively (Fig. 7B, top right panel). With full, 100% silencing, the decrease is reduced further, to 2.2% in the BPS2020 model and to 0.21% in the ToR–ORd model (data not shown). Thus, silencing considerably reduces the decrease in diastolic [Na+]i, but does not eliminate it.
Fig. 7 also shows the effects of the severe mutation on the diastolic and systolic [Ca2+]i levels as well as the effects of silencing of the mutant allele. In this regard, the two models differ not only quantitatively but also qualitatively. The BPS2020 model shows a 3.8% mutation-induced increase in diastolic [Ca2+]i (Fig. 7A, bottom middle panel), whereas the ToR–ORd model shows a 2.6% decrease (Fig. 7B, bottom middle panel). Similarly, the BPS2020 model shows a 6.0% mutation-induced increase in systolic [Ca2+]i (Fig. 7A, bottom right panel), while the ToR–ORd model shows a 0.2% decrease (Fig. 7B, bottom right panel). In the BPS2020 model, the increases in the diastolic and systolic [Ca2+]i levels are both reduced with 70% and 90% silencing, and this effect is larger with 90% silencing (decreasing from 3.8% to 3.3% and 2.6% for diastolic [Ca2+]i, and from 6.0% to 5.1% and 4.0% for systolic [Ca2+]i). These increases are further reduced with full, 100% silencing, to 1.9% for diastolic [Ca2+]i and 3.0% for systolic [Ca2+]i.
In the ToR–ORd model, however, the decreases in the diastolic and systolic [Ca2+]i levels both turn into increases at 70% and 90% silencing. At 70% silencing, the increases in the diastolic and systolic [Ca2+]i levels are 1.1% and 13%, respectively. These increases rise to 2.0% and 15%, respectively, with 90% silencing. With full, 100% silencing, the increase in diastolic [Ca2+]i rises slightly further to 2.1%, while the increase in systolic [Ca2+]i is reduced to 13% (data not shown). Only if the fully-activated conductance of IKr is increased to hypothetical values well above the maximum value of 50% of its control that can be achieved by full suppression of the mutant allele, the increases in the diastolic and systolic [Ca2+]i levels are both reduced (data not shown).
As set out in Section 3.1, we simulated a mild dominant-negative mutation in
KCNH2 by reducing the fully-activated conductance of IKr to 5/16th
(31.25%) of its control value, representing the case where all IKr channels
containing at most one mutant
Fig. 8 shows the results of the simulations we performed with the endocardial, midmyocardial, and epicardial versions of the BPS2020 and ToR–ORd models of the electrical activity of a single human ventricular cardiomyocyte paced at 1 Hz (Fig. 8A–C and Fig. 8D–F, respectively). In their default endocardial versions, both models show a marked slowing of their repolarization (Fig. 8A,D, top panels) due to the also marked reduction of IKr (Fig. 8A,D, bottom panels) when their fully-activated conductance is reduced to 5/16th (31.25%) of its control value (‘WT/mutant’ vs. ‘WT/WT’ traces). The APD90 of the BPS2020 model increases from 230 to 407 ms (+77%; Fig. 9A, left two bars) and that of the ToR–ORd model from 270 to 423 ms (+57%; Fig. 9B, left two bars). Silencing of the mutant allele by 70% or 90% has an almost identical effect on IKr(Fig. 8A,D, bottom panels), reducing the increase in APD90 of the BPS2020 model to 332 ms (+44%) and 324 ms (+41%), respectively (Fig. 9A), and that of the ToR–ORd model to 362 ms (+34%) and 356 ms (+32%), respectively (Fig. 9B).
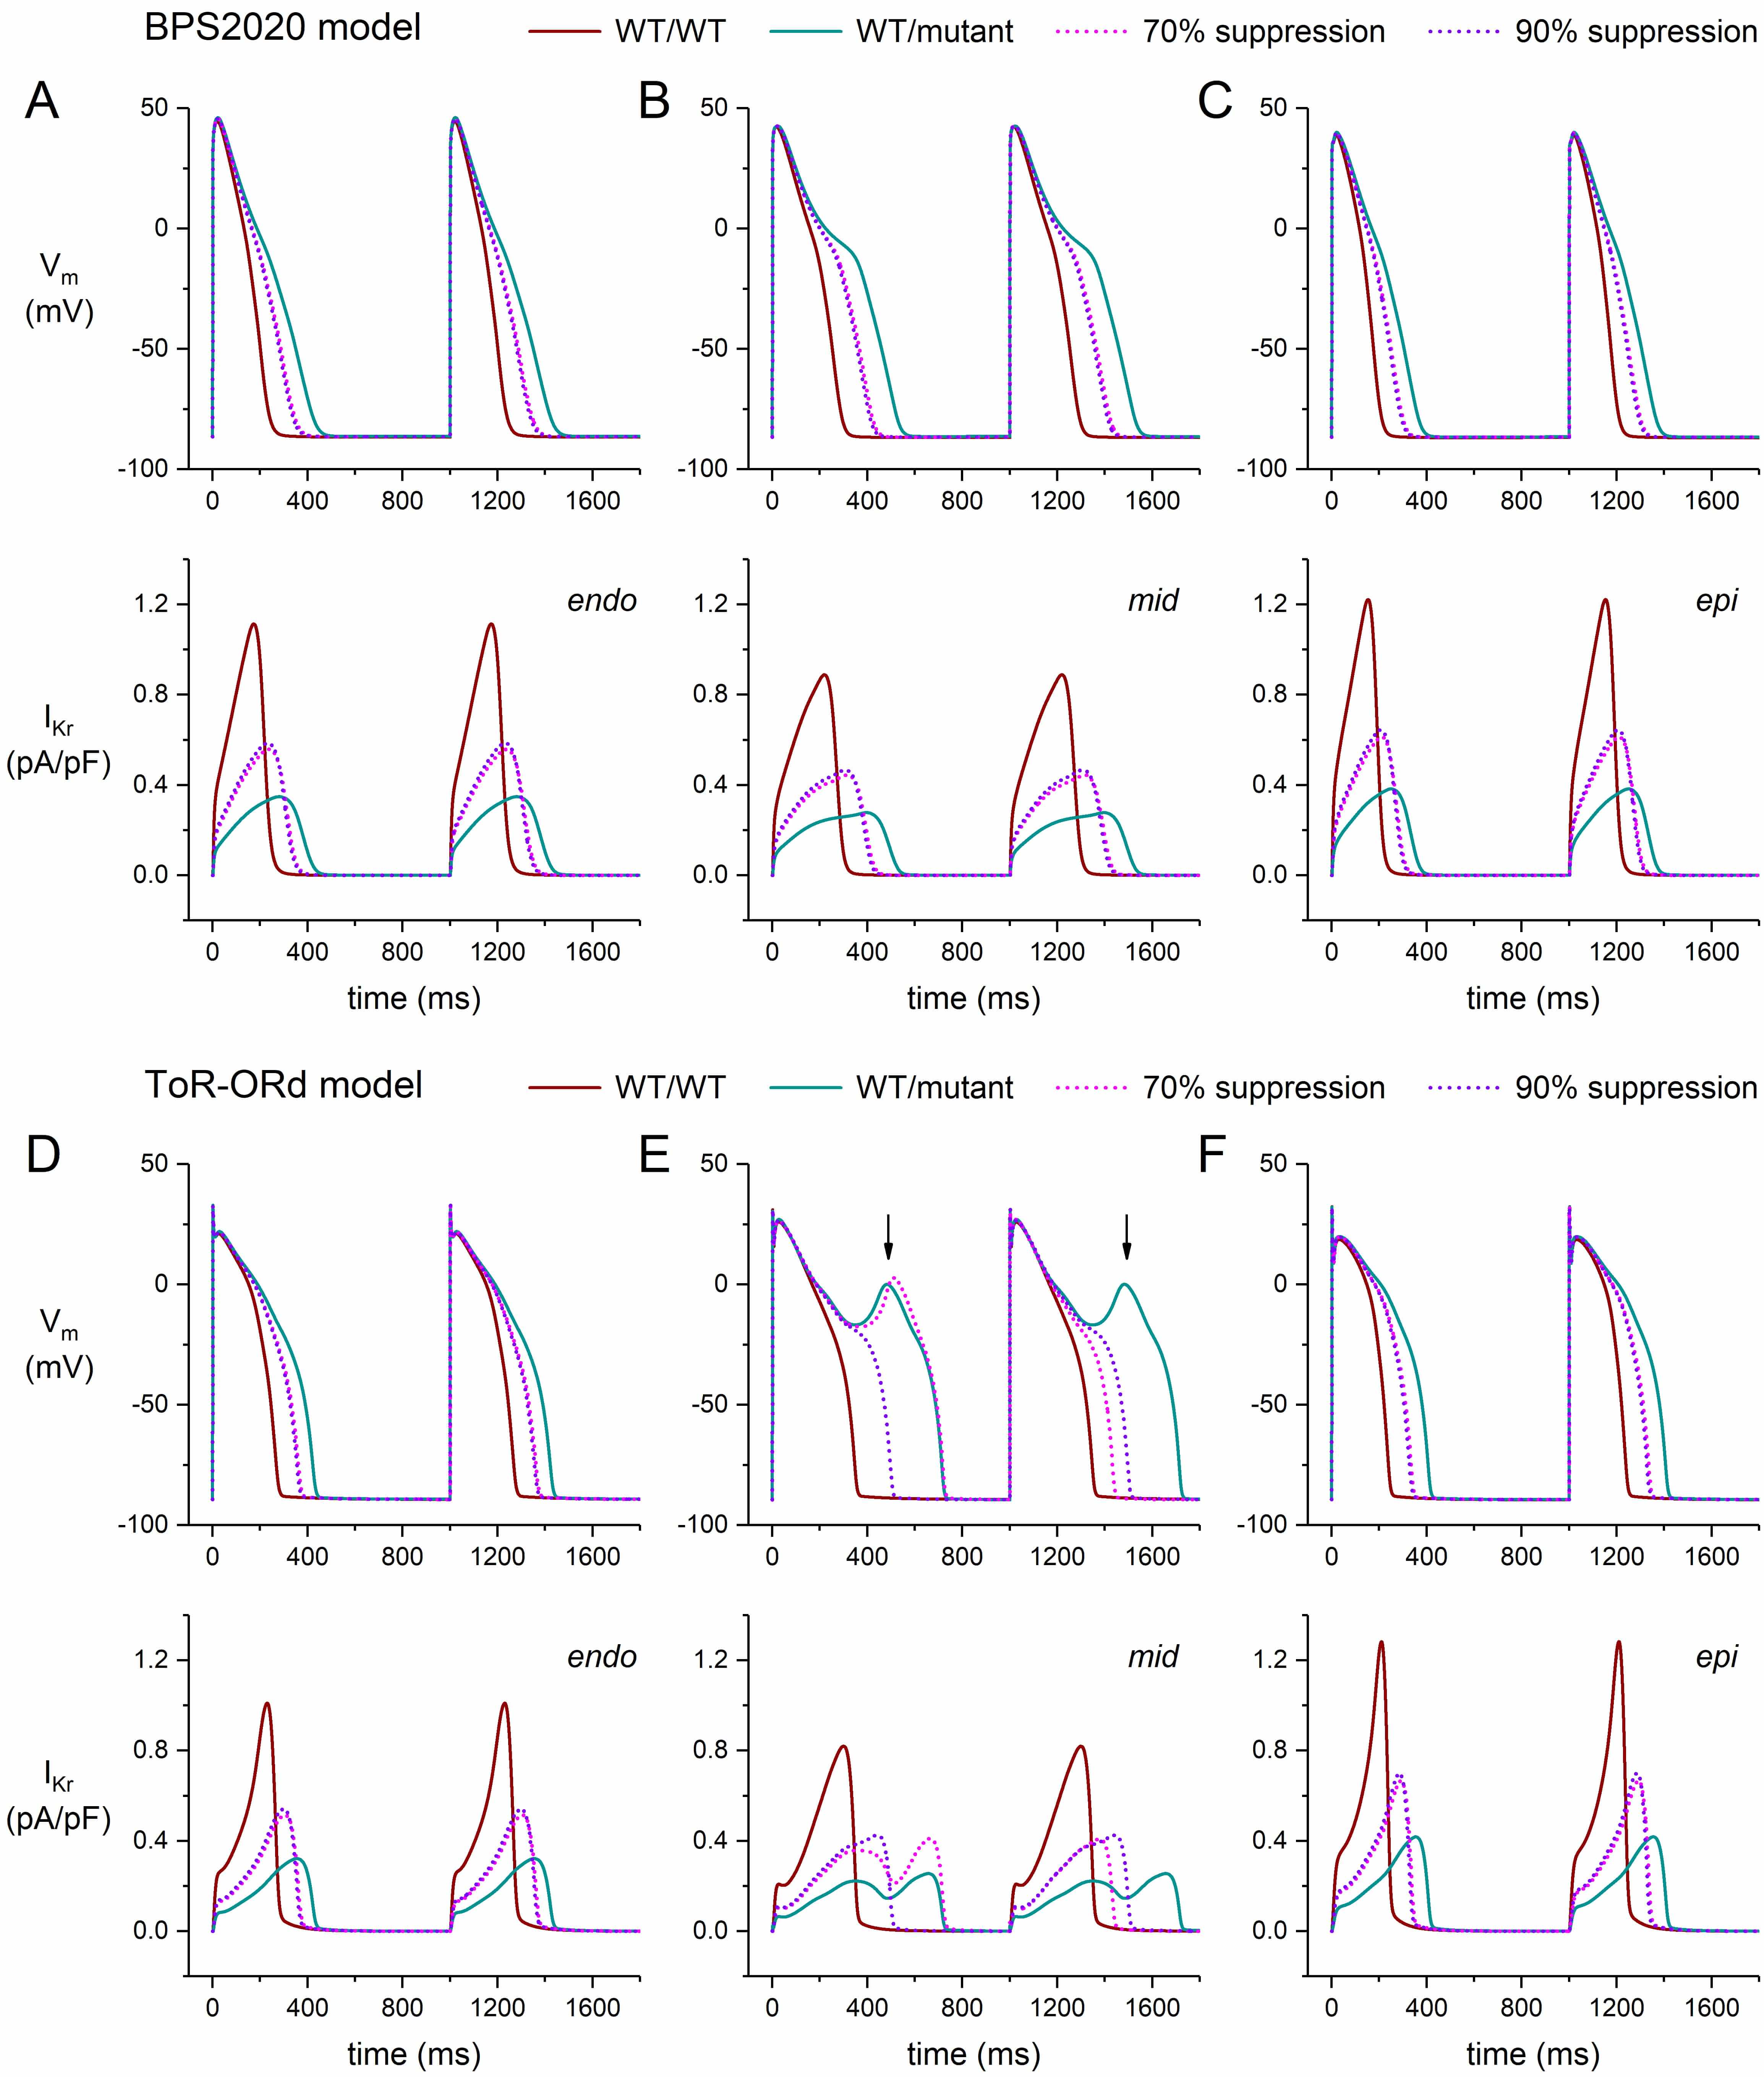 Fig. 8.
Effects of mild dominant-negative LQTS2 mutations on the
electrical activity of human ventricular cardiomyocytes, and effects of mutant
allele silencing. (A–C) Membrane potential (Vm; top) and associated rapid
delayed rectifier potassium current (IKr; bottom) of the BPS2020 model at 1
Hz stimulation. (A) Endocardial version of the model (‘endo’). (B) Midmyocardial
version of the model (‘mid’). (C) Epicardial version of the model (‘epi’). (D–F)
Vm (top) and IKr (bottom) of the ToR–ORd model at 1 Hz stimulation.
(D) Endocardial version of the model (‘endo’). (E) Midmyocardial version of the
model (‘mid’). Vertical arrows indicate EADs. (F) Epicardial version of the model
(‘epi’). WT/WT, control (no mutation); WT/mutant, heterozygous loss-of-function
mutation in KCNH2; 70% suppression, 70% silencing of mutant
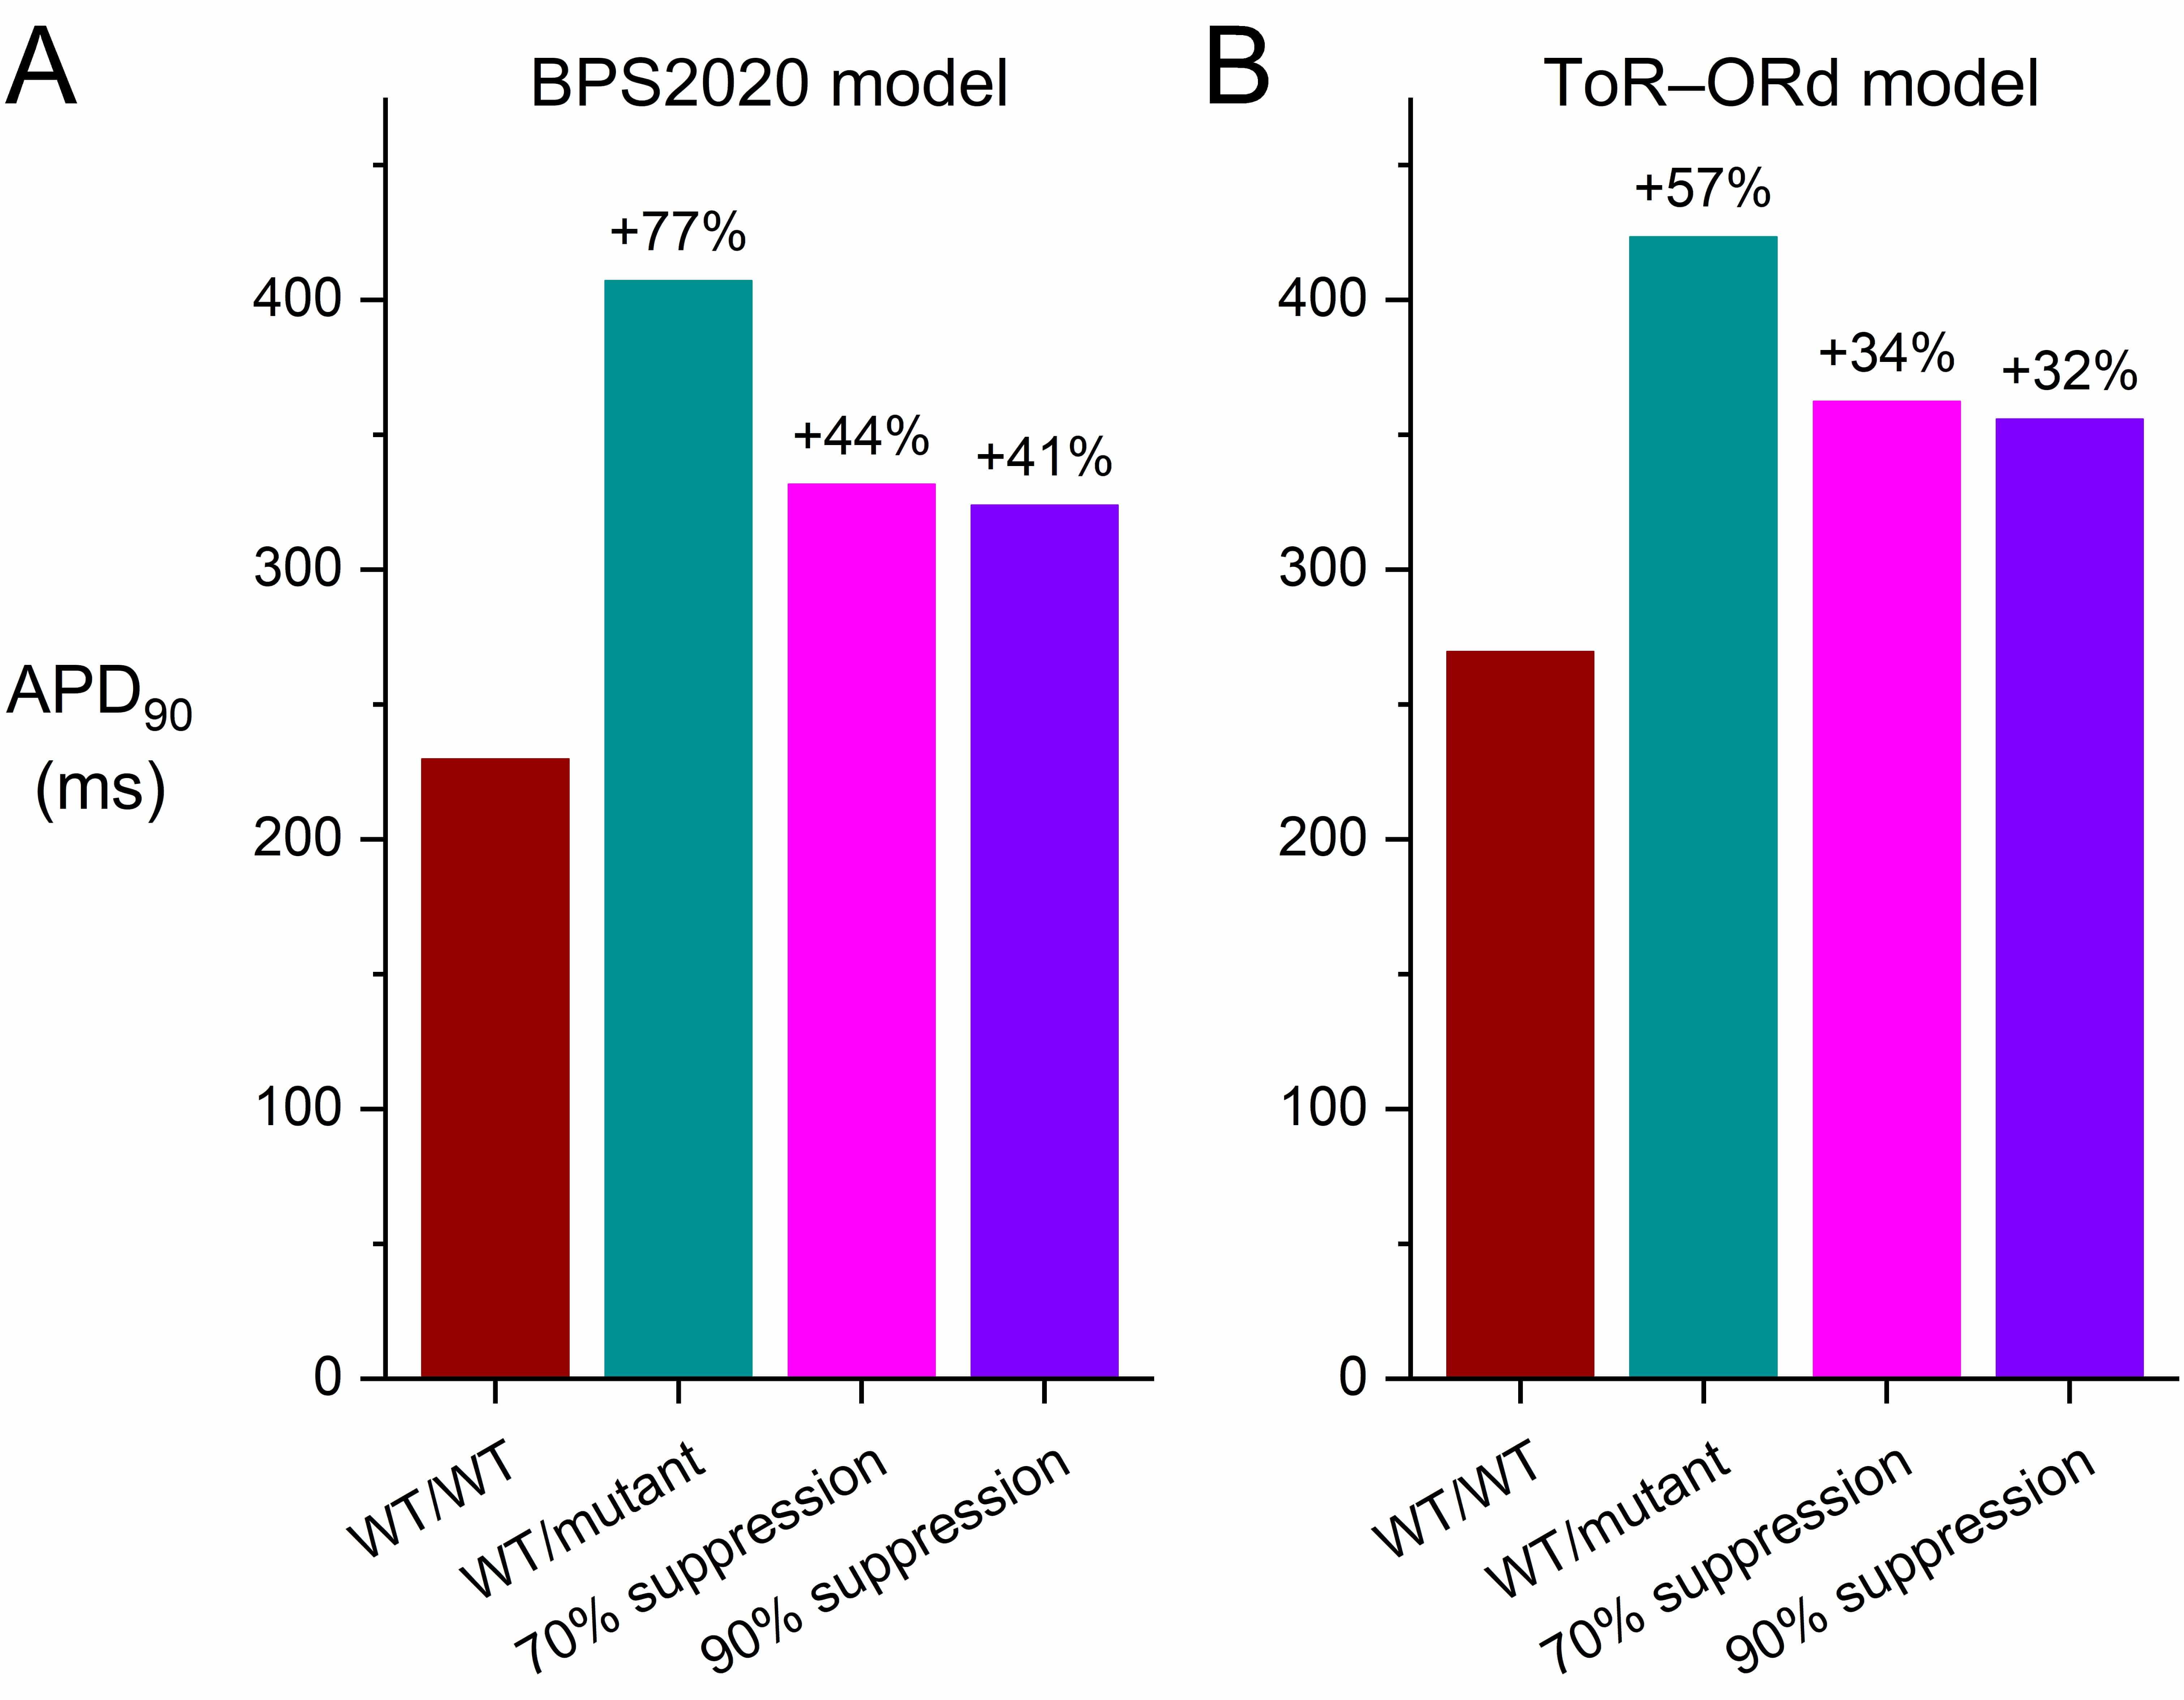 Fig. 9.
Effects of mild dominant-negative LQTS2 mutations on the AP
duration at 90% repolarization (APD90) of human ventricular cardiomyocytes,
and effects of mutant allele silencing. (A) APD90 of the default
(endocardial) version of the BPS2020 model at 1 Hz stimulation. (B) APD90 of
the default (endocardial) version of the ToR–ORd model at 1 Hz stimulation.
WT/WT, control (no mutation); WT/mutant, heterozygous loss-of-function mutation
in KCNH2; 70% suppression, 70% silencing of mutant
In the epicardial version of both models, highly similar effects of the mild mutation as well as the two levels of suppression are observed (Fig. 8C,F). However, the midmyocardial versions show a substantially different behavior (Fig. 8B,E). In the ToR–ORd model, the APs of the mutant version of the M cell show a repetitive pattern of EADs (Fig. 8E), whereas the APs obtained with the BPS2020 model do not show EADs (Fig. 8B), although the APs show a biphasic repolarization phase and EADs appear at a stronger reduction of the IKr conductance (e.g., to 20% instead of 31.25%; data not shown). The repetitive pattern of EADs observed in the ToR–ORd model is transformed into a pattern of EADs in every second AP at 70% suppression and is completely abolished at 90% suppression (Fig. 8E). Interestingly, the repetitive pattern of EADs in the M cell version of the ToR–ORd model, but not in its endocardial and epicardial versions, was also observed by Pan et al. [49], who reduced the maximum conductance of IKr to 25%, as compared to 31.25% in the present study, to simulate a heterozygous mutation in KCNH2 in a multiscale in silico study of the effects of a KCNQ1 antibody treatment for LQTS2 patients.
Fig. 10 shows the APD restitution curves for both the BPS2020 and ToR–ORd models in the case of a mild mutation (Fig. 10A,C) as well as the maximum slopes of these curves (Fig. 10B,D). As with the severe mutation, the mild mutation steepens the APD restitution curve in both models (Fig. 10A,C; ‘WT/mutant’ vs. ‘WT/WT’ curves), facilitating arrhythmogenic effects. Silencing the mutant allele by 70% or by 90% again reduces the steepness of the curves, but their slope again remains higher than under WT/WT conditions. The restitution curves at 70% and 90% suppression (Fig. 10A,C; ‘90% suppression’ vs. ‘70% suppression’ curves) are highly similar, which is to be expected from the only small additional silencing effect of 90% suppression compared to 70% suppression (setting the conductance of IKr to 52.59% vs. 50.07% of its control value).
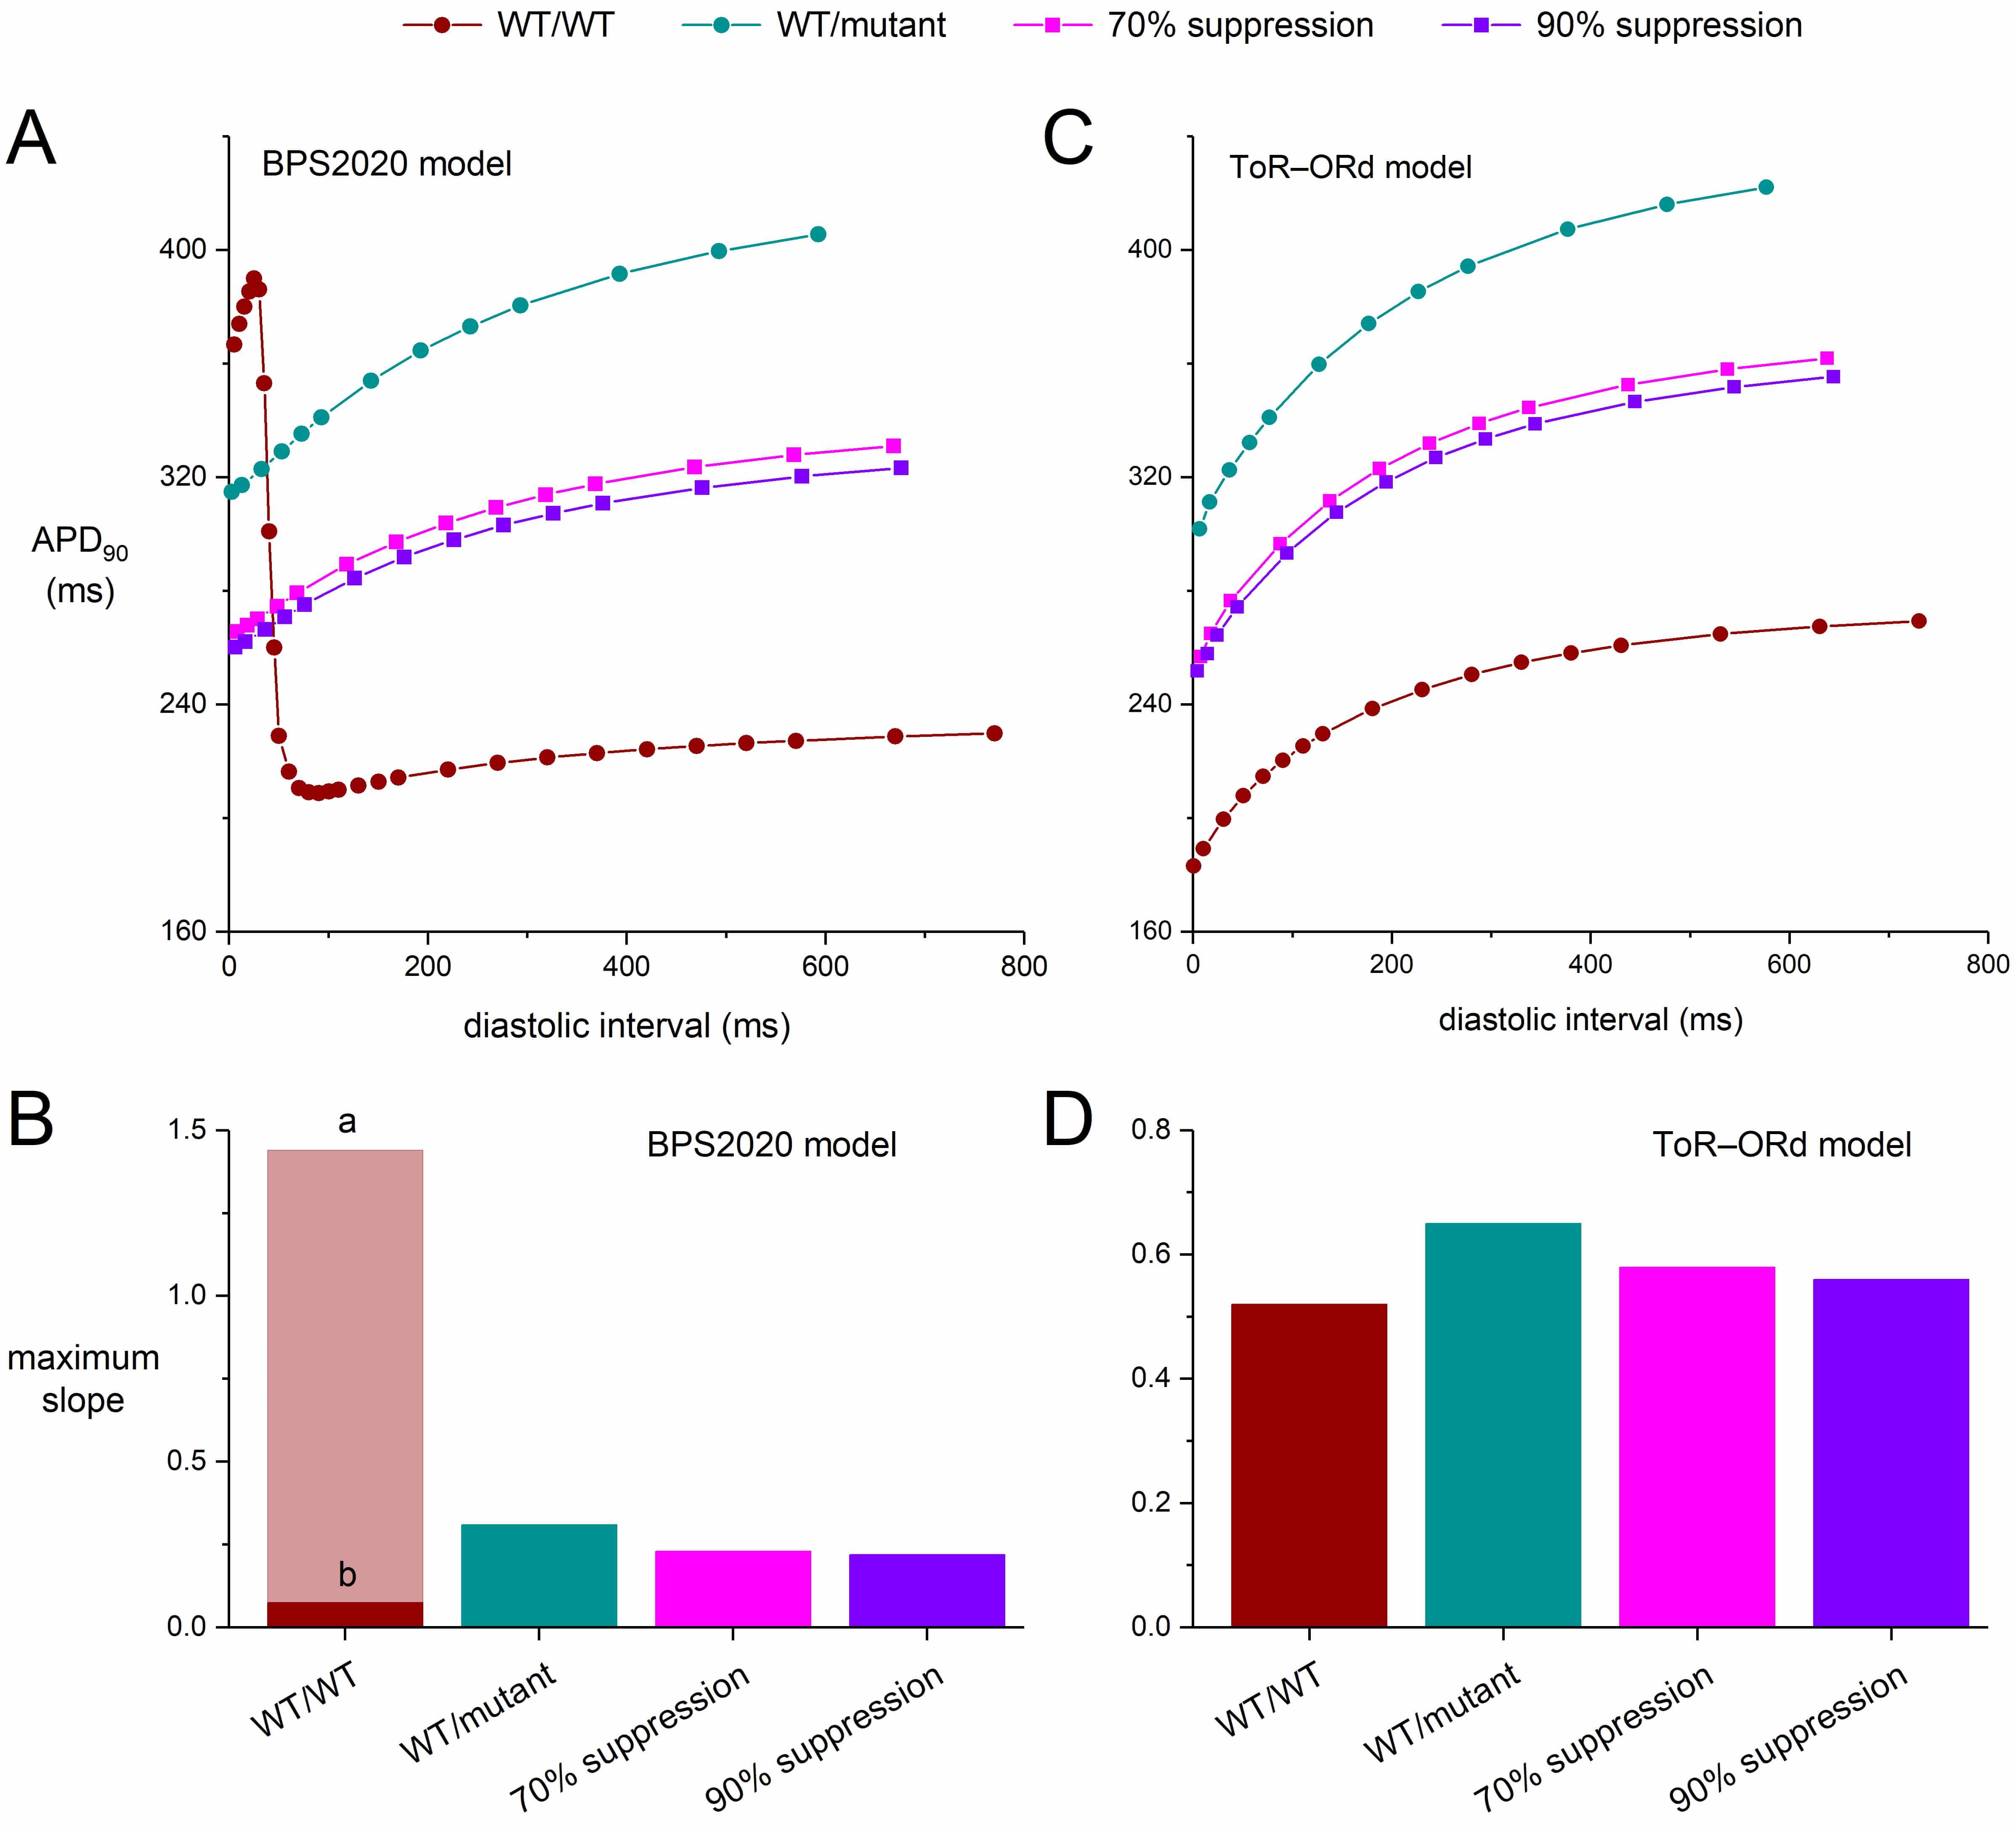 Fig. 10.
Effects of mild dominant-negative LQTS2 mutations on the
APD90 restitution curves of human ventricular cardiomyocytes obtained with
an S1-S2 pacing protocol, and effects of mutant allele silencing. After a train
of 100 S1 stimuli at 1 Hz, an S2 stimulus was applied over a range of diastolic
intervals and the APD90 upon the S2 stimulus was determined. (A) APD90
restitution curves of the default (endocardial) version of the BPS2020 model and
(B) the associated maximum slopes. Note the biphasic shape of the WT/WT curve and
the widely different maximum slopes during its phases labeled ‘a’ and ‘b’. (C)
APD90 restitution curves of the default (endocardial) version of the
ToR–ORd model and (D) the associated maximum slopes. WT/WT, control (no
mutation); WT/mutant, heterozygous loss-of-function mutation in KCNH2;
70% suppression, 70% silencing of mutant
The maximum slope of the BPS2020 restitution curve amounts to 0.31 for the WT/mutant curve, which is reduced to 0.23 and 0.22 with 70% and 90% silencing, respectively (Fig. 10B). Apart from the biphasic ‘WT/WT’ curve in the BPS2020 model, the steepening pattern in the ToR–ORd model (Fig. 10C,D) is again qualitatively but not quantitatively similar to that of the BPS2020 model (Fig. 10A,B). In the ToR–ORd model, the maximum slope of the APD restitution curve is 0.52 under WT/WT conditions and 0.65 with the mild mutation. The latter value is reduced to 0.58 and 0.56 with 70% and 90% silencing, respectively (Fig. 10D).
We simulated the electrophysiology of an isolated human ventricular cardiomyocyte using the two most recent comprehensive models of such a cell, which were developed in parallel. These models, i.e., the BPS2020 model [19] and the ToR–ORd [20] model, were published in 2020 and 2019, respectively. Both can be considered as major updates of the well-known and widely used O’Hara–Rudy dynamic (ORd) human ventricular cell model [21], which had become the “gold standard” for in silico human ventricular cellular electrophysiology [19]. To date, these two models are the only two major updates of the ORd model. Both models represent an endocardial myocyte by default, but also have midmyocardial and epicardial versions. In both models, the midmyocardial IKr density is 20% lower than in the default model, whereas it is 10% higher than in the default model in the epicardial version of the BPS2020 model, and 30% higher than in the default model in the epicardial version of the ToR–ORd model. The time and voltage dependence of IKr are quite similar in the two models (Figs. 3,8). Yet, the effects on their APs are less similar, as for example illustrated in Fig. 8B,E, which underscores the relevance of using more than a single model when assessing the effects of ion channel mutations.
In the present study, we attributed the dominant-negative nature of
LQTS2-associated loss-of-function mutations in KCNH2 entirely to a loss
in the number of functional channels by assuming that wild-type and mutant
KCNH2-encoded
In the extreme case where only IKr channels composed of four wild-type
As set out above, the effects of the silencing may be less beneficial than
sometimes anticipated due to the opposing effects of suppressing the mutant
allele on the one hand and the associated reduction of the expression level of
IKr channels on the other hand. These opposing effects are detailed in Fig. 11A. When the mutant allele is suppressed by a factor of sup, the
probability p that a subunit is WT becomes 1/(2–sup) (see Fig. 11A, inset). According to the binomial distribution (skewed if sup
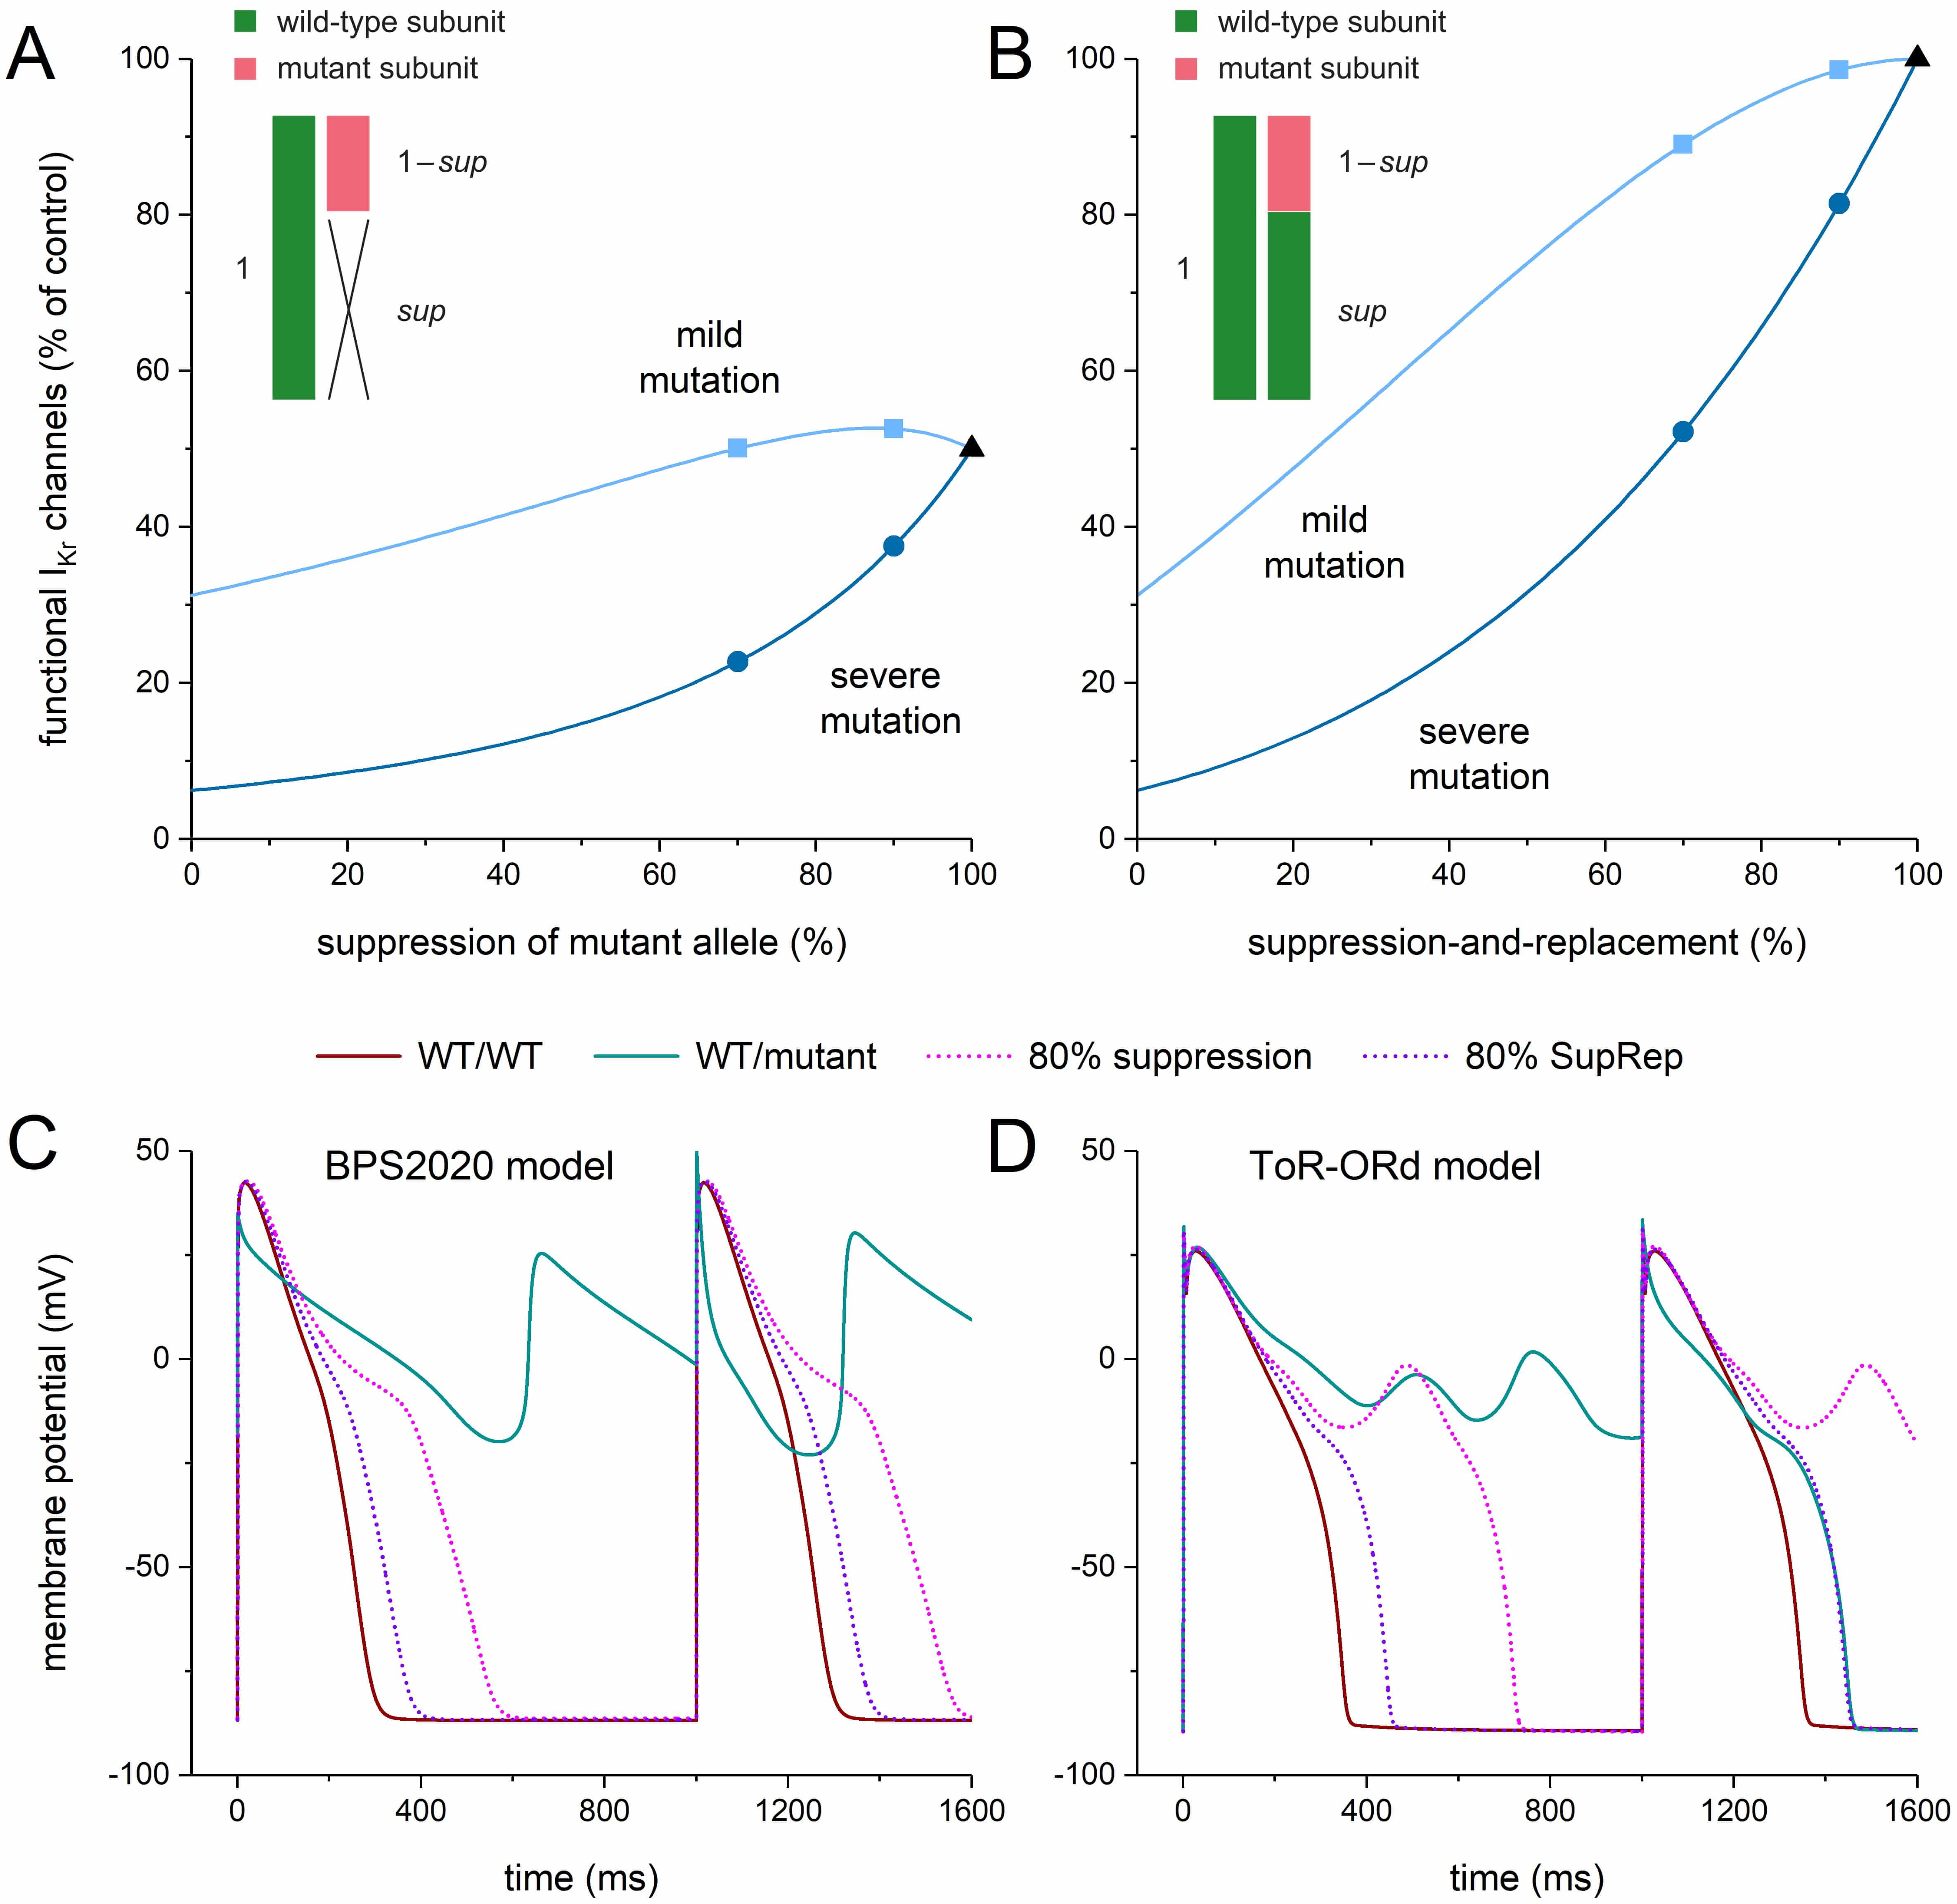 Fig. 11.
Functional I𝐊𝐫 at different levels of allele-specific
suppression of the mutant KCNH2 allele or its
suppression-and-replacement. (A,B) Percentage of functional IKr channels at
different levels of (A) allele-specific silencing of the mutant
It is important to note that the severe and mild mutations appear to respond
differently to silencing. For example, the percentage of functional channels
rises considerably from 23% to 38% if the silencing is raised from 70% to 90%
with severe mutations (Fig. 11A, dark blue circles), whereas it only rises from
50% to 53% with mild mutations (Fig. 11A, light blue squares). With a severe
mutation, increasing the level of suppression substantially and continuously
increases the percentage of functional channels, from 6% to 50%, over the
entire range of suppression (Fig. 11A, dark blue line). With a mild mutation,
this increase is only moderate, from 31% to 50% over the entire range of
suppression, and not continuously rising (Fig. 11A, light blue line). The largest
percentage of functional channels is achieved at 87% suppression and amounts to
53%. At 100% suppression, only the single wild-type allele is able to provide
The situation of Fig. 11A changes with the aforementioned SupRep gene therapy, which suppresses and replaces the mutant allele. The probability p that a subunit is WT now becomes (1+sup)/2 (see Fig. 11B, inset), whereas the total expression of IKr channels does not change, so that the factor representing the total expression of IKr channels relative to control becomes 1. With these factors, the above multiplication yields the curves shown in Fig. 11B. As with suppression per se (Fig. 11A), the severe and mild mutations respond differently to silencing (Fig. 11B). At 70% suppression-and-replacement, the percentage of functional channels amounts to 52% and 89% for severe and mild mutations, respectively (Fig. 11B, circle and square, respectively, at 70% suppression-and-replacement) as opposed to the values of 23% and 50%, respectively, with suppression per se. These numbers increase to 81% and 99%, respectively, with 90% suppression-and-replacement (Fig. 11B, circle and square, respectively, at 90% suppression-and-replacement) as opposed to the values of 38% and 53%, respectively, with suppression per se. With 100% suppression-and-replacement, the percentage of functional channels is 100% (Fig. 11B, black triangle) as opposed to the value of 50% obtained with suppression per se (Fig. 11A, black triangle).
Fig. 11C,D illustrates the effects of 80% suppression-and-replacement as compared to 80% suppression per se in the midmyocardial versions of the BPS2020 model (Fig. 11C) and the ToR–ORd model (Fig. 11D) in the case of a severe mutation in KCNH2. In the BPS2020 model, the repetitive EAD pattern is no longer observed with 80% suppression, as in the case of the 70% and 90% suppression of Fig. 3B. However, the associated APD90 is increased by as much as 251 ms compared to WT/WT (from 283 to 534 ms; +89%). This increase is strongly reduced to 75 ms (+26%) with 80% suppression-and-replacement (Fig. 11C). In the ToR–ORd model, the 80% suppression is not sufficient to stop the development of EADs (Fig. 11D), as in the case of the 70% and 90% suppression of Fig. 3E. EADs are not observed with 80% suppression-and-replacement. A regular AP pattern occurs with an APD90 that is increased by 95 ms compared to WT/WT (from 348 to 444 ms; +27%).
We should keep in mind that all of the above results were obtained using single-cell models. One could argue that the observed midmyocardial EADs might be absent, or at least diminished, if the midmyocardial cells are electrically coupled to their endocardial and epicardial neighbors, as they are in the whole heart. Fig. 12 illustrates the effects of this electrical coupling. It shows the results of simulations with the computationally efficient human ventricular cell model by Ten Tusscher and Panfilov (known as the TP06 model, updated as described in the Materials and Methods section).
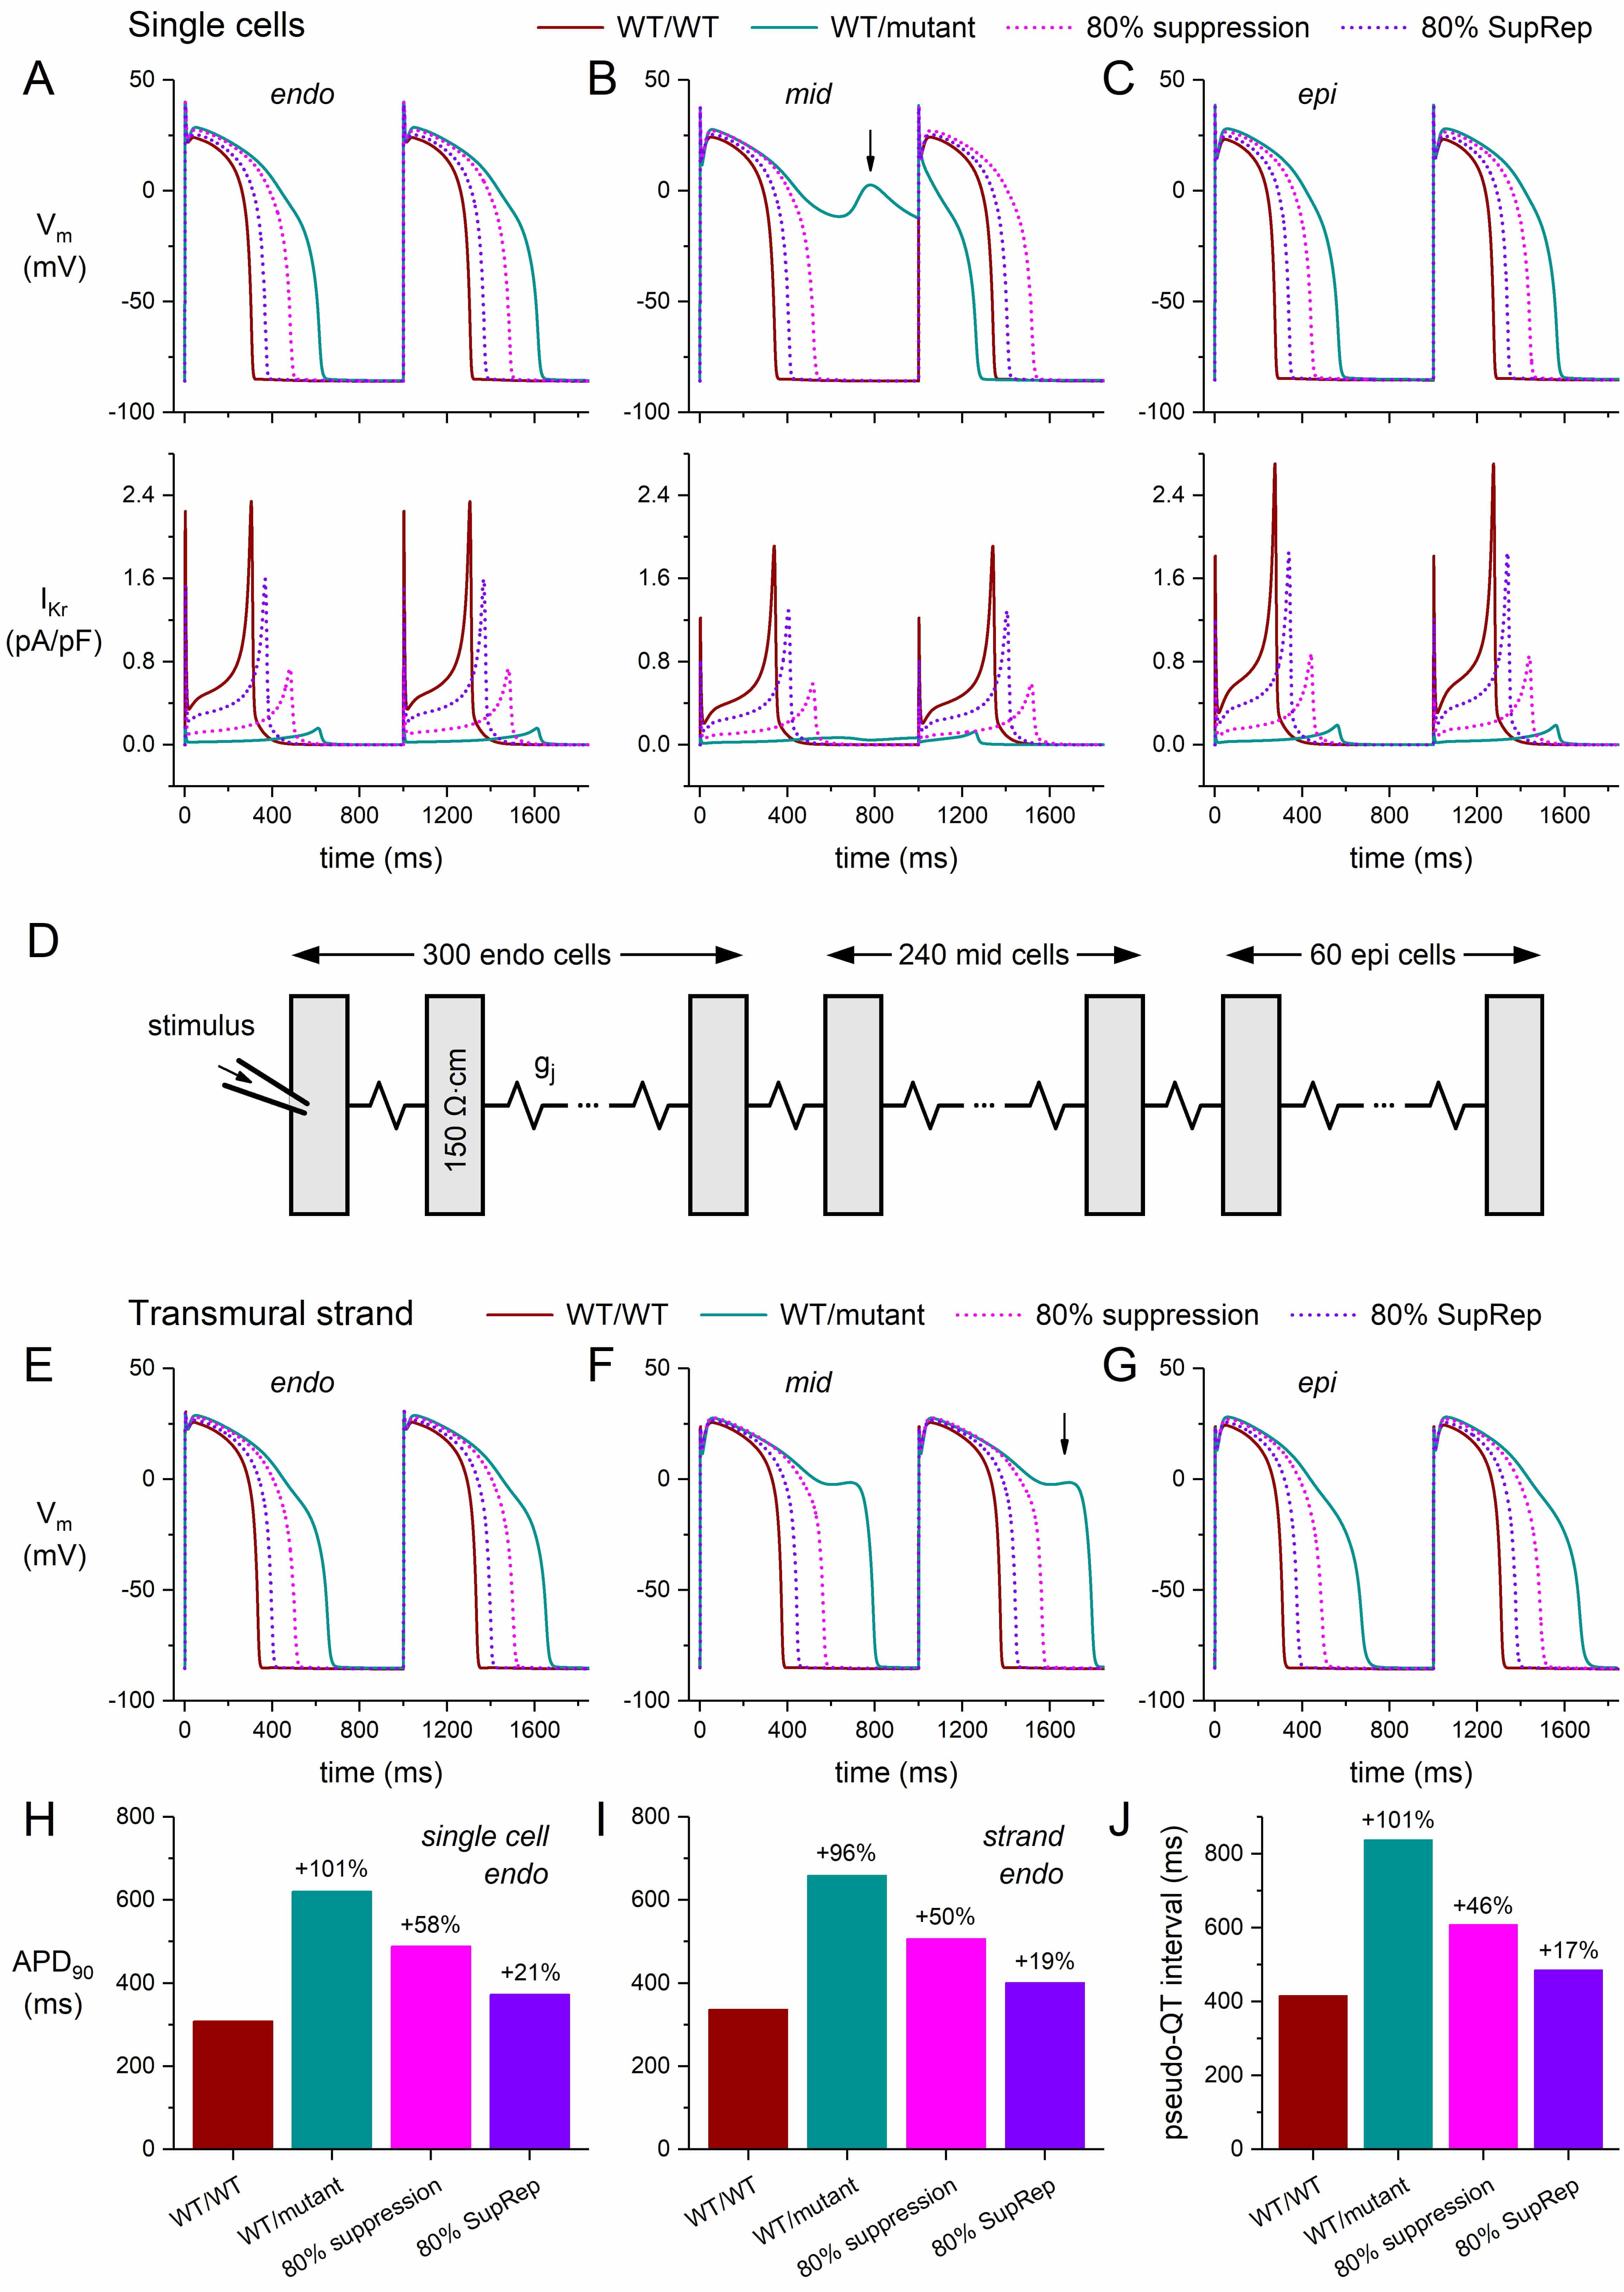 Fig. 12.
Simulations of a severe dominant-negative mutation in
KCNH2, and the effects of mutant allele silencing, in single human
ventricular cardiomyocytes and in a transmural strand of such myocytes. (A–C)
Membrane potential (Vm; top) and associated IKr (bottom) of the (A)
endocardial (‘endo’), (B) midmyocardial (‘mid’), and (C) epicardial (‘epi’)
versions of the updated single-cell TP06 model at 1 Hz stimulation. (D)
Arrangement of the cells in the transmural strand. The strand is composed of 600
human left ventricular myocytes, which are arranged transversally and coupled by
an intercellular coupling conductance gj of 6 µS. Cytoplasmic
resistivity is set to 150
First, we assessed the shape of the APs and associated IKr of the endocardial, midmyocardial, and epicardial single-cell versions of the updated TP06 model, not only under control conditions, but also in the case of a severe mutation in KCNH2 and its suppression. The obtained action potentials and IKr are shown in Fig. 12A–C. The WT/WT and WT/mutant traces resemble those of the BPS2020 and ToR–ORd models (Fig. 3B,E), including the significant increase in APD90 (by 101% from 308 to 620 ms; Fig. 12A,H) and the emergence of EADs in the midmyocardial version of the model (Fig. 12B, vertical arrow). Similar to the ToR–ORd model (Fig. 3E), the midmyocardial cell exhibits an alternating pattern of incomplete and short APs in the WT/mutant case. Similar to the 70% and 90% suppression in the BPS2020 and ToR–ORd models (Fig. 3A,D, dotted lines), applying the 80% suppression to the default (endocardial) version of the updated TP06 model reduces the increase in APD90 from +101% to +58% (Fig. 12A,H). Silencing by 80% suppression-and-replacement further reduces the increase in APD90 to +21% (Fig. 12A,H).
Next, we ran simulations with a transmural strand composed of 300 endocardial,
240 midmyocardial, and 60 epicardial cells [37] (Fig. 12D) that were coupled by a
gap junctional conductance (gj) of 6 µS [38], as detailed in
the Materials and Methods section. The cytoplasmic resistivity was set to 150
Fig. 12E–G shows the action potentials of the middle endocardial cell (cell #150 of the strand), the middle midmyocardial cell (cell #420), and the middle epicardial cell (cell #570). Due to the strong electrical coupling, the shapes and durations of the endocardial, midmyocardial, and epicardial APs differ less than in the single-cell simulations (Fig. 12A–C). However, the effects of the severe mutation, as well as those of the 80% suppression or 80% suppression-and-replacement, on the endocardial and epicardial AP shape (Fig. 12E vs. Fig. 12A and Fig. 12G vs. Fig. 12C, respectively) and duration (Fig. 12I vs. Fig. 12H) are only moderately different. With the electrical coupling in the strand, the alternating AP pattern of the single midmyocardial cell of Fig. 12B turns into the more regular pattern of Fig. 12F, but the midmyocardial cells (cell #420 and—not shown in Fig. 12—its neighboring midmyocardial cells #363–#456) still show EADs (with the most prominent EADs occurring in cell #413). The disproportionate AP prolongation and EAD development of the midmyocardial cells upon the mutation-induced strong decrease in IKr (Fig. 12B,F) have also been observed in vitro upon application of IKr blockers (see Antzelevitch [55] and references cited therein). Now that the transversal activation time is not much affected by the mutation, the disproportionate AP prolongation of the midmyocardial cells in the strand also results in a prominent increase of the transmural dispersion of repolarization (see below).
From our strand simulations, we computed the pseudo-QT interval as the time interval between the earliest activation and the latest repolarization in the strand [54, 56]. For each cell in the strand, we computed the time of its repolarization as the sum of the time of its activation (relative to the time of activation of cell #1) and its APD90 [54, 56]. The results are shown in Fig. 12J. Under control conditions, the pseudo-QT interval is 416 ms (Fig. 12J, leftmost bar). In case of the severe mutation in KCNH2, the pseudo-QT interval is as large as 838 ms, which is reduced to 608 and 486 ms with 80% suppression and 80% suppression-and-replacement, respectively.
Augmentation of the transmural dispersion of repolarization (TDR) has since long been associated with the development of potentially lethal reentrant arrhythmias [57, 58, 59, 60, 61, 62, 63, 64]. Fig. 13 shows that the simulation results of Fig. 12 are accompanied by a substantial increase in TDR with a severe loss-of-function mutation in KCNH2, with an increase in TDR from 73 ms under WT/WT conditions to as much as 175 ms (+139%) under WT/mutant conditions (Fig. 13B). This TDR is reduced to 96 ms (+30%) in response to 80% suppression per se and to 78 ms (+7%) in response to 80% suppression-and-replacement (Fig. 13B).
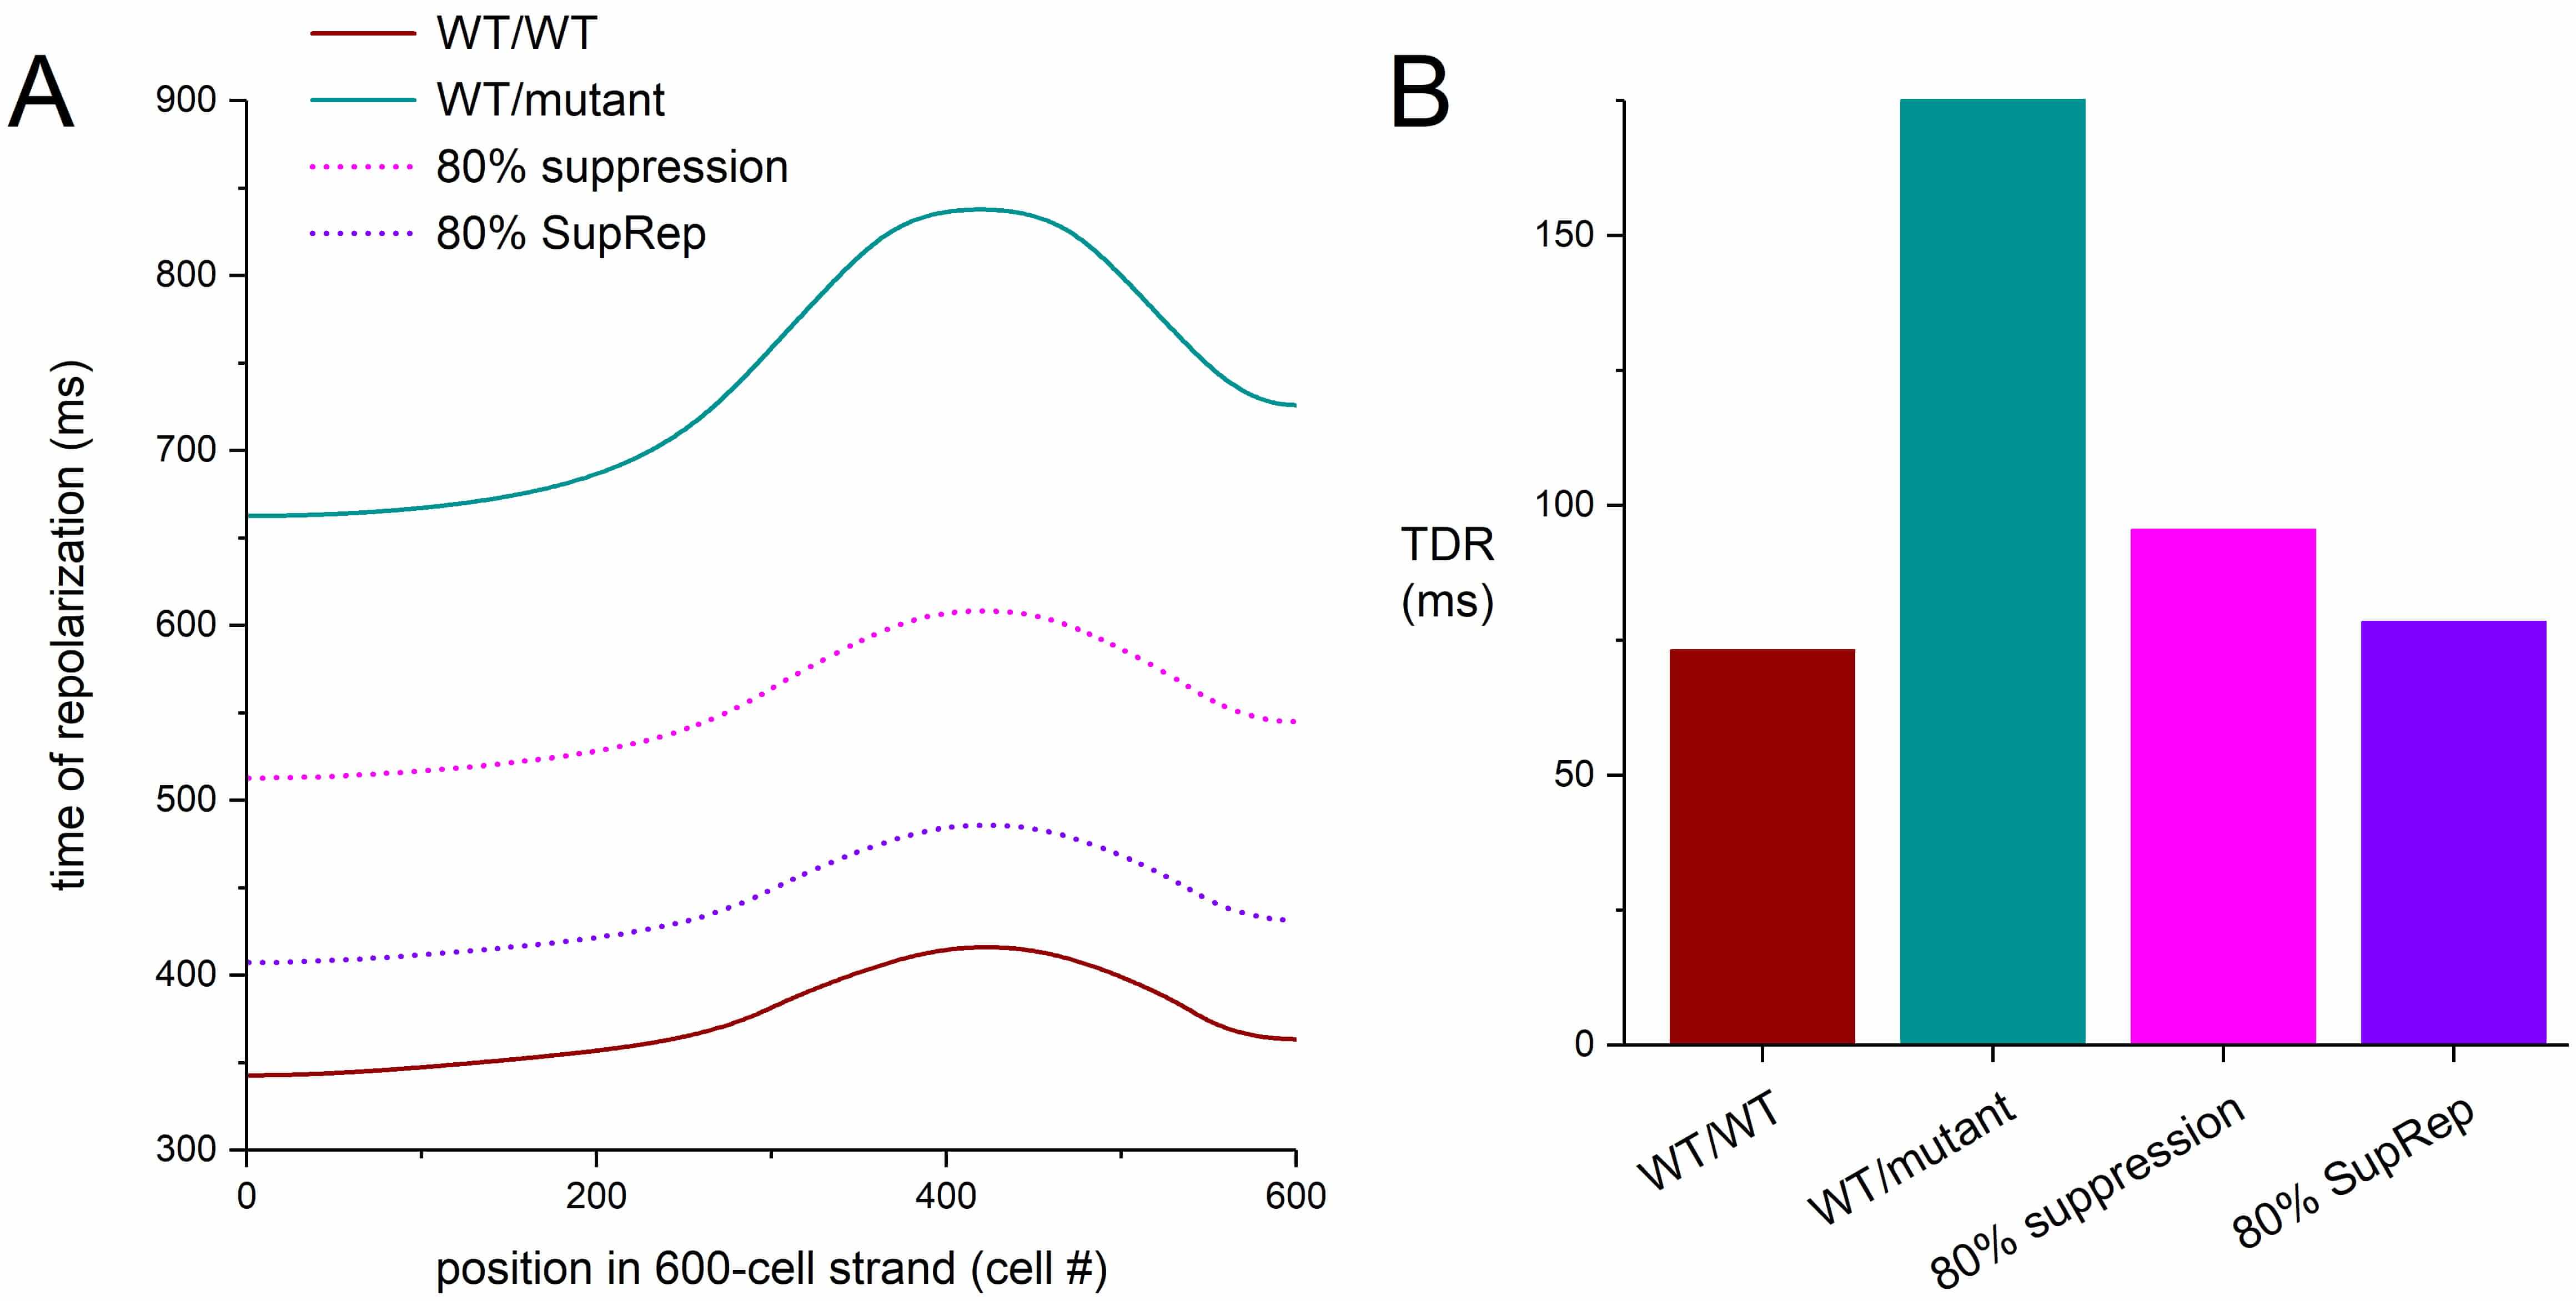 Fig. 13.
Dispersion of repolarization in a transmural strand of human
ventricular cardiomyocytes. (A) Time of repolarization in the transmural strand
of Fig. 12. Cell #1 of the 600-cell strand is stimulated at 1 Hz and the time of
repolarization of each cell is determined from its time of activation, relative
to the activation of cell #1, and its APD90. (B) Transmural dispersion of
repolarization (TDR) as determined from the difference between the latest and
earliest time of repolarization in the strand. WT/WT, control (no mutation);
WT/mutant, severe heterozygous loss-of-function mutation in KCNH2; 80%
suppression, 80% silencing of mutant
In an interesting simulation study, Jiang et al. [65] demonstrated how carbon monoxide (CO) increased the AP duration and augmented the transmural dispersion of repolarization in a one-dimensional transmural tissue strand model, based on the O’Hara–Rudy human ventricular cardiomyocyte model [21]. The similarities between the results of the present study and those obtained by Jiang et al. [65] are largely due to the inhibitory effect of CO on IKr [65].
As demonstrated in the present study, silencing of the loss-of-function mutant KCNH2 allele may alleviate its effects, but with the imperfection that the effects of the associated long QT syndrome type 2 cannot be completely cancelled. The suppression leads to an increased expression of functional IKr channels, but not to a level that corresponds with the wild-type level (Fig. 11A). To achieve perfection, the mutant allele should not only be suppressed but also replaced (Fig. 11B). Such “suppression-and-replacement” (“SupRep”) gene therapy has been proposed and tested in vitro for LQT1 and LQT2 related loss-of-function mutations in KCNQ1 and KCNH2 [18, 66] as well as in vivo for an LQT1 related loss-of-function mutation in KCNQ1 [67] with promising results.
Silencing of the mutant allele can substantially, though not completely, counteract the effects on IKr of mild or severe LQTS2 mutations in KCNH2. Allele-specific inhibition of the mutant KCNH2 allele per se is not sufficient to treat the effects of these LQTS2 mutations and should be accompanied by a replacement gene therapy, thus creating a suppression-and-replacement (“SupRep”) gene therapy.
The source code of the BPS2020 model is publicly available in the CellML Model Repository (https://models.cellml.org/workspace/711). The source code of the ToR–ORd model is publicly available on the GitHub platform (https://github.com/jtmff/torord). The source of each of the endocardial, midmyocardial, and epicardial versions of the TP06 model is publicly available in the CellML Model Repository (https://models.cellml.org/workspace/tentusscher_panfilov_2006). The Fortran 95 code for the one-dimensional strand of TP06 myocytes as well as the datasets created and analyzed during this study are available from the corresponding author on reasonable request.
RW confirms sole responsibility for the following: study conception and design and manuscript writing. RW read and approved the final manuscript.
Not applicable.
The author acknowledges the initiative of the developers of the BPS2020 and ToR-ORd models to make their model code publicly available.
This research received no external funding.
The author declares no conflict of interest.
References
Publisher’s Note: IMR Press stays neutral with regard to jurisdictional claims in published maps and institutional affiliations.