


 , Yashi Shi 1,2,3,4, Xite Lin 1,2,3,4, Maotong Zhang 1,2,3,4, Xiaodan Mao 2,3,4,*
 , Pengming Sun 2,3,4,*
1 College of Clinical Medicine for Obstetrics & Gynecology and Pediatrics, Fujian Medical University, 350001 Fuzhou, Fujian, China
2 Laboratory of Gynecologic Oncology, Fujian Maternity and Child Health Hospital, College of Clinical Medicine for Obstetrics & Gynecology and Pediatrics, Fujian Medical University, 350001 Fuzhou, Fujian, China
3 Fujian Key Laboratory of Women and Children’s Critical Diseases Research, Fujian Maternity and Child Health Hospital (Fujian Women and Children’s Hospital), 350001 Fuzhou, Fujian, China
4 Fujian Clinical Research Center for Gynecological Oncology, Fujian Maternity and Child Health Hospital (Fujian Obstetrics and Gynecology Hospital), 350001 Fuzhou, Fujian, China
Abstract
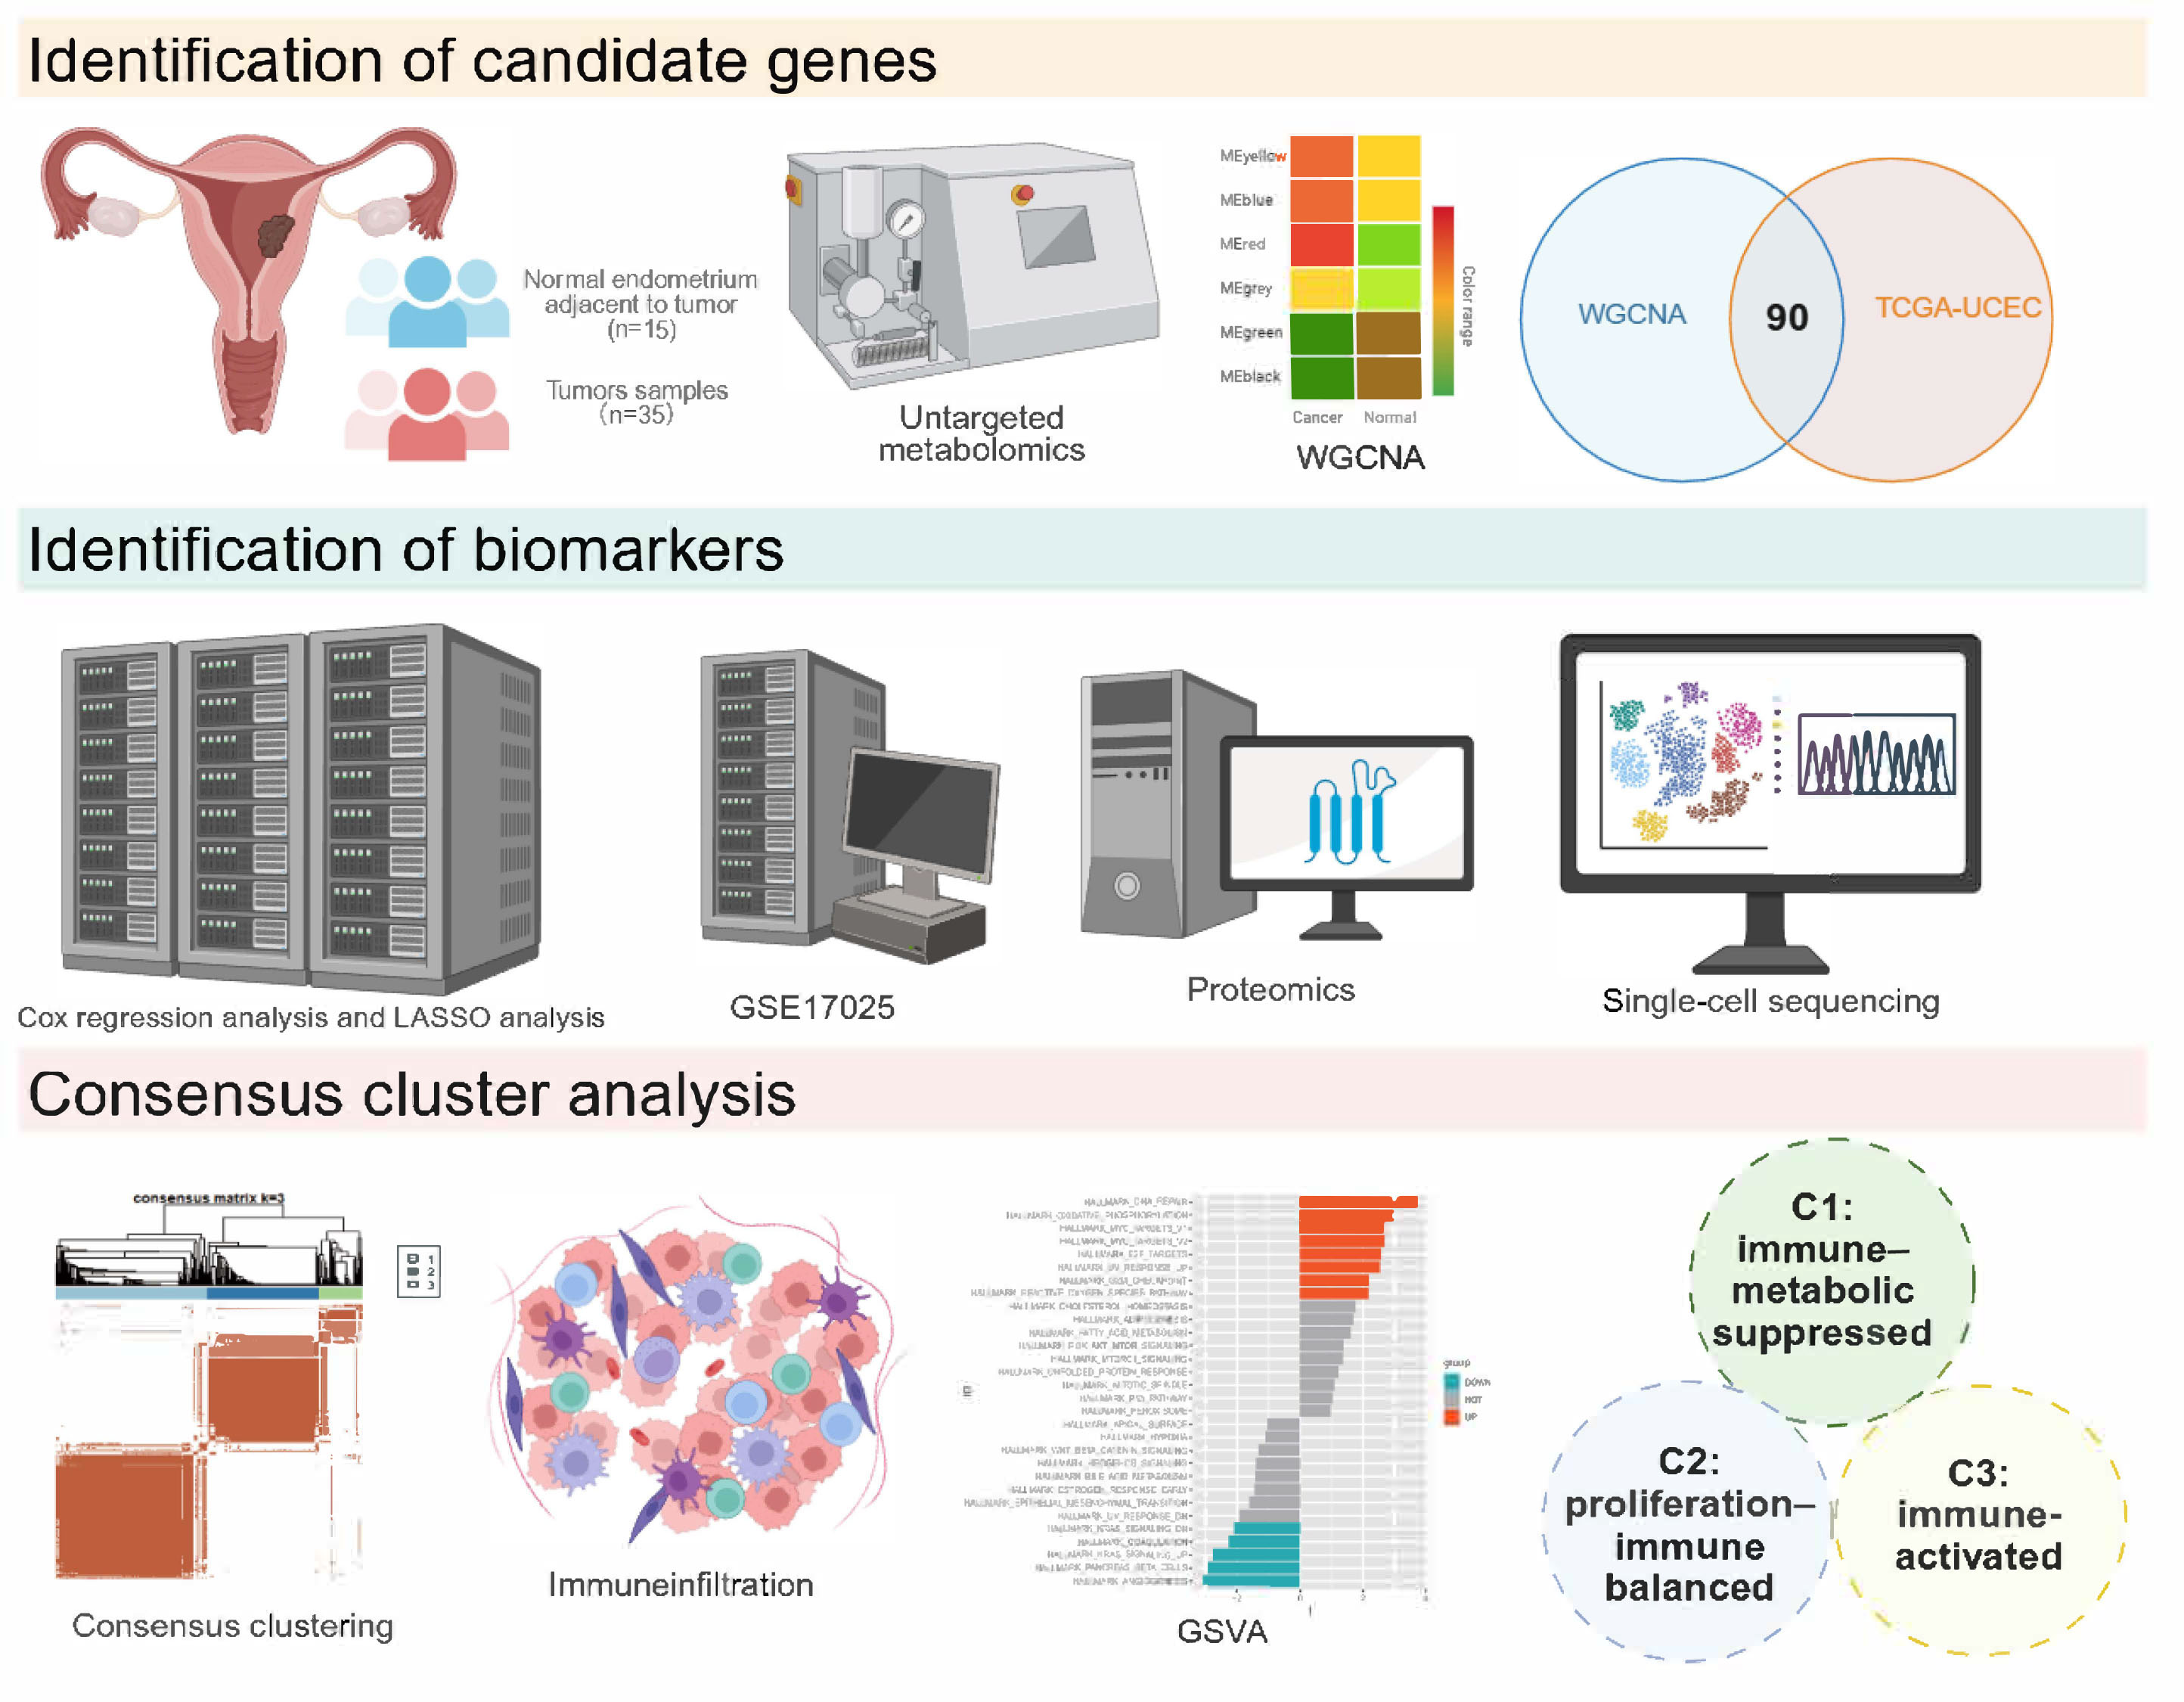
Metabolic reprogramming is a hallmark of the pathogenesis and progression of endometrial carcinoma (EC). This study comprehensively analyzed the expression profiles of glycine, serine, and threonine (Gly/Ser/Thr) metabolism–related genes in EC. We also established a robust prognostic model and developed a molecular subtyping framework that integrates metabolic and immune characteristics based on the identified prognostic genes. The aims of this work are to enhance diagnostic precision and improve clinical management strategies for patients with EC.
Untargeted metabolomic analysis was performed on 35 EC and 15 normal tissues. The Cancer Genome Atlas (TCGA) transcriptomic data were integrated with weighted gene co-expression network analysis (WGCNA) to identify EC-related metabolic genes and construct a prognostic model using Cox proportional hazards and least absolute shrinkage and selection operator (LASSO) regression analyses. The model was validated using an independent proteomic and single-cell dataset from our institution. Consensus clustering classified patients into three molecular subtypes, which were further characterized by gene set variation analysis (GSVA) and profiling of immune infiltration. Finally, key prognostic genes were validated by reverse transcription quantitative polymerase chain reaction (RT-qPCR) in EC and normal endometrial epithelial cells.
Metabolomic analysis revealed significant enrichment of the Gly/Ser/Thr metabolic pathways. WGCNA identified a tumor-associated metabolic module among 1741 pathway-related genes. A prognostic model comprising methylenetetrahydrofolate dehydrogenase 2 (MTHFD2), ribosomal protein S6 kinase A1 (RPS6KA1), and cyclin-dependent kinase inhibitor 2A (CDKN2A) was subsequently established. Consensus clustering based on risk scores stratified EC patients into three molecular subtypes: immunometabolic-suppressed (C1), proliferative-immunobalanced (C2), and immune-activated (C3). The C1 subtype had the poorest prognosis and was characterized by metabolic suppression and immune evasion. The C2 subtype showed a favorable prognosis and was defined by a “proliferation–immune balance” in which high proliferative activity coexisted with strong anti-tumor immunity. The C3 subtype was also associated with a favorable outcome, driven by upregulated DNA repair and oxidative phosphorylation pathways alongside infiltration of immune-active cells. RT-qPCR confirmed significant differences in the mRNA expression of MTHFD2, RPS6KA1, and CDKN2A between normal and EC cells (p < 0.05).
This study developed a Gly/Ser/Thr pathway–based prognostic model for EC, based on the expression of MTHFD2, RPS6KA1, and CDKN2A as novel biomarkers. The resulting patient stratification framework holds significant clinical potential for guiding precise and personalized management of EC.
Graphical Abstract
Keywords
- endometrial cancer
- metabolic pathways
- prognosis
- biomarkers
- bioinformatics
Endometrial cancer (EC) represents a major global disease burden, with 420,242
newly diagnosed cases and 97,704 EC-related deaths worldwide in 2022. Both the
incidence and mortality of EC continue to rise [1, 2], and the growing prevalence
of metabolic risk factors for EC is expected to further increase its incidence.
While early-stage EC patients often achieve good outcomes through surgery,
advanced cases still have high recurrence and mortality, with a five-year
survival rate of
Metabolic reprogramming plays a key role in tumorigenesis and progression.
Rapidly proliferating tumor cells require more energy and rely heavily on amino
acids to support protein synthesis, nucleotide production, and redox balance [4].
To meet these demands, tumor cells upregulate amino acid transporters (e.g.,
alanine, serine, cysteine transporter 2, L-type amino acid transporter 1) and
metabolic enzymes (e.g., glutaminase, indoleamine 2,3-dioxygenase), effectively
hijacking the hosts’ amino acid resources [4, 5, 6]. This dependence on amino acid
metabolism has emerged as a novel therapeutic target. Among the relevant
pathways, the glycine-serine-threonine (Gly/Ser/Thr) axis has drawn attention due
to its metabolic synergy in tumor progression. For instance, REV1 DNA directed
polymerase promotes metabolic reprogramming by regulating the key enzyme
cystathionine
Based on this, we conducted a systematic study of Gly/Ser/Thr pathway–related genes in EC to provide a theoretical foundation for building an EC-specific, metabolic-based prognostic model. This may lead to more precise patient stratification, which is an essential step toward precision medicine in EC.
This study included 99 endometrial samples, comprising 60 EC tissues and 39 matched normal endometrial tissues (non-malignant, collected within 2 cm of the tumor). Samples were obtained at Fujian Maternity and Child Health Hospital during routine clinical procedures. All patients provided written informed consent for their tissues to be used in this study.
Specifically, 35 EC samples and 15 normal endometrial samples were used for metabolomics analysis. A further 24 EC samples and 23 matched adjacent normal endometrial tissues were used for proteomics analysis. The final EC sample and paired adjacent normal endometrial tissue were used for single-cell RNA sequencing. The datasets were generated from independent sample cohorts, with no overlap among different omics analyses.
After collection, EC and adjacent normal tissues (Supplementary Table 1) were numbered, weighed, and placed in EP tubes. Extraction buffer (methanol: acetonitrile: water = 2:2:1, with isotope-labeled standards) was added to the samples, which were then homogenized and sonicated in cycles. They were subsequently incubated at –40 °C for 1 h and then centrifuged at 12,000 rpm for 15 minutes at 4 °C. The supernatant was transferred to glass vials for liquid chromatography-mass spectrometry/mass spectrometry analysis (Thermo Fisher Vanquish system, Waltham, MA, USA). Metabolomics analysis was performed by BIOTREE BIOTECH (Shanghai, China), and the metabolites were identified using an in-house database.
Differential metabolites were identified using two criteria: p
The study workflow is shown in Supplementary Fig. 1. TCGA-Uterine Corpus Endometrial Carcinoma (UCEC) data were obtained from The Cancer Genome Atlas, GSE17025 data from the Gene Expression Omnibus (GEO), and PDC000125 data from the CPTAC database.
Using the WGCNA package (Version 1.73, Bioconductor, USA) [12], 539 tumor
samples and 35 normal samples from TCGA-UCEC were analyzed to find gene modules
linked to EC development. We started by selecting the top 25% most variable
genes and calculating a Pearson correlation matrix based on mRNA data. After
clustering samples to identify outliers, the optimal soft threshold (
The limma package (Version 3.58.1, Bioconductor, USA) [13] was used for
differential expression analysis of TCGA-UCEC and GEO data, with screening
criteria of
The ConsensusClusterPlus package (Version 1.66.0, Bioconductor, USA) [14] was used for consensus clustering analysis, with 1000 iterations for stability and reproducibility. The principal component analysis (PCA) method determined the optimal cluster number (k = 2–10), and the internal consistency index assessed the clustering stability. PCA was used to evaluate subtype separation based on expression patterns. Survival analysis was performed using the survival (Version 3.5.7, CRAN, Vienna, Austria) and survminer (Version 0.4.9, CRAN, Vienna, Austria) packages to compare prognostic outcomes across EC subtypes.
A total of 537 patients with survival data were selected from the TCGA database
and randomly split into training and test sets at a 7:3 ratio. Univariate Cox
regression was used to analyze 90 key metabolic genes for survival associations,
identifying significant prognostic genes. Least absolute shrinkage and selection
operator (LASSO) regression further filtered prognosis-related genes, and common
genes from both methods were analyzed with multivariate Cox regression. The
prognostic model was built using LASSO-Cox regression. The risk score was
calculated using the following formula:
The maftools package (Version 2.18.0, Bioconductor, USA) was used to retrieve tumor mutation data for UCEC patients from the TCGA database. The mutation status of different risk populations was analyzed, and the combined effects of risk scores and TMB on patient survival outcomes were examined.
Tumor immune dysfunction and exclusion (TIDE) scores for UCEC patients were obtained from the TIDE database. The chi-square test was used to assess differences in immunotherapy responses between different risk groups of EC patients. The CIBERSORT algorithm [16] was employed to assess differences in the levels of infiltrating immune cells in the tumor microenvironment (TME). The limma package was used for differential expression analysis of several classical immune checkpoint genes, while the estimate package (Version 1.0.13, CRAN, Vienna, Austria) was used to evaluate the TME.
Formalin-fixed, paraffin-embedded tissue samples were deparaffinized with xylene
and ethanol, then homogenized in lysis buffer containing Tris-hydrochloride,
dithiothreitol, and sodium dodecyl sulfate. After incubation at 99 °C
for 60 minutes, the samples underwent ultrasonication, centrifugation,
iodoacetamide alkylation, and acetone precipitation. Proteins were resuspended in
8M urea and analyzed by mass spectrometry using DIA-NN (Version 1.8, Berlin, Germany) with a false
discovery rate set at 1%. Fisher’s exact test and Pearson’s test identified
differentially expressed proteins (p
Fresh tumor tissues were cut into 1–3 mm3 fragments and single-cell
suspensions subsequently prepared using a single-cell 3′ Library and Gel Bead Kit
V3.1 (10x Genomics, Pleasanton, CA, USA). Following enzymatic digestion and cell
purification, the cell viability exceeded 90%, with a final cell concentration
of 700–1200 cells/µL. Gel bead-in-emulsions (GEMs) were generated using a
Chromium Single-Cell G Chip Kit (10x Genomics, Pleasanton, CA, USA), after which cell
lysis, reverse transcription with unique molecular identifiers (UMIs), cDNA
amplification, fragmentation, end repair, and adapter ligation were sequentially
performed according to the manufacturer’s protocol. The resulting libraries were
sequenced on the Illumina platform. Raw sequencing data were processed using Cell
Ranger (10x Genomics, Pleasanton, CA, USA) for read alignment, barcode processing,
and UMI counting. Downstream analyses were performed in Seurat (Version 4.3.0,
CRAN, Vienna, Austria), including quality control (cells with
GSVA was conducted to evaluate enrichment with hallmark pathways using the GSVA
package (Version 1.50.0, Bioconductor, USA). Hallmark gene sets were obtained
from MSigDB through the msigdbr package (Version 7.5.1, CRAN, Vienna, Austria)
and converted to Entrez IDs to match the RNA-seq expression matrix. Differential
pathway activity between groups was analyzed with limma using empirical Bayes
moderation, with significance defined as p
All cell lines were maintained in culture media containing 10% fetal bovine serum (FBS; Gibco, MT, USA) and 1% antibiotic–antifungal mixture (Basal Media, Shanghai, China). HEC-1A cells (KeyGEN BioTECH, Nanjing, China) were grown in McCoy’s 5A medium without sugar and supplemented with glucose (Procell Life Science & Technology Co., Ltd., Wuhan, China). Ishikawa cells (KeyGEN BioTECH, Nanjing, China) were maintained in RPMI-1640 medium containing glucose (Procell Life Science & Technology Co., Ltd., Wuhan, China), whereas endometrial epithelial cells (EECs) (Whelab, Shanghai, China) were cultured in MEM supplemented with non-essential amino acids (NEAA; Procell Life Science & Technology Co., Ltd., Wuhan, China). All cell lines were maintained at 37 ℃ in a humidified atmosphere, validated by STR profiling, and tested negative for mycoplasma (Biowing Biotechnology Co., Ltd., Shanghai, China).
Cells were lysed directly in the culture dishes using RNA extraction reagent, and the lysates were thoroughly vortexed. After centrifugation, the supernatant was collected into a new tube. For phase separation, 0.25 mL of chloroform was added to every 1 mL of the extraction reagent. Following another centrifugation, the upper aqueous phase was carefully transferred to a clean tube. RNA was precipitated with isopropanol and subsequently washed with 75% ethanol. First-strand cDNA synthesis was carried out according to the manufacturer’s instructions. Following preparation of the PCR master mix (Promega, Madison, WI, USA), quantitative PCR was conducted using the Eastep qPCR Master Mix (Promega, USA). The primer sequences are shown in Table 1. GAPDH was used as the reference gene to determine relative gene expression levels with the 2-ΔΔCT method.
| Primer | Sequence 5′-3′ | |
| CDKN2A | F | TCGCGATGTCGCACGGTA |
| R | CAATCGGGGATGTCTGAGGGAC | |
| MTHFD2 | F | GATCCTGGTTGGCGAGAATCC |
| R | TCTGGAAGAGGCAACTGAACA | |
| RPS6KA1 | F | CACCATTGGCAAAACTGTGG |
| R | TGTAGCAAGGTGTCATGAGGAG | |
| GAPDH | F | CGAAGGTGGAGTCAACGGATTT |
| R | ATGGGTGGAATCATATTGGAAC | |
CDKN2A, cyclin-dependent kinase inhibitor 2A; MTHFD2, methylenetetrahydrofolate dehydrogenase 2; RPS6KA1, ribosomal protein S6 kinase A1.
Statistical analyses were conducted in R (Version 4.3.1, R Foundation for
Statistical Computing, Vienna, Austria) and GraphPad Prism 9.5 (GraphPad
Software, San Diego, CA, USA), with data visualized using ggplot2 (Version 3.5.2,
CRAN, Vienna, Austria) and ggpubr (Version 0.6.0, CRAN, Vienna, Austria). Group
comparisons were carried out with Student’s t-test (normal data),
Wilcoxon rank-sum test (non-normal data), and Kruskal-Wallis test (multiple
groups). Chi-square tests were used for categorical variables. Survival analyses
were performed with the K-M method. Results with p
We performed metabolomic analysis to investigate whether metabolic reprogramming
occurs in EC (Fig. 1A). PCA revealed distinct metabolic profiles between EC and
normal endometrial tissues (Fig. 1B). Subsequent differential analysis identified
4529 upregulated and 3222 downregulated metabolites (Fig. 1C). Pathway enrichment
analysis revealed significant enrichment of the Gly/Ser/Thr metabolism pathways
(Fig. 1D). We then screened for genes associated with this pathway, and
identified and matched 1741 genes with relevance scores
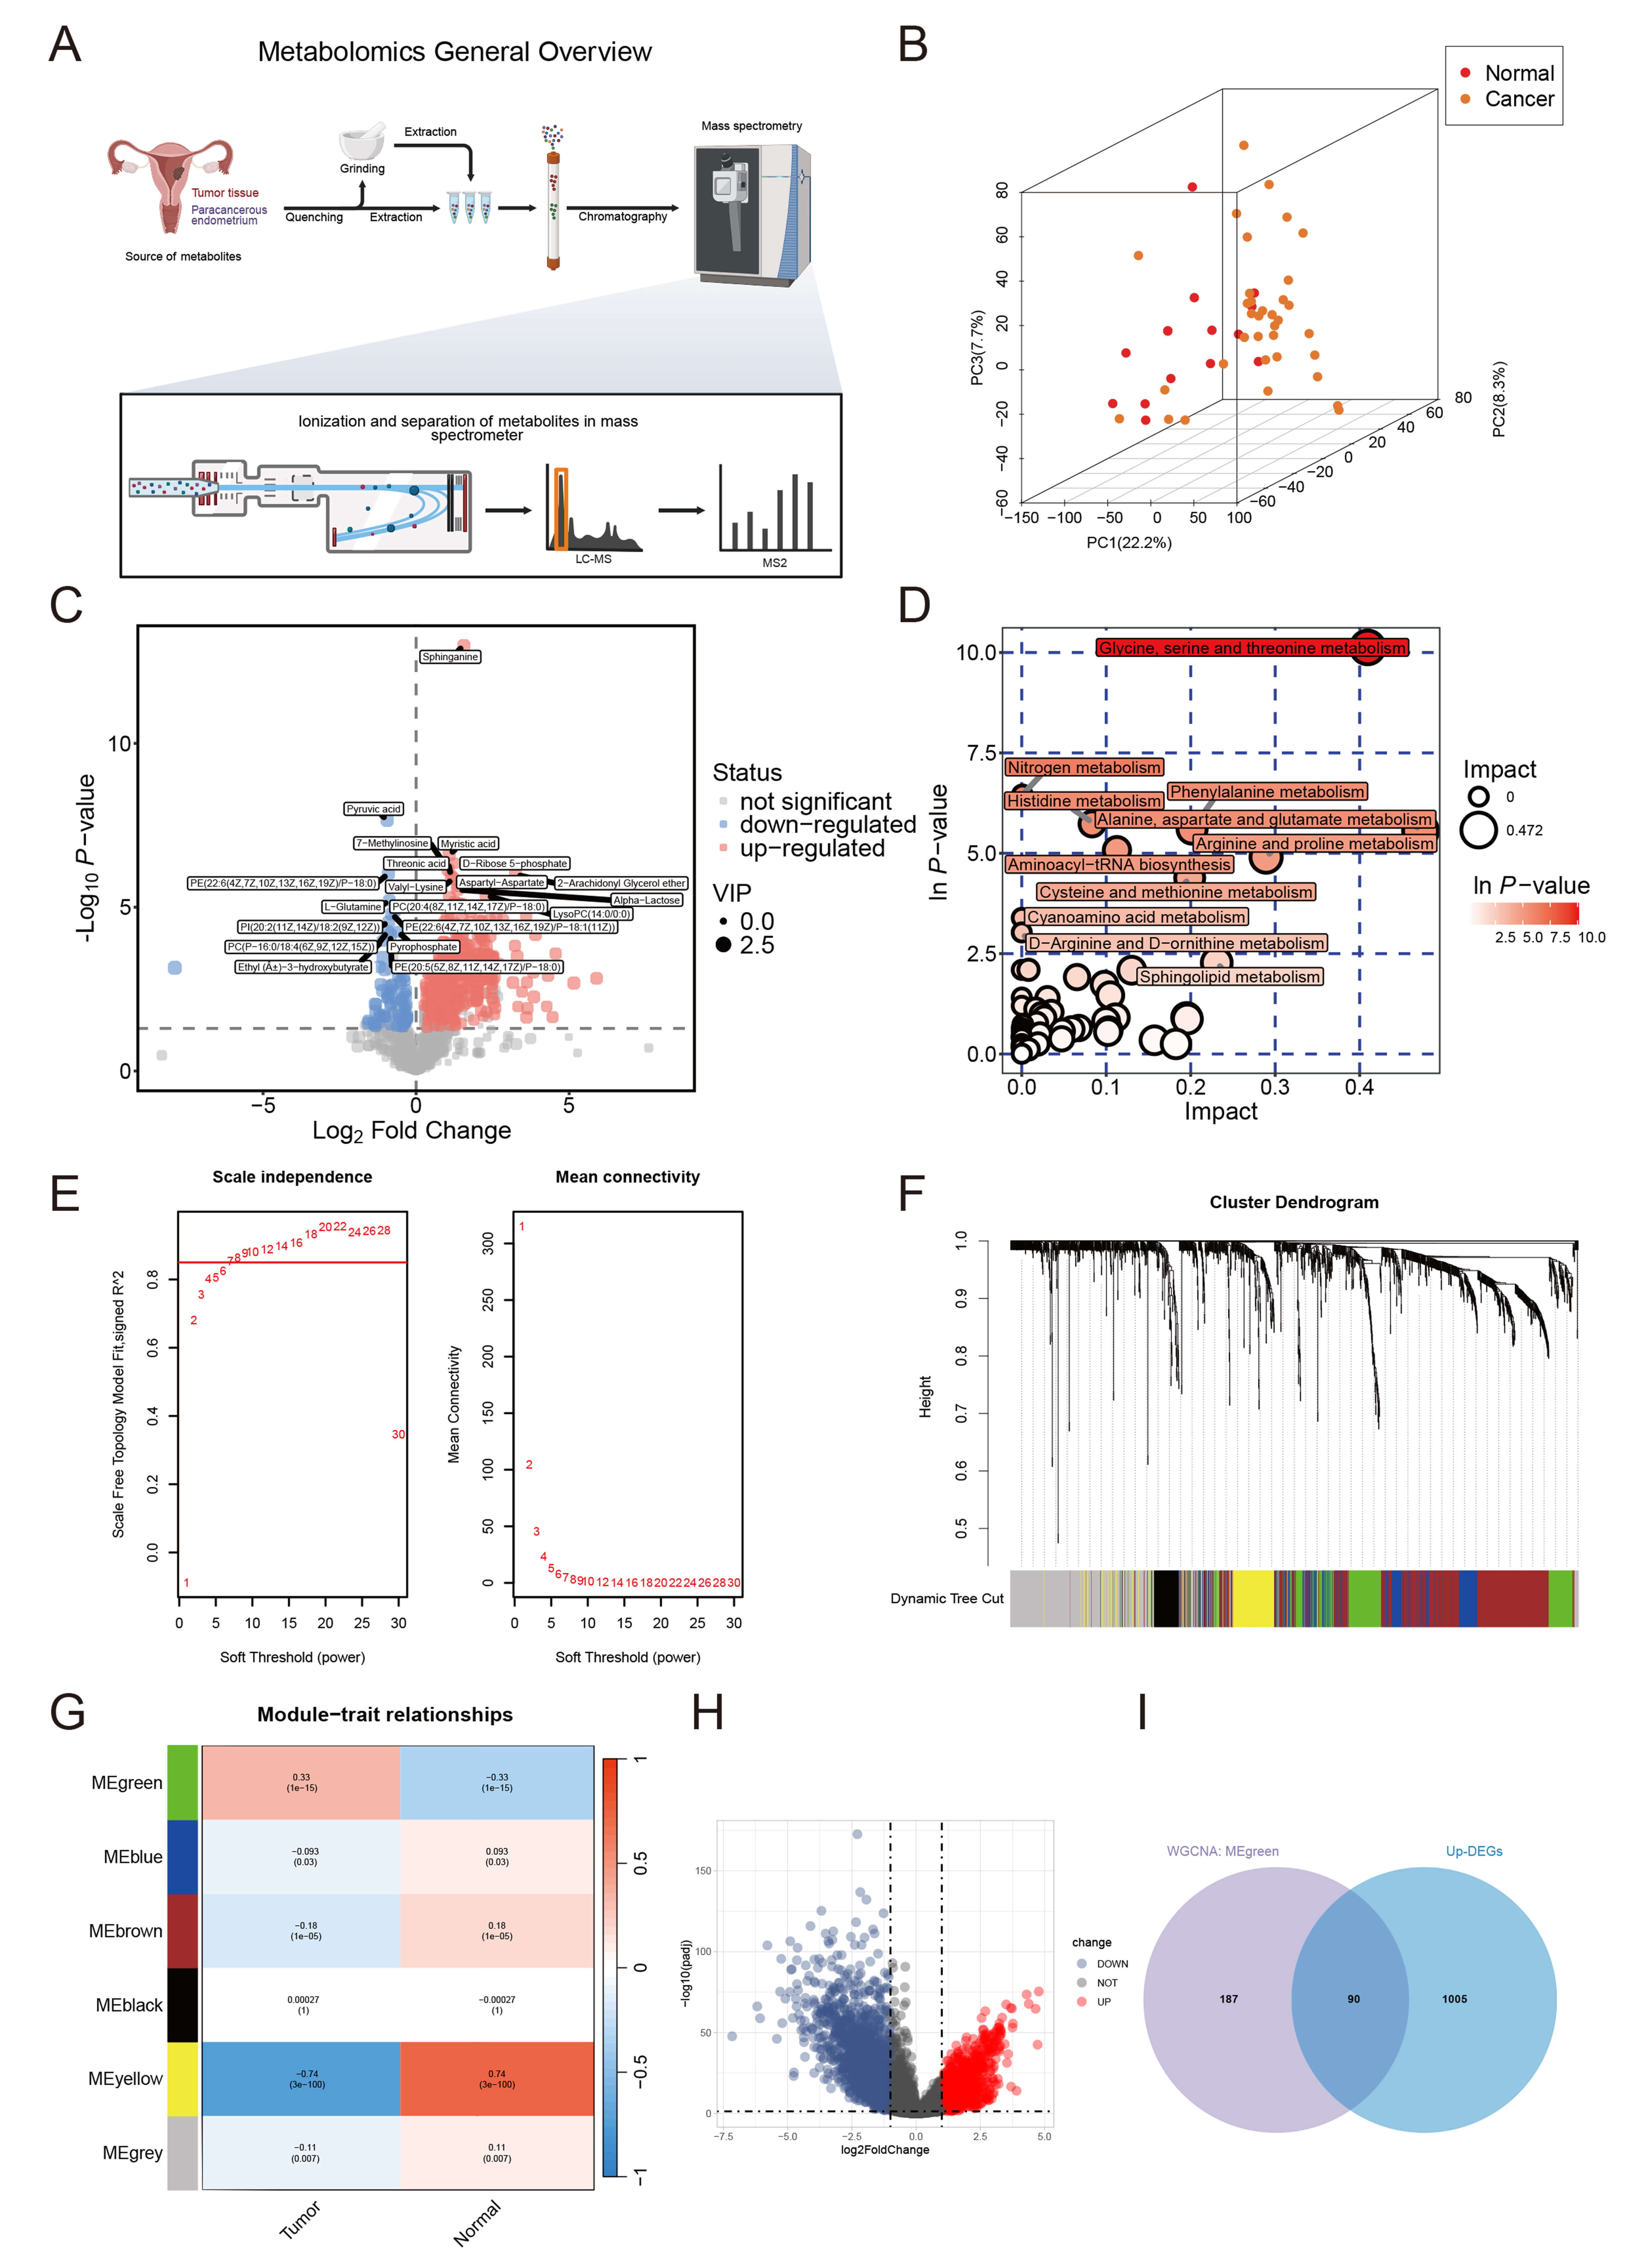 Fig. 1.
Metabolomics and WGCNA analysis for the screening of Gly/Ser/Thr metabolism-related genes. (A) Metabolomics workflow. This figure was created in BioRender (https://BioRender.com/tkklo3h). (B) 3D PCA score scatter plot. (C) Volcano plot of differential metabolites. (D) Enrichment pathway map of differential metabolites. (E) Scale independence and mean connectivity analysis for soft-thresholding selection. (F) Gene dendrogram and module color assignment. (G) Module-trait relationship heatmap. (H) Volcano plot of DEGs. (I) Venn diagram of overlapping genes. LC-MS, liquid chromatography-mass spectrometry; MS2, secondary mass spectrometry; PCA, principal component analysis; WGCNA, weighted gene co-expression network analysis; Gly/Ser/Thr, glycine, serine, and threonine; DEGs, differentially expressed genes.
Unsupervised clustering analysis was performed on 539 EC tissues from the TCGA database using expression profiles of Gly/Ser/Thr metabolism-related genes. Optimal clustering stability was achieved at k = 3 (Fig. 2A–D), dividing patients into three distinct subgroups (C1: n = 266; C2: n = 196; C3: n = 77). PCA revealed significant transcriptomic heterogeneity among clusters (Fig. 2E). Survival analysis demonstrated pronounced prognostic heterogeneity, with C1 exhibiting the shortest overall survival (OS) and disease-specific survival (DSS) (Fig. 2F,G). Notably, C1 contained significantly higher proportions of advanced International Federation of Gynecology and Obstetrics (FIGO) stage (III/IV) and high-grade (G3) tumors (Fig. 2H,I), indicating greater clinical aggressiveness.
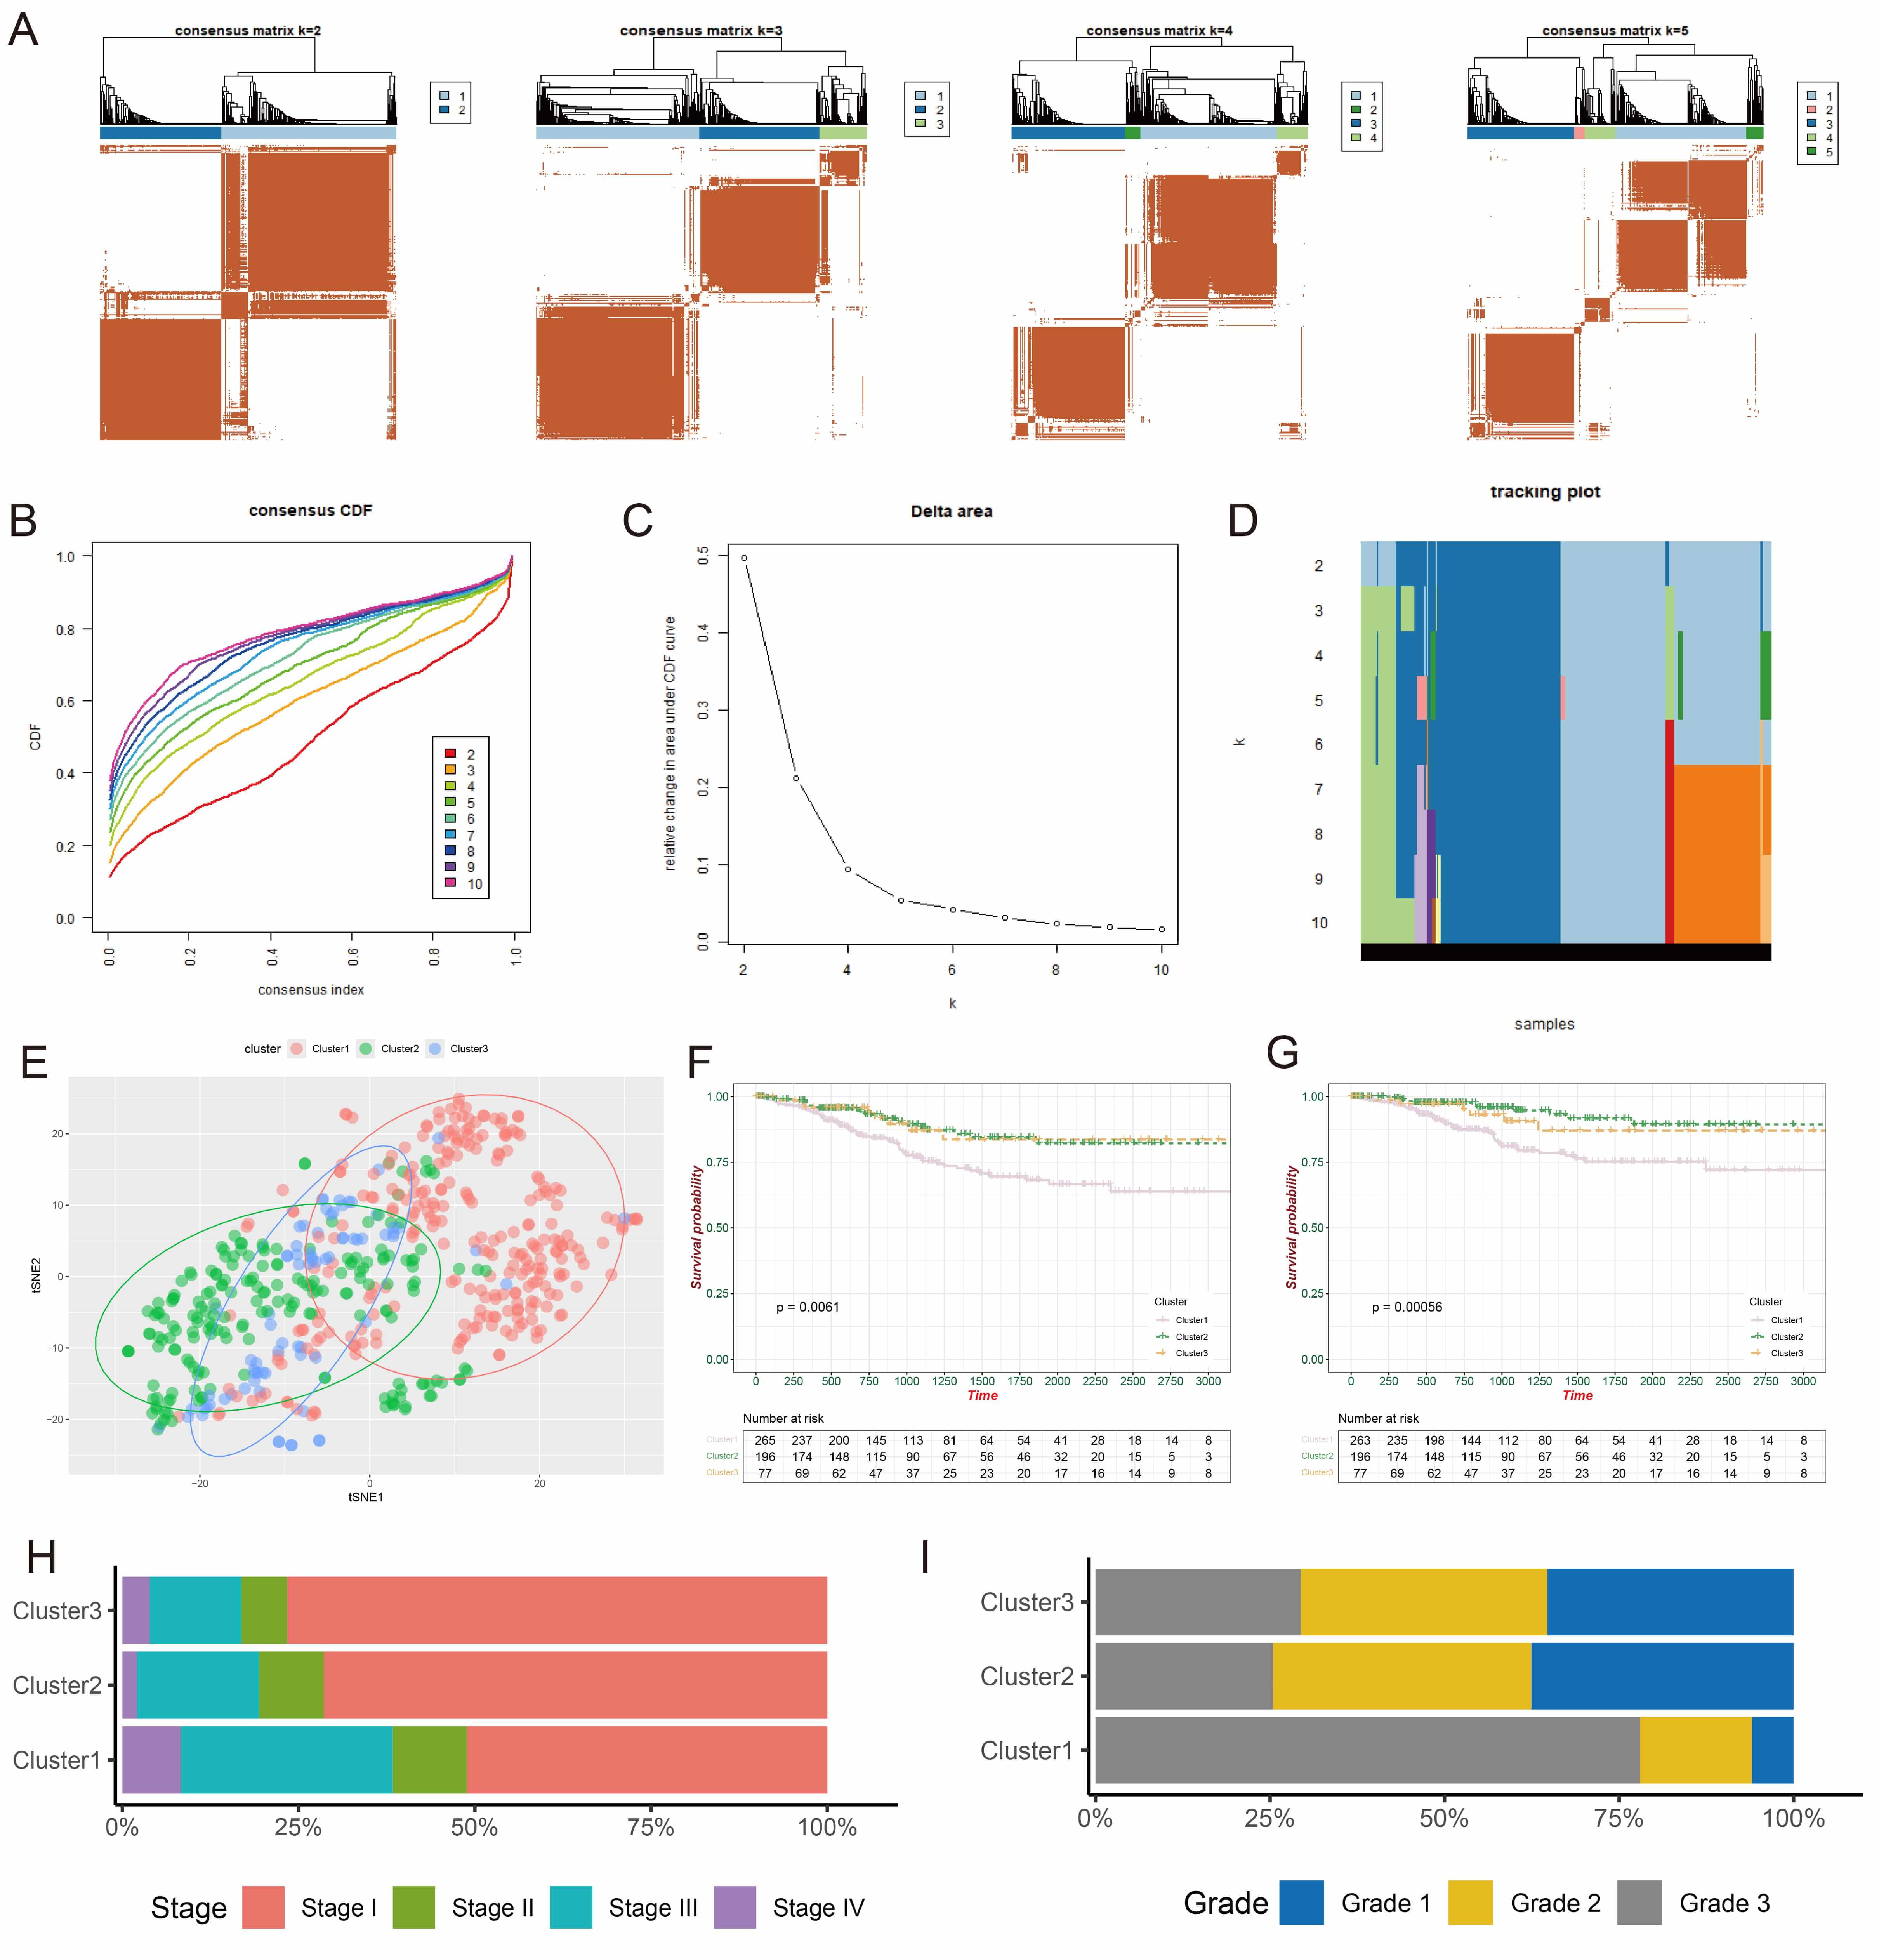 Fig. 2.
Identification of Gly/Ser/Thr metabolism-related subtypes. (A) Consensus clustering matrices for k = 2–5. (B) CDF curves for k = 2–10. (C) Relative change in the area under the CDF delta curve. (D) Tracking plot for k = 2–10. (E) PCA demonstrating three distinct subgroups. (F,G) Differences in OS and DSS among the three subtypes. (H,I) Bar plots illustrating the distribution of different pathological grades and FIGO stages across subtypes. CDF, cumulative distribution function; PCA, principal component analysis; OS, overall survival; DSS, disease-specific survival; FIGO, International Federation of Gynecology and Obstetrics.
Consistent with established literature demonstrating metabolic-driven immune evasion in the TME [17, 18], analysis of immune cell infiltration revealed distinct imbalances in the C1 phenotype, with increased Th2 cells and decreased activated CD8+ T cells, DCs, NK cells, and myeloid-derived suppressor cells (MDSCs) (Fig. 3A). This phenotype likely reflects STAT6 pathway activation via Th2-secreted IL-4/IL-13, promoting M2 macrophage polarization and immunosuppression [19]. Concurrent DC dysfunction may impair antigen presentation and CD8+ T cell activation [20], while NK cell exhaustion compromises innate immune surveillance, collectively facilitating metastatic dissemination. In contrast, C2 showed enhanced anti-tumor immunity with activated CD4+ T cells and DCs, while C3 had an immunomodulatory environment dominated by NK cells, mast cells, and Tregs. Immunocheckpoint analysis showed significant upregulation of CD274 (PD-L1), lymphocyte activation gene 3 (LAG3), T-cell immunoreceptor with Ig and ITIM domains (TIGIT), and interferon gamma receptor 1 (IFNGR1) in C1 (Fig. 3B). Moreover, C1 demonstrated the lowest immune score, the highest TIDE score (Fig. 3C,D), elevated tumor purity, and a lower stromal score (Fig. 3E,F), suggesting an immunosuppressive environment with poor response to immunotherapy.
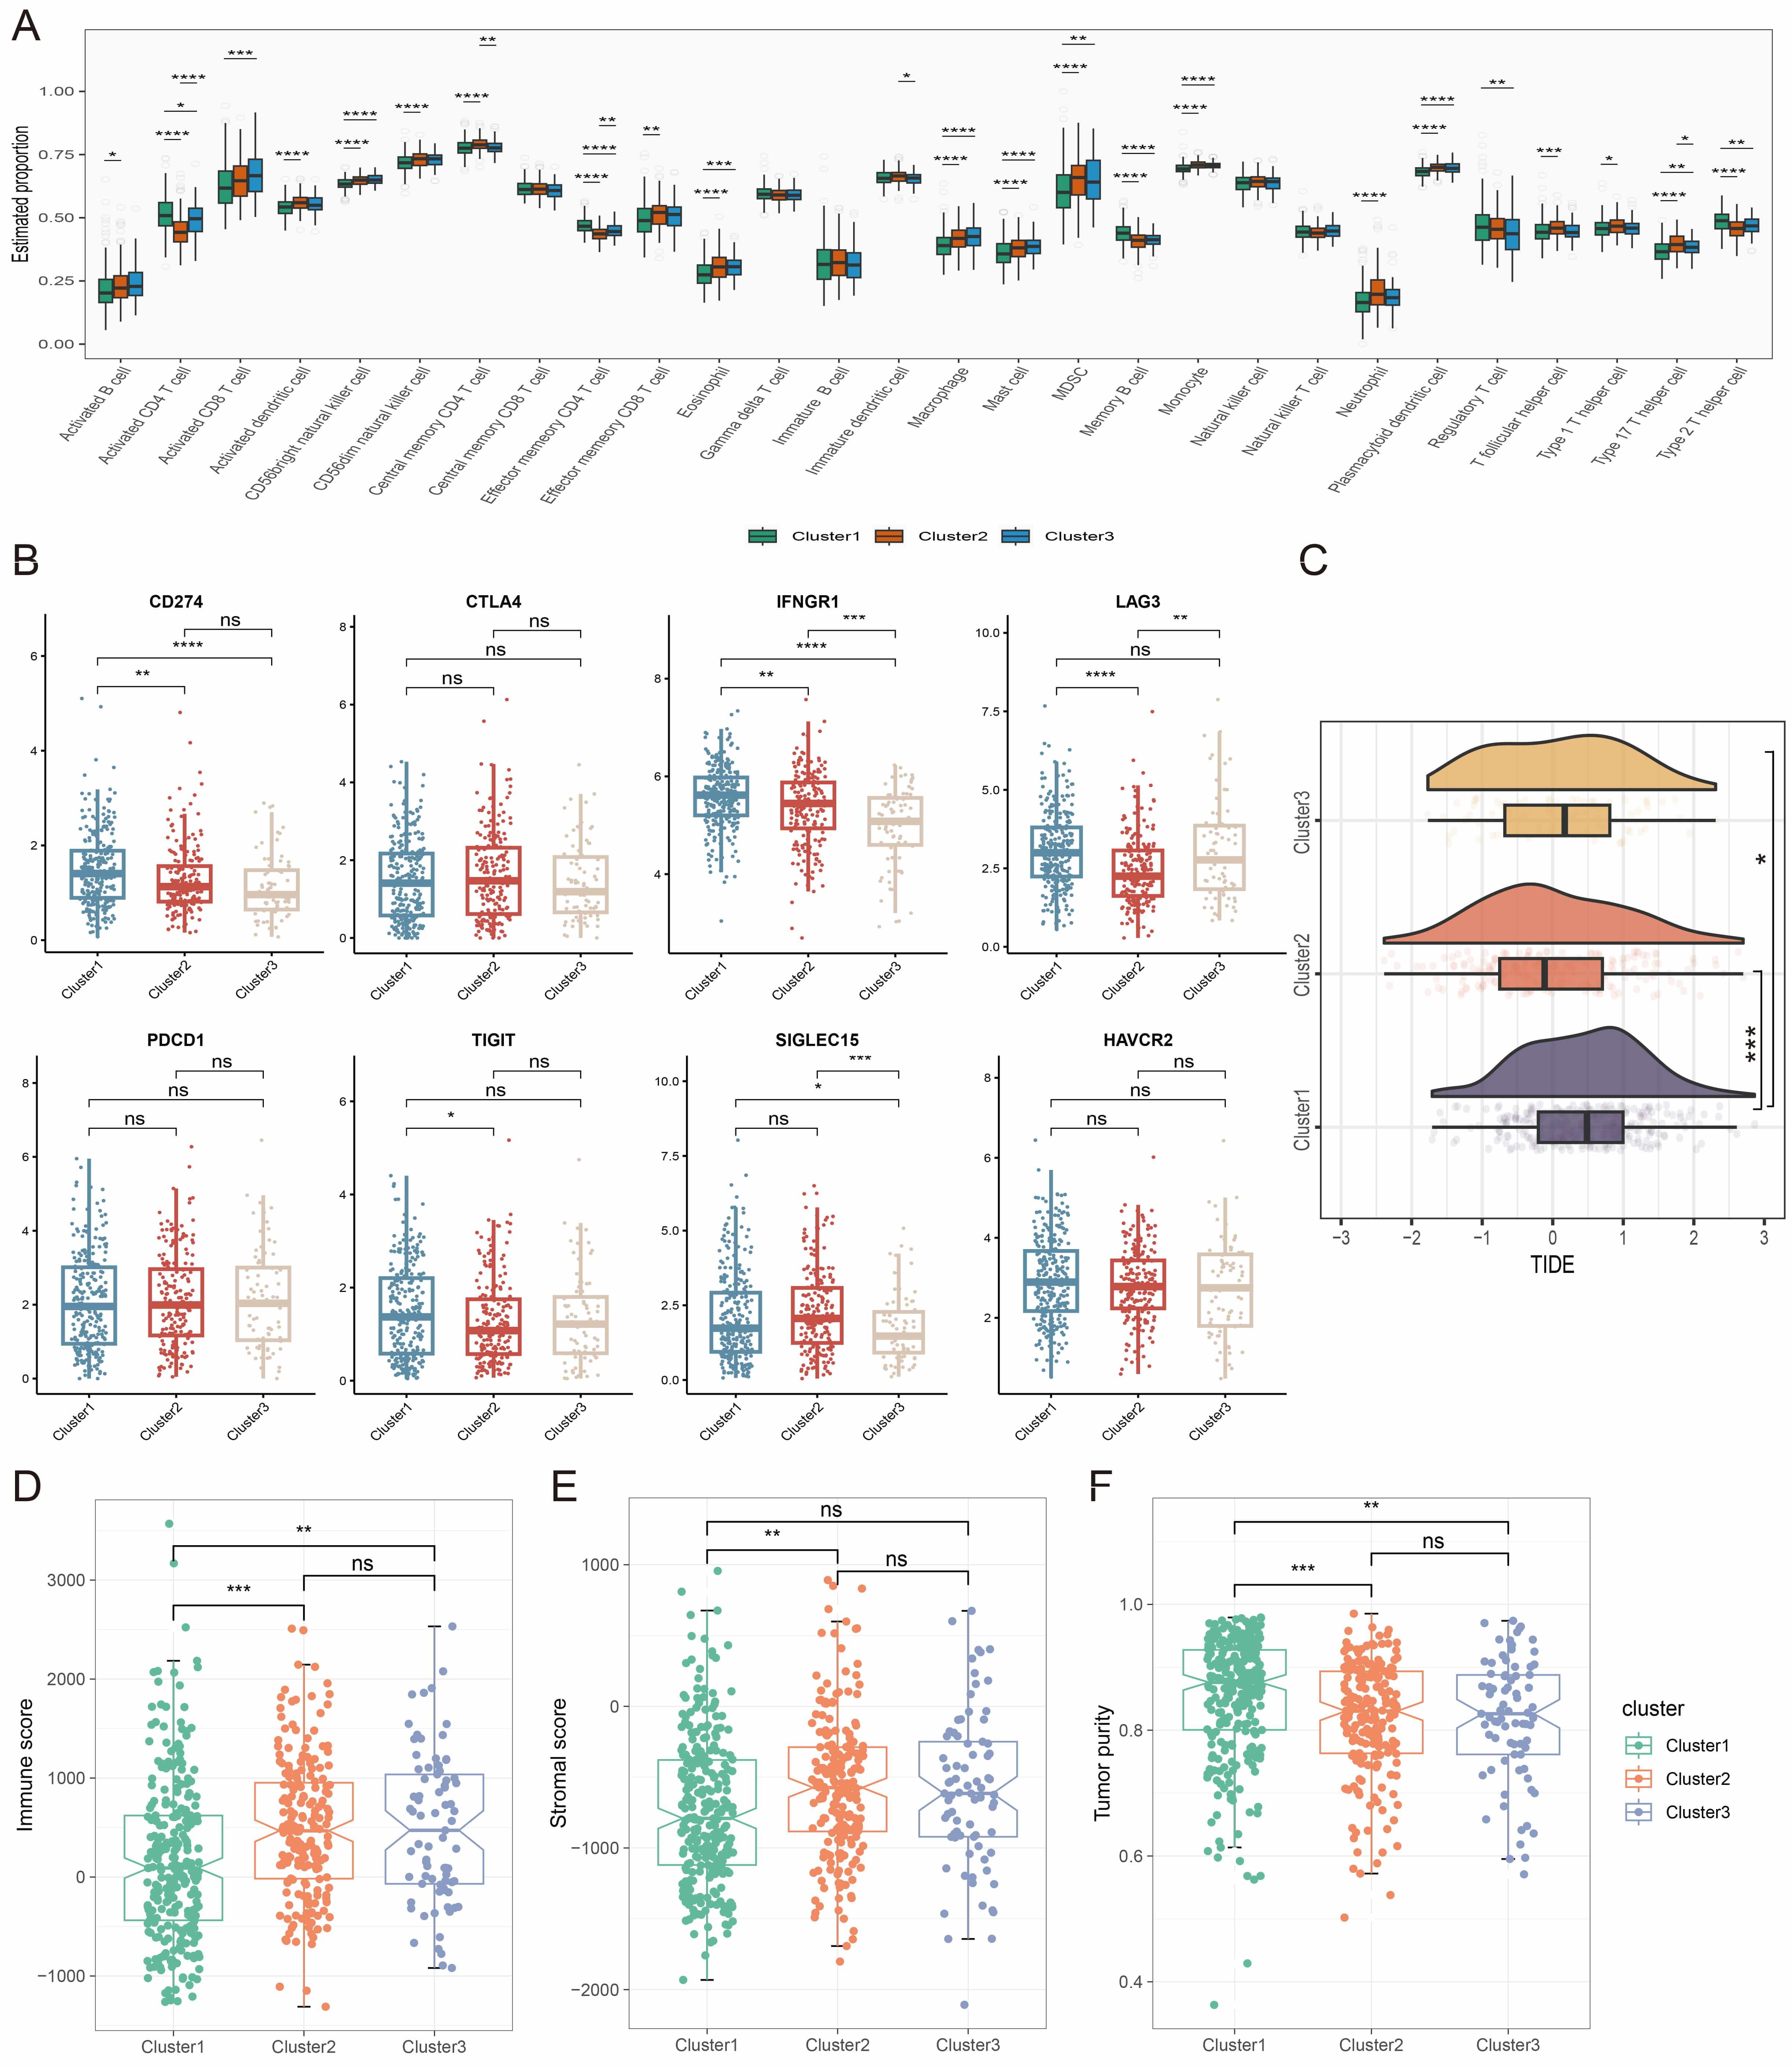 Fig. 3.
Immune analysis of the different metabolic subtypes. (A)
Comparison of infiltration levels of immune cell types among the three metabolic
subtypes. (B) Expression levels of immune checkpoint-related genes in the three
metabolic subtypes. (C–F) Evaluation of TIDE score (C), immune score (D),
stromal score (E), and tumor purity score (F) in the three metabolic subtypes.
ns, not significant, * p
To evaluate the prognostic significance of metabolic genes, we developed a
prognostic model using data from 537 TCGA-UCEC cases. These were randomly divided
into training (n = 429) and test (n = 108) cohorts at a ratio of 7:3. Univariate
Cox regression identified 29 OS-associated metabolic genes (Fig. 4A,
Supplementary Table 3). These were narrowed to 6 via LASSO-Cox
regression (
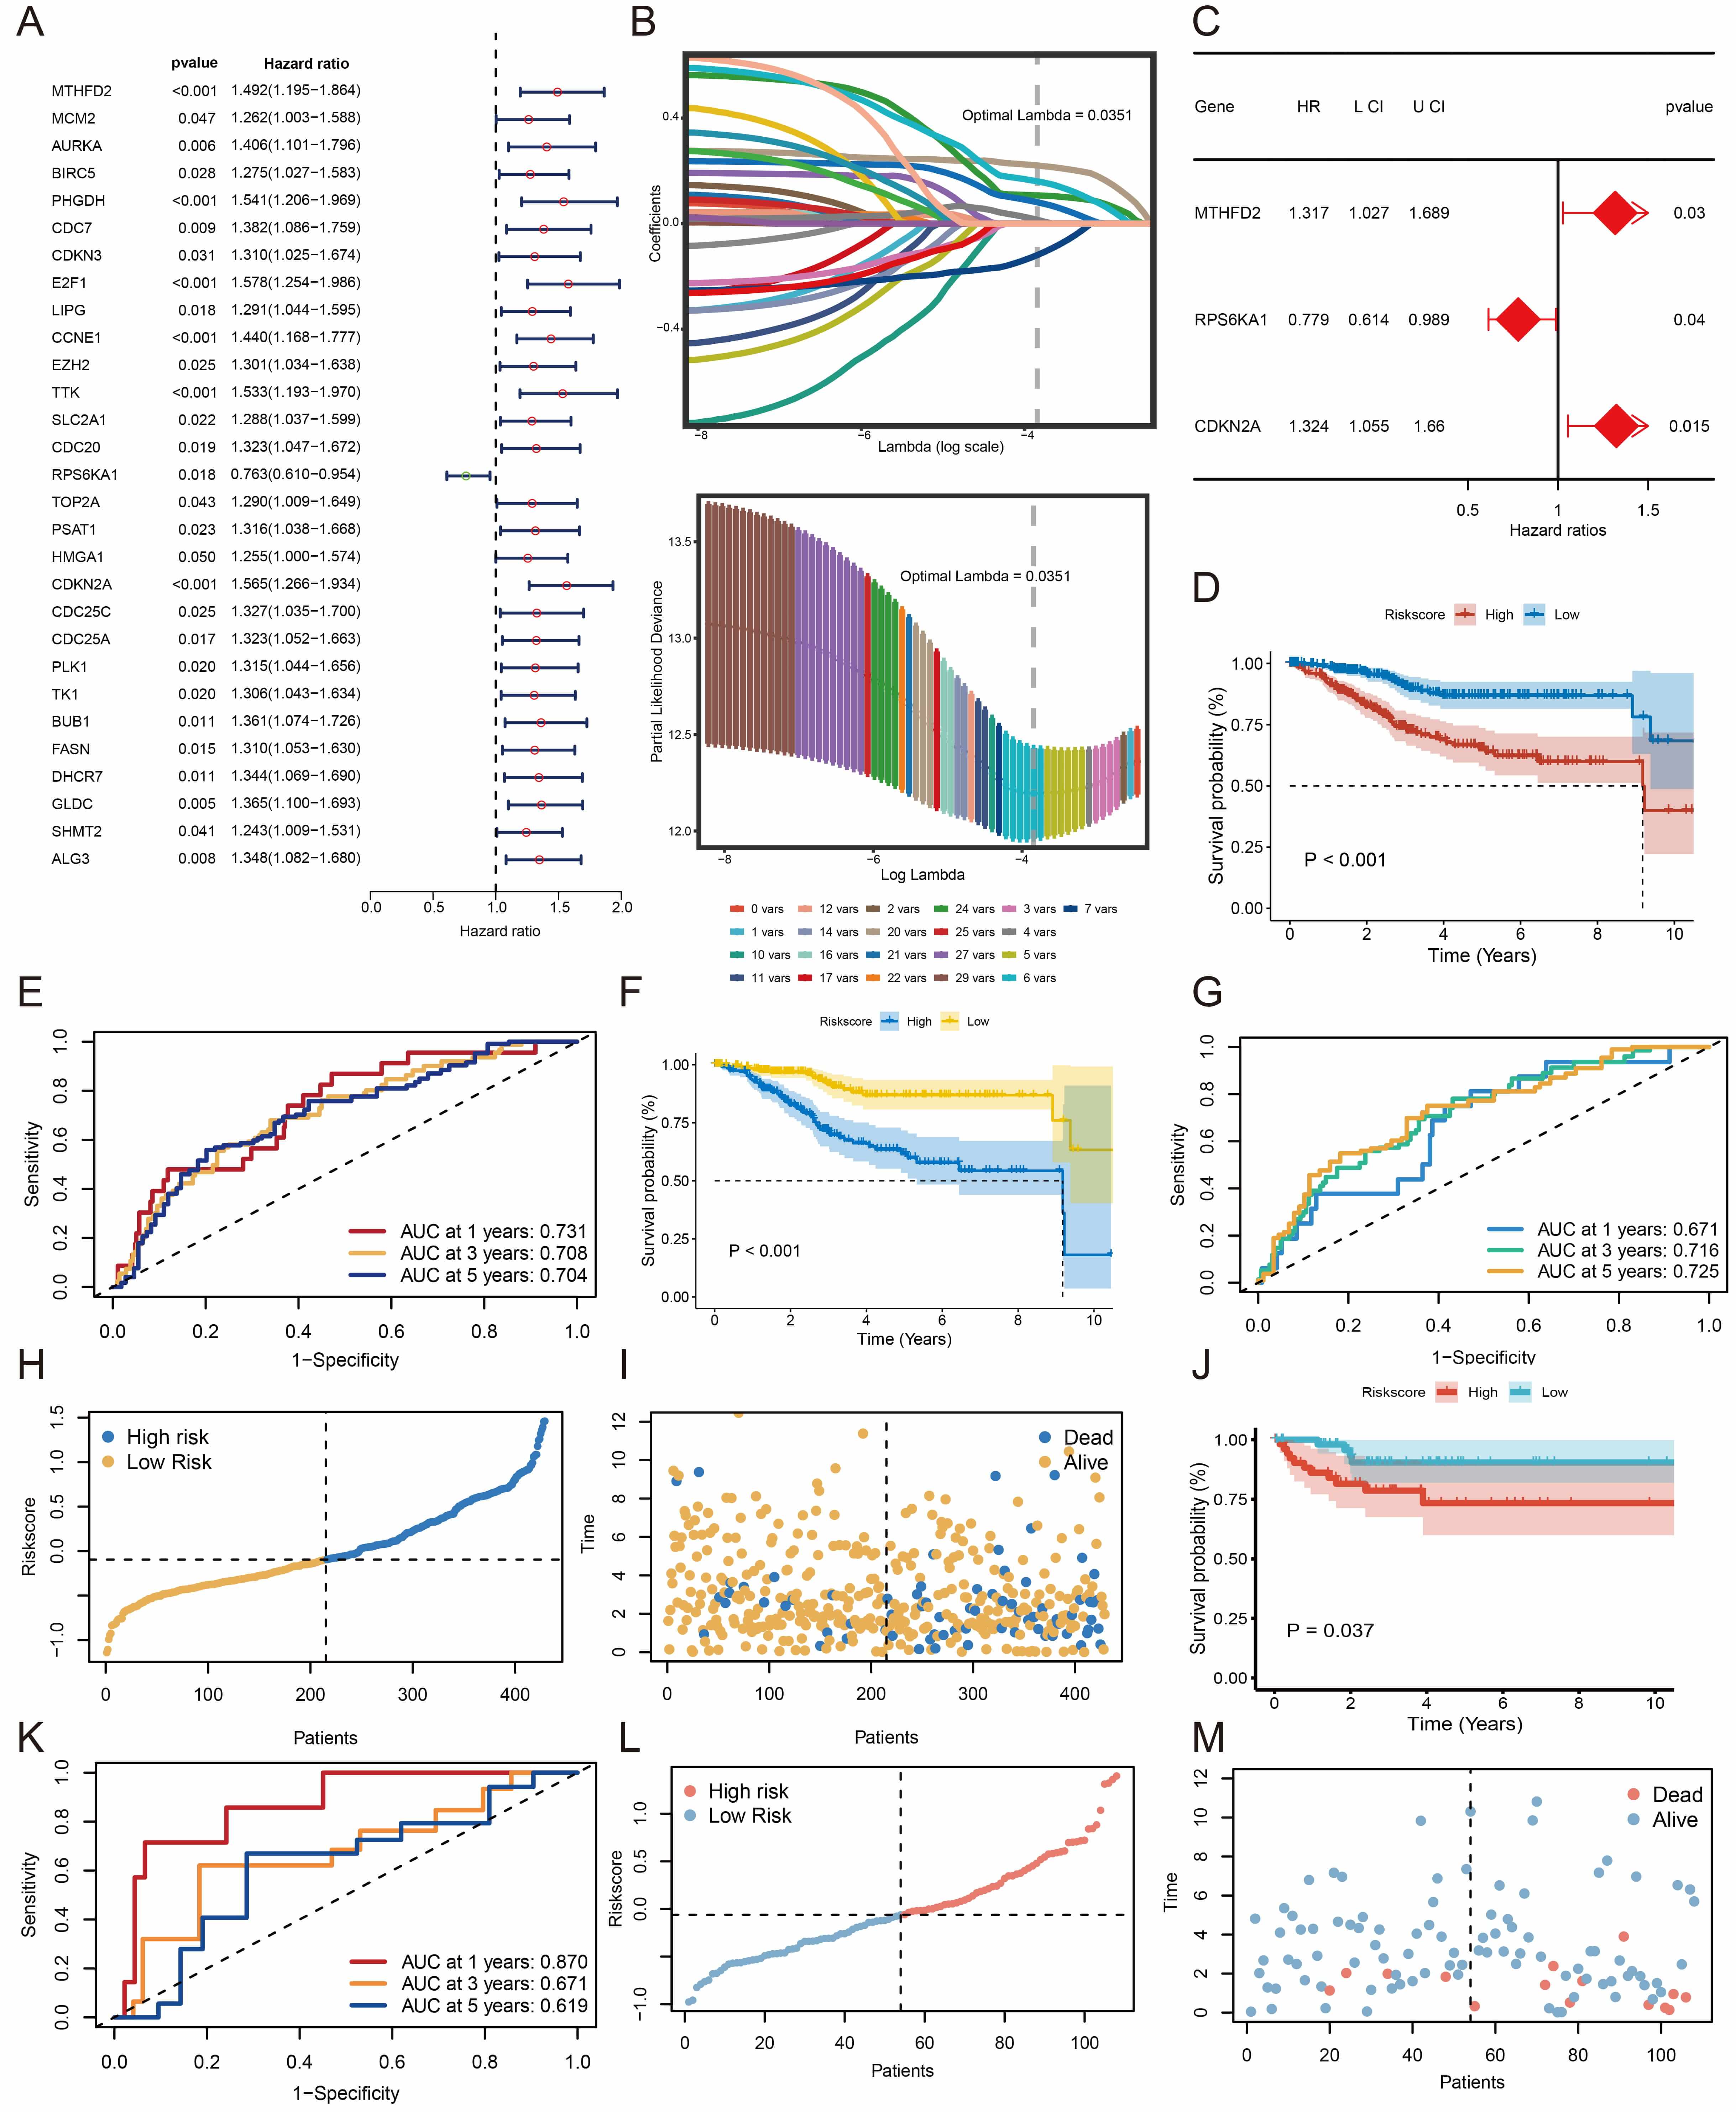 Fig. 4.
Construction and validation of the risk prediction model. (A) Identification of genes associated with OS. (B) Variable selection in the LASSO model. (C) Determination of the most relevant genes. (D,F,J) K-M survival analysis comparing high- and low-risk groups. (E,G,K) Time-dependent ROC curves for predicting 1-, 3-, and 5-year survival rates. (H,I,L,M) Distribution of risk scores and survival status for each patient. OS, overall survival; LASSO, least absolute shrinkage and selection operator; K–M, Kaplan–Meier; ROC, receiver operating characteristic.
Tumor samples from 24 EC patients with different prognoses were analyzed by
proteomic profiling (Fig. 5A). Stratifying patients by risk scores revealed the
high-risk group had significantly worse survival (p
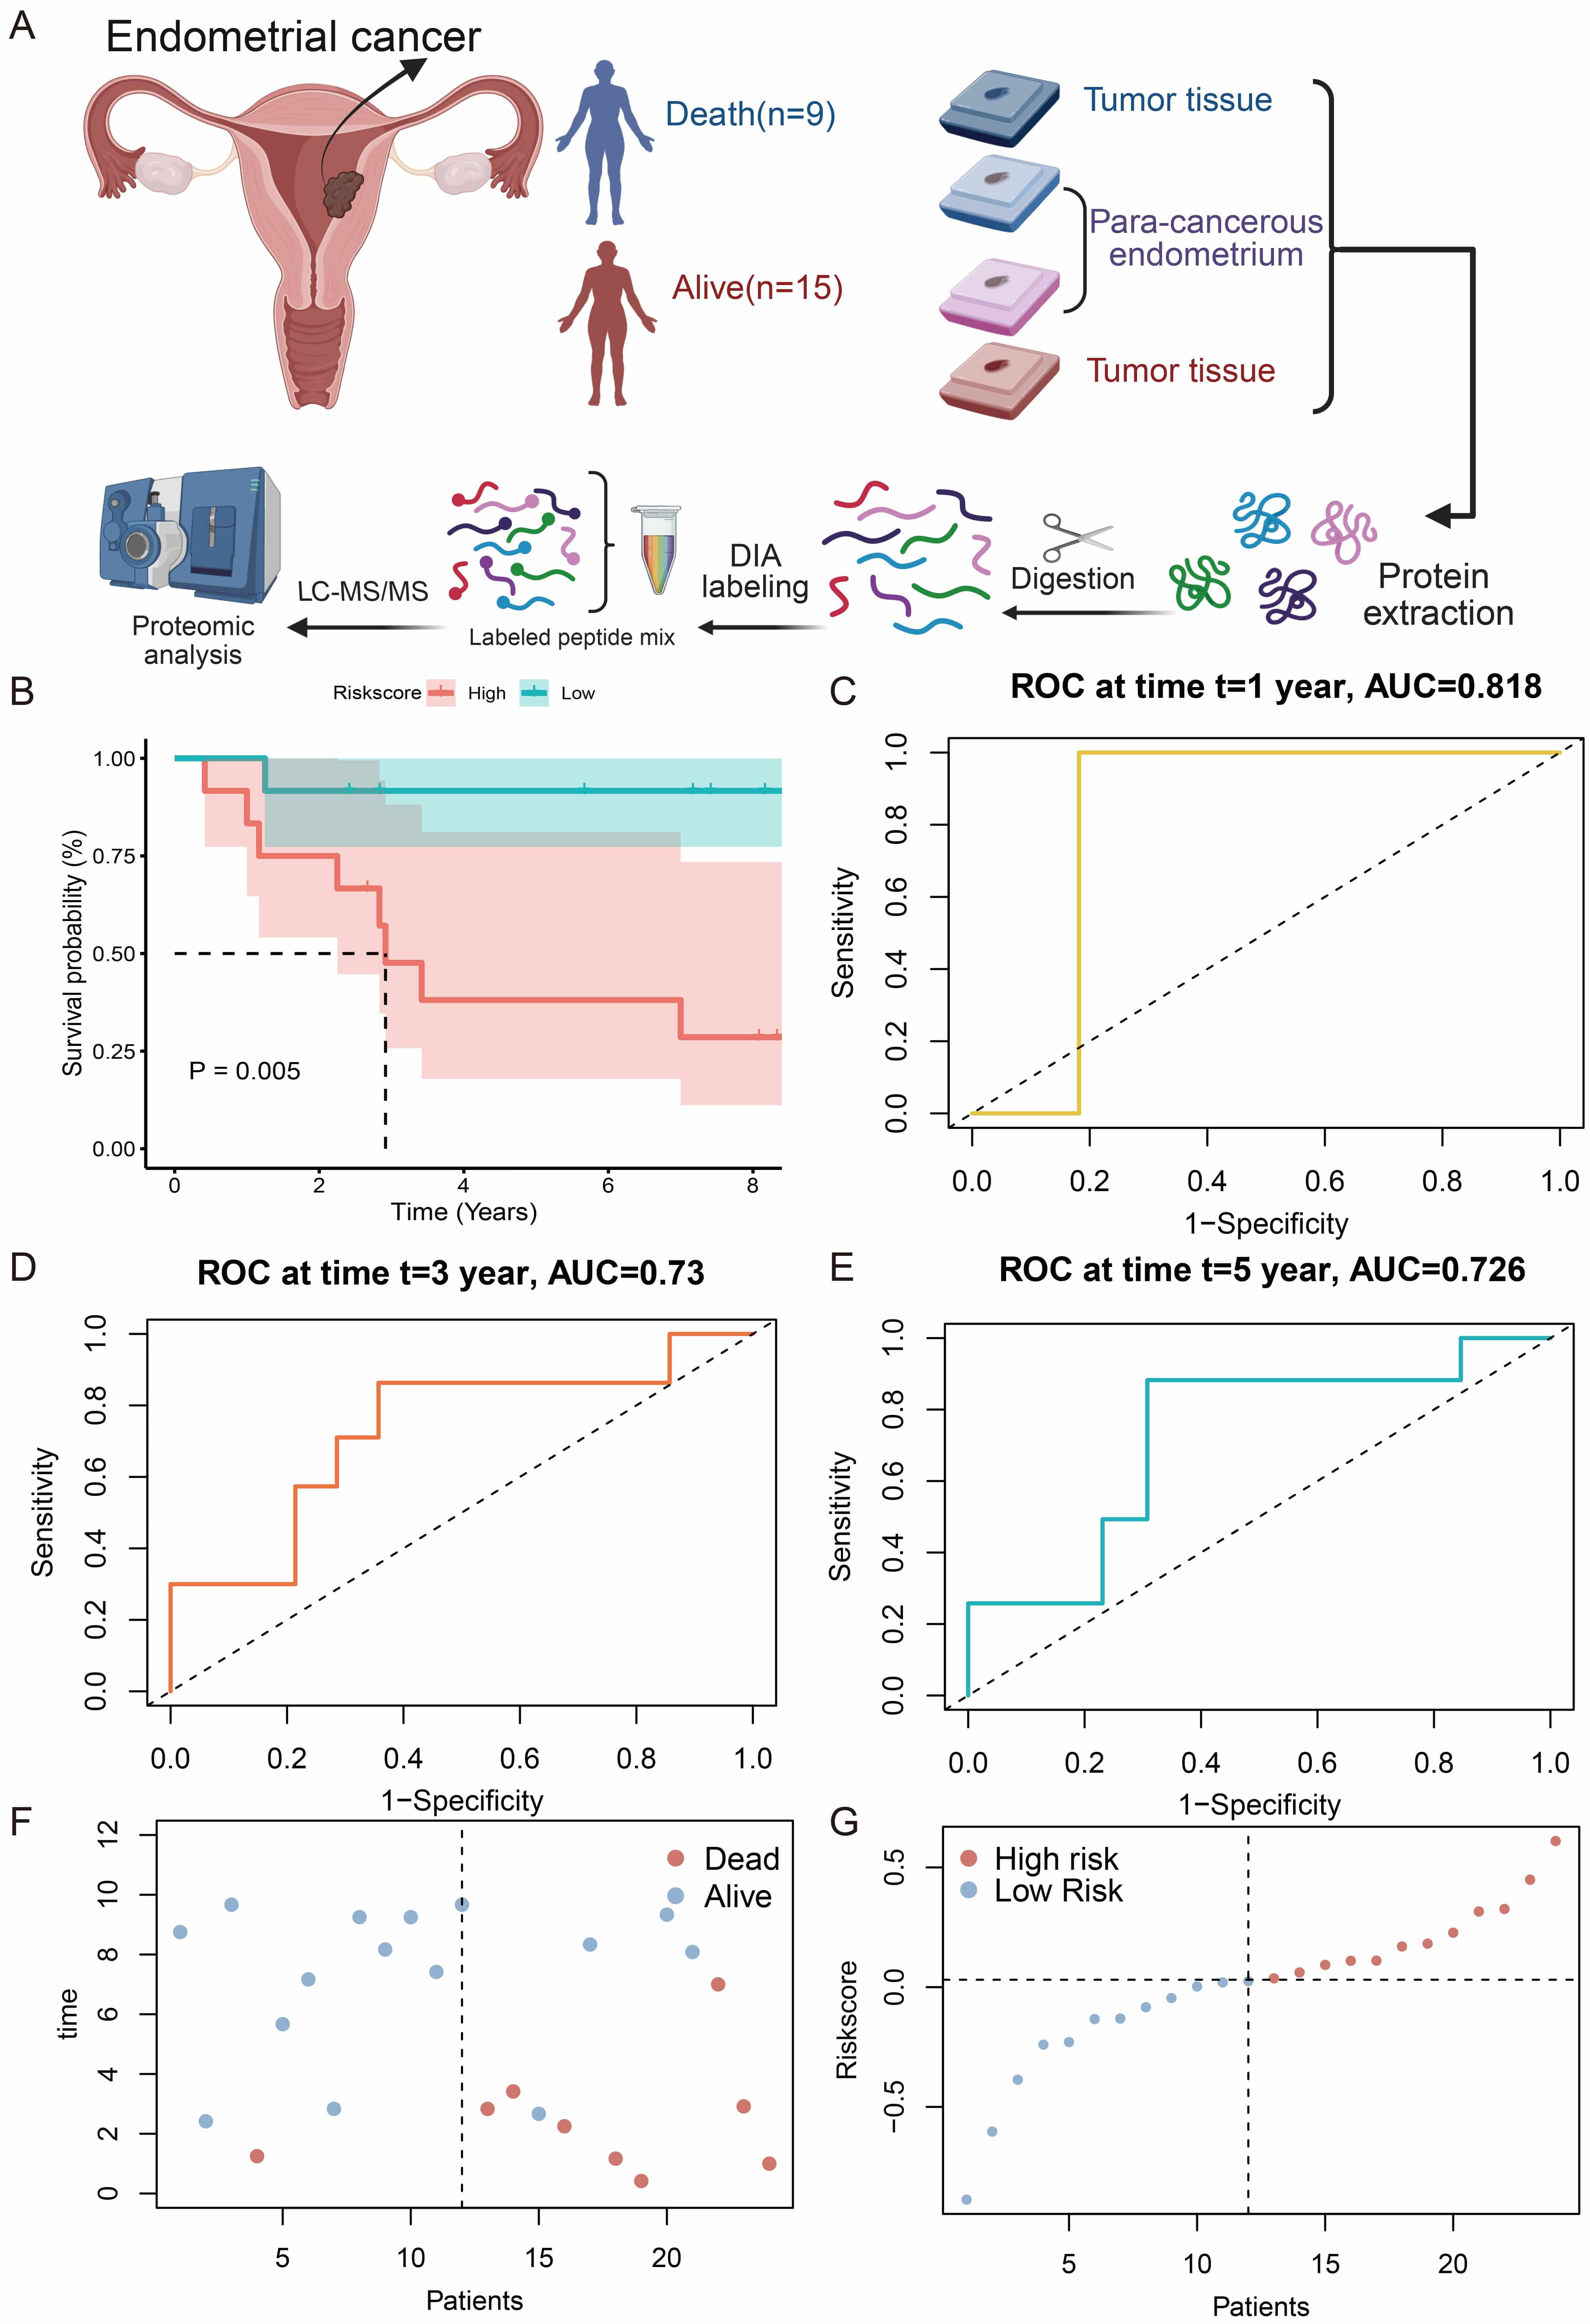 Fig. 5.
Validation of the risk model through proteomics. (A) Workflow for the proteomics study. This figure was created in BioRender (https://BioRender.com/tkklo3h). (B) K-M survival analysis comparing high- and low-risk groups. (C–E) Time-dependent ROC curves for predicting 1-, 3- and 5-year survival rates. (F,G) Distribution of risk scores and survival status for each patient. K–M, Kaplan–Meier; ROC, receiver operating characteristic.
Analysis of mutational profiles showed that missense mutations were the main variant type in both risk groups, with higher frequencies of PIK3CA and TP53 mutations in high-risk patients (TP53: 48% vs. 11%) (Fig. 6A,B). High-risk tumors had a lower TMB (Fig. 6C,D), suggesting reduced neoantigen production and poorer treatment response. High-risk scores were consistently observed across microsatellite stability (MSS), microsatellite instability low (MSI-L), and MSI-high (MSI-H) subtypes. MSS tumors showed particularly high scores, whereas MSI-H tumors with high mutational load and typically better immunotherapy response were predominantly clustered in the low-risk group (Fig. 6E).
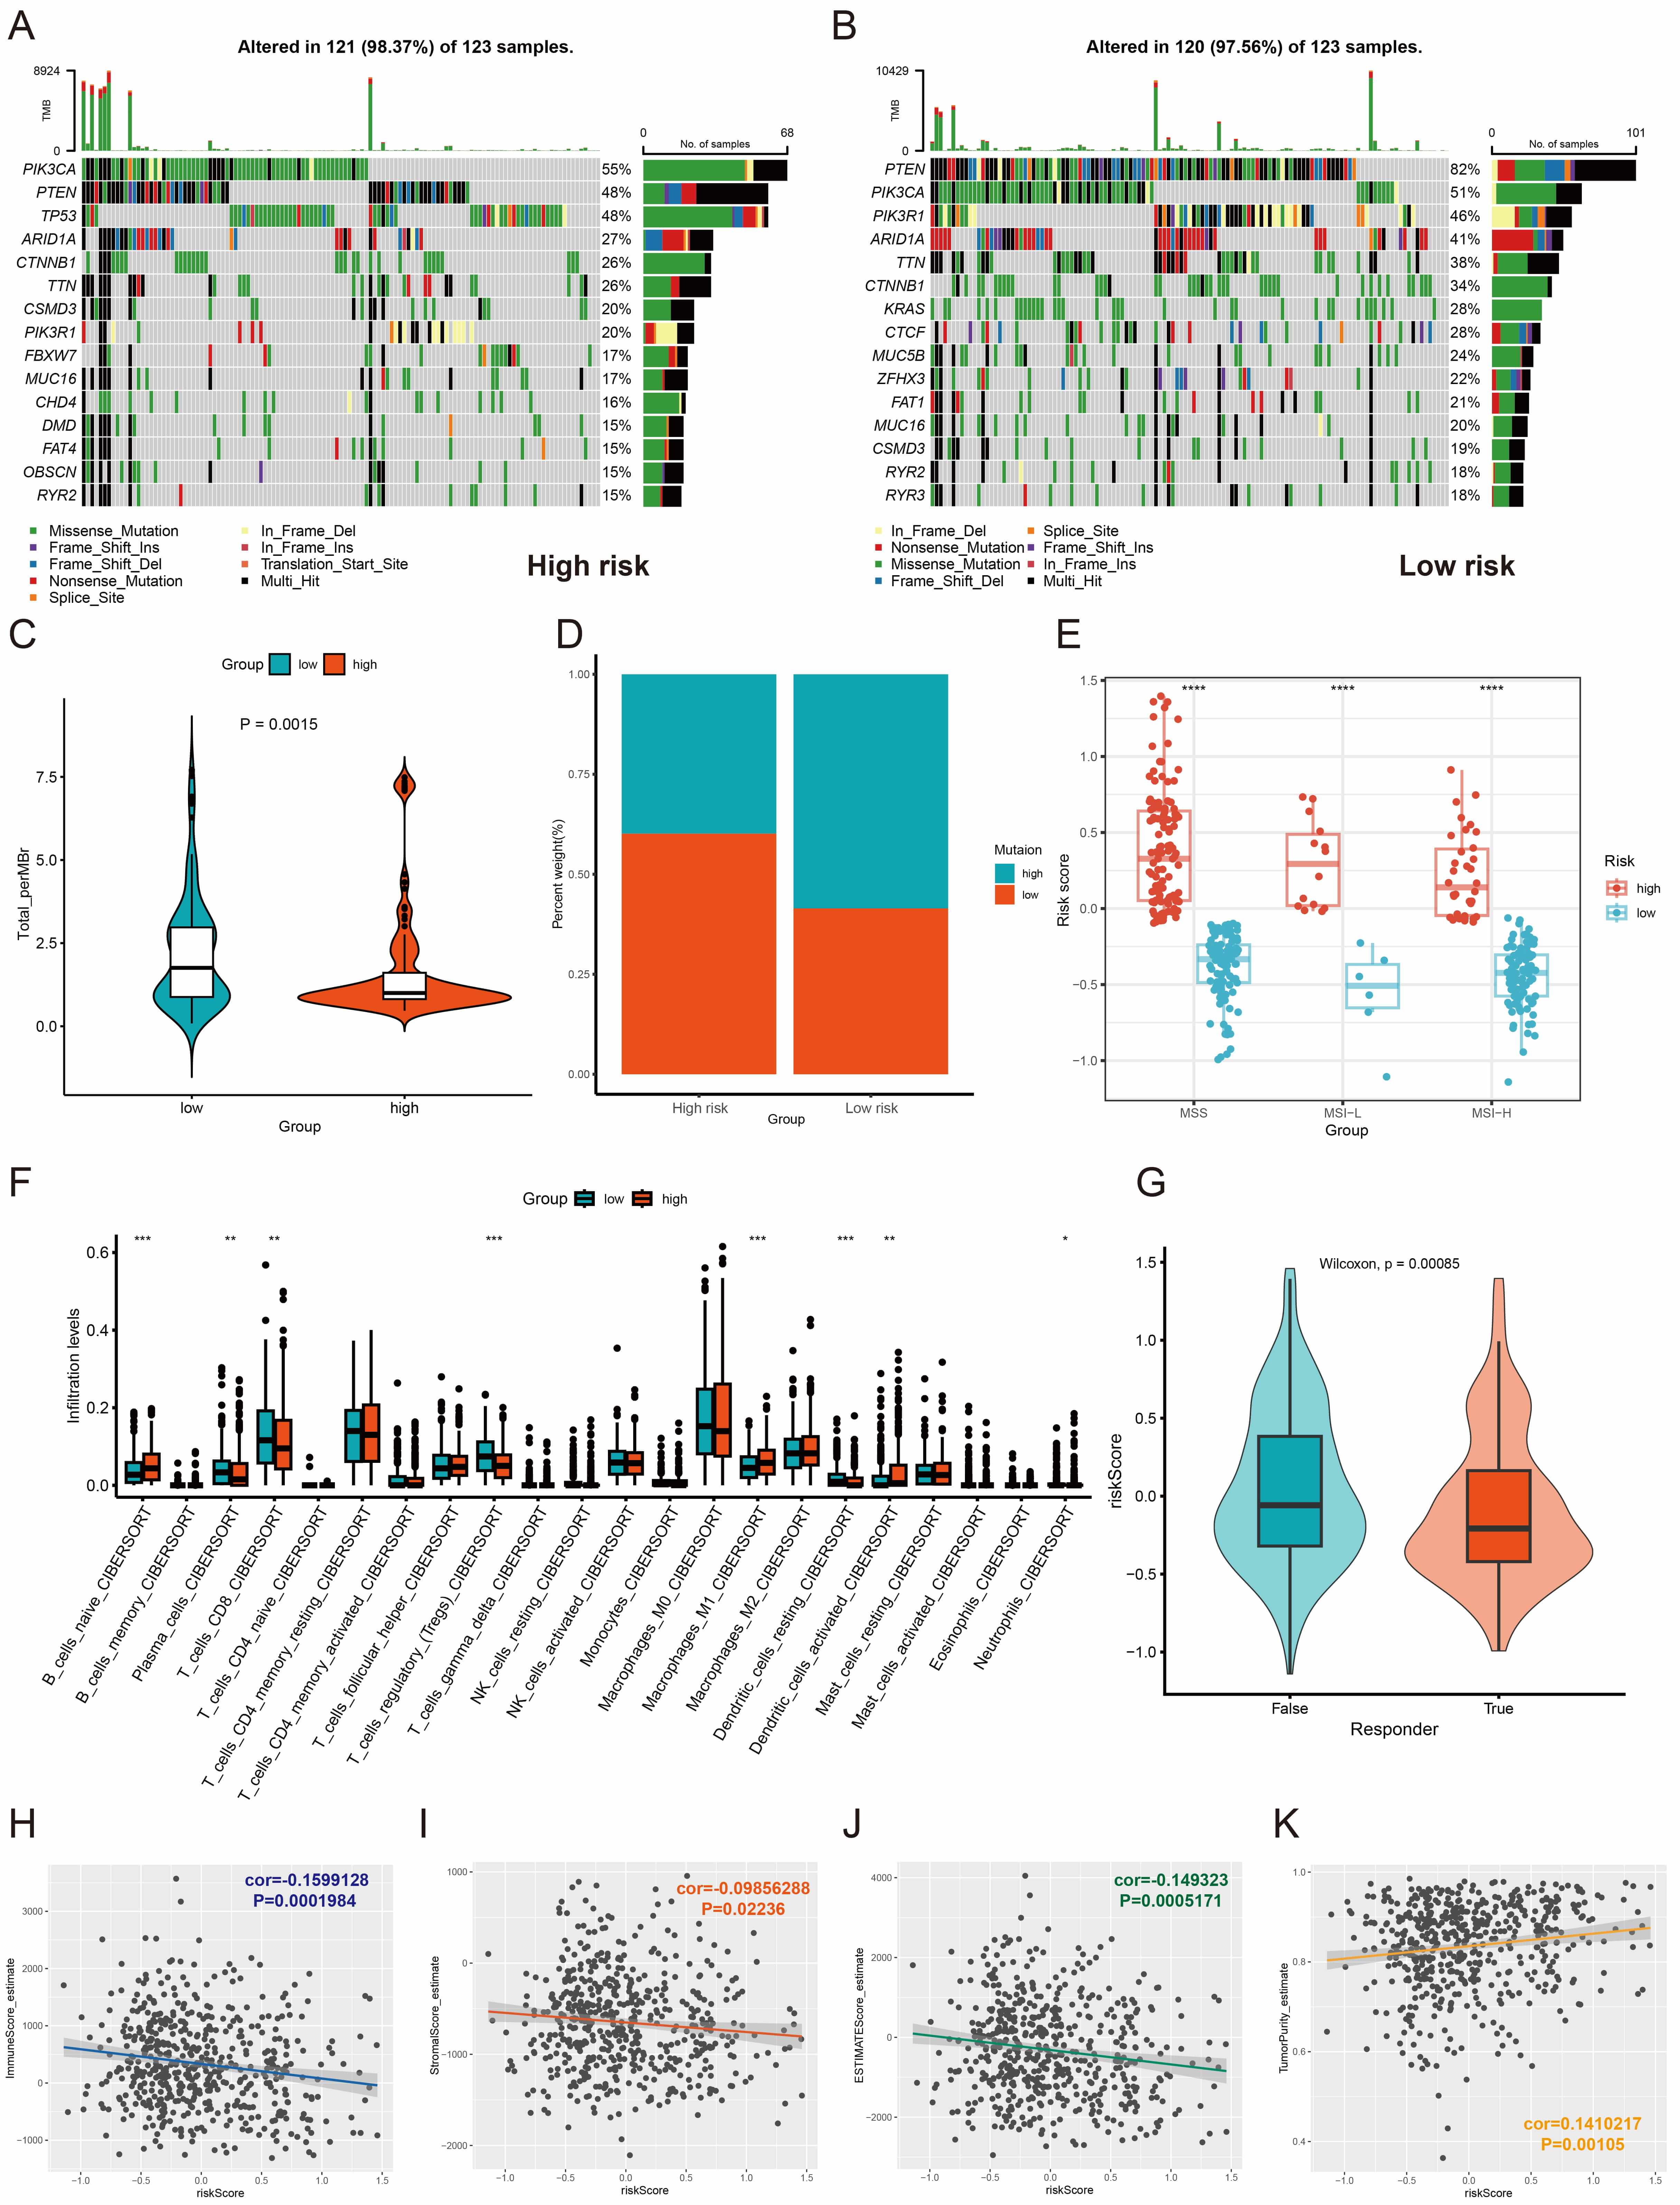 Fig. 6.
Analysis of tumor mutations and immune microenvironment
infiltration. (A,B) Comparison of mutation frequency and type based on risk
scores. (C) Violin plot comparing tumor mutation burden (log2-transformed)
between low- and high-risk groups. (D) Bar plot showing the proportion of tumor
mutation burden in low- and high-risk groups. (E) Distribution of microsatellite
stability subtypes in low- and high-risk groups. (F) Levels of infiltration by
different immune cell types. (G) Differential distribution of immune risk scores
between responders and non-responders to immunotherapy. (H–K) Correlation
analysis between immune-related scores and risk scores. * p
CIBERSORT analysis of immune cell infiltration patterns revealed distinct
microenvironment profiles between the two risk groups. Low-risk tumors were
characterized by higher proportions of CD8+ T cells, Tregs, and resting DCs,
whereas high-risk tumors showed enrichment of naïve B cells, M1 macrophages,
activated DCs, and neutrophils (Fig. 6F). TIDE score analysis predicted poorer
response to immune checkpoint blockade (ICB) in high-risk patients (p
Single-cell RNA sequencing of paired tumor and adjacent normal endometrial tissues from one EC patient identified five major cell populations: epithelial cells (epithelial cell adhesion molecule (EPCAM), keratin 8 (KRT8)), stromal fibroblasts (regulator of G-protein signaling 5 (RGS5)), endothelial cells (adhesion G protein-coupled receptor L4 (ADGRL4); plasmalemma vesicle associated protein (PLVAP)), smooth muscle cells (decorin (DCN)), and immune cells (protein tyrosine phosphatase receptor type C (PTPRC)) (Fig. 7A,B). UMAP analysis revealed widespread MTHFD2 expression in non-immune cells, RPS6KA1 expression in both epithelial and endothelial cells, and scattered CDKN2A expression across epithelial, immune, and smooth muscle cells (Fig. 7C). Validation with TCGA-UCEC, GEO, and CPTAC confirmed tumor-upregulated expression of all three genes (Fig. 7D,E). MTHFD2 and CDKN2A were highly expressed in higher-grade tumors and TP53-mutated samples, while RPS6KA1 expression was lower in cases with poor prognosis (Fig. 7F,G). Survival analysis indicated that high MTHFD2 expression and CDKN2A expression were adverse prognostic factors, while downregulation of RPS6KA1 also predicted poor outcome (Fig. 7H).
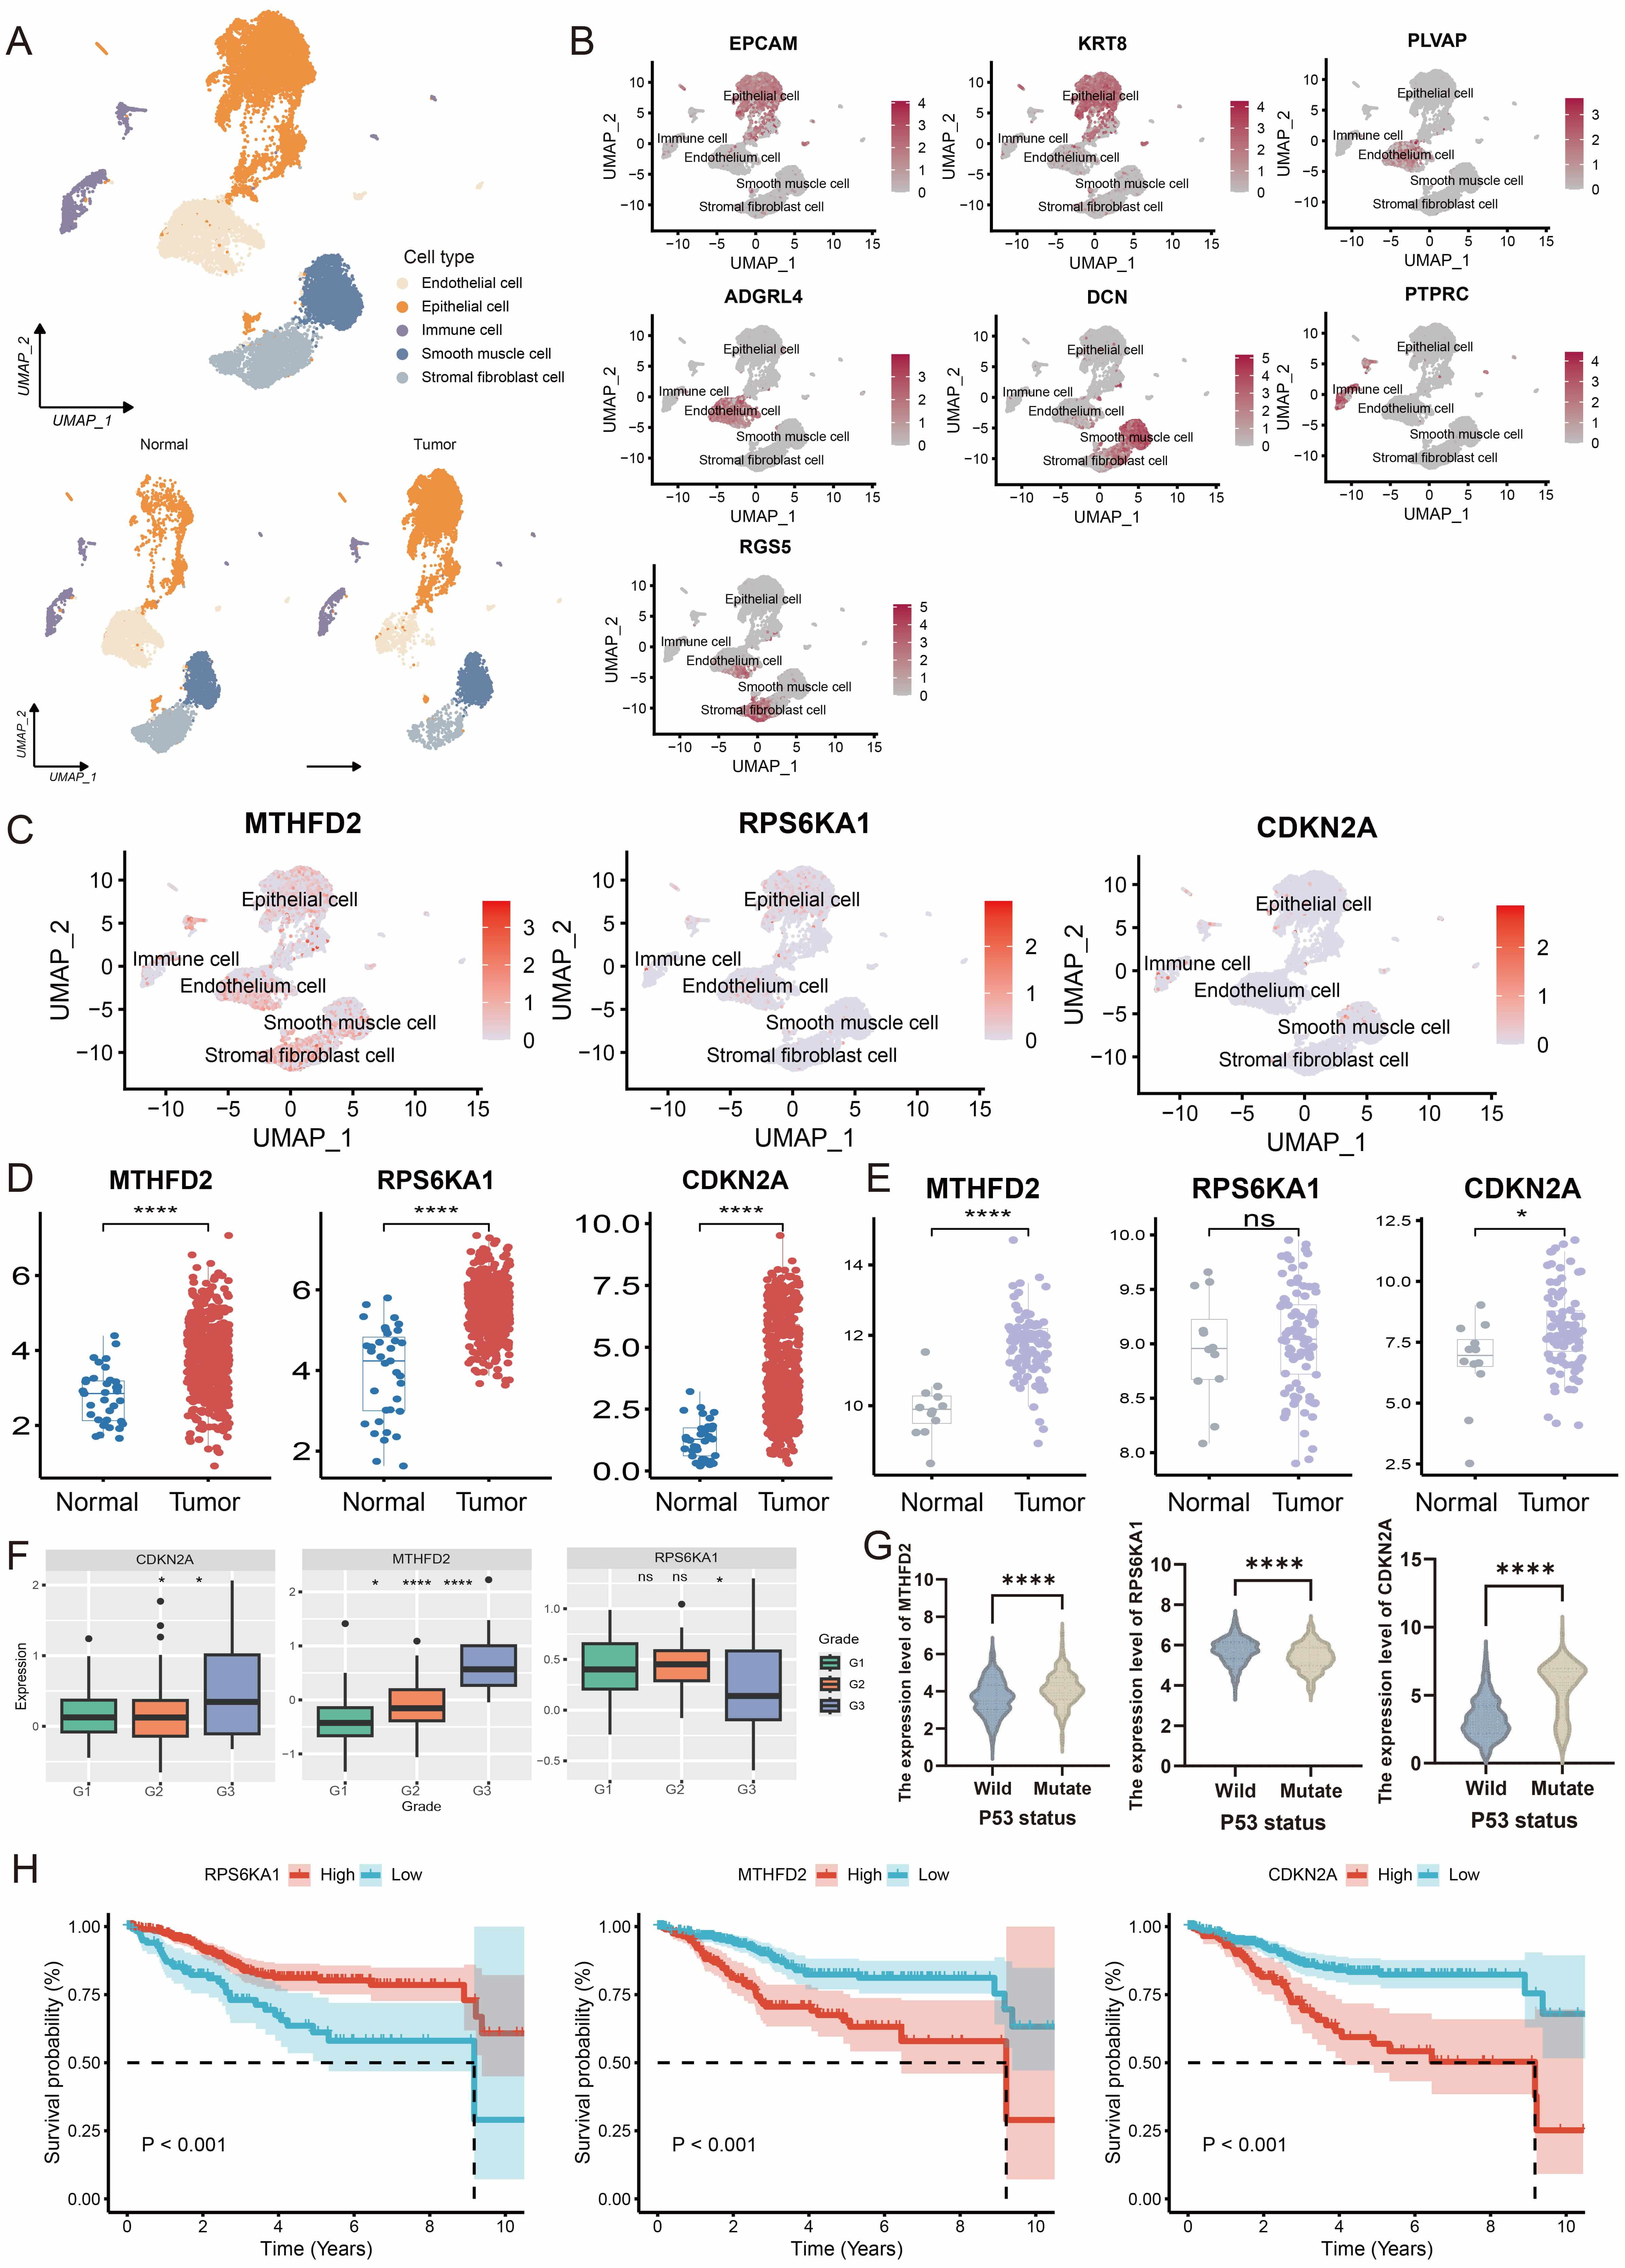 Fig. 7.
Validation of prognostic genes in external datasets. (A) UMAP
plot displaying five major cell type clusters. (B) UMAP visualization of
canonical marker genes across five cell subpopulations. (C) Expression profiles
of the three prognostic genes across cell subpopulations. (D,E) Differential
expression of the three prognostic genes in TCGA-UCEC and GSE17025 datasets. (F)
Expression patterns of the three prognostic genes across different pathological
grades in the CPTAC database. (G) Expression levels of the three prognostic
genes: comparison between TP53-mutated and wild-type samples. (H) Prediction of
disease outcome with the three prognostic genes in the TCGA-UCEC cohort. ns,
not significant, * p
To clarify the roles of prognostic genes in the EC subgroups, we further
analyzed their expression and pathway associations. MTHFD2 and
CDKN2A were highly expressed in C1, while RPS6KA1 was highly
expressed in C2 (Fig. 8A,B), consistent with the subgroup outcomes. Risk score
analysis showed that C1 had the highest scores (Fig. 8C), matching its poor
prognosis. GSVA revealed distinct signatures: C1 showed global metabolic
suppression (fatty acid, bile acid, cholesterol, hormone signaling) and
inhibition of P53, apoptosis, and ROS response, indicating dedifferentiation and
immune-metabolic suppression (Fig. 8D). The C1 subgroup also exhibited low
CD8+ T/NK infiltration and high CD274/PD-L1 and LAG3, defining an
“immune-metabolic suppressed type” with the worst prognosis. C2 featured active
proliferation (E2F transcription factor/MYC proto-oncogene, BHLH transcription
factor (E2F/MYC) targets, G2/M checkpoint), partial
interferon-
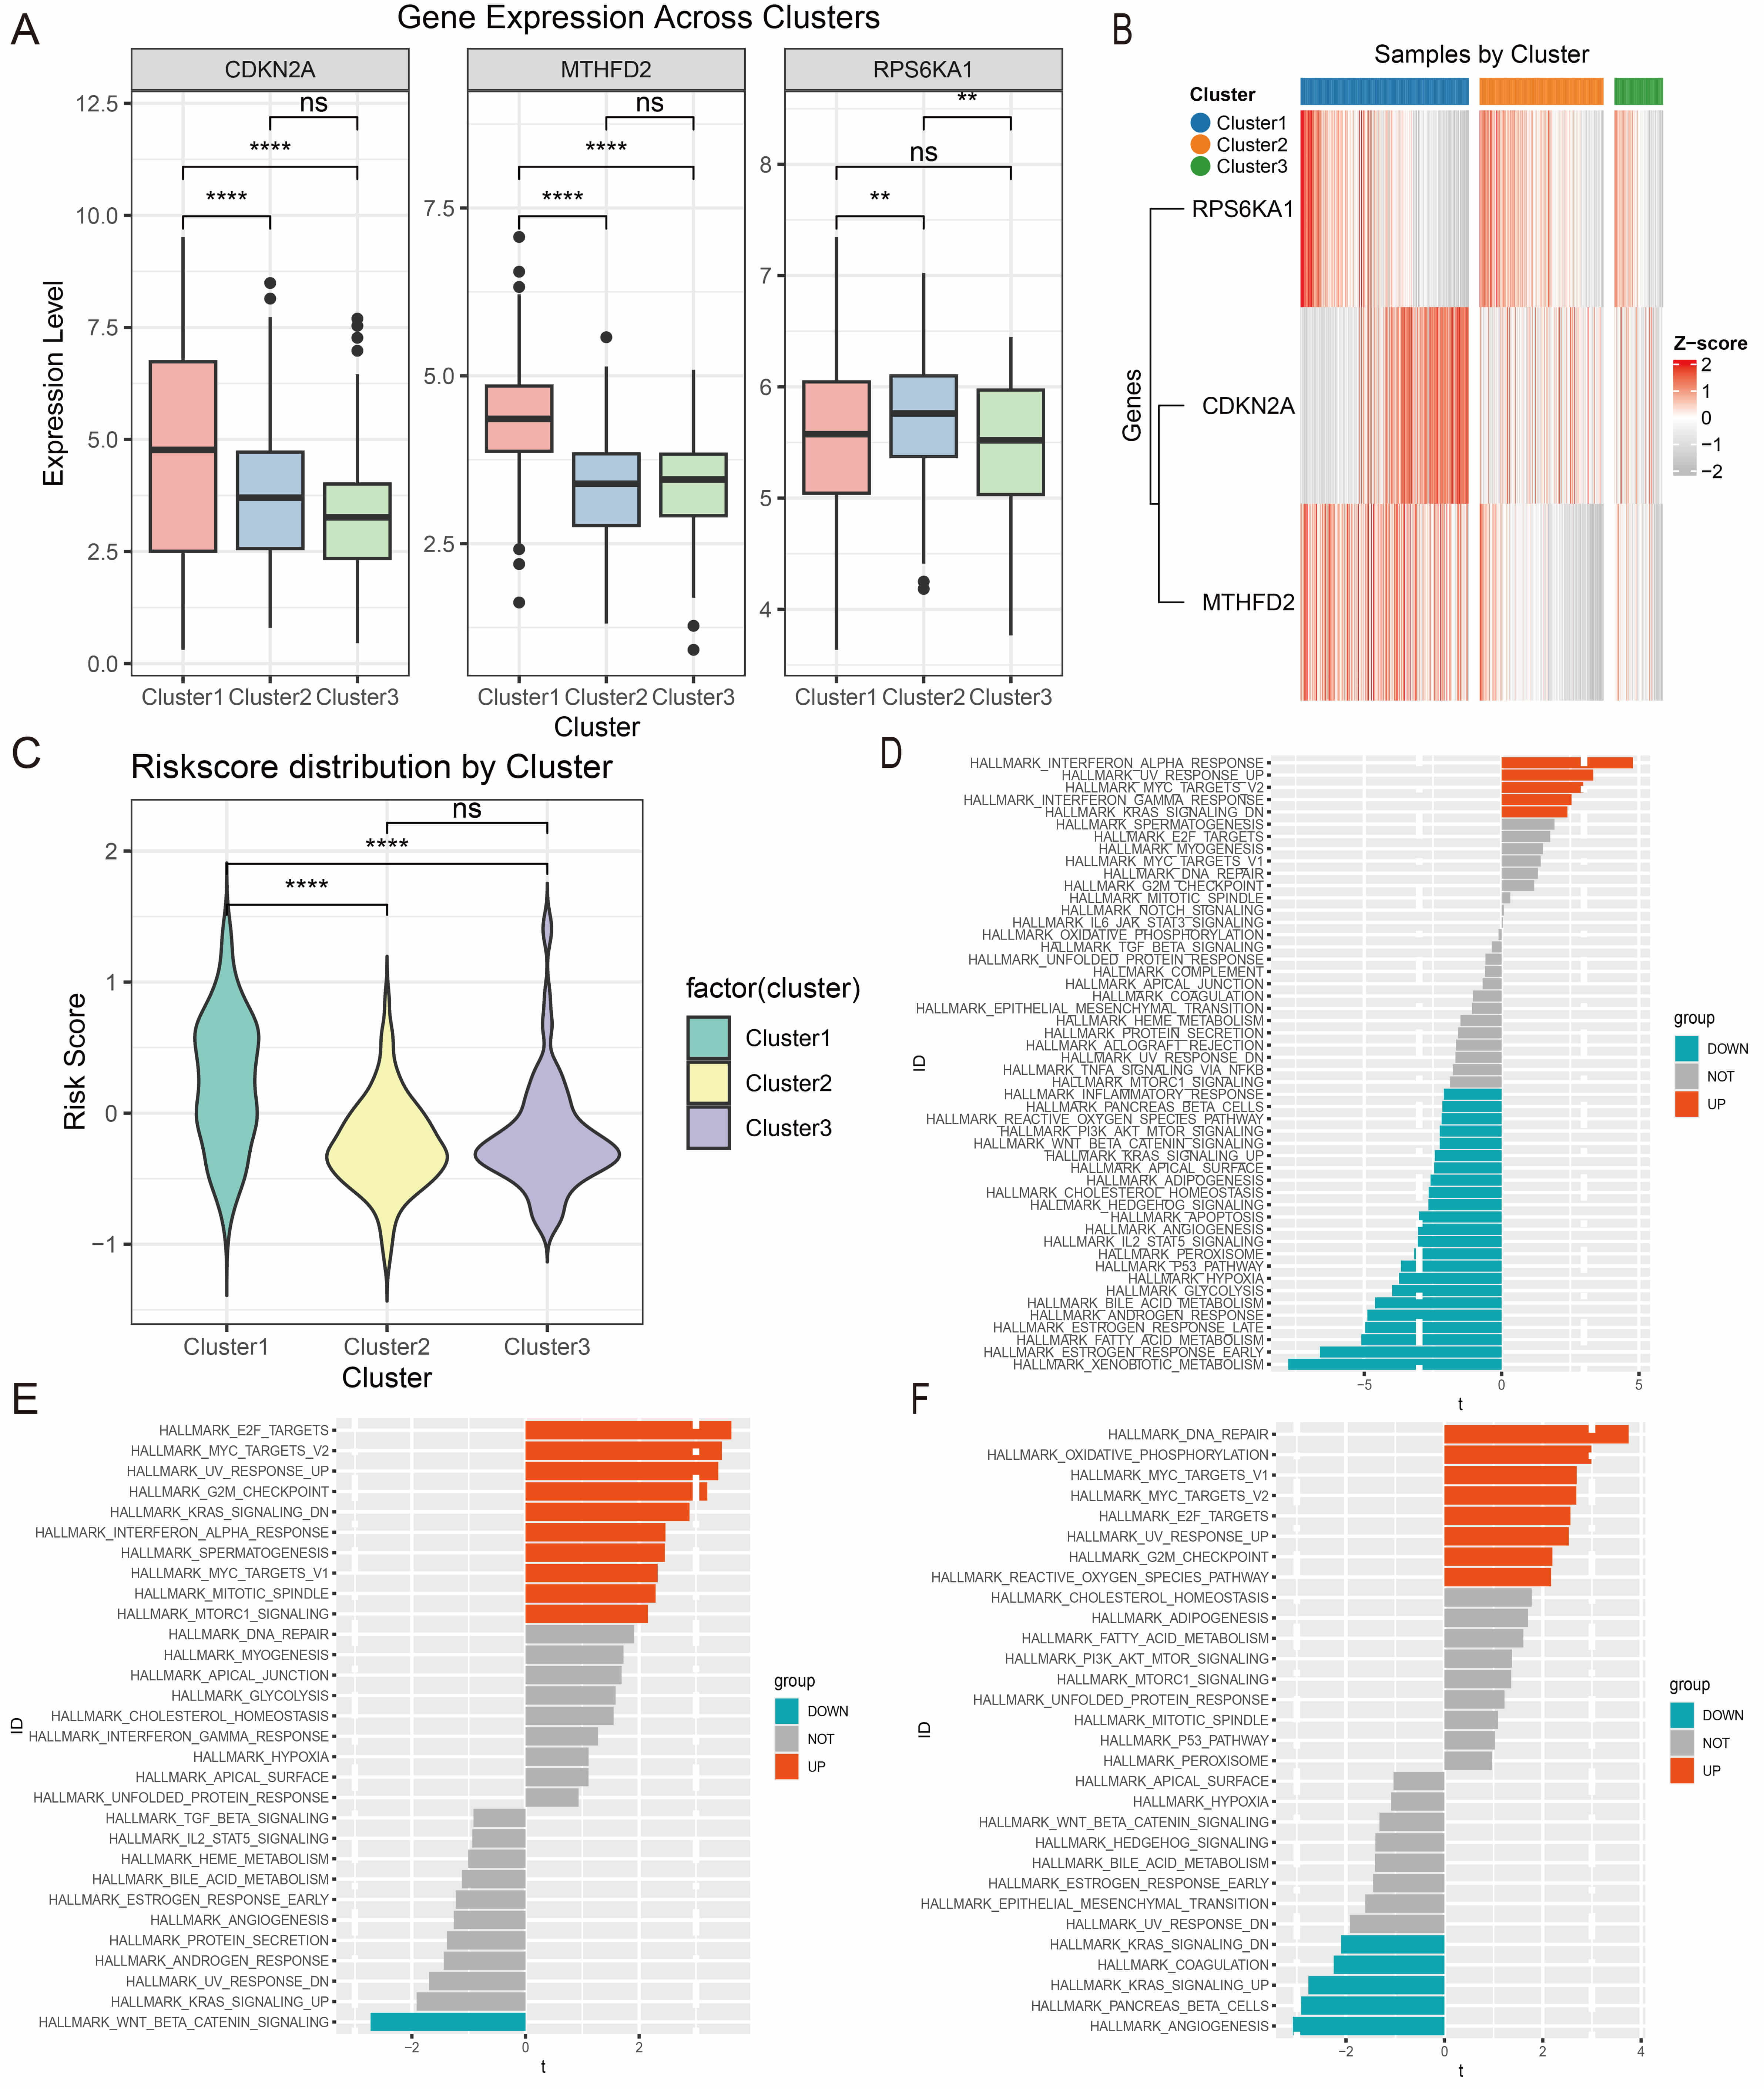 Fig. 8.
Redefining the three Gly/Ser/Thr metabolism-related subtypes in
EC. (A,B) Expression patterns for the three prognostic genes across the
metabolic subtypes are shown as bar plots (A) and heatmaps (B). (C) Distribution
of risk scores among the three metabolic subtypes. (D–F) Bar plots showing
hallmark pathway enrichment for C1 (D), C2 (E), and C3 (F) subtypes. ns, not
significant, ** p
We next examined differential expression of the key genes (CDKN2A, MTHFD2, and RPS6KA1) in vitro by comparing their levels in EECs with those found in EC cell lines (HEC-1A and Ishikawa). Compared with EECs, EC cells showed significantly higher expression of CDKN2A and MTHFD2, but lower expression of RPS6KA1 (Fig. 9). These findings provide valuable insights for subsequent investigations.
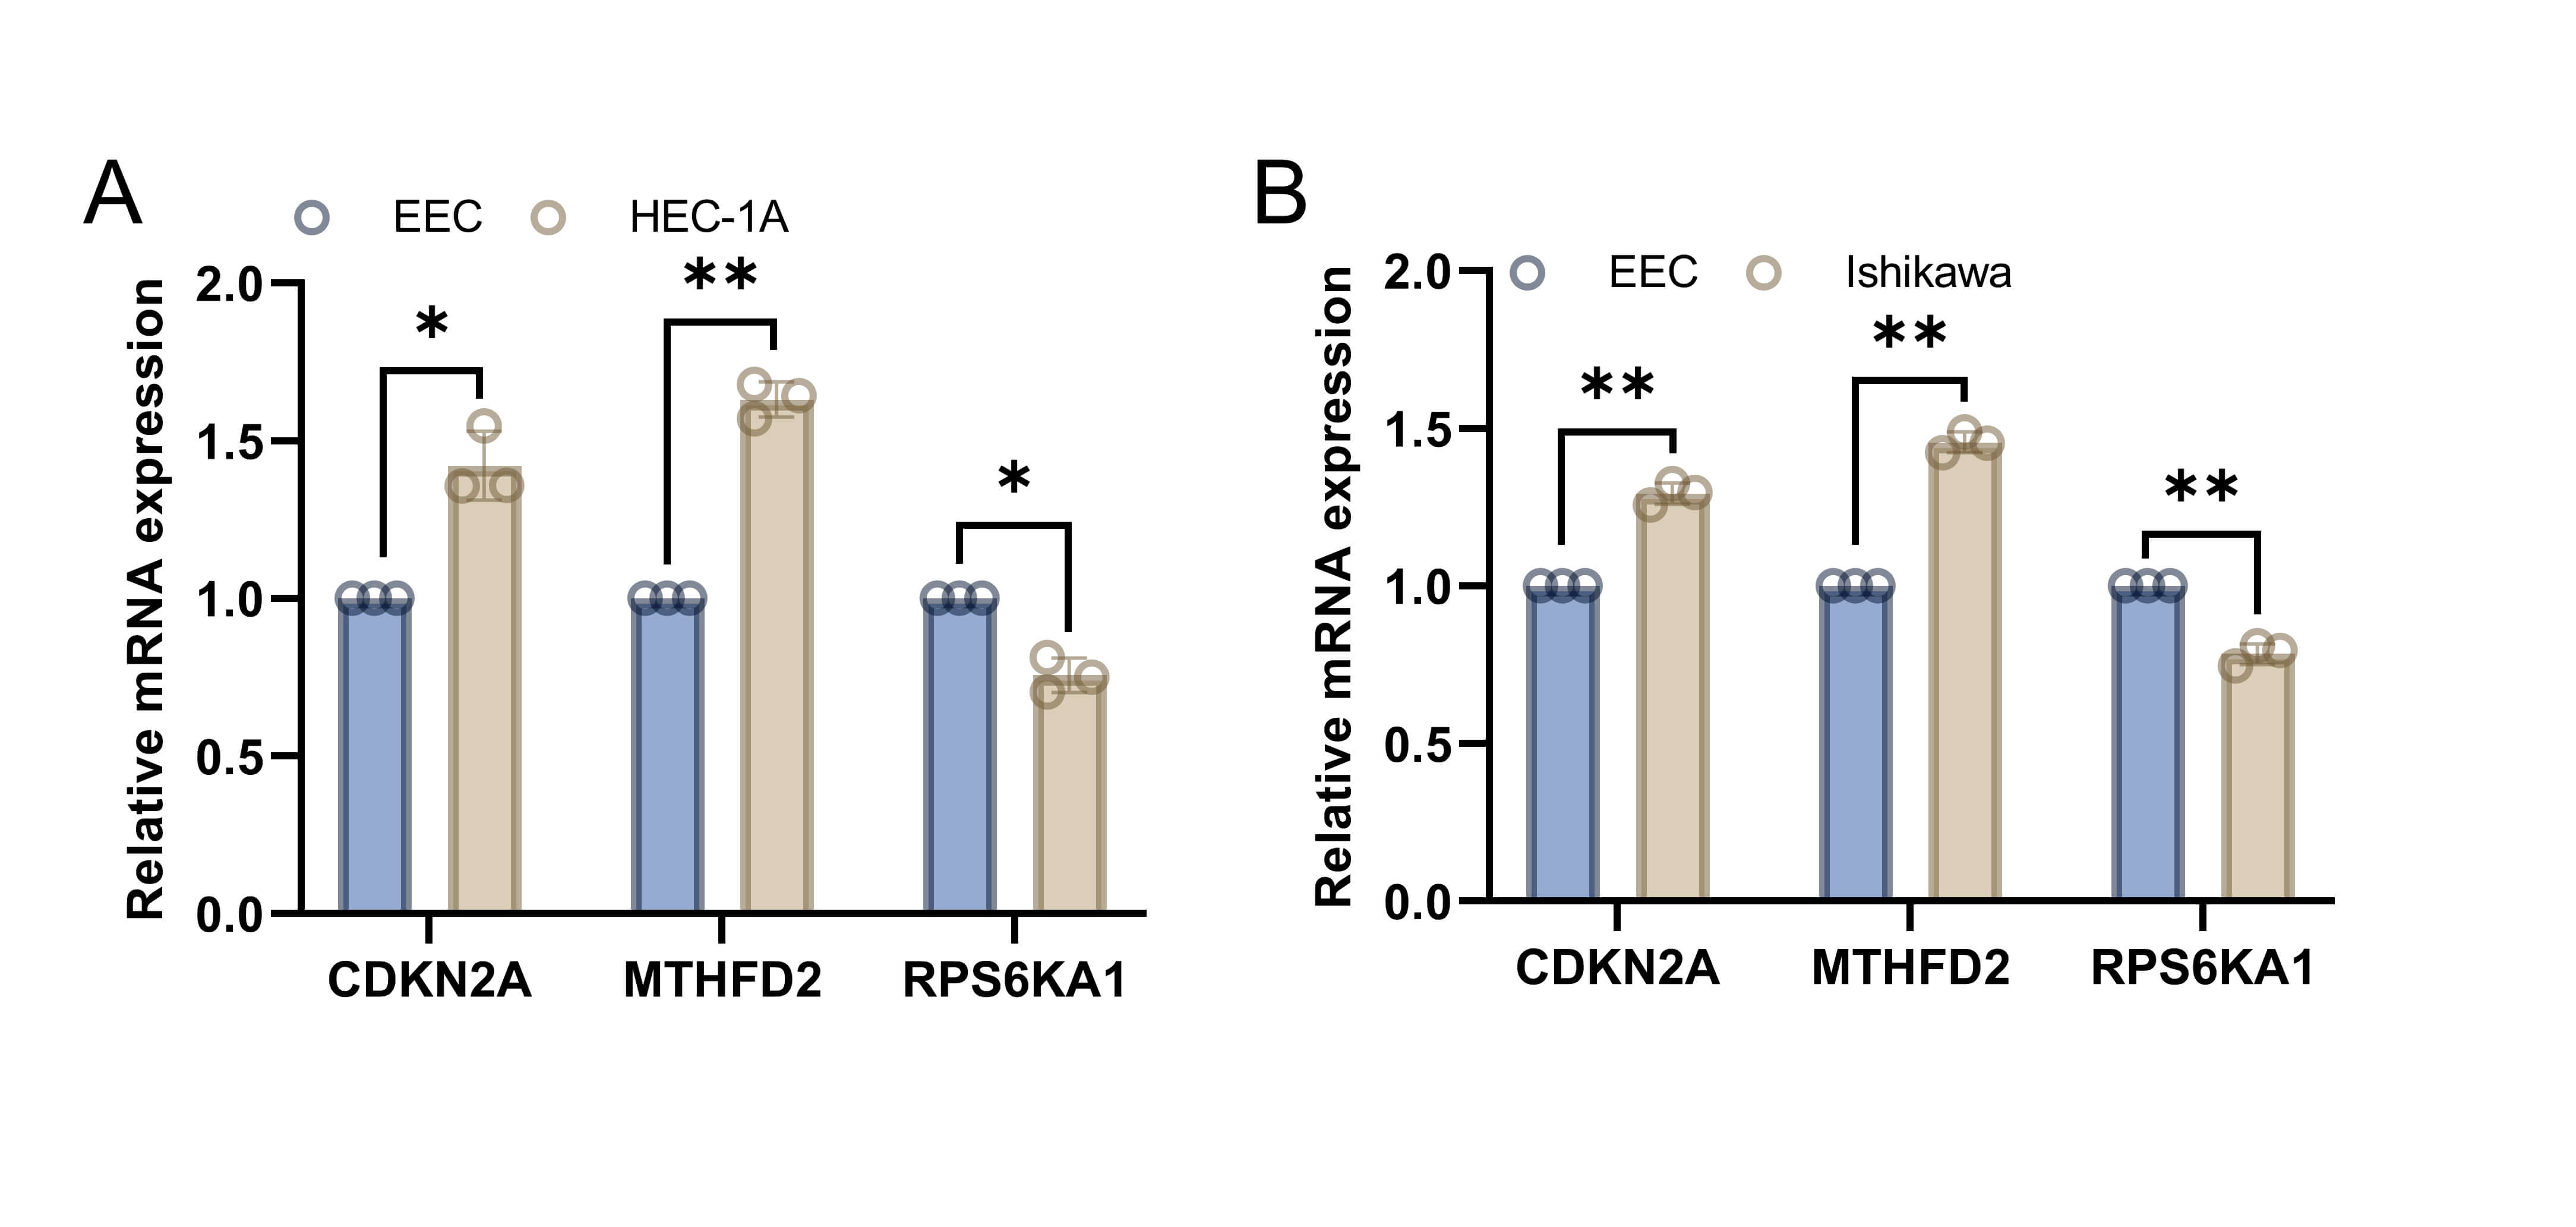 Fig. 9.
Validation of the differential expression of key genes
in vitro. (A) Differential expression of CDKN2A,
MTHFD2, and RPS6KA1 between EECs and HEC-1A cells. (B)
Differential expression of CDKN2A, MTHFD2, and RPS6KA1
between EECs and Ishikawa cells. Data are the mean
Metabolic reprogramming is a key feature of cancer, wherein tumor cells show
more active and varied metabolic profiles than normal cells. It is crucial to
gain a better understanding of how tumor cells regulate their metabolism, and
whether targeting these metabolic needs can result in therapeutic benefit [21].
EC is the second most common malignancy in the female reproductive system and has
received increasing attention due to its heterogeneity. Nevertheless, research on
the metabolic characteristics of EC remains limited. Our group has shown that
upregulation of estrogen-related receptor
The present study combined untargeted metabolomics with multi-omics to uncover the role of Gly/Ser/Thr metabolic pathways and their associated genes in EC for the first time. To further evaluate the clinical significance of genes related to Gly/Ser/Thr metabolism, we used Cox and LASSO regression analyses to identify three core prognostic genes (MTHFD2, RPS6KA1, and CDKN2A). These were used to construct a prognostic model for EC.
CDKN2A is a cell cycle regulator. While CDKN2A is usually considered to be a tumor suppressor, emerging evidence suggests that it may also act as an oncogene in some cancer types [24, 25]. In thyroid cancer, overexpression of CDKN2A correlates with advanced disease stage and poor prognosis, potentially contributing to immunotherapy resistance and immune evasion [26]. Song et al. [27] found elevated CDKN2A expression in lung cancer, along with increased PD-1 and PD-L1 levels, indicating a potential role in tumor immune escape through modulation of immunosuppressive signals. These studies suggest that CDKN2A could function as an oncogene in certain cancers. Although research on CDKN2A in EC is still limited, Bai et al. [28] reported that it may drive tumor initiation and progression by disrupting normal cell cycle regulation. Our study found that CDKN2A is significantly upregulated in EC and associated with poor prognosis. CDKN2A was expressed in epithelial and immune cells, suggesting it has a multifaceted role in EC progression. Mechanistically, aberrant upregulation of CDKN2A in epithelial cells may reflect dysregulated cell cycle control or inactivation of downstream checkpoint pathways, resulting in enhanced tumor cell adaptability. Furthermore, CDKN2A expression in immune cells may be associated with immune dysfunction or immune escape within the TME, potentially facilitating tumor progression through the suppression of effective antitumor immune responses. Therefore, CDKN2A may serve not only as a prognostic biomarker, but also as a potential therapeutic target in EC. Further functional studies are warranted to elucidate the mechanisms by which CDKN2A contributes to tumor progression and immune modulation in EC.
MTHFD2 is involved in one-carbon folate metabolism and metabolic reprogramming. Defective MTHFD2 was found to disrupt mitochondrial glycine synthesis and enhance serine synthesis in breast cancer cells [29]. MTHFD2 overexpression has been reported in several different cancer types [30, 31, 32]. It has also been shown to upregulate PD-L1 expression, thus promoting immune evasion by tumors [33]. P53-deficient cells are known to rely on serine for survival [34]. TP53 can suppress MTHFD2, suggesting that upregulation of MTHFD2 could support purine synthesis and redox control in p53-deficient or mutant cells. Targeting of MTHFD2 could therefore have therapeutic potential in patients with p53-mutant tumors [35]. However, there is still only limited research on MTHFD2 in EC. Wu et al. [36] reported that MTHFD2 is upregulated in EC, contributing to poor prognosis and promoting EC cell proliferation and invasion. MTHFD2 expression also correlates with immune cell infiltration, and in bladder cancer, it was shown to enrich in cancer immunotherapy by PD1 blockade and associate with immune infiltration [37]. These findings suggest that MTHFD2 plays key roles in tumor progression and immune evasion, making it a potential target for cancer therapy. In the present study, MTHFD2 was widely expressed in EC and emerged as a high-risk factor strongly linked to poor prognosis. We hypothesize that MTHFD2 overexpression in EC contributes to malignant progression and therapy resistance through metabolic reprogramming and immune evasion. Targeting of MTHFD2 could therefore be a promising treatment strategy for p53-mutant EC.
RPS6KA1 is a serine/threonine kinase that generally acts as an oncogene in most cancer types [38, 39, 40]. However, Chen et al. [41] reported that RPS6KA1 expression is negatively correlated with smoking-related mutational signatures, and that higher RPS6KA1 expression is significantly associated with prolonged overall survival in lung cancer patients. These findings suggest RPS6KA1 may serve as an important prognostic factor and potential therapeutic target in smoking-related lung cancer. Our prognostic analysis identified RPS6KA1 as a protective factor in EC. Low RPS6KA1 expression predicted worse outcomes in external validation datasets. However, RPS6KA1 was upregulated in bulk tumor transcriptomic data, but downregulated in EC cell lines compared with EECs. This discrepancy may be due to the capture of the TME in tissue-based analyses, but its absence in the cell line models used in vitro. Further validation in clinical tissue samples will be performed in future studies.
Our study introduces a multi-gene prognostic model based on Gly/Thr/Ser metabolism-related genes (MTHFD2, RPS6KA1, and CDKN2A) to stratify patients into distinct risk groups. High-risk patients showed significantly worse prognosis, with the model demonstrating excellent predictive accuracy. This was validated by TCGA data and our proteomic datasets, and supported by ROC curves, K-M survival analyses, and risk score distributions. The integration of risk scores with molecular subtypes highlighted the strong stratification ability of our model, and emphasized the key roles of MTHFD2, RPS6KA1, and CDKN2A in determining EC prognosis. Further analyses of the TMB, immune microenvironment, and immune scores revealed that high-risk patients had more frequent TP53 mutations, higher TIDE scores, lower immune and stromal scores, and higher tumor purity. These findings indicate the presence of an immunologically “cold” TME in high-risk patients, which is associated with poorer immunotherapy responses.
We also performed cluster analysis based on gene modules from WGCNA, integrating prognostic gene expression with immune features. Using GSVA and survival analysis, we identified three EC subgroups with distinct molecular and clinical prognostic differences: immune-metabolic suppressed (C1), proliferation-immune balanced (C2), and immune-activated (C3). The C1 subgroup had the worst prognosis and showed metabolic pathway suppression and an “immune-cold” environment (low CD8+ T cell and DC infiltration, high PD-L1 and LAG3 expression). A key driver of EC progression is MTHFD2-mediated one-carbon metabolism abnormality, which induces mitochondrial DNA damage, provides the tumor with its energy needs, impairs immune function, and promotes immune escape [42, 43]. High MTHFD2 expression in C1 supports this mechanism, suggesting that targeting this enzyme could reverse immune suppression in C1 subtype EC. The C2 subtype offers a novel perspective on EC heterogeneity, with these tumors showing high proliferation and active anti-tumor immunity. This balance state may be key to their favorable prognosis, since increased proliferative signals are effectively counterbalanced by the immune system, thus preventing excessive tumor growth while maintaining microenvironmental homeostasis [44]. And Defects in DNA repair can result in the loss of genomic stability, contributing to tumorigenesis and mutation accumulation [45]. A previous study showed that metabolic syndrome and estrogen in type I EC cells can drive metabolic reprogramming by inhibiting OXPHOS, thereby promoting EC proliferation [46]. The C3 EC subgroup in the present study showed upregulated DNA repair signaling and OXPHOS pathways, along with activated CD8+ T cells and DCs, indicating a favorable prognosis. In summary, the EC subgroup classification system developed in the current study highlights the importance of metabolism and immune interactions in EC progression, as well as providing guidance for clinical precision medicine. C1 EC patients may need combined metabolic intervention (e.g., MTHFD2 inhibition) and immunotherapy (e.g., anti-PD-L1) to reverse immune suppression. C2 EC patients may benefit from ICBs to enhance their immune-balanced state, while C3 patients may require maintenance therapy to preserve their metabolic maturity and immune-activated advantages. Future mechanistic studies and clinical trials targeting key molecules in each subtype may provide further validation of this system and lead to more precise treatment options for EC patients. Our novel classification system not only clarifies the metabolic-immune interactions driving EC progression, but also provides insights for personalized treatment strategies. However, several limitations of this study should be acknowledged. First, the transcriptomic and clinical data used for model construction and validation were primarily derived from retrospective public datasets. This may introduce selection bias and limit causal inference, underscoring the need for future prospective validation. Second, although our study integrated metabolomics, transcriptomics, proteomics, and single-cell analyses to identify prognostic genes, functional mechanistic assays were not performed. Further in vitro and in vivo experiments are therefore required to elucidate the biological roles of MTHFD2, RPS6KA1, and CDKN2A in EC progression and immune regulation. Finally, the untargeted metabolomics analysis was conducted with a relatively small sample size, which may restrict statistical power and generalizability. Larger independent cohorts will be needed for further validation.
This study is the first to demonstrate a strong link between EC development and the Gly/Ser/Thr metabolic pathways. By analyzing genes within this pathway, we developed a prognostic model based on the expression of MTHFD2, RPS6KA1, and CDKN2A. This model showed high predictive accuracy and clinical relevance. Additionally, we established a molecular classification system that integrates metabolic and immune features, thus identifying novel biomarkers and potential therapeutic targets for the precision treatment of EC.
EC, Endometrial cancer; Gly/Ser/Thr, Glycine/Serine/Threonine; WGCNA, Weighted Gene Co-Expression Network Analysis; MTHFD2, Methylenetetrahydrofolate dehydrogenase/cyclohydrolase 2; RPS6KA1, Ribosomal protein S6 kinase A1; CDKN2A, Cyclin-dependent kinase inhibitor 2A; GSVA, Gene set variation analysis; KEGG, Kyoto Encyclopedia of Genes and Genomes; GEO, Gene Expression Omnibus; UCEC, Uterine Corpus Endometrial Carcinoma; LASSO, Least absolute shrinkage and selection operator; ROC, Receiver operating characteristic; TMB, Tumor mutation burden; TIDE, Tumor immune dysfunction and exclusion; UMAP, Uniform manifold approximation and projection; MDSCs, Myeloid-derived suppressor cells.
The datasets used and analyzed during the current study are available from the corresponding author on reasonable request.
JXY conducted the experiments, analyzed the data, and wrote the manuscript. YSS collected and analyzed the data and provided valuable discussions. MTZ and XTL performed the data management. XDM and PMS conceived the study, contributed to the critical revision of the article for important intellectual content, supervised the research, and provided financial support. All authors gave final approval for the submitted version and agreed to take responsibility for all aspects of the work. All authors contributed to editorial changes in the manuscript.
All subjects gave written informed consent to participate in the study. The study was conducted in accordance with the Declaration of Helsinki and approved by Fujian Maternity and Child Health Hospital Ethics Commission (Grant NO. 2021KRD001).
We gratefully acknowledge Director Yan Lin and Prof. Hao Lin for generously providing patient clinical specimens and associated clinical data, as well as for their financial support.
This research was funded by the Fujian Province Central Government-Guided Local Science and Technology Development Project (No. 2023L3019), the Fujian Province health medicine innovation project (No. 2024CXB008), Joint Fundsfor the Innovation of Science and Technology (No. 2024Y9585), Fujian Provincial Nature Science Foundation of China (No. 2023J011232) and Fujian Province and the Startup Fund for scientific research, Fujian Medical University (No. 2023QH2045).
The authors declare no conflict of interest.
Supplementary material associated with this article can be found, in the online version, at https://doi.org/10.31083/FBL48779.
References
Publisher’s Note: IMR Press stays neutral with regard to jurisdictional claims in published maps and institutional affiliations.