


 , Chiara Massaro 2, Naouel Boussoualim 1, Meriem Elkolli 3, Rosa Alduina 2,4,*
1 Laboratory of Applied Biochemistry, Faculty of Nature and Life Sciences, University Ferhat Abbas of Setif 1, 19000 Setif, Algeria
2 Department of Biological, Chemical and Pharmaceutical Sciences and Technologies (STEBICEF), University of Palermo, 90128 Palermo, Italy
3 Laboratory of Microbiology, Faculty of Nature and Life Sciences, University Ferhat Abbas of Setif 1, 19000 Setif, Algeria
4 NBFC, National Biodiversity Future Center, 90133 Palermo, Italy
Abstract
Escherichia coli is the leading cause of urinary tract infections (UTIs), and the increasing prevalence of antimicrobial resistance represents a major public health concern. The dissemination of multidrug-resistant uropathogenic E. coli (UPEC), frequently harboring transferable resistance determinants, poses an urgent clinical challenge.
This study investigated the prevalence of β-lactamase genes (blaTEM, blaSHV, blaCTX-M, blaCMY, and blaDHA) and plasmid-mediated quinolone resistance genes (qnrA, qnrB, qnrC, qnrD, and qnrS) in 86 imipenem-non-susceptible UPEC isolates using multiplex and single PCR assays. Gene distribution and co-occurrence were examined across E. coli phylogenetic groups, and pairwise associations were evaluated using correlation analysis. Principal component analysis (PCA) was applied to explore global relationships between antibiotic susceptibility profiles, extended-spectrum β-lactamase (ESBL) phenotype, and resistance determinants.
Overall, 74.4% of imipenem-non-susceptible isolates carried at least one β-lactamase gene. blaTEM was the most prevalent (62.8%), followed by blaCMY II (12.8%). blaSHV, blaCTX-M group I, and blaCTX-M group II showed comparable prevalence (10.5% each). The B2 phylogroup showed the greatest diversity of β-lactamase profiles, with phylogroup E representing the second most frequent reservoir. Among quinolone resistance genes, qnrB was the most prevalent (20.9%), followed by qnrD (5.8%), qnrS (4.7%), qnrA (3.5%), and qnrC (1.2%). All qnrC-positive isolates were resistant to all tested quinolones. No statistically significant associations were observed between β-lactamase genes and qnr genes. Significant within-class correlations were detected for blaCTX-M group II–blaCMY II (φ = 0.893, q = 9.33 × 10⁻⁹) and qnrC–qnrA (φ = 0.57, q = 0.374).
A high prevalence of β-lactamase and qnr determinants was observed among imipenem-non-susceptible UPEC, primarily driven by blaTEM and qnrB, frequently detected in B2 isolates. The co-occurrence and correlation of multiple resistance genes highlight the complexity of resistance architectures and underscore the need for ongoing molecular surveillance and strengthened antimicrobial stewardship to limit the dissemination of resistant UPEC.
Keywords
- uropathogenic Escherichia coli (UPEC)
- urinary tract infection (UTI)
- antimicrobial resistance
- β-lactamase genes
- extended-spectrum β-lactamases (ESBL)
- plasmid-mediated quinolone resistance (PMQR)
- phylogroups
- public health
Escherichia coli, a member of the Enterobacteriaceae family, is one of the most prevalent gastrointestinal commensals in humans and a major cause of both community- and hospital-acquired infections, particularly urinary tract infections (UTIs) [1, 2]. Uropathogenic E. coli (UPEC), within the broader extraintestinal pathogenic E. coli (ExPEC) pathotype, is the leading etiological agent of UTIs and can also contribute to severe invasive infections, such as bloodstream infections and, less frequently, meningitis. Its pathogenicity is driven by a wide repertoire of virulence determinants, such as adhesins, toxins, siderophores, capsules, and biofilm-associated traits, often occurring alongside multidrug resistance, which enhances persistence under antimicrobial pressure [3].
Several antimicrobial agents are routinely used for UTI treatment, including
Antimicrobial resistance (AMR) is increasingly recognized as a major global health emergency, with recent global syntheses highlighting a substantial and rising burden across multiple infection syndromes. In particular, recent systematic analyses have quantified the worldwide burden of bacterial AMR and provided forecasts for future trends, emphasizing the urgent need for strengthened surveillance and stewardship interventions [4]. In parallel, the WHO GLASS reports provide updated global surveillance data on resistance prevalence and trends, including urinary tract infections, supporting the relevance of locally generated datasets for guiding empiric therapy and containment strategies [5].
Resistance to
Beyond resistance profiling, investigating the distribution of resistance
determinants across E. coli phylogenetic groups can provide insights
into the epidemiology and dissemination of resistant lineages. In parallel,
phenotypic identification of extended-spectrum
This study forms part of a broader investigation into the prevalence of clinically relevant antibiotic-resistant bacteria in the Setif region, with a focus on elucidating molecular resistance mechanisms. The study was approved by the Ethics and Deontology Committee at University Ferhat Abbas of Setif 1 under the number UFAS1/09/03/2023/ETH-Deon-A-301, and an informed written consent was taken from each participant.
Between January 2021 and December 2023, a total of 402 bacterial isolates were recovered from urine samples collected across three healthcare areas of the Setif province (east, west, and north). The entire collection was analyzed for imipenem non-susceptibility using the Modified Hodge Test protocol reported by Aminul et al. [15] and the imipenem-EDTA combined test protocol reported by Radhika et al. [16]. From this analysis, 86 uropathogenic Escherichia coli (UPEC) isolates, categorized as imipenem non-susceptible, were selected for detailed phenotypic and molecular characterization. Samples were obtained from patients of both sexes and all age groups, and relevant demographic/clinical data (age, sex, prior antibiotic exposure, and sampling date) were recorded when available.
Urine cultures were processed under aseptic conditions. Only pure cultures
yielding
Isolates were cultured on nutrient agar and MacConkey agar and incubated at 37 °C for 18–24 h. Presumptive identification was based on colony morphology and Gram staining, and E. coli identity was confirmed by conventional biochemical testing, including the IMViC panel (indole, methyl red, Voges–Proskauer, citrate utilization) as well as catalase and urease tests, nitrate reduction, motility, triple sugar iron (TSI) reactions, and gas production. Confirmed isolates were stored in nutrient broth supplemented with sterile glycerol at –20 °C until further analyses.
Antimicrobial susceptibility testing was performed using the disc diffusion method on Mueller-Hinton agar, following the guidelines of the European Committee on Antimicrobial Susceptibility Testing [17] as previously described [2].
Phenotypic ESBL production was evaluated using a standard confirmatory approach
as previously described [2], based on the synergy between third-generation
cephalosporins and clavulanic acid. Presumptive AmpC
Phylogenetic grouping of E. coli isolates was performed using the Clermont et al. [18] multiplex PCR method, as previously described [2]. Primer sequences and PCR conditions, including annealing temperatures, are summarized in Table 1 (Ref. [13, 14, 15, 16, 17]), and phylogroups were assigned according to the Clermont classification algorithm. Primers were synthesized by BMR Genomics (Padova, Italy).
| Reaction | Target genes | Primer sequences (5′–3′) | Amplicon size (bp) | Tm (°C) | Reference |
| Quadruplex | chuA | F: ATGGTACCGGACGAACCAAC | 288 | 59 | [13] |
| R: GCCGCCAGTACCAAAGACA | |||||
| yjaA | F: AAACGTGAAGTGTCAGGAG | 211 | 59 | [14] | |
| R: AATGCGTTCCTCAACCTGTG | |||||
| tspE4.C2 | F: CACTATTCGTAAGGTCATCC | 152 | 59 | [14] | |
| R: AGTTTATCGCTGCGGGTCGC | |||||
| arpA | F: AACGCTATTCGCCAGCTTGC | 400 | 59 | [14, 15] | |
| R: TCTCCCCATACCGTACGCTA | |||||
| Group E | arpA | F: AACGCTATTCGCCAGCTTGC | 301 | 57 | [16] |
| R: TCTCCCCATACCGTACGCTA | |||||
| Group C | trpA | F: AGTTTTATGCCCAGTGCGAG | 219 | 57 | [16] |
| R: TCTGCGCCGGTCACGCCC | |||||
| Internal control | trpA | F: GCGATAAAGACATCTTCAC | 489 | 57 | [17] |
| R: GCAACGCGGCCTGGCGGAAG |
Total DNA was obtained from pure colonies using the heat-lysis method adapted
from Woodman et al. (2016) [19]. Briefly, 1–2 colonies from overnight
cultures grown on nutrient agar (Oxoid, Milan, Italy) were suspended in 100
µL of sterile water, heated at 99 °C for 15 min, and
centrifuged at 10,000
Cycling conditions consisted of an initial denaturation step followed by 35 cycles of denaturation, primer-specific annealing, and extension, with a final elongation step. Primer sequences, expected amplicon sizes, annealing temperatures, and reference are reported in Table 2 (Ref. [20, 21, 22]).
| Target gene | Primer Sequence (5′–3′) | Amplicon Size (bp) | Tm (°C) | Reference |
| 16S rDNA | F: GAGTTTGATCCTGGCTCAG | 1402 | 56 | [20] |
| R: ACGGCTACCTTGTTACGACT | ||||
| CTX-M group IV | F: GACAAAGAGAGTGCAACGGATG | 501 | 61 | [21] |
| R: TCAGTGCGATCCAGACGAAA | ||||
| TEM | F: AGTGCTGCCATAACCATGAGTG | 431 | 61 | [21] |
| R: CTGACTCCCCGTCGTGTAGATA | ||||
| OXA | F: ATTATCTACAGCAGCGCCAGTG | 296 | 61 | [21] |
| R: TGCATCCACGTCTTTGGTG | ||||
| SHV | F: GATGAACGCTTTCCCATGATG | 214 | 61 | [21] |
| R: CGCTGTTATCGCTCATGGTAA | ||||
| CMY II | F: AGCGATCCGGTTCACGAAATA | 695 | 61 | [21] |
| R: CCCGTTTTATGCACCCATGA | ||||
| CTX M group I | F: TCCAGAATAAGGAATCCCATGG | 621 | 61 | [21] |
| R: TGCTTTACCCAGCGTCAGAT | ||||
| CTX M group II | F: ACCGCCGATAATTCGCAGAT | 588 | 61 | [21] |
| R: GATATCGTTGGTGGTGCCATAA | ||||
| DHA | F: GTGGTGGACAGCACCATTAAA | 314 | 61 | [21] |
| R: CCTGCGGTATAGGTAGCCAGAT | ||||
| qnrA | F: ATTTCTCACGCCAGGATTTG | 516 | 60 | [22] |
| R: TGCCAGGCACAGATCTTGAC | ||||
| qnrB | F: CGACCTKAGCGGCACTGAAT | 515 | 50 | [22] |
| R: GAGCAACGAYGCCTGGTAGYTG | ||||
| qnrC | F: GGGTTGTACATTTATTGAATC | 446 | 50 | [22] |
| R: TCCACTTTACGAGGTTCT | ||||
| qnrD | F: CGAGATCAATTTACGGGGAATA | 581 | 50 | [22] |
| R: AACAAGCTGAAGCGCCTG | ||||
| qnrS | F: GACGTGCTAACTTGCGTGAT | 118 | 62 | [22] |
| R: TGGCATTGTTGGAAACTTG |
Biofilm formation was quantified using a microtiter-plate crystal violet assay, measuring OD570 after 24 h incubation to classify strains as non-, weak, moderate, or strong biofilm producers based on an OD cut-off [2]. E. coli ATCC 25922 served as the control, and all experiments were performed in triplicate.
Statistical analyses were performed using SPSS Statistics (Armonk, New York, USA
(Headquarters) and R (version 4.5.1; R Foundation for Statistical Computing,
Vienna, Austria; R Project website). Associations between categorical variables
were assessed using Fisher’s exact test (two-tailed). For gene–phenotype
analyses, antimicrobial susceptibility results were dichotomized as
non-susceptible (I+R) versus susceptible (S); phenotypic screening variables
(ESBL production and cefoxitin-based presumptive AmpC screening) were also
treated as binary outcomes. Effect sizes were reported as odds ratios (OR) with
95% confidence intervals. Pairwise associations between resistance genes
(presence/absence) were quantified using the phi coefficient (
Among the 86 imipenem non-susceptible UPEC isolates, blaTEM was the
most prevalent
| Resistance gene | n | N | n/N (%) | Expected phenotype (typical) |
| blaTEM | 54 | 86 | 62.8% | Penicillinas e (AMP/AMX) |
| blaSHV | 9 | 86 | 10.5% | Penicillinas e |
| blaOXA | 6 | 86 | 7.0% | OXA-type |
| blaCTX-M group I | 9 | 86 | 10.5% | ESBL → 3GC + aztreonam; usually clavulanate-inhibitable [23] |
| blaCTX-M group II | 9 | 86 | 10.5% | |
| blaCTX-M group IV | 3 | 86 | 3.5% | ESBL → 3GC + aztreonam; usually clavulanate-inhibitable [23, 24] |
| blaCMY II | 11 | 86 | 12.8% | pAmpC → cefoxitin + many cephalosporins; poor clavulanate inhibition [25] |
| blaDHA | 7 | 86 | 8.1% | |
| qnrA | 3 | 86 | 3.5% | PMQR (Qnr) → low-level quinolone/FQ; facilitates QRDR selection [26] |
| qnrB | 18 | 86 | 20.9% | |
| qnrC | 1 | 86 | 1.2% | |
| qnrD | 5 | 86 | 5.8% | |
| qnrS | 4 | 86 | 4.7% |
Note: For each determinant, the table reports the absolute number of
gene-positive isolates (n), the total number tested (N), and the corresponding
prevalence [n/N (%)]. The “Expected phenotype” column summarizes the typical
resistance pattern associated with each gene family (
Across phylogenetic groups, phylogroup B2 showed the broadest repertoire of
| Variables (Single gene) | A | B1 | B2 | Clade I | Clade I or II | D | E | Unknown | Total (%) |
| blaCTX-M group IV (n = 3) | 0 | 0 | 1 (33.3) | 0 | 0 | 0 | 1 (33.3) | 1 (33.3) | 100 |
| blaTEM (n = 54) | 3 (5.5) | 1 (1.9) | 27 (50) | 0 | 0 | 1 (1.9) | 15 (27.8) | 7 (13) | 100 |
| blaOXA (n = 6) | 1 (16.7) | 0 | 5 (83.3) | 0 | 0 | 0 | 0 | 0 | 100 |
| blaSHV (n = 9) | 1 (11.1) | 1 (11.1) | 5 (55.6) | 0 | 0 | 0 | 1 (11.1) | 1 (11.1) | 100 |
| blaCTX-M group I (n = 9) | 0 | 0 | 5 (55.6) | 0 | 0 | 0 | 4 (44.4) | 0 | 100 |
| blaCTX-M group II (n = 9) | 1 (11.1) | 1 (11.1) | 5 (55.6) | 0 | 0 | 0 | 0 | 2 (22.2) | 100 |
| blaCMY II (n = 11) | 1 (9.1) | 1 (9.1) | 5 (45.5) | 0 | 0 | 0 | 1 (9.1) | 3 (27.3) | 100 |
| blaDHA (n = 7) | 1 (14.3) | 1 (14.3) | 3 (42.8) | 0 | 0 | 0 | 1 (14.3) | 1 (14.3) | 100 |
When gene-positive isolates were stratified by phylogroup, blaTEM was
mainly detected within B2 (27/54; 50.0%) and E (15/54; 27.8%), and it
was the only
As shown in Supplementary Table 1, the most frequent pattern was blaTEM + blaCTX-M group I (6/86, 7.0%), followed by blaTEM + qnrB (5/86, 5.8%), whereas all remaining profiles occurred in only one or two isolates, indicating substantial heterogeneity.
When stratified by phylogroup (Supplementary Table 2),
Phenotypic testing identified ESBL production in 42/86 (48.8%) imipenem
non-susceptible UPEC isolates and a presumptive AmpC screening phenotype, based
on cefoxitin (CX 30) non-susceptibility in 27/86 (31.4%) isolates.
Plasmid-mediated AmpC genes (blaCMY II and/or blaDHA) were
detected in 18/86 (20.9%) isolates. The cefoxitin-based presumptive AmpC
phenotype showed a non-significant trend toward association with blaCMY
II/blaDHA carriage, suggesting an enrichment of pAmpC genes among
cefoxitin-non-susceptible isolates, while also indicating that reduced cefoxitin
susceptibility may reflect additional mechanisms not captured by the targeted
pAmpC gene panel. the corresponding 2
| Analysis | No. of isolates | Statistical analysis | ||||
| +/+ | +/– | –/+ | –/– | OR (95% CI) | Fisher’s | |
| ESBL production/ESBL genes (strict) | 21 | 21 | 3 | 41 | 13.23 (3.40–77.12) | 0.00077 |
| AmpC screen (CX30 NS)/pAmpC genes (blaCMY II and/or blaDHA) | 9 | 18 | 9 | 50 | 2.74 (0.82–9.23) | 0.085 |
Note: The ESBL phenotype was compared with ESBL gene carriage (strict panel). The presumptive AmpC phenotype was defined as non-susceptibility to cefoxitin (CX30) and compared with the presence of plasmid-mediated AmpC genes (blaCMY II and/or blaDHA). Odds ratios (OR) with 95% confidence intervals (CI) and Fisher’s exact test p-values are reported. + and – indicate isolates positive or negative for the phenotype and/or gene presence, respectively.
Overall, 68.6% of isolates carried at least one bla gene; 40.7% harbored a single gene, 22.1% carried two genes, and 5.8% carried three or four genes (Table 4).
To assess genotype–phenotype associations within the
As shown in Fig. 1 (and detailed in Supplementary Table 2),
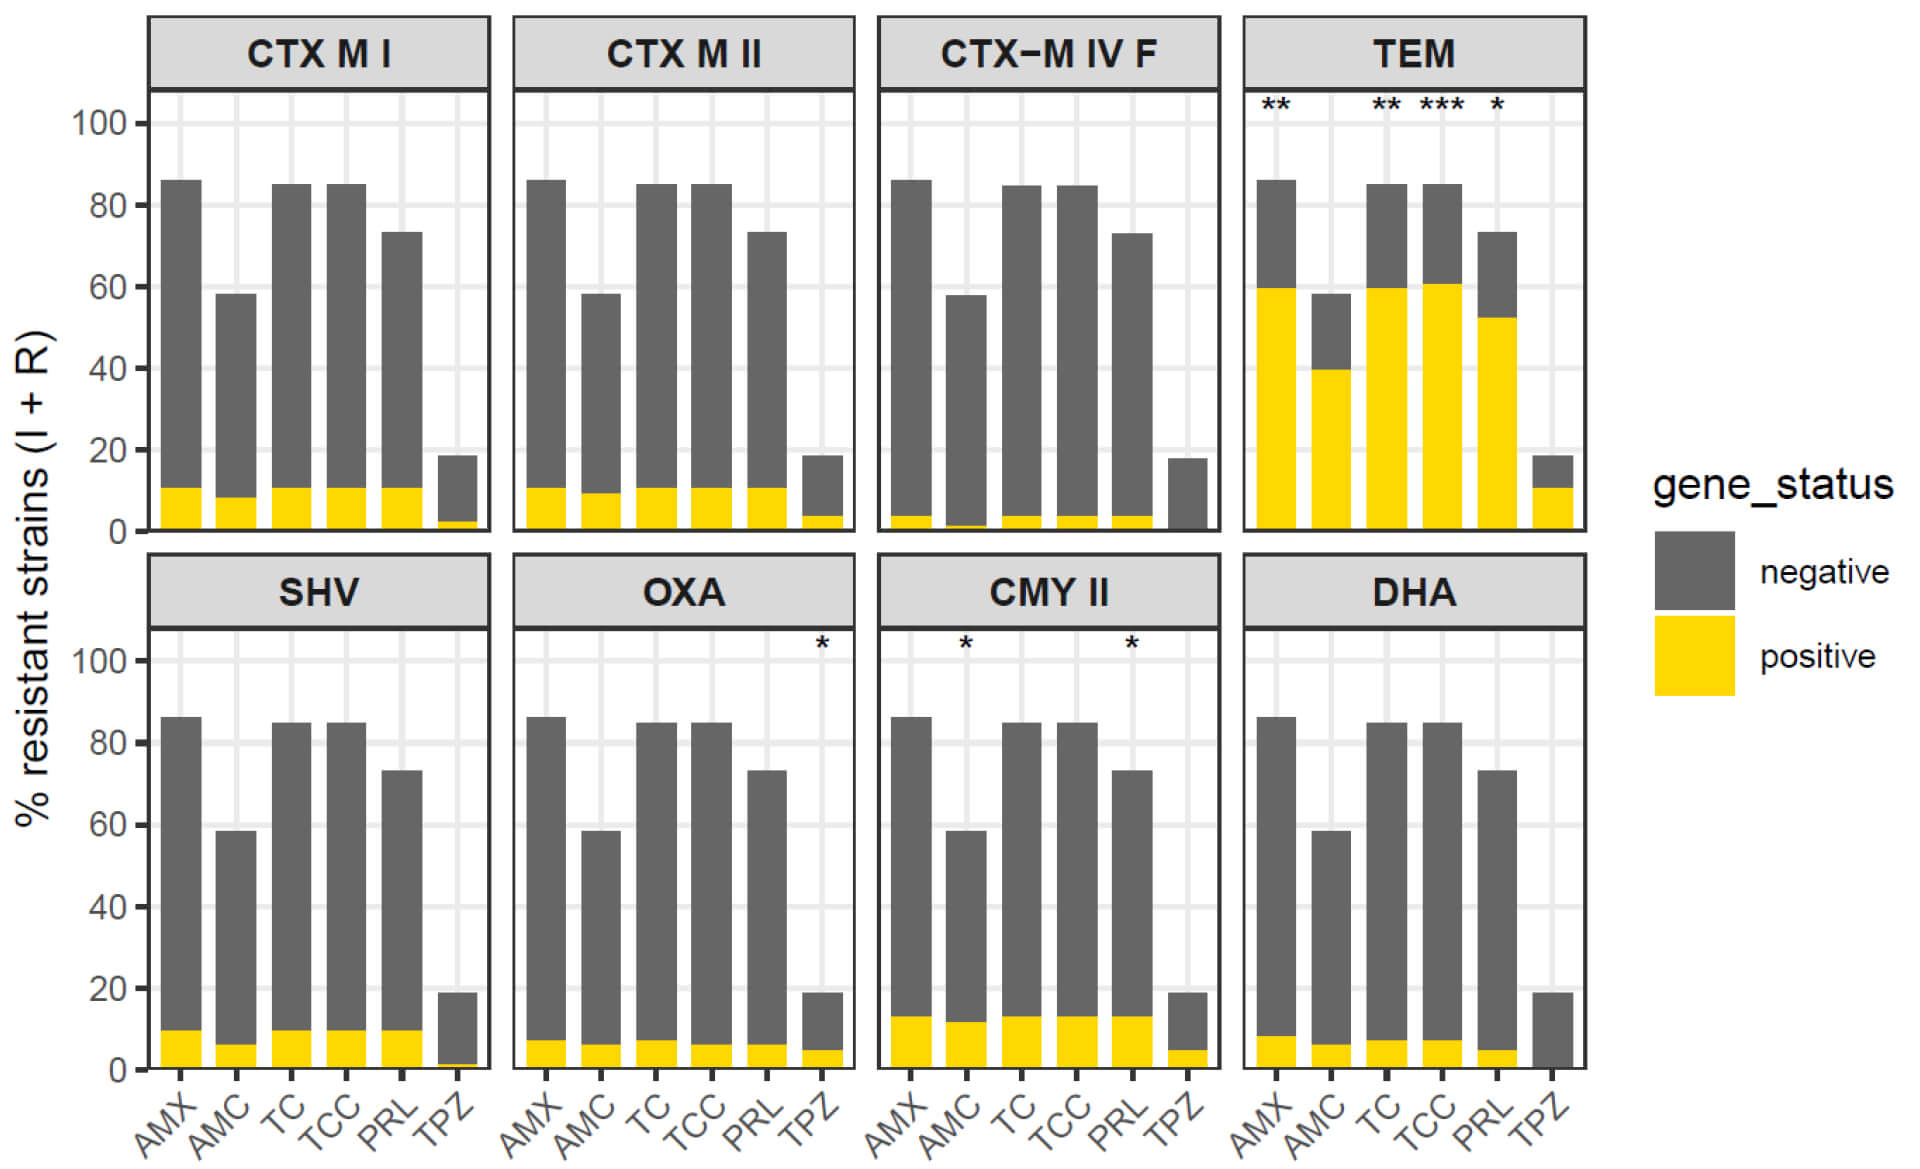 Fig. 1.
In contrast, blaCTX-M groups (I, II, IV) did not clearly discriminate
non-susceptibility levels for these
Overall, measurable genotype-associated phenotypic effects were mainly observed for blaTEM and blaCMY II (and to a lesser extent blaSHV), whereas blaCTX-M groups and blaDHA contributed less to between-group discrimination in this highly resistant cohort.
A total of 36.05% (31/86) of imipenem non-susceptible E. coli isolates carried at least one plasmid-mediated quinolone resistance (qnr) determinant. Within qnr-positive isolates, qnrB (18/86, 20.9%) was the most frequently detected variant, followed by qnrD (5/86, 5.8%), while qnrS (4/86, 4.7%), qnrA (3/86, 3.5%), and qnrC (1/86, 1.2%) occurred at lower frequencies (Table 3). Phylogroup B2 represented the main reservoir of qnr genes, particularly qnrB and qnrD, while the remaining phylogroups showed sporadic carriage. Co-occurrence of qnrB and qnrD was observed exclusively in B2 isolates.
As shown in Fig. 2, qnr gene carriage displayed a determinant-specific
association with quinolone non-susceptibility (I+R) to ciprofloxacin (CIP),
nalidixic acid (NA), and ofloxacin (OF). qnrB was significantly
associated with non-susceptibility to all three quinolones (Fisher’s exact test):
CIP (83.3% vs. 29.4%, p = 6.6
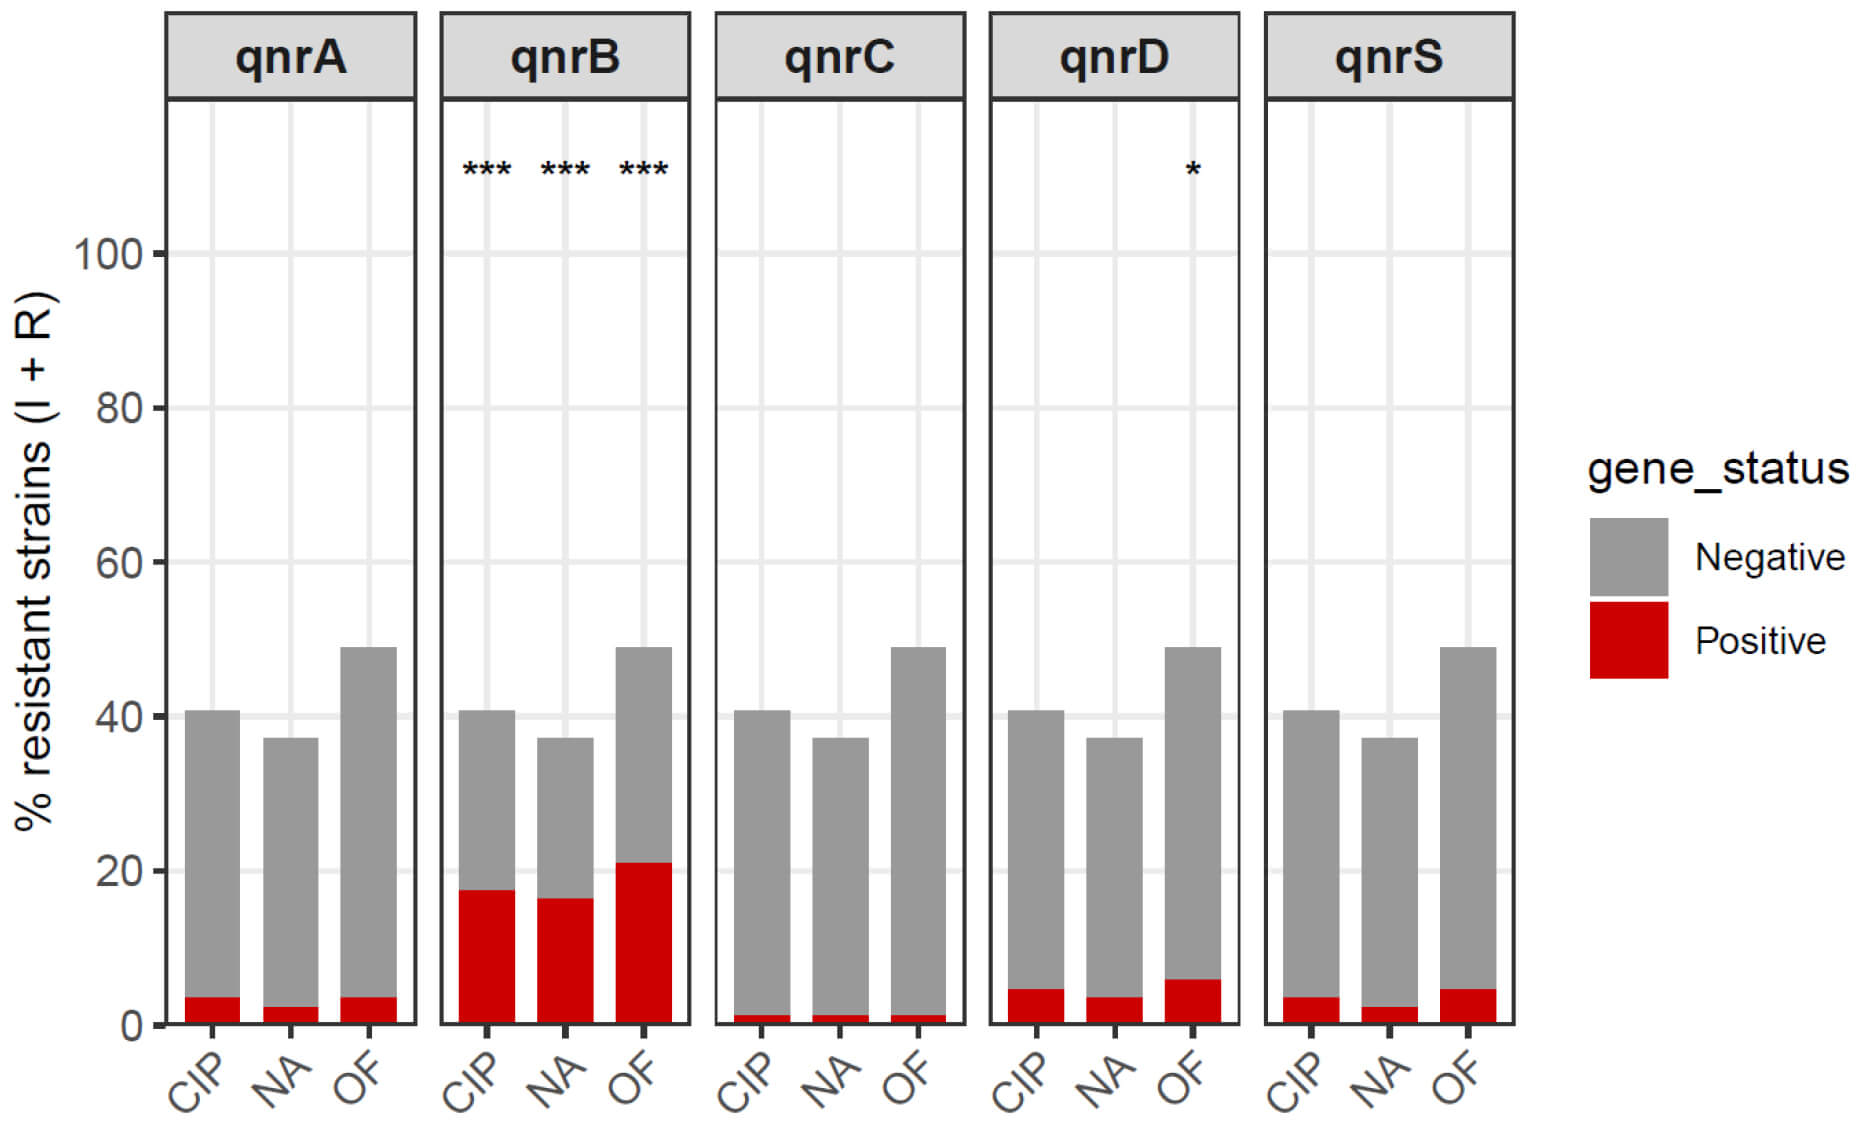 Fig. 2.
Quinolone non-susceptibility (I+R) according to qnr gene
carriage in imipenem non-susceptible E. coli. Bar plots show the
proportion of isolates classified as non-susceptible (intermediate + resistant)
to ciprofloxacin (CIP), nalidixic acid (NA), and ofloxacin (OF) among
qnr-negative (grey) and qnr-positive (red) groups, stratified by each determinant
(qnrA, qnrB, qnrC, qnrD, and qnrS). Differences between gene-positive and gene-negative groups were assessed using Fisher’s exact test; asterisks denote
statistically significant comparisons (*p
No statistically significant differences were detected for qnrA, qnrC,
or qnrS (all p
Pairwise gene–gene associations (presence/absence) between PMQR determinants
and
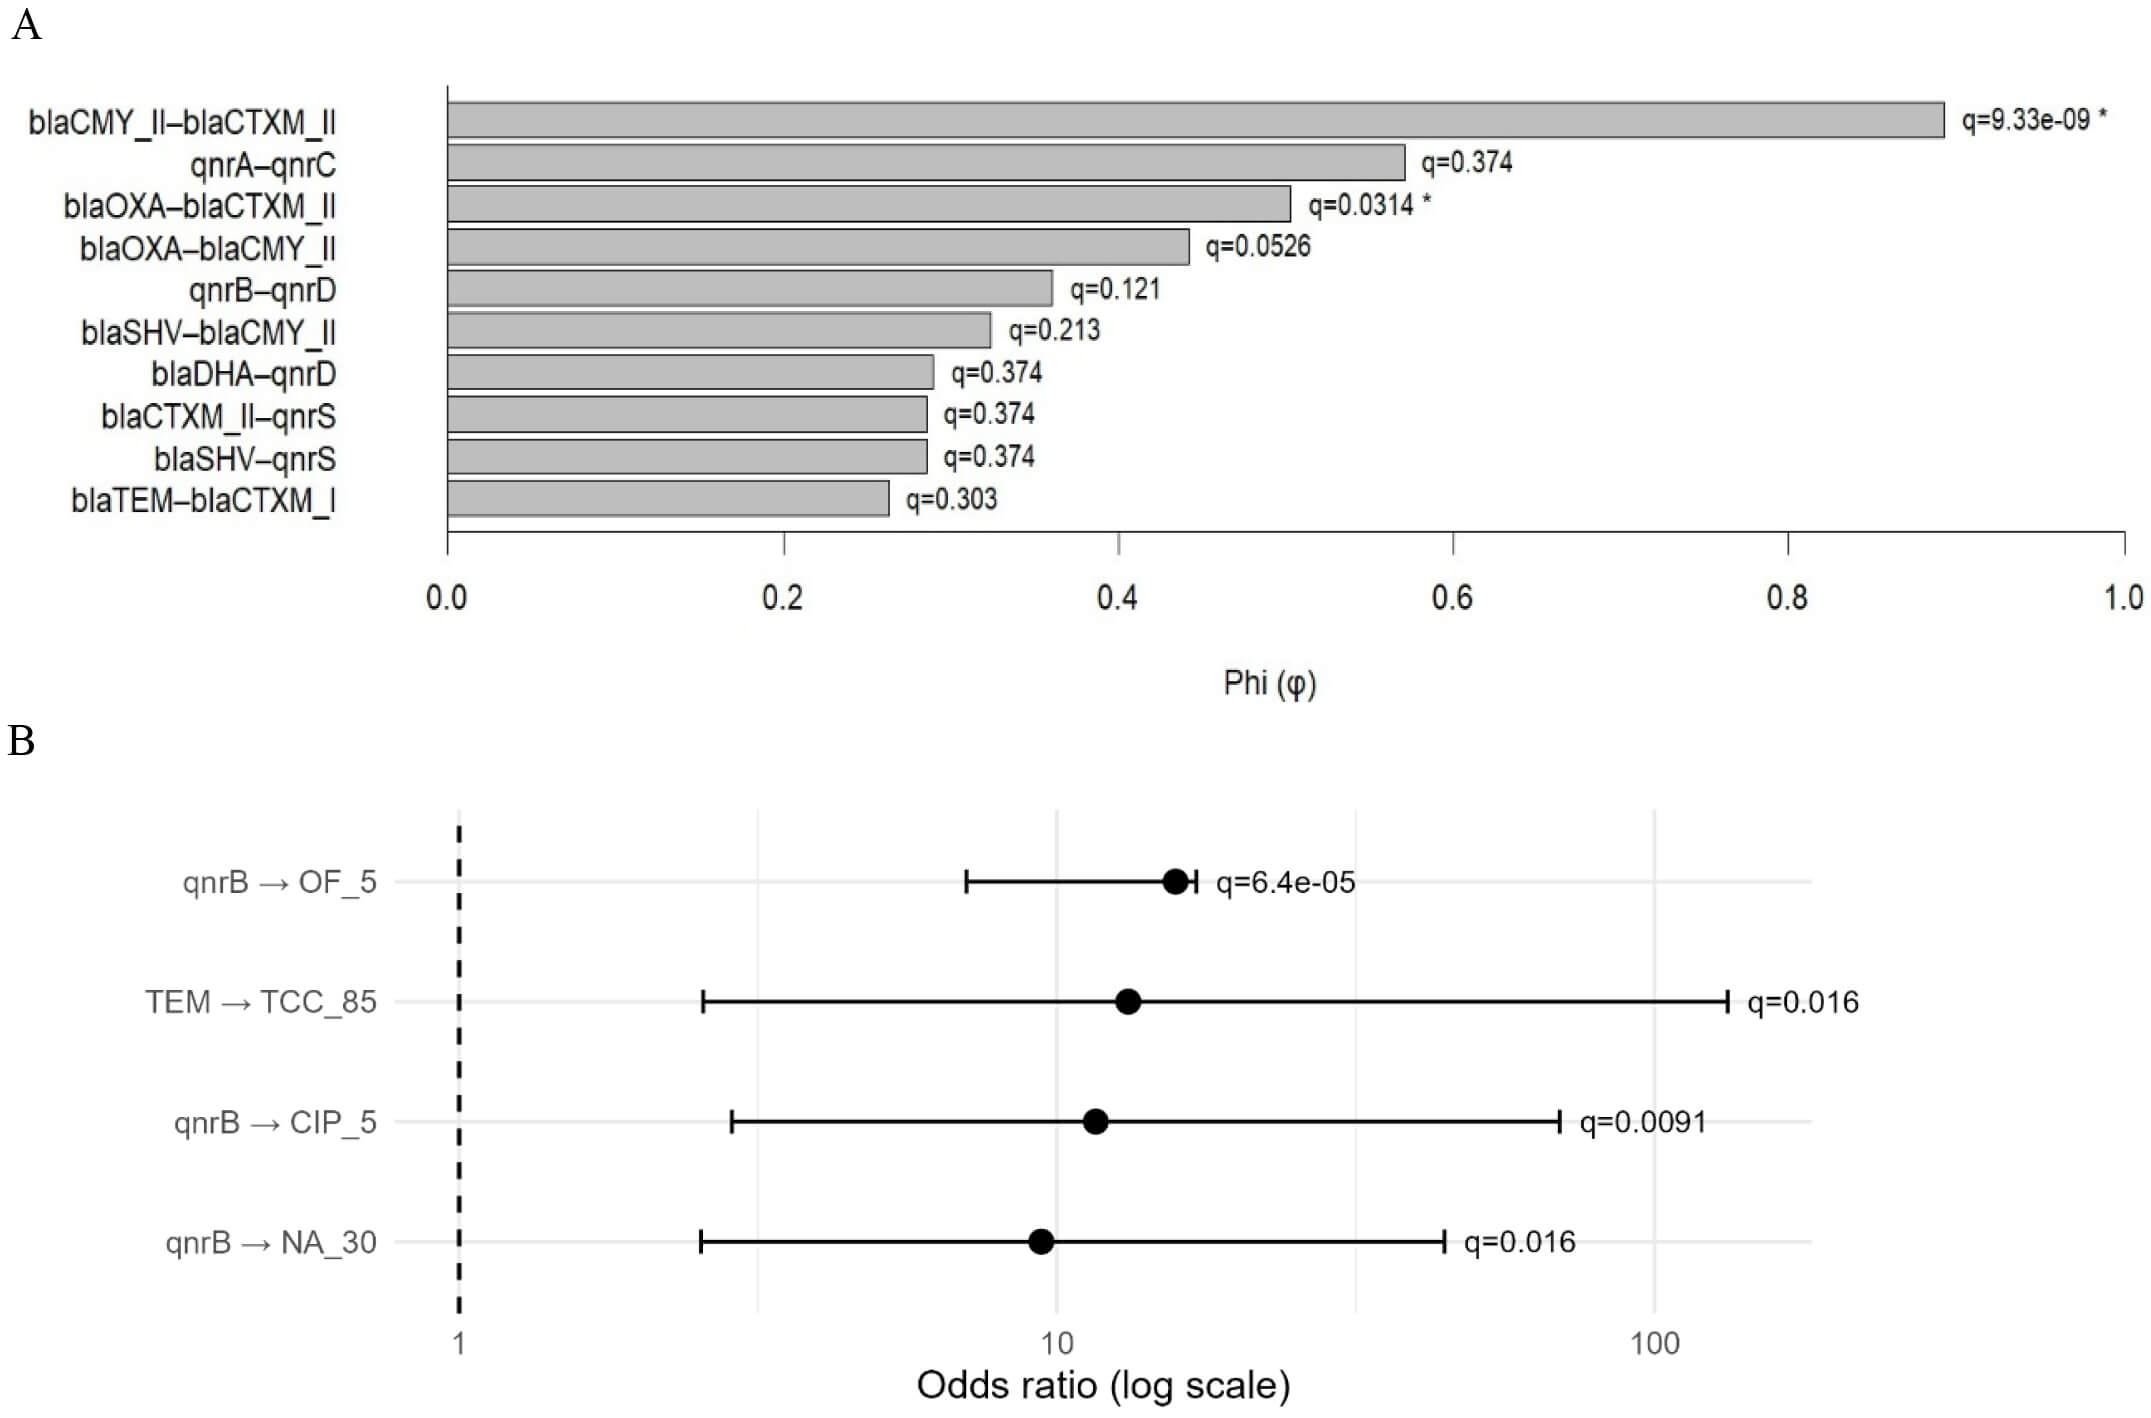 Fig. 3.
Associations between qnr determinants,
Gene–phenotype associations were assessed by testing gene carriage (0/1) versus
antimicrobial non-susceptibility (I+R vs S) using Fisher’s exact test, reporting
odds ratios (OR) with 95% confidence intervals and applying FDR correction (Fig. 3 and Supplementary Table 4). Among PMQR determinants, qnrB was
the only variant significantly associated with quinolone/fluoroquinolone
non-susceptibility, including ofloxacin (OR =
To investigate the global structure of antimicrobial resistance and its
relationship with ESBL production and biofilm formation, a principal component
analysis (PCA) was performed using antibiotic susceptibility variables,
resistance determinants, and the biofilm phenotype (Fig. 4). The first two
principal components explained 21.0% (Dim1) and 10.5% (Dim2) of the total
variance. Given the limited variance captured by the Dim1–Dim2 plane (31.5%),
the PCA was interpreted as an exploratory low-dimensional summary of multivariate
patterns. A trend toward separation between ESBL-negative and ESBL-positive
isolates was observed primarily along Dim1, suggesting that ESBL status and
closely related
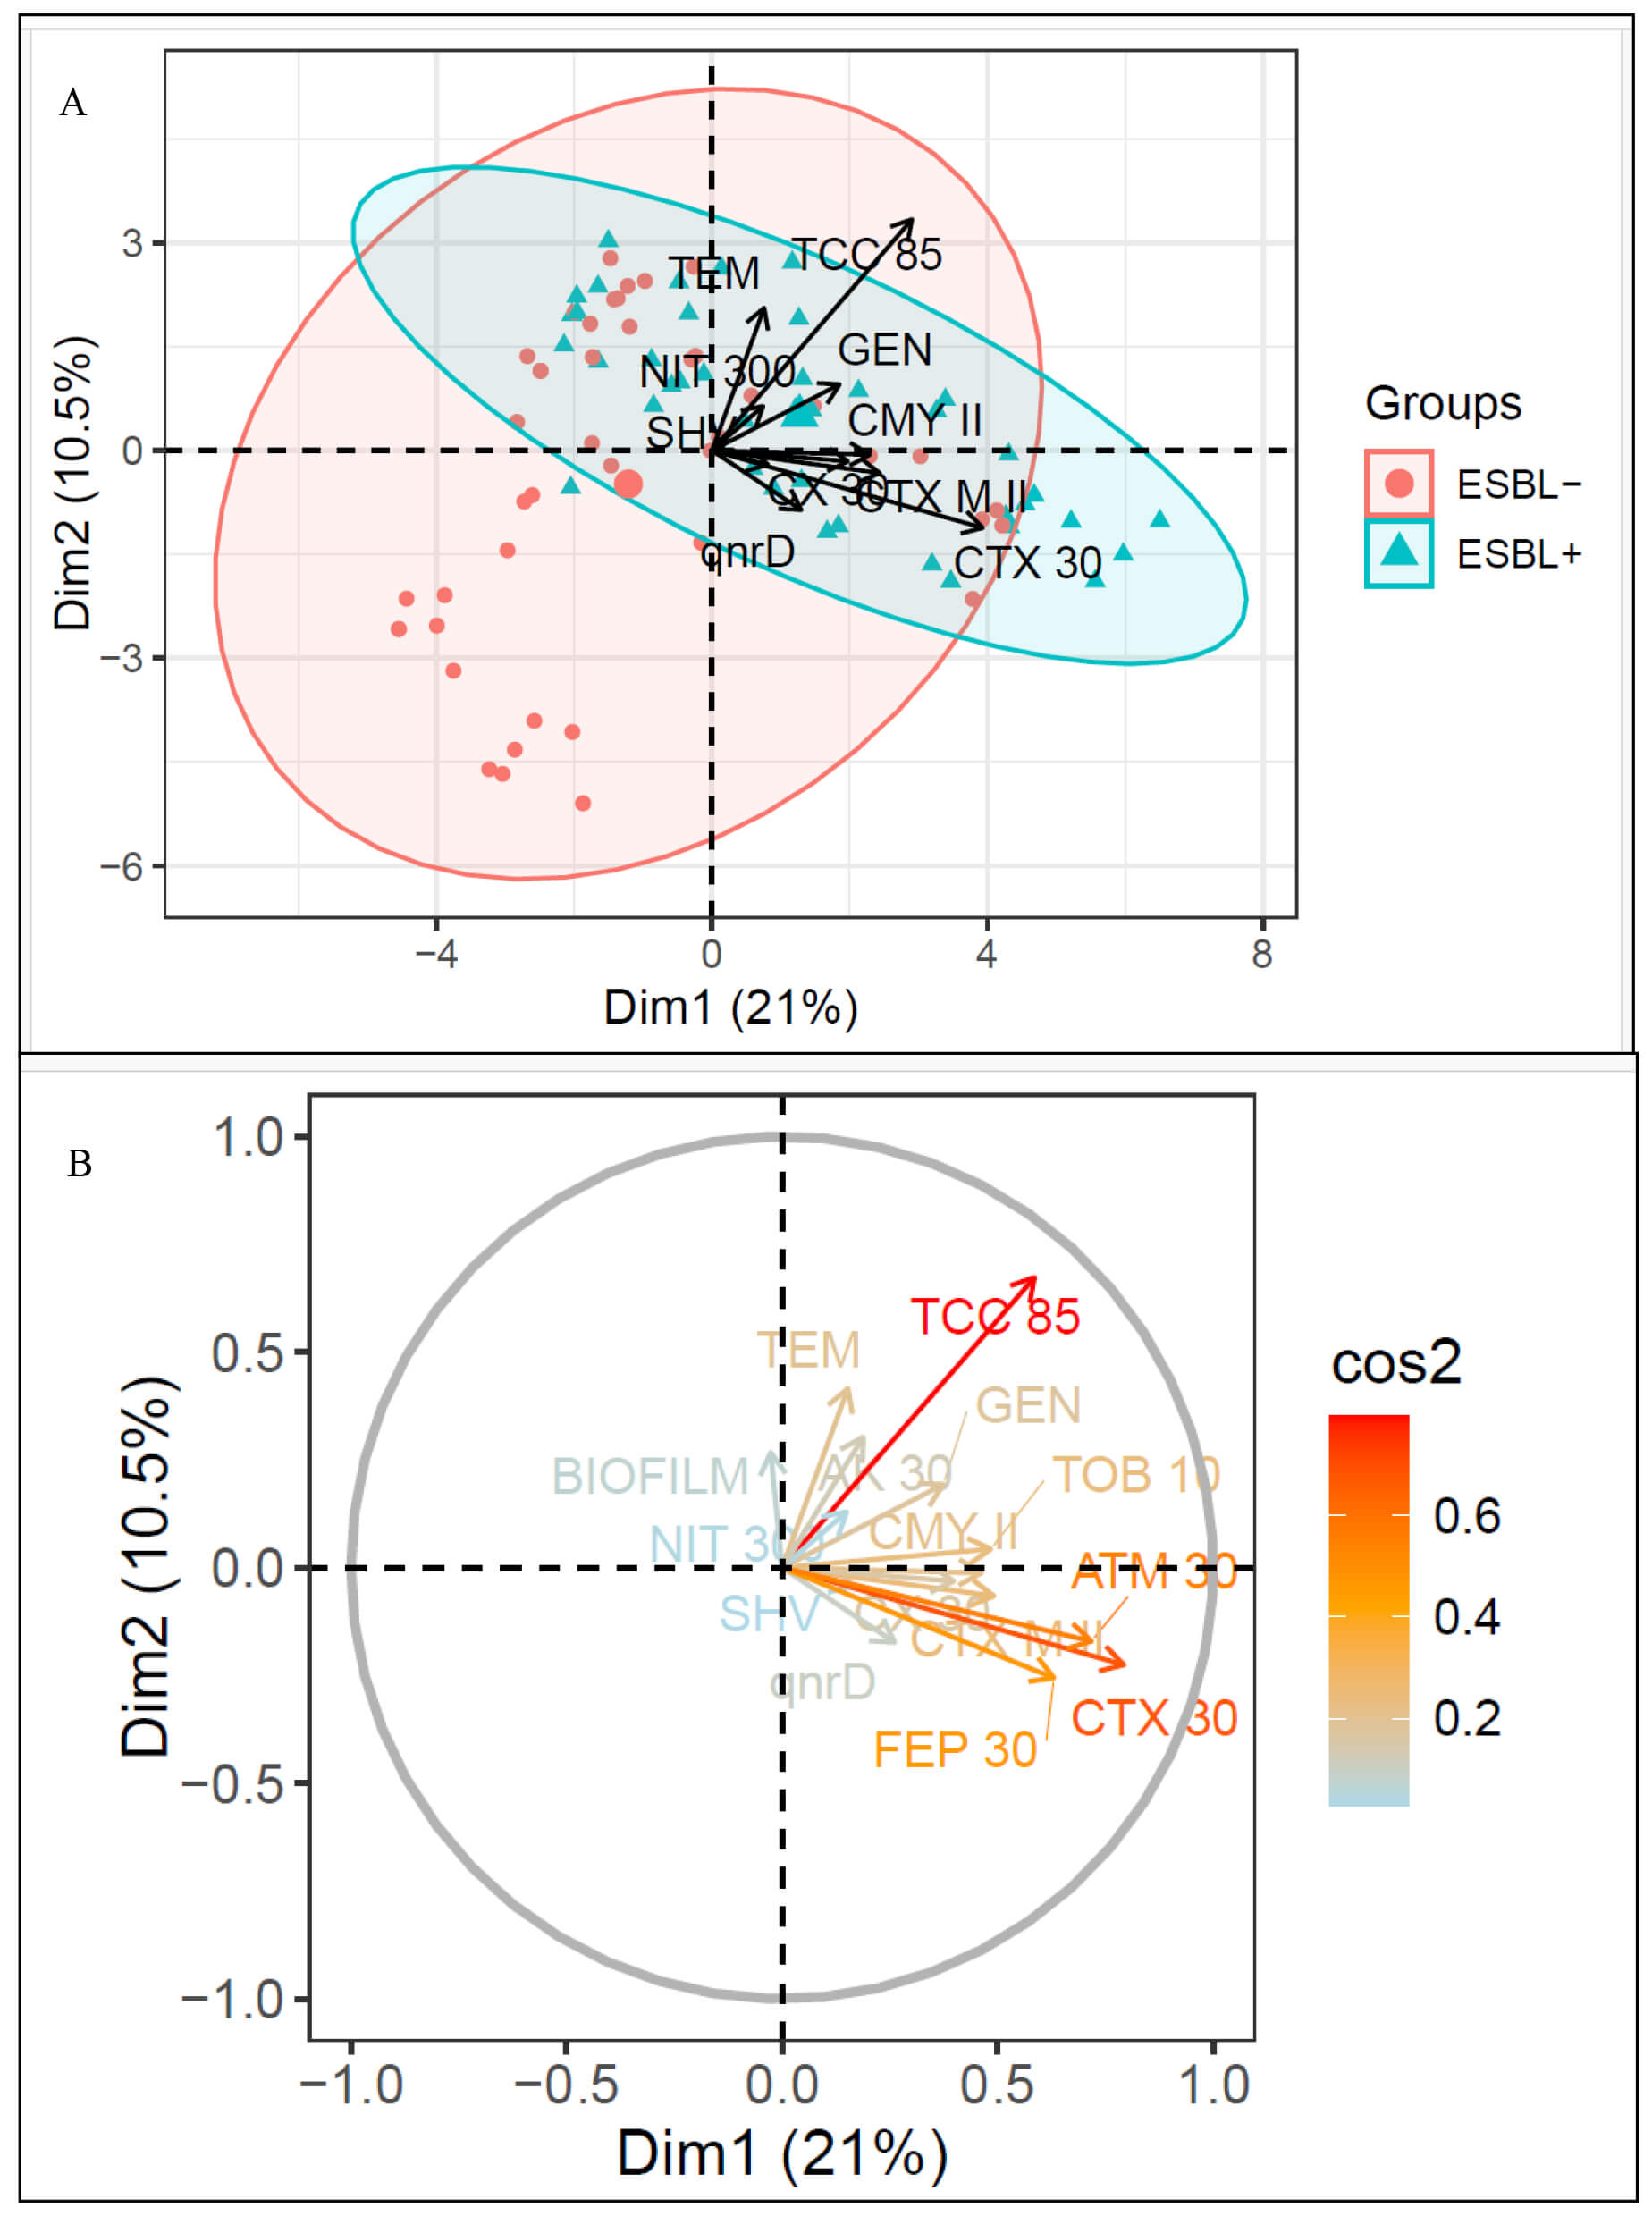 Fig. 4.
Multivariate structure of antibiotic resistance, ESBL status, and biofilm formation in imipenem non-susceptible UPEC. (A) PCA biplot showing the distribution of isolates by ESBL status, with separation occurring mainly along Dim1 (21.0% variance explained). (B) PCA correlation circle showing projection of resistance determinants, antibiotic non-susceptibility variables, and biofilm formation on the Dim1–Dim2 plane (Dim1 = 21.0%, Dim2 = 10.5%). The color gradient indicates the quality of representation (cos2), with higher values corresponding to better representation in the two-dimensional space. Variables with the highest cos2 values (including TCC 85, CTX 30, FEP 30, and ATM 30) align predominantly with Dim1 and contribute most to the multivariate structure, whereas biofilm formation and NIT 300 show lower cos2 and are less well represented on the Dim1–Dim2 plane.
The correlation circle (Fig. 4B) showed that
Direct comparisons across studies should be interpreted cautiously because
prevalence estimates vary by setting and inclusion criteria (e.g., community vs.
hospital cohorts and antimicrobial selection). Importantly, our cohort represents
a high-risk subset of UPEC (imipenem non-susceptible isolates) and was not
intended to estimate population-level gene prevalence in unselected UPEC.
Therefore, prevalence comparisons should be interpreted as descriptive within
this clinically relevant subset rather than as representative of overall UPEC
epidemiology in Algeria. In high-income settings,
ESBL/
Among
Phylogenetic analysis further indicated that phylogroup B2 harbored the broadest
repertoire of
The heterogeneity observed between phylogroups B2 and E may also reflect
differences in the underlying population structure of UPEC and in dissemination
dynamics. Phylogroup B2 is a hallmark ExPEC background and is often enriched in
virulence-associated traits that support urinary tract colonization and
persistence, which may increase opportunities for acquisition and long-term
maintenance of resistance plasmids under antimicrobial pressure [42, 43]. In
addition, successful clonal lineages frequently belonging to phylogroup B2 (e.g.,
globally disseminated MDR UPEC lineages) may contribute to the overrepresentation
of resistance determinants through clonal expansion and repeated antibiotic
exposure [44]. In contrast, phylogroup E is less consistently linked to classical
ExPEC virulence profiles, and its contribution to resistance in our collection
may be compatible with the expansion of specific resistant lineages and/or the
local circulation of particular mobile genetic elements within healthcare or
community networks [18, 45]. Therefore, the distribution of
The frequent co-occurrence of blaTEM with blaCTX-M group I within B2 isolates is compatible with co-carriage on mobile genetic elements and/or co-selection under antimicrobial pressure, which may facilitate the accumulation of multiple resistance determinants in successful UPEC lineages [12, 48, 49].
Regarding AmpC, cefoxitin non-susceptibility (presumptive AmpC screening) showed
only a non-significant enrichment of plasmid-mediated AmpC genes (blaCMY
II and/or blaDHA), consistent with the plasmid-borne nature and
variable distribution of blaCMY-type determinants [50]. Reduced
cefoxitin susceptibility may also involve additional mechanisms (e.g.,
permeability changes and/or co-existing
With respect to quinolone resistance, qnrB emerged as the most frequent
determinant among qnr-positive isolates, followed by qnrD,
whereas qnrA, qnrS, and especially qnrC were rare.
This pattern is consistent with reports from Algeria and other countries,
including Iraq, Togo, Nigeria, Iran and Tunisia [11, 52, 53, 54, 55]. In our collection,
qnr determinants were mainly detected in B2 isolates, in line with the
frequent linkage between ExPEC-associated backgrounds, virulence traits, and
multidrug resistance [42, 43, 47]. Importantly, after multiple-testing correction
qnrB was the only PMQR determinant retaining statistically supported associations
with quinolone/fluoroquinolone non-susceptibility, whereas blaTEM showed
the strongest
The persistence of quinolone resistance among qnr-negative isolates indicates that additional mechanisms contribute to the overall phenotype, most notably chromosomal alterations in the quinolone resistance–determining regions (QRDR) of gyrA and parC, potentially combined with efflux/porin changes and/or other plasmid-mediated determinants (e.g., aac(6)-Ib-cr′, qepA, oqxAB) [26, 53]. Although qnrB was associated with quinolone/fluoroquinolone non-susceptibility, substantial resistance was also observed among qnr-negative isolates; however, QRDR mutations were not investigated in this study, representing an important limitation [26, 56]. Therefore, in our collection, qnr genes should be interpreted as mobile resistance determinants that may modulate MICs and facilitate selection of chromosomal mutations rather than fully explaining the quinolone-resistant phenotype.
Several studies have described co-carriage of qnr genes with
Finally, although the present study is based on targeted molecular screening rather than whole-genome sequencing, our findings align with the broader evidence from genomic surveillance indicating that successful ExPEC/UPEC lineages can accumulate ESBL determinants—often dominated by blaCTX-M enzymes (including widely disseminated variants such as blaCTX-M-15)—together with plasmid-mediated quinolone resistance factors (e.g., qnr variants and aac(6)-Ib-cr′) on mobile genetic elements. This co-localization can promote co-selection under antibiotic pressure and accelerate the spread of multidrug-resistant UPEC, further limiting oral treatment options for UTIs. In addition, recent reports describing carbapenemase-producing UPEC strains carrying additional resistance determinants underscore the risk of increasingly difficult-to-treat lineages and reinforce the need for continued molecular surveillance and stewardship [67, 68, 69].
This study identified blaTEM as the predominant
These results should be interpreted in light of several limitations. The study was based on isolates collected from a single region and on a subset selected for imipenem non-susceptibility, which may limit generalizability and inflate resistance estimates compared with unselected UPEC populations. However, this targeted approach enabled us to focus on clinically relevant high-risk isolates that pose the greatest therapeutic challenge. In addition, information on prior antibiotic exposure was not systematically available, and carbapenemase production was not investigated, preventing a detailed characterization of carbapenem resistance mechanisms. Finally, PCR-based detection does not capture genetic context (e.g., plasmid vs. chromosomal location) or expression levels, and chromosomal mechanisms underlying quinolone resistance (e.g., QRDR mutations in gyrA/parC) were not assessed.Future studies including larger, geographically diverse cohorts, clinical metadata (including antibiotic histories), and expanded molecular characterization (e.g., plasmid profiling and/or sequencing) are warranted to better define dissemination routes and clinical impact of multidrug-resistant UPEC.
The datasets used and analyzed during the current study are available from the corresponding author on reasonable request.
AK, CM and ME performed the research, analyzed and interpreted the data. AK and CM wrote the draft of the manuscript. NB and RA designed the research study and supervised the study. All authors contributed to editorial changes in the manuscript. All authors read and approved the final manuscript. All authors have participated sufficiently in the work and agreed to be accountable for all aspects of the work.
The study was reviewed and approved by the Ethics and Deontology Committee of the University Ferhat Abbas Setif 1, under approval number UFAS1/09/03/2023/ETH-Deon-A-301 (title: Ethical Approval). A total of 86 urine samples were collected from participants enrolled in the study. Written informed consent was obtained from all subjects or their legal guardians prior to sample collection and for the publication of this work. The study was carried out in accordance with the guidelines of the Declaration of Helsinki.
We express our sincere gratitude to Professor Zerroug Mohamed Mihoub from the Laboratory of Applied Microbiology for his valuable assistance. We also extend our thanks to all researchers and study participants for their important contributions. Finally, we thank the peer reviewers for their thoughtful comments and constructive suggestions.
This research was partialy supported by the European Commission NextGenerationEU Project SUS-MIRRI.IT, “Strengthening the MIRRI Italian Research Infrastructure for Sustainable Bioscience and Bioeconomy”, code n. IR0000005PO. This research was supported by the European Commission NextGenerationEU, PNRR CN5 “National Biodiversity Future Center”, code n. CN00000033.
The authors declare no conflict of interest. Given her role as the Editorial Board member, Rosa Alduina had no involvement in the peer-review of this article and has no access to information regarding its peer review. Full responsibility for the editorial process for this article was delegated to Sung-Kun Kim.
Supplementary material associated with this article can be found, in the online version, at https://doi.org/10.31083/FBL48045.
References
Publisher’s Note: IMR Press stays neutral with regard to jurisdictional claims in published maps and institutional affiliations.