


1 Biochemistry Research Laboratory, Omsk State Pedagogical University, 644099 Omsk, Russia
Abstract
The metabolic profile of cancer includes changes in energy metabolism and biosynthetic (plastic) metabolism, and redox balance of tumor cells. This study aimed to identify clinically significant salivary metabolic features associated with breast cancer phenotypes.
This study included 660 patients with breast cancer (age 54.6 ± 12.7 years) and 127 healthy volunteers (49.3 ± 14.2 years). Saliva samples were collected from all participants, strictly before the initiation of treatment, and the biochemical composition of saliva was determined, including indicators of antioxidant system activity, lipid profile, cytokines, and free amino acids.
Salivary metabolic features correlated with the breast cancer phenotype. In particular, for luminal A breast cancer, which has the most favorable prognosis, the presence of an active inflammatory process in saliva (C-reactive protein +136.6%, p < 0.0001; IL-1β +317.7%, p = 0.0004) and a pronounced immune anti-inflammatory response (INF-γ +79.1%, p = 0.0004) were shown. In contrast, for triple-negative breast cancer, a low anti-inflammatory response (INF-γ –4.1%) and active cell proliferation (glutamine +45.0%, p = 0.0342) were shown, which correlated with the disease severity, low immunogenicity, and the least favorable prognosis for this subtype of breast cancer.
Overall, salivary composition reflects systemic metabolic changes in breast cancer, which makes it possible to construct a metabolic portrait of breast cancer across distinct phenotypes.
Keywords
- saliva
- breast cancer
- metabolic profile
- amino acids
- lipids
- cytokines
- antioxidant enzymes
- DNA damage
For decades, the focus of oncology has been on genetic mutations responsible for the initial development and progression of tumors [1]. However, as our understanding of molecular biology has deepened, it has become clear that disrupted metabolism play a key role in the functioning of tumor cells [2]. A key hallmark of malignancy is altered metabolic properties of cells [3]. These changes include dysregulation of glucose and amino acid utilization, activation of “new” pathways for nutrient acquisition, utilization of glycolytic and citric acid cycle intermediates for nicotinamide adenine dinucleotide phosphate biosynthesis, increased nitrogen requirements, changes in the regulation of metabolic genes, and metabolic interactions with the microenvironment [4]. Key metabolic changes include increased glycolysis instead of oxidative phosphorylation for energy production, higher rates of lipid synthesis to support rapid cell membrane formation, and increased levels of amino acids such as glutamine (Gln) for rapid growth and proliferation [5]. Overall, the metabolic profile of cancer includes changes in energy and plastic metabolism, and redox balance characteristic of tumor cells [6].
Tumor cell metabolism is a complex and flexible process with significant heterogeneity depending on various factors [7, 8]. Currently, attempts are being made to identify key targets of tumor cell energy homeostasis for therapeutic intervention to increase the life expectancy of patients [9]. Undoubtedly, this approach is a promising strategy for drug therapy of malignant tumors [10]. However, there are a number of problems that require solutions, in particular the general attitude towards cancer as a genetic disease without taking into account the metabolic consequences of these molecular genetic disorders, the presence of parallel pathways and the plasticity of tumor processes, inter- and intratumoral heterogeneity of metabolism, the possibility of switching metabolism in the absence of the necessary energy sources and biomaterial, the similarity of metabolic processes in tumor and healthy tissue, as well as the lack of an effective model for studying metabolic therapy [11].
Influencing the metabolic pathways of cancer cells not only inhibits their development but also improves existing treatments, including chemotherapy and immunotherapy [12, 13]. Moreover, since tumor metabolism is accompanied by specific biochemical changes, it can also be used for diagnosis, prognostic assessment, and monitoring of therapy outcome [14].
Breast cancer (BC) is one of the most common female cancers [15, 16]. The most important feature of the systemic action of BC is that the tumor is capable of inducing profound morphofunctional changes throughout the body [17, 18], which will also be reflected in changes in the salivary composition [19, 20, 21, 22, 23]. Evaluation of systemic changes in breast cancer can be carried out using saliva, which has not been demonstrated to date [24]. Saliva can also be used as a convenient and effective model for evaluating metabolic therapy. Understanding the diagnostic and prognostic value of metabolites is crucial for improving cancer detection and improving patient treatment outcomes. The integration of metabolomics into clinical practice contributes to the development of personalized medicine, providing individualized treatment based on individual metabolic profiles [25].
A hypothesis was formulated that all components of cancer cell metabolism, including changes in energy metabolism, biosynthesis, and regulation of metabolic processes, would be reflected in changes in the metabolic composition of saliva across different BC phenotypes. Particular attention was proposed to be paid to the use of glutamine and fatty acids as additional or alternative energy substrates to glucose (amino acids, proteins), high levels of lipid biosynthesis (lipids), increased production of reactive oxygen and nitrogen species and, consequently, permanent activation of antioxidant defense mechanisms (enzymes, lipoperoxides, NO, DNA damage), as well as the immune response (cytokines). A comprehensive study of these salivary parameters in a single patient cohort has not yet been conducted.
The aim of the study was to identify clinically significant metabolic salivary features depending on the BC phenotype.
The study involved 660 BC patients (age 54.6
| Feature | Breast cancer, n = 660 | |
| Clinical Stage | ||
| IA + IB | 226 (34.2%) | |
| IIA + IIB | 270 (40.9%) | |
| IIIA + IIIB + IIIC | 154 (23.3%) | |
| IV | 10 (1.6%) | |
| Lymph node status | ||
| N0 | 396 (60.0%) | |
| N1-3 | 243 (36.8%) | |
| Unknown | 21 (3.2%) | |
| Subtype | ||
| Luminal A | 228 (34.5%) | |
| Luminal B HER2-positive | 61 (9.2%) | |
| Luminal B HER2-negative | 197 (29.8%) | |
| Non-Luminal (HER2-enriched) | 52 (7.9%) | |
| Triple-negative breast cancer | 122 (18.5%) | |
| HER2 status | ||
| HER2(–)/HER2(+) | 547 (82.9%) | |
| HER2(+++) | 113 (17.1%) | |
| Estrogen (ER) status | ||
| ER(–) | 170 (25.8%) | |
| ER(+) | 490 (74.2%) | |
| Progesterone (PR) status | ||
| PR(–) | 246 (37.3%) | |
| PR(+) | 414 (62.7%) | |
| Degree of differentiation (G) | ||
| GI + GII | 432 (65.5%) | |
| GIII | 216 (32.7%) | |
| Unknown | 12 (1.8%) | |
| Ki-67 | ||
| 279 (42.3%) | ||
| 373 (56.5%) | ||
| Unknown | 8 (1.2%) | |
The BC group included patients aged 25–75 years, strictly prior to treatment with no signs of active infection or inflammatory processes in the oral cavity. Histological verification of the diagnosis was considered a prerequisite. Tumor tissue expression was determined for estrogen (ER) and progesterone (PR) receptors [26], human epidermal growth factor 2 (HER2) [27], and the Ki-67 proliferative activity index [28].
Saliva samples were collected once between 8 and 10 a.m. on an empty stomach by
spitting without stimulation into sterile 10 mL polypropylene screw-cap
centrifuge tubes for 15 minutes. Volunteers collected saliva after an overnight
fast. They were asked to abstain from alcohol for two days prior to sample
collection. From the moment they woke up until the saliva collection, volunteers
were asked to abstain from smoking, drinking water, and taking medications.
Immediately before collecting the saliva samples, volunteers rinsed their mouths
with water. Saliva samples of inadequate quality, including those with signs of
blood contamination, were excluded from the study. After centrifugation for 10
minutes at 10,000
The content of salivary cytokines IL-1
The content of free salivary amino acids (Ala, Arg, Asp, Cys, Gly, Gln, Glu, His, Leu+Ile, Lys, Met, Orn, Phe, Pro, Ser, Tyr, Thr, Val) was determined by high-performance liquid chromatography on a 1260 Infinity II chromatograph with a 6460 Triple Quad mass spectrometric detector (Agilent, Santa Clara, CA, USA). The correct identification of amino acids was verified using the “added-found” method to accurately compensate for matrix effects and variability in the ionization of analytes.
All methods used were adapted for saliva analysis, including aliquot selection and reagent volume adjustments. Concentrations were calculated using a calibration curve or control samples. The accuracy of the analysis, including the assessment of the effect of salivary enzyme activity on substrate levels, was verified using the “added-found” method.
Determination of protein (cat. No. B-8084), urea (cat. No. B-8074), gamma-glutamyl transferase (GGT, cat. No. B-8030) and total antioxidant activity (АОА, cat. No. B-7501) was carried out using ready-made commercial Vector-Best kits (Novosibirsk, Russia) using the semi-automatic biochemical analyzer StatFax 3300 (Awareness Technology, Palm City, FL, USA). Catalase activity was determined using a commercial Servicebio kit (cat. No. G4307-48T, Wuhan Servicebio Technology, Wuhan, China). Peroxidase activity was determined using a commercial Ecotech kit (Moscow, Russia). The intensity of nitric oxide synthesis was determined by capillary electrophoresis (KAPEL-105M, Lumex, St. Petersburg, Russia). The levels of lipid peroxidation products were determined spectrophotometrically using the Volchegorsky method (diene conjugates – DC, triene conjugates – TC, Schiff bases – SH, c.u.) [29].
The validation procedure for each test system included two analytical runs. Each run included the analysis of calibration standards to construct a calibration curve, as well as the required number of quality control samples with a specified concentration of the corresponding indicator. Each sample was analyzed in duplicate.
To determine salivary lipids, preliminary extraction of lipids was performed
with Folch solution (chloroform:ethanol = 2:1, vol.) according to the method
adapted by the authors, followed by analysis of the extracts by infrared (IR)
spectroscopy [30]. The intensity (H) of the absorption bands at 1396 cm-1
(
Statistical analysis was performed using Statistica 13.3 EN software (StatSoft,
Tulsa, OK, USA) by a nonparametric method after testing the distribution and
homogeneity of variances in groups using the Shapiro-Wilk and Bartlett tests.
Results are presented as median and interquartile range (Me [25%Q; 75%Q]). When
comparing more than two subgroups, a Bonferroni correction was used to adjust the
p-value: instead of adjusting the alpha significance level, each p-value
was multiplied by the number of tests, and the alpha significance level was left
unchanged (p
Salivation rates (mL/min) were calculated for all subjects to exclude the
influence of saliva viscosity on the measured parameters. No differences in
salivation rates were found between the BC and HC groups (p
Volunteers with BC and HC were recruited over a period of one year. Some analyses (biochemical parameters, enzyme activity) were performed immediately after collection without storage or freezing; for others (amino acids, cytokines, lipids), samples were frozen at –86 °C. Due to the limited sample size, it was not possible to perform all analyses on the entire sample. However, for each indicator, a subset was formed that included all BC phenotypes in equal proportions. Table 2 shows the complete list of indicators and the exact number of samples analyzed in each case.
| Indicators | Healthy control | Breast cancer | p-value | |
| Biochemistry | ||||
| Protein, g/L | 1.08 [0.65; 1.70], n = 127 | 0.64 [0.38; 1.04], n = 626 | ||
| Urea, mmol/L | 6.66 [4.36; 9.13], n = 127 | 9.63 [6.45; 13.23], n = 649 | ||
| 4.06 [3.83; 4.32], n = 127 | 4.23 [3.88; 4.76], n = 648 | |||
| NO, µmol/l | 22.8 [13.2; 36.8], n = 46 | 28.2 [18.2; 41.9], n = 234 | 0.0001* | |
| CAT, ncat/L | 4.58 [3.32; 5.79], n = 127 | 3.77 [2.56; 5.94], n = 642 | 0.0033* | |
| GGT, U/L | 20.4 [17.4; 24.4], n = 124 | 23.3 [20.0; 26.5], n = 623 | ||
| AOA, mmol/L | 1.78 [1.48; 2.28], n = 127 | 1.67 [1.41; 2.09], n = 113 | 0.6841 | |
| Peroxidase, c.u. | 1.08 [0.59; 2.14], n = 127 | 1.48 [0.92; 2.86], n = 79 | 0.4521 | |
| DC, c.u. | 2.68 [2.59; 2.80], n = 127 | 3.01 [2.72; 3.36], n = 342 | 0.0156* | |
| TC, c.u. | 1.45 [1.24; 1.52], n = 127 | 1.66 [1.44; 1.98], n = 342 | 0.0135* | |
| SB, c.u. | 0.724 [0.665; 0.898], n = 127 | 0.932 [0.835; 1.089], n = 342 | 0.0047* | |
| 8-OHdG, pg/mL | 188.4 [89.1; 309.1], n = 20 | 235.5 [156.3; 636.2], n = 110 | 0.0926 | |
| CRP, mU/mL | 0.153 [0.118; 0.212], n = 20 | 0.176 [0.122; 0.312], n = 110 | 0.2528 | |
| Cytokines | ||||
| VEGF, mU/mL | 496.1 [352.7; 1360.2], n = 59 | 1297.4 [586.7; 2119.5], n = 183 | 0.0028* | |
| IL-1 |
37.01 [11.78; 106.1], n = 59 | 124.8 [30.84; 305.4], n = 183 | 0.0007* | |
| IL-2, pg/mL | 1.98 [1.15; 6.71], n = 59 | 5.33 [2.54; 9.00], n = 183 | ||
| IL-4, pg/mL | 1.61 [1.03; 2.96], n = 59 | 2.49 [1.75; 4.04], n = 183 | ||
| IL-6, pg/mL | 4.39 [2.78; 6.63], n = 59 | 3.57 [2.22; 5.08], n = 183 | 0.1236 | |
| IL-8, pg/mL | 101.3 [22.73; 187.1], n = 59 | 68.30 [24.83; 141.3], n = 183 | 0.0966 | |
| IL-10, pg/mL | 2.25 [1.68; 3.48], n = 59 | 4.70 [3.30; 7.15], n = 183 | ||
| IL-18, pg/mL | 63.86 [22.50; 141.8], n = 59 | 67.05 [31.13; 132.9], n = 183 | 0.8218 | |
| INF- |
13.19 [12.55; 13.62], n = 45 | 14.89 [12.13; 23.19], n = 137 | 0.1351 | |
| INF- |
8.51 [7.19; 9.30], n = 45 | 10.35 [9.47; 12.46], n = 79 | 0.0009* | |
| Amino acids | ||||
| Ala, nmol/L | 83.82 [77.30; 133.5], n = 25 | 95.34 [73.80; 120.8], n = 116 | 0.5443 | |
| Arg, nmol/L | 21.68 [17.44; 29.43], n = 24 | 25.63 [15.41; 41.06], n = 113 | 0.4377 | |
| Asp, nmol/L | 12.42 [7.80; 21.79], n = 24 | 17.43 [10.01; 22.57], n = 112 | 0.0083* | |
| Cys, nmol/L | 2.18 [1.04; 3.57], n = 16 | 1.33 [0.59; 2.63], n = 82 | 0.1507 | |
| Glu, nmol/L | 59.18 [44.52; 80.64], n = 25 | 77.92 [50.94; 102.9], n = 116 | 0.0124* | |
| Gln, nmol/L | 438.76 [163.7; 638.4], n = 15 | 238.8 [104.8; 412.8], n = 39 | 0.0050* | |
| Gly, nmol/L | 186.95 [141.7; 305.6], n = 25 | 257.7 [163.7; 378.7], n = 116 | 0.0277* | |
| His, nmol/L | 66.12 [55.96; 96.48], n = 25 | 65.82 [57.38; 83.16], n = 116 | 0.2133 | |
| Leu + Ile, nmol/L | 37.21 [14.17; 68.03], n = 16 | 79.02 [34.42; 110.7], n = 104 | 0.0031* | |
| Lys, nmol/L | 31.00 [18.09; 56.83], n = 24 | 44.77 [28.28; 70.23], n = 145 | 0.0181* | |
| Met, nmol/L | 4.16 [1.85; 5.30], n = 25 | 4.97 [3.38; 7.12], n = 124 | 0.0286* | |
| Orn, nmol/L | 33.63 [20.45; 46.21], n = 25 | 50.21 [29.16; 87.71], n = 116 | 0.0003* | |
| Phe, nmol/L | 39.20 [30.79; 62.09], n = 23 | 54.49 [42.66; 66.64], n = 113 | ||
| Pro, nmol/L | 74.96 [63.51; 189.41], n = 25 | 122.4 [88.58; 172.6], n = 116 | 0.0007* | |
| Ser, nmol/L | 52.19 [40.09; 74.29], n = 25 | 58.51 [47.23; 72.63], n = 116 | 0.3901 | |
| Thr, nmol/L | 224.2 [192.5; 266.0], n = 10 | 193.0 [176.8; 229.9], n = 18 | 0.0441* | |
| Tyr, nmol/L | 94.85 [72.96; 170.0], n = 24 | 145.4 [100.9; 202.7], n = 112 | 0.0003* | |
| Val, nmol/L | 557.1 [289.6; 944.9], n = 23 | 709.0 [408.9; 1041.0], n = 107 | 0.5302 | |
| Lipids | ||||
| 1396 cm-1 | 1.19 [0.56; 2.17], n = 127 | 0.72 [0.53; 1.08], n = 322 | ||
| 1458 cm-1 | 3.37 [2.09; 4.57], n = 127 | 2.12 [1.70; 2.81], n = 322 | ||
| 2853 cm-1 | 7.07 [5.97; 10.00], n = 127 | 6.37 [4.81; 8.51], n = 322 | ||
| 2923 cm-1 | 12.30 [10.30; 16.56], n = 127 | 10.81 [8.19; 13.92], n = 322 | ||
| 2957 cm-1 | 2.53 [2.13; 3.43], n = 127 | 2.08 [1.72; 2.50], n = 322 | ||
| 1458/1396 cm-1 | 4.72 [3.88; 5.57], n = 127 | 4.82 [4.20; 5.87], n = 322 | 0.0039* | |
| 2923/2957 cm-1 | 2.42 [1.96; 4.04], n = 127 | 3.08 [2.48; 3.66], n = 322 | 0.0047* | |
Note: * Differences between subgroups are statistically significant, p
In BC, the salivary metabolic features consisted of a predominance of catabolic
processes (protein –40.7%, p
It was shown that in BC, the content of VEGF (+161.5%, p = 0.0028),
proinflammatory (IL-1
In BC, lipid metabolism was disrupted, in particular, the intensity of lipid
absorption bands in the IR spectra decreased relative to the HC: 1396 cm-1
(–39.5%, p
To understand which of the salivary indicators listed in Table 2 have the
greatest impact on the formation of the salivary metabolic profile in BC, a
principal component analysis was performed (Fig. 1). The separation of the BC and
HC subgroups in the factor diagram was shown to be statistically significant
(Fig. 1A, p
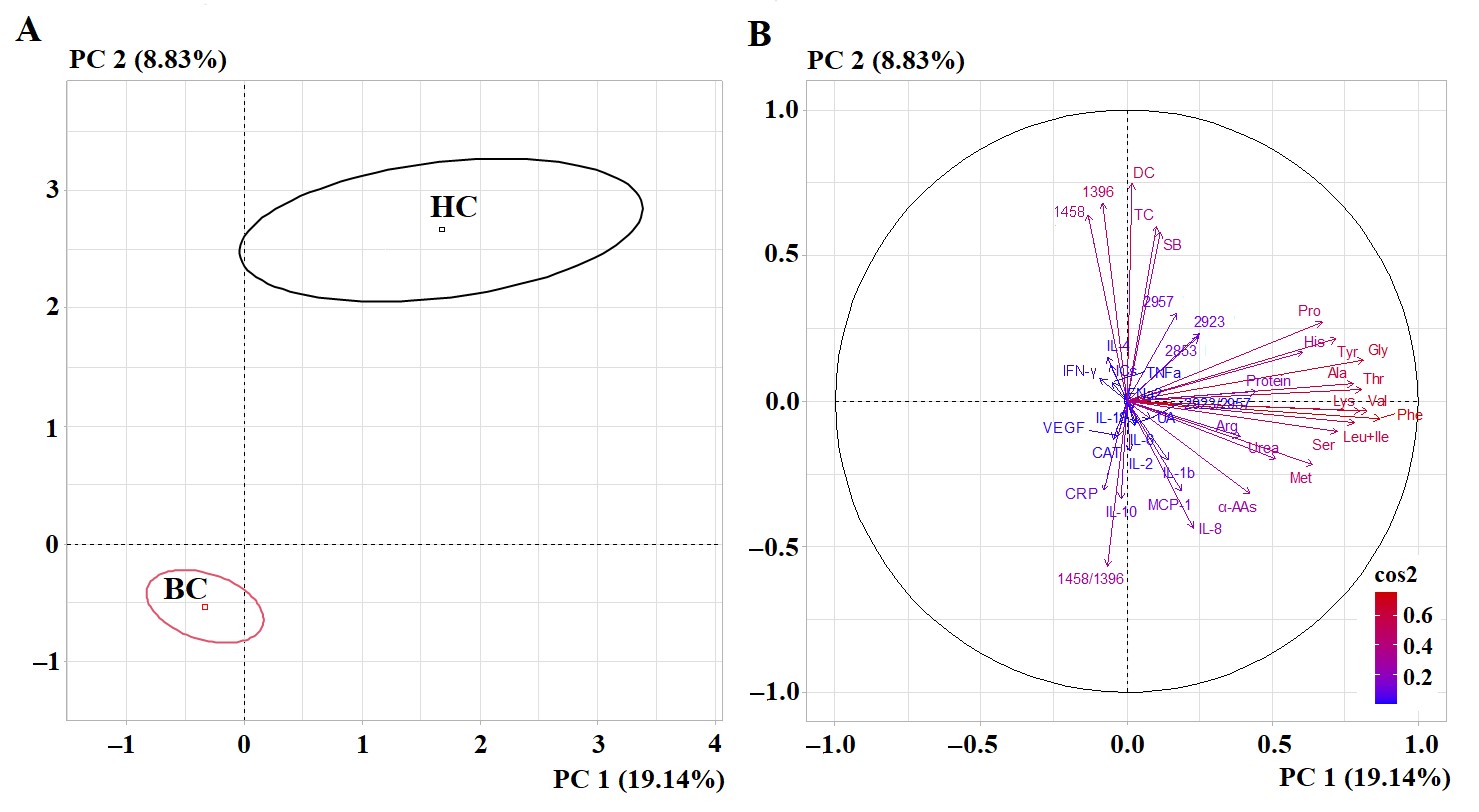 Fig. 1.
PCA factorial diagram (A) and correlation circle (B) for
comparison of BC and HC groups (p = 6.22
Salivary metabolism characteristics depended on the BC stage. Thus, patients
with stages I and II, as well as stages III and IV, had similar metabolic
characteristics of saliva. In the early stages of BC, an increase of angiogenesis
markers (VEGF +181.7%, p = 0.0028; IL-1
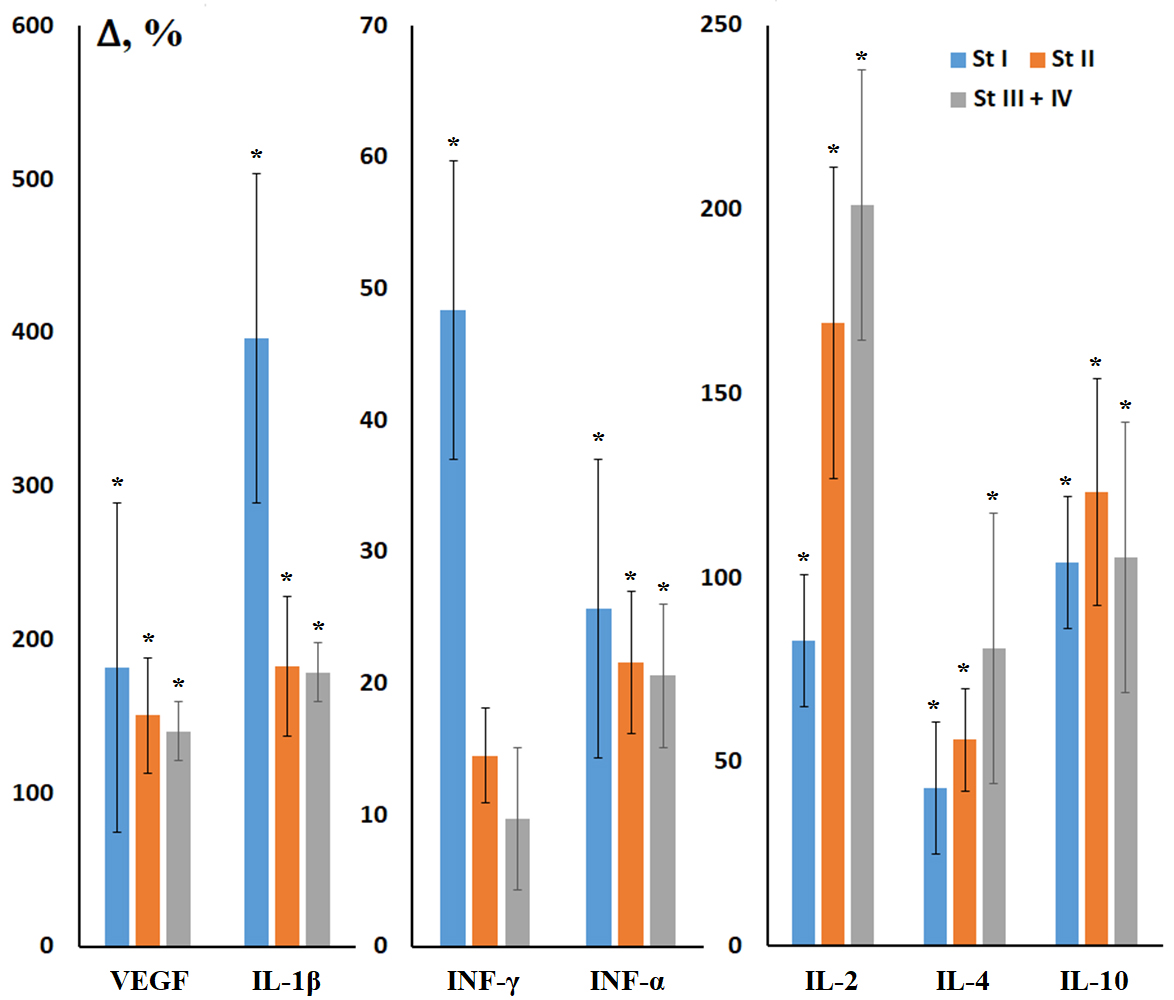 Fig. 2.
Relative concentrations of salivary cytokines in BC depending on
stage. VEGF, vascular endothelial growth factor; IL, interleukin; INF,
interferon. Here and throughout Figs. 3,4,5,6,7,8,9, relative concentration is
calculated as the concentration in the study group minus the concentration in the
HC group, divided by the concentration in the HC group, expressed as %. *
Differences from HC are statistically significant, p
Amino acids with statistically significant differences compared to the HC differed between early and advanced stages. For example, for early stages, the concentration of Gln (–60.5%, p = 0.0155) and Glu (+33.2%, p = 0.0280) in saliva changed, which characterizes glutamine-dependent growth of BC cells. For advanced stages, the concentration of Leu + Ile (+137.8, p = 0.0204) and Phe (+45.9%, p = 0.0352) increased, which characterizes active protein synthesis, contributing to the progression of BC (Fig. 3).
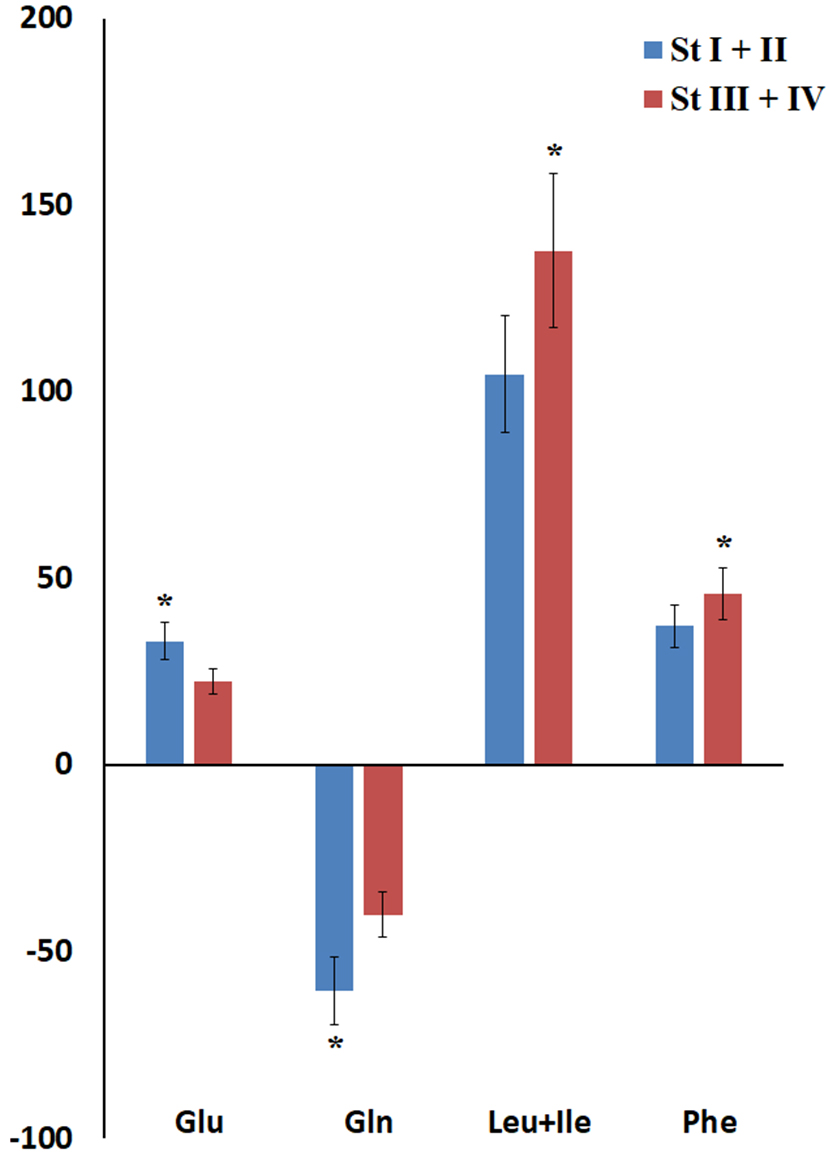 Fig. 3.
Relative amino acid content in saliva in BC depending on stage. * Differences from HC are statistically significant, p
No statistically significant differences were shown in the concentrations of
individual salivary amino acids depending on the expression status of hormonal
receptors (ER and PR, p
Differences in salivary concentrations of Asp (+24.5%, p = 0.0326), Leu + Ile (+33.1%, p = 0.0237), Orn (+50.6%, p = 0.0188) and Phe (+10.2%, p = 0.0393) were observed between HER2-negative and HER2-positive subgroups. In the HER2-positive BC group, concentrations of the following amino acids were increased compared to HC: Asp (+65.5%, p = 0.0327), Gly (+60.1%, p = 0.0261), His (+15.9%, p = 0.0029), Leu+Ile (+155.2%, p = 0.0140), Orn (+103.0%, p = 0.0006), Phe (+47.2%, p = 0.0275), Pro (+81.1%, p = 0.0394), and Tyr (+70.2%, p = 0.0231). Only for Gln a decrease in concentration in saliva by 41.9% was found compared to the HC.
For Ki-67, differences in the salivary concentration of two amino acids were revealed: the Asp concentration increased with high Ki-67 (+111.2%, p = 0.0143), while the Glu content decreased (–20.7%, p = 0.0052). At low Ki-67, compared to HC, the Gln content decreased the most (–67.5%, p = 0.0234), while the Pro (+70.6%, p = 0.0445) and Tyr (+57.0%, p = 0.0088) content increased. Overall, differences between subgroups with different proliferative activity indices were virtually insignificant according to the results of principal component analysis (p = 0.6092).
The luminal B HER2-positive BC subtype showed the greatest difference in amino acid profile (Fig. 4, Ref. [31]).
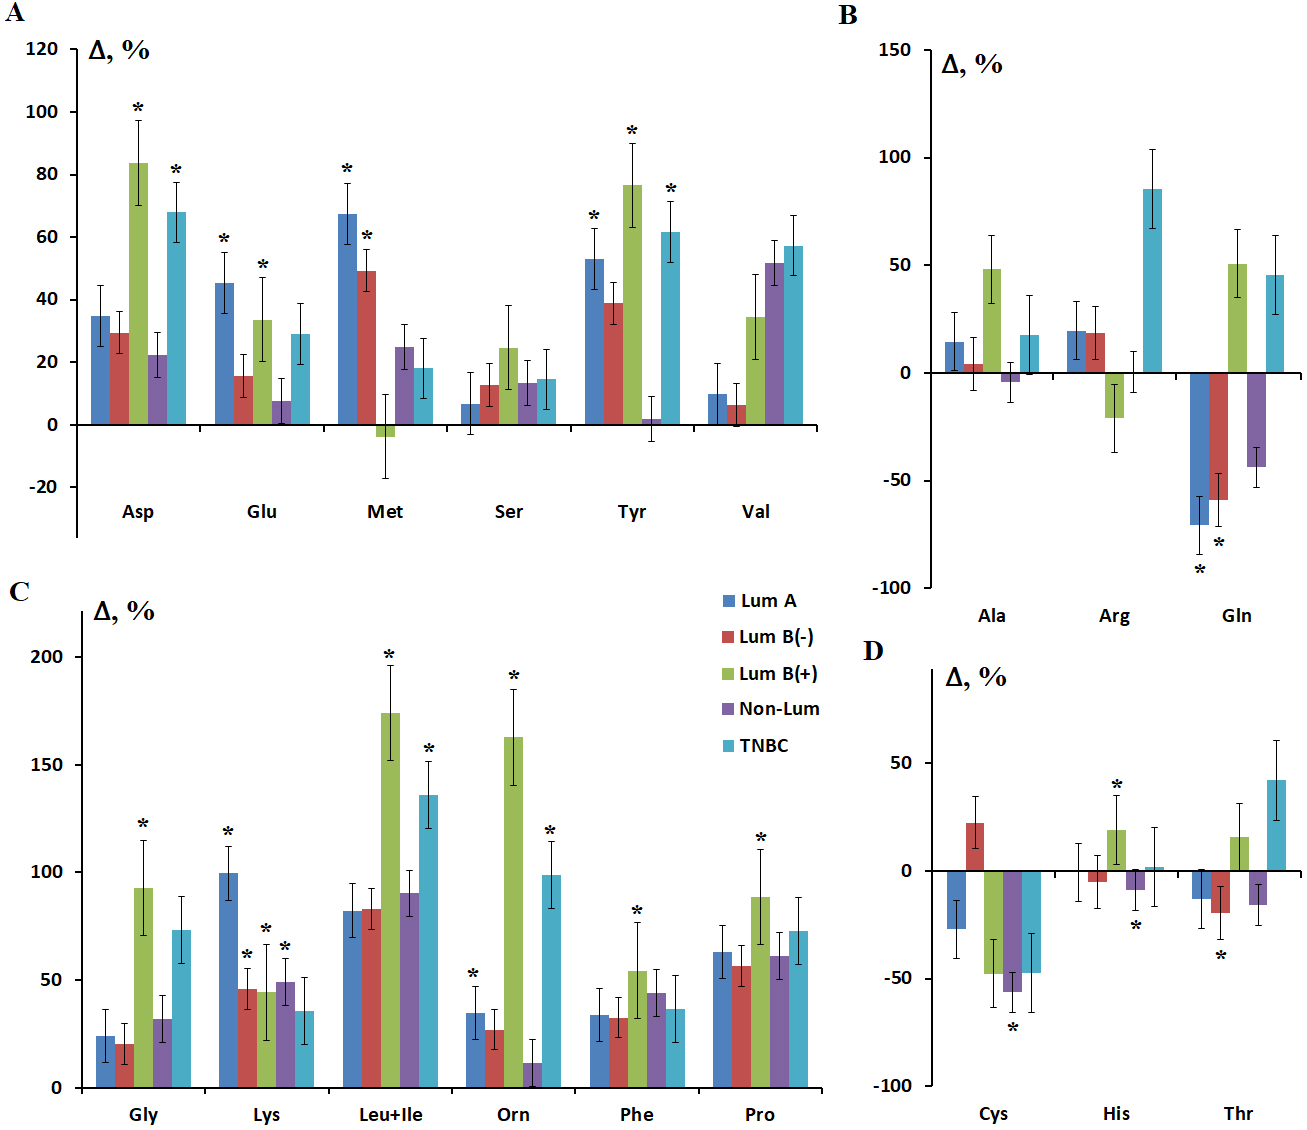 Fig. 4.
Relative salivary amino acid concentrations depending on the BC
phenotype. (A) Asp, Glu, Met, Ser, Tyr and Val. (B) Ala, Arg and Gln. (C) Gly,
Lys, Leu+Ile, Orn, Phe and Pro. (D) Cys, His and Thr. Here and throughout Figs.
3,4,5,6,7,8, Lum A, luminal A; Lum B(–), luminal B HER2-negative; Lum B(+),
luminal B HER2-positive; Non-Lum, Non-Luminal; TNBC, triple negative breast
cancer. Results on the salivary levels of Asp, Gln, Gly, His, Leu+Ile, Orn, Phe,
Pro, and Tyr in different BC phenotypes have been partially published in a
previous study [31]. * Differences from HC are statistically significant,
p
Differences were found between luminal B HER2-positive and negative BC subtypes in the concentrations of His (p = 0.0154), Phe (p = 0.0114), and Tyr (p = 0.0059). Moreover, salivary amino acids concentrations were higher in HER2-positive BC. Differences between luminal B HER2-positive and non-luminal BC were found in the concentrations of Cit (p = 0.0318), His (p = 0.0192), and Tyr (p = 0.0055) in saliva.
Principal component analysis showed that HER2-positive and triple-negative BC
(TNBC) differed most in their salivary amino acid profiles from other breast
cancer phenotypes (p
In the next step, we compared the characteristics of lipid absorption bands for
individual molecular biological subtypes of BC (Fig. 5). Statistically
significant differences with HC were shown for the absorbance at 1396 and 1458
cm-1 for all BC phenotypes except non-luminal (р
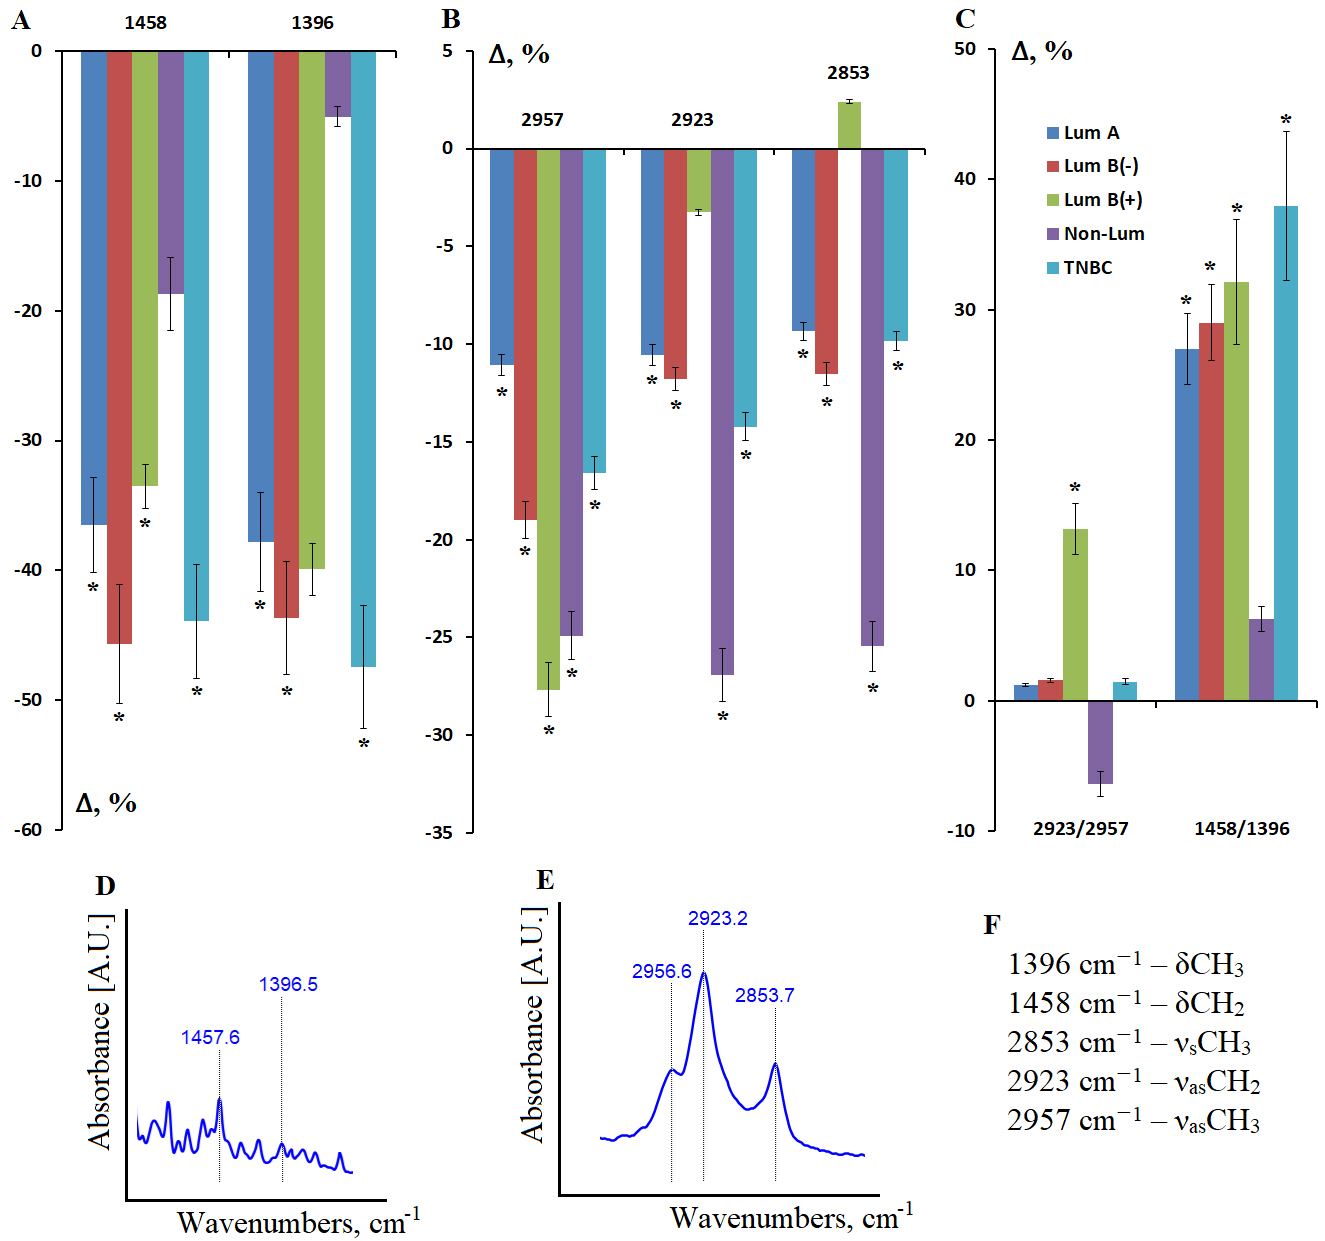 Fig. 5.
Relative intensity of absorption bands in the IR spectra of
saliva lipid extract in different BC phenotypes. (A) Absorption bands of
deformation vibrations of methyl and methylene groups in the lipid structure; (B)
Absorption bands of stretching vibrations of methyl and methylene groups in the
lipid structure; (C) Intensity ratio of the absorption bands at 2923/2957
cm-1 and 1458/1396 cm-1; (D) Absorption bands at 1396 and 1458
cm-1; (E) Absorption bands at 2853, 2923 and 2957 cm-1; (F)
Interpretation of the absorption bands in the IR spectra of saliva lipid extract.
* Differences from HC are statistically significant, p
The intensity ratios of the 2923/2957 and 1458/1396 cm-1 absorption bands differed between non-luminal and luminal B HER2-positive BC (Fig. 5C). Thus, the non-luminal BC subgroup exhibited the greatest differences in lipid metabolism, as only this subgroup exhibited a decreased 2923/2957-ratio, indicating an increased proportion of more branched lipids in saliva compared to HC (Fig. 5C).
In the saliva of HC, the 8-OHdG concentration was 188.3 [89.07; 309.1] pg/mL. In BC, the 8-OHdG content increased to 235.5 [156.3; 636.2] pg/mL, but this increase was not statistically significant (p = 0.0926). However, the 8-OHdG concentration significantly depended on the BC phenotype. Thus, the 8-OHdG concentration in saliva significantly increased in non-luminal BC compared to the HC (p = 0.0167) (Fig. 6A).
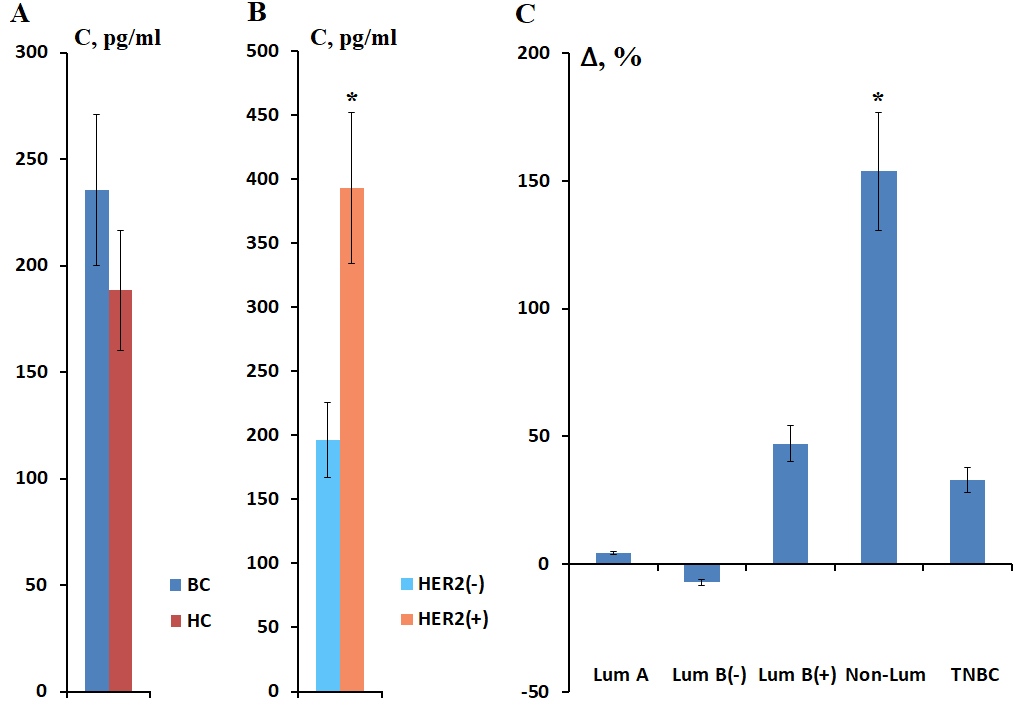 Fig. 6.
Salivary 8-OHdG concentration in BC compared to healthy controls
(A), depending on HER2 expression (B). Relative 8-OHdG concentration depending on
BC phenotype compared to healthy controls (C). * Differences from HC are
statistically significant, p
Next, we analyzed the concentration of 8-OHdG in saliva depending on the HER2 status (Fig. 6B). It was found that in the presence of HER2 receptor expression, the salivary concentration of 8-OHdG was significantly higher (393.3 [222.2; 790.8] pg/mL) than in the absence of HER2 receptors (196.4 [135.7; 337.2] pg/mL) (p = 0.0127). Differences from the HC were statistically significant only for the HER2-positive BC subgroup (p = 0.0139).
It was shown that the salivary concentration of 8-OHdG increased in HER2-positive BC subtypes and TNBC (Fig. 6C). The maximum increase in concentration corresponded to the non-luminal BC - 477.7 [222.2; 1454.6] pg/mL (Fig. 6C).
It was shown that IL-1
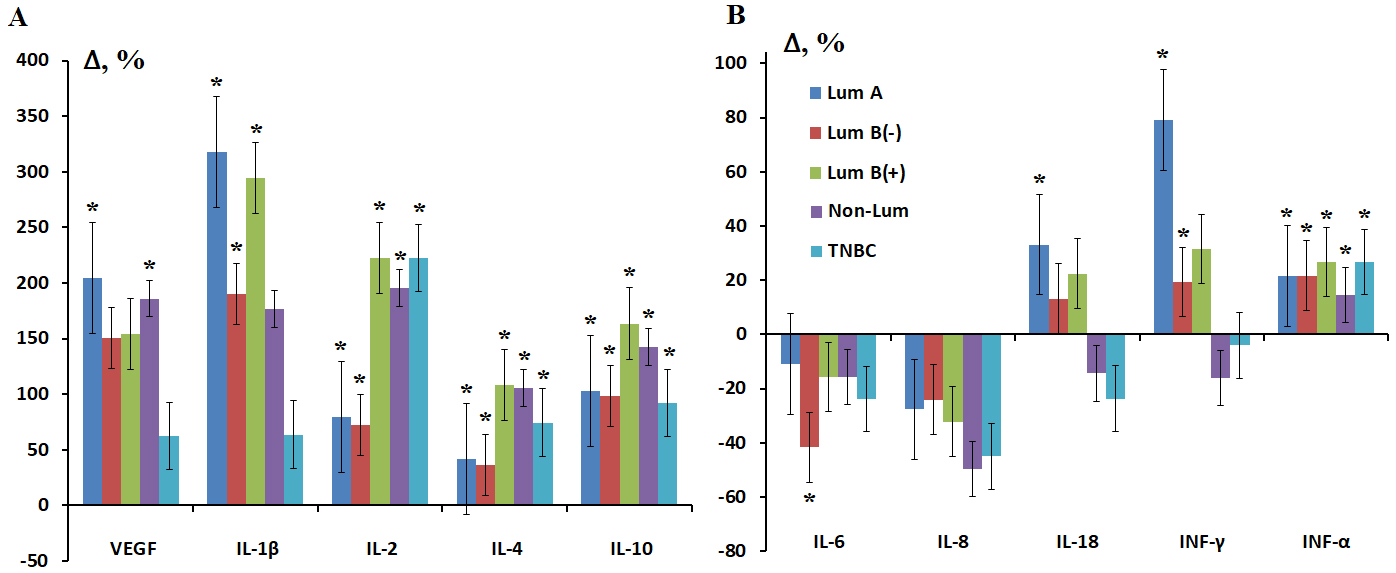 Fig. 7.
Relative concentration of salivary cytokines in different
molecular biological subtypes of BC. (A) VEGF, IL-1
The most pronounced differences between BC subtypes were for INF-
The patterns of salivary cytokine concentrations were similar for luminal HER2-positive and non-luminal subtypes (HER2-enriched) and for luminal A and B HER2-negative subtypes, whereas specific patterns were identified for TNBC.
A decrease in salivary catalase activity was observed for all BC phenotypes, with the greatest decrease being observed for estrogen-hormone positive subtypes (–11.4%, –21.6%, and –14.1% for luminal A, B HER2-negative, and B HER2-positive subtypes, respectively) (Fig. 8A). Salivary antioxidant activity also decreased, but in this case the greatest decrease was observed for estrogen-hormone negative subtypes (–9.3% and –10.7% for non-luminal and TNBC, respectively) (Fig. 8A). Increased antioxidant activity (+15.3%) was observed for the luminal B HER2-negative subtype, which had a greater decrease in salivary catalase activity. It was also noted that the increase in salivary peroxidase activity was greater in the subgroups where catalase activity decreased more strongly (Fig. 8B). The maximum increase in peroxidase activity was observed in the subgroups of luminal B HER2-negative (+152.8%, p = 0.0016) and luminal B HER2-positive (+93.3%, p = 0.0128) BC and was statistically significant (Fig. 8B).
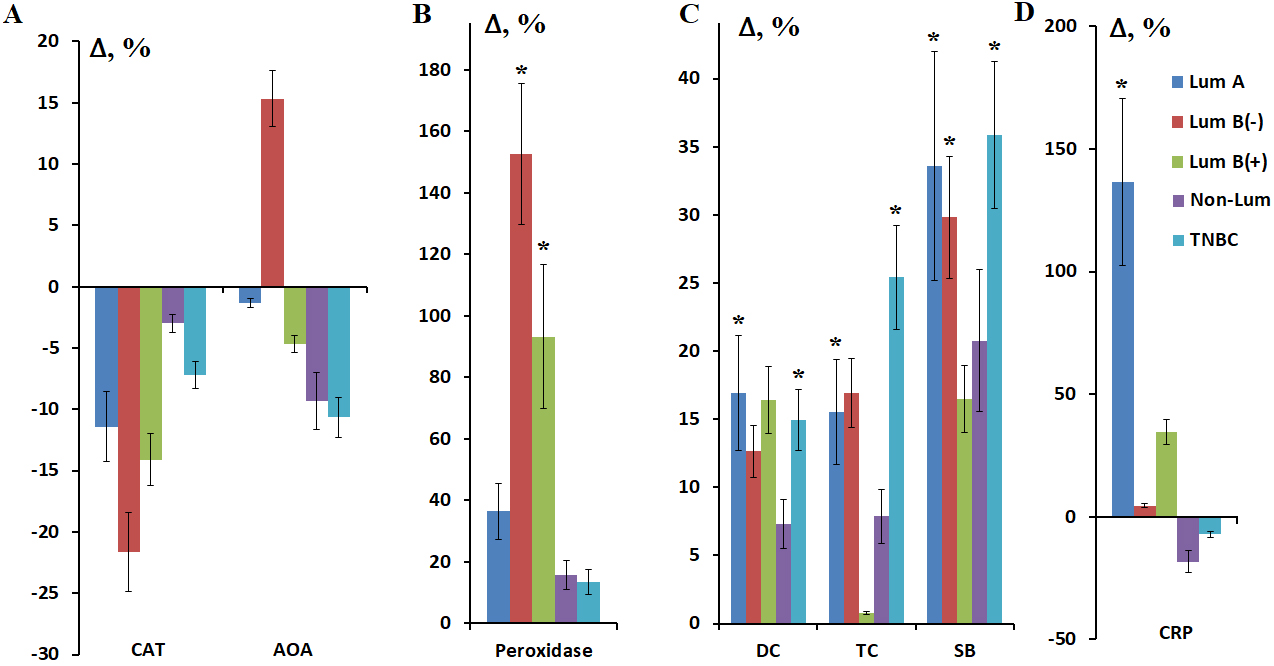 Fig. 8.
Relative activity of catalase and AOA (A), peroxidase (B) and
the relative content of lipid peroxidation products (C) and C-reactive protein
(D) in saliva depending on the molecular biological subtype of BC. * Differences
from HC are statistically significant, p
Analysis of saliva lipid peroxidation product levels for the luminal A and B HER2-negative subtypes revealed no differences (Fig. 8C). For the luminal B HER2-positive subtype, with a high content of primary lipid peroxidation products—diene conjugates (+16.4%)—the content of triene conjugates sharply decreased (+0.8%), followed by an increase in the content of the most toxic Schiff bases (+16.5%). For non-luminal and TNBC, a uniform increase in saliva lipid peroxidation products was demonstrated, ranging from primary to Schiff bases (Fig. 8C). The level of lipid peroxidation products in saliva in TNBC was the highest (+15.0%, p = 0.0194; +25.4%, p = 0.0056 and +35.9%, p = 0.0097 for DC, TC and SB, respectively).
A statistically significant increase in C-reactive protein concentration was
found only in the luminal A subgroup of BC (+136.6%, p
Thus, the metabolic characteristics of saliva composition in BC correlate with
the molecular biological subtype of the tumor. Specifically, for the luminal A
subtype, which has the most favorable prognosis, the presence of an active
inflammatory process in saliva (CRP +136.6%, p
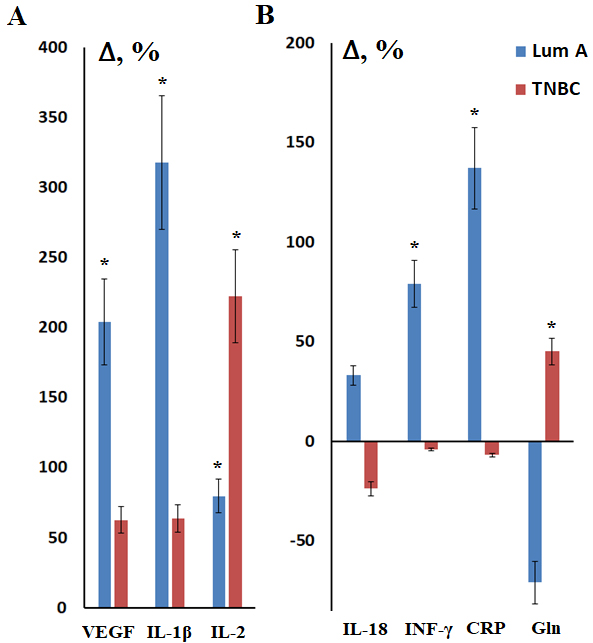 Fig. 9.
Metabolic parameters of saliva in luminal A and TNBC compared to
healthy controls. (A) VEGF, IL-1
Thus, it is possible to summarize the characteristic metabolic features that describe changes in saliva in different BC subtypes (Table 3).
| Phenotype | Aminoacids | Lipids | DNA | Cytokines | RedOx Status |
| Lum А | Met↑, Gln↑, Glu↑, Lys↑, Tyr↑, Thr↓, Gln/Glu↓ | 2923/2957↑, 1458/1396↑ | - | VEGF↑, IL-1 |
CPR↑, CAT↓, Peroxidase↑, DC↑, TC↑, SB↑ |
| Lum В(-) | Met↑, Cys↑, Gln↓, Lys↑, Thr↓, Gln/Glu↓ | 2923/2957↑, 1458/1396↑ | - | VEGF↑, IL-1 |
CAT↓, AOA↑, Peroxidase↑, DC↑, TC↑, SB↑ |
| Lum В(+) | Gln↑, Glu↑, Asp↑, Ala↑, Cys↓, Gly↑, Leu+Ile↑, Orn↑, Phe↑, Pro↑, Tyr↑, His↑, Gln/Glu↑ | 2923/2957↑, 1458/1396↑ | 8-OHdG↑ | VEGF↑, IL-1 |
CAT↓, AOA↓, Peroxidase↑, DC↑, TC↓, SB↓ |
| Non-Lum | Cys↓, His↓, Gln/Glu↓ | δCH3↑, δCH2↑, νsCH3↓, νasCH2↓, νasCH3↓ | 8-OHdG↑ | VEGF↑, INF- |
CRP↓, AOA↓, DC↓, TC↓, SB↓ |
| 2923/2957↓ | |||||
| 1458/1396↓ | |||||
| TNBC | Gln↑, Leu+Ile↑, Orn↑, Tyr↑, Thr↑, Cys↓, Gly↑, Gln/Glu↑ | 2923/2957↑, 1458/1396↑ | 8-OHdG↑ | INF- |
CRP↓, AOA↓, DC↑, TC↑, SB↑ |
BC has been shown to cause both local and systemic metabolic changes, which can be assessed by changes in the composition of mixed saliva. These metabolic changes involve all components of metabolism: energy and plastic metabolism, as well as redox balance.
Energy metabolism. In BC, increased levels of glycolysis are observed compared to normal tissues (Warburg effect), and the balance between glycolysis and oxidative phosphorylation is disrupted [34]. Thus, we observed a change in the salivary amino acids profile. It is known that malignant neoplasms cause changes in the amino acid levels both in tumor tissues and in the blood. Elevated amino acid levels are due to pro-inflammatory and immunological factors and are associated with a more aggressive phenotype of BC [35]. Amino acids can enter saliva from the blood via extracellular and intercellular pathways, due to ultrafiltration, passive diffusion, and active transport, as well as from the excretory ducts of the salivary glands during the biosynthesis of protein secretion in acinar cells using sodium-dependent membrane transporters [36]. Luminal B HER2-positive and TNBC were characterized by the highest levels of salivary amino acids. An additional calculation of the Gln/Glu ratio revealed a different variation across different BC phenotypes. For example, for luminal A and B HER2-negative subtypes, this ratio was lower than in HC, while for luminal B HER2-positive and TNBC, it exceeded the control by more than twofold. Thus, Gln was more prevalent in saliva than Glu in these BC subtypes. High Gln levels in the blood provide cancer cells with carbon and nitrogen sources, stimulating biosynthesis, energy replenishment and cellular homeostasis during tumor growth [37]. It has been shown that the immune characteristics of breast cancer subgroups, identified on the basis of Gln metabolism, may be of importance for prognosis and personalized immunotherapy [38]. Previously, two main metabolic phenotypes of BC were identified: (1) dependent predominantly on glycolysis and the pentose phosphate pathway and associated with poor survival (HER2-positive and TNBC); (2) dependent on fatty acid oxidation and glutaminolysis (luminal A subtype of BC) [39].
Increased levels of salivary Gly were observed in luminal B HER2-positive and TNBC. Cao et al. [40] found that high levels of Gly and Ala are associated with HER2-positive BC. Ala is involved in the synthesis of Gly from pyruvate and Ser. High levels of Gly are also known to correlate with an unfavorable prognosis in BC [41], since the synthesis of Gly from glucose correlates with rapid cancer cell proliferation [42]. Thus, higher levels of salivary Gly in BC can be considered a marker of tumor aggressiveness.
We showed that Met levels increased only to a greater extent in the luminal A and luminal B HER2-negative BC subgroups, while Cys levels did not change significantly in these subgroups. For HER2-positive subtypes, a slight increase in Met levels was noted with a significant decrease in Cys levels. On the one hand, tumor cells are more dependent on exogenous Met than normal cells [43]. On the other hand, Met is a crucial component of antitumor immunity [44, 45]. Cys, obtained from food or synthesized from Met, is a limiting factor for the synthesis of glutathione (GSH), which in turn maintains redox homeostasis and protects cells from oxidative stress caused by reactive oxygen species (ROS) and lipid peroxides [46, 47]. Due to increased ROS production, many cancer cells have high GSH levels, which contributes to their resistance to anticancer therapy [48]. It can be speculated that unfavorable prognostic subtypes of BC are characterized by decreased antitumor immunity due to decreased Met levels, as well as impaired redox homeostasis due to decreased Cys levels.
Plastic metabolism. In cancer, Gln and fatty acids are utilized as additional or alternative energy substrates to glucose, and higher levels of lipid biosynthesis are also observed [49]. This is due to the need for energy and plastic support for enhanced anabolic processes and reactions synthesizing the structures of rapidly dividing cells [50]. Activation of the pentose phosphate cycle and the synthesis of pentoses, necessary for the construction of nucleic acids, is also observed.
One of the key aspects of lipid metabolism in carcinogenesis is the increased synthesis of fatty acids. We have shown a decrease in the absorbance in BC compared to healthy controls. It is known that lipids enter the oral cavity mainly with the secretions of the parotid and submandibular salivary glands [51]. Some lipids, such as cholesterol and free fatty acids, enter saliva from the blood serum [52, 53]. The source of a number of lipids in saliva are also the membranes of secretory vesicles and fragments of bacterial cell membranes. Lipids are one of the main components of cell membranes, so changes in the lipid composition of saliva may reflect changes in the composition of the cell membranes of the salivary glands [54]. The general decrease in the intensity of oscillations of methyl and methylene groups in the lipid structure may be the result of a decrease in their saturation. It is known that an increase in lipid saturation increases the rigidity of membranes, thereby reducing their permeability [55]. Lipid unsaturation increases the fluidity and flexibility of the cell membrane, facilitating its remodeling and the movement of membrane-bound proteins and lipids [56, 57].
A number of studies indicate a relationship between lipid metabolism, the tumor microenvironment, and BC aggressiveness [58]. Lipid composition significantly depends on the BC phenotype [59, 60]. The range of 3050–2800 cm-1 is used to assess cell membrane permeability and protein oxidative modification processes. This range corresponds to vibrations of the methyl and methylene groups of saturated and unsaturated alkyl chains. The ratio 2923/2957 cm-1, which shows the ratio of unbranched and branched lipid and fatty acid molecules (CH2/CH3), may be potentially informative. In non-luminal BC, this ratio decreases, which may be associated with a more branched structure of lipids, as well as their shorter chains. The non-luminal subtype also showed minimal changes in salivary amino acid content, which may be a result of a shift in energy metabolism toward fatty acids, unlike other BC subtypes. Branched structures are found in various types of lipids, including fatty acids, triacylglycerides, and phospholipids. However, branched structures are rare in natural lipids, primarily found in the membranes of certain bacteria. It is likely that the altered lipid structure in non-luminal BC is due to changes in the oral microbiome.
It should be noted that salivary lipids perform many functions, the disruption of which can lead to disintegration throughout the oral cavity [61]. They also perform a protective function in relation to the oral mucosa. Both a decrease in salivary secretion and a weakening of the protective function can subsequently lead to a number of disorders, including dry mouth, as well as an increased risk of bacterial, fungal and viral infections of the gums and oral mucosa [61]. Moreover, a disruption of lipid metabolism can lead to the accumulation of free fatty acids, which cause oxidative stress, increasing the ROS production [62]. All this can be reflected in a decrease in local immunity of the oral cavity and requires timely correction in patients, regardless of the molecular biological subtype of BC.
Redox balance includes an increase in ROS, which stimulate and support cancer cell proliferation, as well as an enhancement of the antioxidant mechanism, which allows cancer cells to survive in a prooxidant environment [63]. However, this prooxidant state promotes DNA damage and genomic instability, which enhances the malignant properties of cancer cells [64].
Redox biomarkers in saliva are known to correlate poorly with their plasma levels, but the 8-OHdG level in saliva reflects its concentration in the blood [65]. 8-OHdG can be formed from 8-oxo-dGTP in the nucleotide pool or as a result of direct oxidation of guanine in DNA [66]. We demonstrated an increase in 8-OHdG concentration in saliva, most pronounced in HER2-positive and TNBC, which is consistent with a higher level of oxidative DNA damage in these subgroups.
BC subtypes are characterized by different ROS production and susceptibility to antioxidant treatment [67]. We have shown that salivary catalase activity decreases more significantly in luminal BC subtypes, while AOA decreases to a greater extent in HER2-positive and TNBC. Estrogens and their metabolites are known to alter the redox balance through increased generation of superoxide radicals with their signaling and damaging effects [68, 69], which may cause a more noticeable depletion of antioxidant defense in patients with estrogen-positive BC. It has been shown that salivary peroxidase activity increased inversely proportional to the decrease in catalase activity. Salivary peroxidase is responsible for the breakdown of cytotoxic hydrogen peroxide, while it has a bactericidal effect on the oral microbiota [70]. Thus, salivary peroxidase activity may reflect the involvement of salivary glands in the prevention of oxidative stress. Increased salivary peroxidase activity in BC indicates enhanced enzymatic antioxidant defense, which protects the salivary glands and the entire oral cavity from oxidative damage.
An accumulation of more toxic Schiff bases was observed compared to primary and secondary lipid peroxidation products. The lowest levels of lipid peroxidation products were observed in HER2-positive BC subtypes. This may be related to higher levels of free amino acids with antioxidant properties (Asp, Gln, Gly, Pro, and Tyr), which were significantly higher in this group of patients.
At the systemic level, the presence of a chronic inflammatory process is
accompanied by an increase in the blood levels of inflammatory mediators
(cytokines, chemokines, eicosanoids, reactive oxygen and nitrogen species),
acute-phase proteins, and growth factors, as well as the activation of blood
coagulation factors [71]. To counteract hypoxia, tumor cells stimulate
angiogenesis by increasing the levels of VEGF and other proangiogenic factors
[72]. For the luminal A BC subtype, we observe both an increase in the
concentration of VEGF, IL-1
From a biological point of view, INF-
The overwhelming majority of cancer patients develop secondary immunodeficiency
of varying severity with a decrease in all components of anti-infective immunity.
Thus, an increase in the concentration of both pro-inflammatory (IL-1
Recent studies have shown that the cytokine content in saliva does not correlate with their blood levels, indicating a certain autonomy of local immunity in the oral cavity, while reflecting general trends in the cytokine cascade in the patient’s body [77, 78]. Cytokines can enter saliva from the following sources: lymphocytes and accessory cells of the immune system embedded in the epithelium of the mucous membranes; serum transudate penetrating through the gingival pockets [79]; salivary glands, in which cytokines are formed and enter saliva with their secretions; epithelial cells of the oral mucosa, which produce cytokines upon contact with microorganisms [80]. In this regard, the identified patterns of changes in the level of salivary cytokines describe both local and systemic changes in BC phenotypes. It should be noted that with more prognostically favorable luminal A and B HER2-negative subtypes, a more pronounced inflammatory immune response is observed, whereas with less prognostically favorable subtypes (HER2-positive and TNBC), an increase in the level of anti-inflammatory cytokines (IL-4, IL-10) is observed. In these same subgroups, an increase in the concentration of IL-2 is observed. IL-2 is known to play a complex and sometimes opposing role in tumor progression and the immune response [81]. Although IL-2 can stimulate immune cells to attack tumors, it can also promote the proliferation of regulatory T cells, which suppress antitumor immunity [82]. Perhaps, an increase in the concentration of IL-2 indicates an increase in the antitumor immune response in a subgroup of patients with HER2-positive and TNBC.
Limitations of the study include the lack of ability to analyze the composition of the oral microbiome, as well as the lack of parallel determination of the composition of saliva and blood to confirm or refute the existence of a correlation between these biological environments. The limitations of the study also include the lack of a quantitative assessment of the oral cavity condition, since at this stage the study design only aimed to exclude an active inflammatory process in the oral cavity. Other limitations of the study include its single-center nature, the lack of longitudinal follow-up, and the lack of assessment of changes in salivary parameters during treatment. At this stage of the study, the primary objective was to select potentially informative salivary markers for assessing metabolic changes in different BC phenotypes. In the continuation of the study, we plan to conduct parallel determinations of concentrations in blood and saliva for these parameters, as well as conduct multicenter validation, evaluate correlations with the oral microbiome, and conduct dynamic monitoring before and after treatment. Although a subgroup reflecting the structure of the overall sample was formed for each indicator, limitations of the study also include the fact that saliva composition analysis was not performed on all samples for each indicator. An additional limitation may be the small sample size for individual salivary indicators.
Thus, the composition of saliva reflects systemic metabolic changes in BC, allowing for the development of a metabolic profile of BC, including consideration of the tumor’s molecular subtype. The salivary amino acids profile has been shown to correlate with receptor status, phenotype, and aggressiveness of BC. This confirms the existence of BC metabolic heterogeneity, which can be assessed by analyzing mixed saliva parameters. Furthermore, changes in salivary composition can be used to track changes in key components of BC energy homeostasis, which can be targeted by metabolic therapy.
The datasets used and analyzed during the current study are available from the corresponding author on reasonable request.
LB designed the research study and performed the research. LB performed the experiment and analyzed the data. The author contributed to drafting the manuscript. The author read and approved the final manuscript. The author has participated sufficiently in the work and agreed to be accountable for all aspects of the work.
The study was conducted in accordance with the Declaration of Helsinki. The study focusing on the biochemical characteristics of saliva in oncological patients was approved by the Ethics Committee of Omsk Regional Clinical Oncological Dispensary (21 July 2016, protocol code 15). Because the Ethics Committee of Omsk Regional Clinical Oncological Dispensary later closed, the expanded study was approved by the Ethics Committee of Omsk State Pedagogical University (20 March 2024, protocol code 46-04/2). The study was expanded to broaden the scope of metabolite detection in patients. Written informed consent was obtained from all patients or their families/legal guardians.
Thanks to all the peer reviewers for their opinions and suggestions.
This research was funded by Russian Science Foundation, grant number 23-15-00188, https://rscf.ru/project/23-15-00188/.
The author declares no conflict of interest.
References
Publisher’s Note: IMR Press stays neutral with regard to jurisdictional claims in published maps and institutional affiliations.