


 , Stefania Scicchitano 1,†, Eleonora Vecchio 1,*, Antonia Nisticò 2, Barbara Quaresima 1, Beatrice Stella 1, Carmela De Marco 3, Flavia Biamonte 1, Maria Concetta Faniello 1
1 Research Center of Biochemistry and Advanced Molecular Biology, Department of Experimental and Clinical Medicine, “Magna Graecia” University of Catanzaro, 88100 Catanzaro, Italy
2 SOC di Immunoematologia e Medicina Trasfusionale, Azienda Ospedaliero Universitaria “Renato Dulbecco”, 88100 Catanzaro, Italy
3 Department of Experimental and Clinical Medicine, University “Magna Graecia” of Catanzaro, Campus “S. Venuta”, 88100 Catanzaro, Italy
†These authors contributed equally.
Abstract
High-grade ovarian cancer (HGOC) is a heterogeneous and aggressive malignancy with a tumor microenvironment (TME) that suppresses immune responses, limiting immunotherapy efficacy. Ferroptosis, an iron-dependent form of regulated cell death, has emerged as a potential therapeutic target.
We investigated the immunomodulatory effects of the ferroptosis inducer RAS-Selective Lethal 3 (RSL3) in four HGOC cell lines (ES-2, OVCAR-5, HEY, PEO-1) using flow cytometry and lactate dehydrogenase (LDH) release assays.
RSL3 modulated Natural Killer (NK) ligand expression in a cell line-dependent manner, resulting in differential susceptibility to NK cell-mediated cytotoxicity. OVCAR-5 cells became more susceptible to NK cell killing after treatment, whereas HEY cells showed reduced susceptibility, and ES-2 and PEO-1 cells exhibited minimal changes.
Ferroptosis induction alone does not consistently enhance NK cell-mediated cytotoxicity in HGOC cells. These findings underscore the heterogeneity of tumor responses and highlight the need for further studies, particularly in in vivo models, to elucidate mechanisms linking ferroptosis to immune recognition and thereby inform therapeutic development.
Graphical Abstract
Keywords
- high-grade ovarian cancer
- tumor microenvironment
- NK cells
- ferroptosis
- RSL3
Among gynecologic malignancies, human ovarian cancer shows one of the highest mortality rates, contributing to over 200,000 deaths worldwide annually [1]. Ovarian carcinomas are classified into three different subtypes: epithelial (Epithelial Ovarian Cancer (EOC), the most widespread), germ cell and sex-cord-stromal types. The epithelial type is further subdivided into high-grade and low-grade serous, endometrioid, clear cell, and mucinous sub-types [2]. High-grade serous ovarian cancer (HGSOC) accounts for most epithelial ovarian carcinomas (around 70%), whereas Clear Cell Ovarian Cancer (CCOC) represents approximately 5–10% of cases. Both sub-types are characterized by chemoresistance and poor prognosis [3, 4]. Despite the therapeutic potential of immunotherapy in promoting effective immune surveillance, long-term clinical benefit has been observed in only about 10–15% of ovarian cancer patients, according to phase III clinical evidence [5, 6, 7, 8, 9, 10]. The limited efficacy of immunotherapy is mostly attributed to the immunosuppressive tumor microenvironment (TME), which impairs effective immune surveillance and cytotoxic innate and adaptive immune responses [11, 12, 13, 14, 15].
Natural Killer (NK) cells, a type of group 1 of innate lymphoid cells (ILCs), play a fundamental role in early defense against stressed, virally infected and transformed cells [16, 17]. Unlike CD8+T cells, NK cells directly induce target cell death without any prior sensitization. NK cells are further distinguished into two major sub-populations, based on the absence of CD3 (T cell lineage marker) and the expression of CD56 (NK cell lineage marker): CD56bright and CD56dim, representing 10% and 90% of all peripheral blood NK cells respectively. CD56bright NK cells exhibit a low cytotoxic potential and are mainly immunoregulatory, while CD56dim NK cells display strong cytotoxicity but limited secretory capabilities [18, 19]. NK cells activity is tightly regulated by the balance between activating and inhibitory signals, mediated by receptor ligand interactions. Lack of inhibitory molecules on tumors or virus-infected cells is insufficient to activate NK cells, signaling from activating molecules is also necessary [16, 20]. This intriguing mechanism is based on the “Missing-self hypothesis” [21]. Although infiltrating NK cells in ovarian cancer is associated with improved patient prognosis [22, 23, 24], recent studies indicate that the immunosuppressive TME compromises NK cell function [25, 26, 27].
Among the emerging modulators of immune response is ferroptosis, a non-apoptotic, iron-dependent type of regulated cell death (RCD) characterized by the accumulation of lipid peroxides and reactive oxygen species (ROS) [28, 29]. Notably, ovarian cancer exhibits resistance to ferroptosis, a condition that may support the use of ferroptotic inducers (FINs) alone or in combination with traditional therapies to enhance treatment efficacy [30]. Several studies demonstrate that FINs, when combined with docetaxel, enhance chemosensitivity in preclinical models of ovarian cancer [31, 32]. Moreover, the combination of FINs with cisplatin-based chemotherapy increases drug cytotoxicity and reduces adverse effects in vitro and in vivo models [33]. In preclinical ovarian cancer models, immunotherapy synergizes FINs, highlighting their potential as pharmacological candidates for combination therapies [34, 35]. Lang and colleagues [36] demonstrated that ferroptosis induced by chemotherapy, radiotherapy, or immunotherapy enhances dendritic cell recruitment, promotes antigen presentation, and activates cytotoxic lymphocytes, in vivo and in vitro models [36].
Although ferroptosis has been shown to influence adaptive immune responses [36], its effects on innate immune cells, particularly in the context of ovarian cancer, remain poorly understood. In particular, the impact of ferroptotic cell death on NK cell recognition against high-grade ovarian cancer (HGOC) has not been investigated to date.
In this study, we induced ferroptosis in HGOC cells using RAS-Selective Lethal 3 (RSL3), a Glutathione Peroxidase 4 (GPX4) inhibitor, to evaluate its impact on NK cell activation and cytotoxicity. Our results show that ferroptosis modulates the expression of several immune ligands on the tumor cell surface, including Poliovirus Receptor (PVR), Programmed Death-Ligand 1 (PD-L1), Unique Long 16-Binding Protein 2 (ULBP2), MHC class I chain-related protein (MIC) A and B (MICA/B), and Nectin-like molecules-2 (Nectin-2). However, NK cells do not consistently recognize or respond to ferroptotic cancer cells, suggesting that RSL3 alone may be insufficient to trigger a robust NK cell–mediated immune response. These findings provide new insights into the interplay between ferroptosis and innate immunity in ovarian cancer.
Human epithelial ovarian cancer (hEOC) cell lines, ES-2 (High grade ovarian
clear cell adenocarcinoma), OVCAR-5 (High grade ovarian serous adenocarcinoma),
HEY (High grade ovarian serous adenocarcinoma) and PEO-1 (High grade ovarian
cystadenocarcinoma) were purchased from the American Type Culture Collection
(ATCC, Manassas, VA, USA). ES-2 and PEO-1 cells were cultured in RPMI 1640,
whereas OVCAR-5 and HEY cells were maintained in DMEM medium. All media were
supplemented with 10% foetal bovine serum, 50 U/mL of penicillin, and 50
µg/mL of streptomycin (Thermo Fisher Scientific, Milan, Italy). Cells were
cultured at 37 °C in a humidified incubator with 5% CO2
atmosphere. ES-2 and HEY cells were plated at a concentration of 2.0
To assess RSL3 toxicity, ES-2, HEY, OVCAR-5 and PEO-1 cells were treated with
the following concentrations of RSL3: (ES-2: 50 nM, 100 nM, 200 nM; HEY: 1
µM, 2 µM, 6 µM; OVCAR-5: 2.5
µM, 5 µM, 10 µM; PEO-1: 5 µM,
10 µM, 15 µM). To assess Fer-1 toxicity, PEO-1 cells
were treated at different concentrations of Fer-1 (5 µM, 10
µM, 15 µM) and ES-2, HEY and OVCAR-5 cells were treated
respectively with 1, 10 and 2 µM of Fer-1concentration as indicated
in [37, 38, 39]. Co-treatment with RSL3 and Fer-1 was performed for each cell line.
Cells were processed as already described [40]. Briefly, 1
The growth rates of cells were obtained using the Trypan Blue dye exclusion method. Cell viability of ES-2, HEY, OVCAR-5, and PEO-1 was also evaluated with the CellTiter-Glo® Luminescent Cell Viability Assay (Promega, Madison, WI, USA), which is based on the quantitation of ATP as an indicator of metabolically active cells as previously described [41, 42]. Briefly, cells were plated in 96 wells overnight and the next day, were treated or not with different concentrations of RSL3 for 24 h. Each experiment was performed in technical and biological triplicates. Half-maximal inhibitory concentrations (IC50) were calculated by plotting a dose-response curve using non-linear regression analysis using GraphPad Prism V9 software (GraphPad Software, Boston, MA, USA).
Apoptosis assay was assessed as already described [43]. Briefly, a number of 1
Intracellular ROS production was quantified through the redox sensitive probe
2′-7′-Dichlorodihydrofluorescein diacetate (CMH2DCFDA) (Thermo Fisher
Scientific). ES-2, HEY, OVCAR-5 and PEO-1 were treated with RSL3, Fer-1 or RSL3
and Fer-1 Cells were incubated with CMH2DCFDA for 30 min at 37 °C.
Thereafter, cells were centrifuged and resuspended in 200 µL of PBS
(1
Mitochondrial ROS production was assessed in both untreated and treated cells
(ES-2, HEY, OVCAR-5 and PEO-1) with RSL3, Fer-1 or RSL3 and Fer-1. Single cell
suspensions were incubated with MitoSOX (MitoSOX Red Mitochondrial Superoxide
Indicator (Thermo Fisher Scientific, Waltham, MA, USA) for 30 min at 37
°C. Thereafter, cells were centrifugated and resuspended in 200
µL of PBS (1
Lipid peroxidation was investigated as previously described [35]. ES-2, HEY,
OVCAR-5 and PEO-1 cells untreated and treated with RSL3, Fer-1 or RSL3 and Fer-1,
were incubated with BODIPY (BODIPY™ 581/591C11 dye (Thermo Fisher
Scientific) for 30 min at 37 °C. Cells were washed twice with PBS
(1
To obtain NK cells, we first separated PBMCs from buffy coats provided by
healthy donors using a standard density gradient centrifugation protocol [44].
Buffy-coats from healthy volunteers were supplied by the blood transfusion center
of Pugliese-Ciaccio Hospital, Catanzaro, Italy, previous consent to the
processing of personal data. In accordance with Italian regulations (Legislative
Decree 196/2003 as amended by Legislative Decree 101/2018, and EU Regulation
2016/679 – GDPR), this study used residual biological material collected for
routine diagnostic purposes. All samples were anonymized prior to analysis. No
additional procedures or interventions were performed for research purposes. In
line with national regulations, this type of retrospective, anonymized analysis
does not require approval from an ethics committee. All procedures were conducted
in compliance with the Declaration of Helsinki and institutional guidelines.
Blood samples were divided into Falcon tubes according to the protocol described
in [44]. For each tube, an equal volume (1:1) of PBS (1
After the incubation with RSL3, ES-2, HEY, OVCAR-5 and PEO-1 cells were
collected and incubated with a viability marker (BD Horizon™
Fixable Viability Stain 780) for 15 min at RT in the dark. A number of 2
Voltages for physical parameters (SSC, FSC) and fluorescence channels were previously optimized for each cell line used. After identifying the population of interest, live cells were discriminated against from dead cells using an SSC-A vs viability marker plot. Subsequently, all markers were acquired on the live cell population gate (viability marker-negative). Data was analyzed with FlowJo v10 Software (BD Biosciences). Untreated cells were used as a control. Each experiment was performed in technical and biological triplicates. The gating strategy is indicated in Supplementary Fig. 1B.
Cytotoxicity assay was performed as already described [45]. After 24 hours of
incubation with RSL3, target cells were detached with trypsin, centrifuged at
1500 rpm for 5 min and counted with trypan blue. Target cells were subsequently
plated with purified NK cells in nude RPMI-1640 medium in 96 well U-bottom
plates. The experiments were performed starting from 50:1 (500.000:10.000)
Effector to Target Ratio(E:T). Co-cultures were incubated in a humidified 5%
CO2 incubator at 37 °C for three hours. After centrifugation at 250
A total of 1 µg of RNA, previously prepared using PureLink RNAMini Kit (Thermo Fisher Scientific) and verified using a NanoDrop 2000/2000c Spectrophotometer (Thermo Fisher Scientific), was used to synthesize cDNA using SuperScript III reverse transcriptase and was amplified with the iQ™ SYBR® green super mix (BioRad, Milan, Italy) using the qRT-PCR amplifier QuantStudio3 (Applied Biosystems, Milan, Italy) [46]. Reactions were carried out in triplicate, and the analysis of gene expression was calculated as 2-ddCt and normalized for the house-keeping gene (Glyceraldehyde-3-Phosphate Dehydrogenase (GAPDH)). Primers used in this study were as follows (5-3):
h-GPX4 (fwd) ATCGACGGGCACATGGTTAA,
h-GPX4 (rev) CGACGAGCTGAGTGTAGTTT.
h-NRF2 (fwd) CACCACCCACACAACTTACTGC,
h-NRF2 (rev) GGTCTTCTTGGGGCTTAGGT.
h-CD71 (fwd) TGCTGCTTTCCCTTTCCTTG,
h-CD71 (rev) GCTCGTGCCACTTTGTTCAA.
h-GAPDH (fwd) CACCATCTTCCAGGAGCGAG,
h-GAPDH (rev) TCAC-GCCACAGTTTCCCGGA.
Total extracts were prepared as previously described [47]. Briefly, to obtain
total protein extracts, cells were washed once with PBS (1
All experiments were performed in triplicate, and data are presented as the mean
To assess whether RSL3 modulates NK cell-mediated response against ovarian
cancer, the following cell lines (ES-2, HEY, OVCAR-5 and PEO-1) were treated with
increasing concentrations of RSL3 for 24 hours (Fig. 1). For the purposes of this
study, a concentration of RSL3 slightly below the IC50, resulting in
moderate cell death (
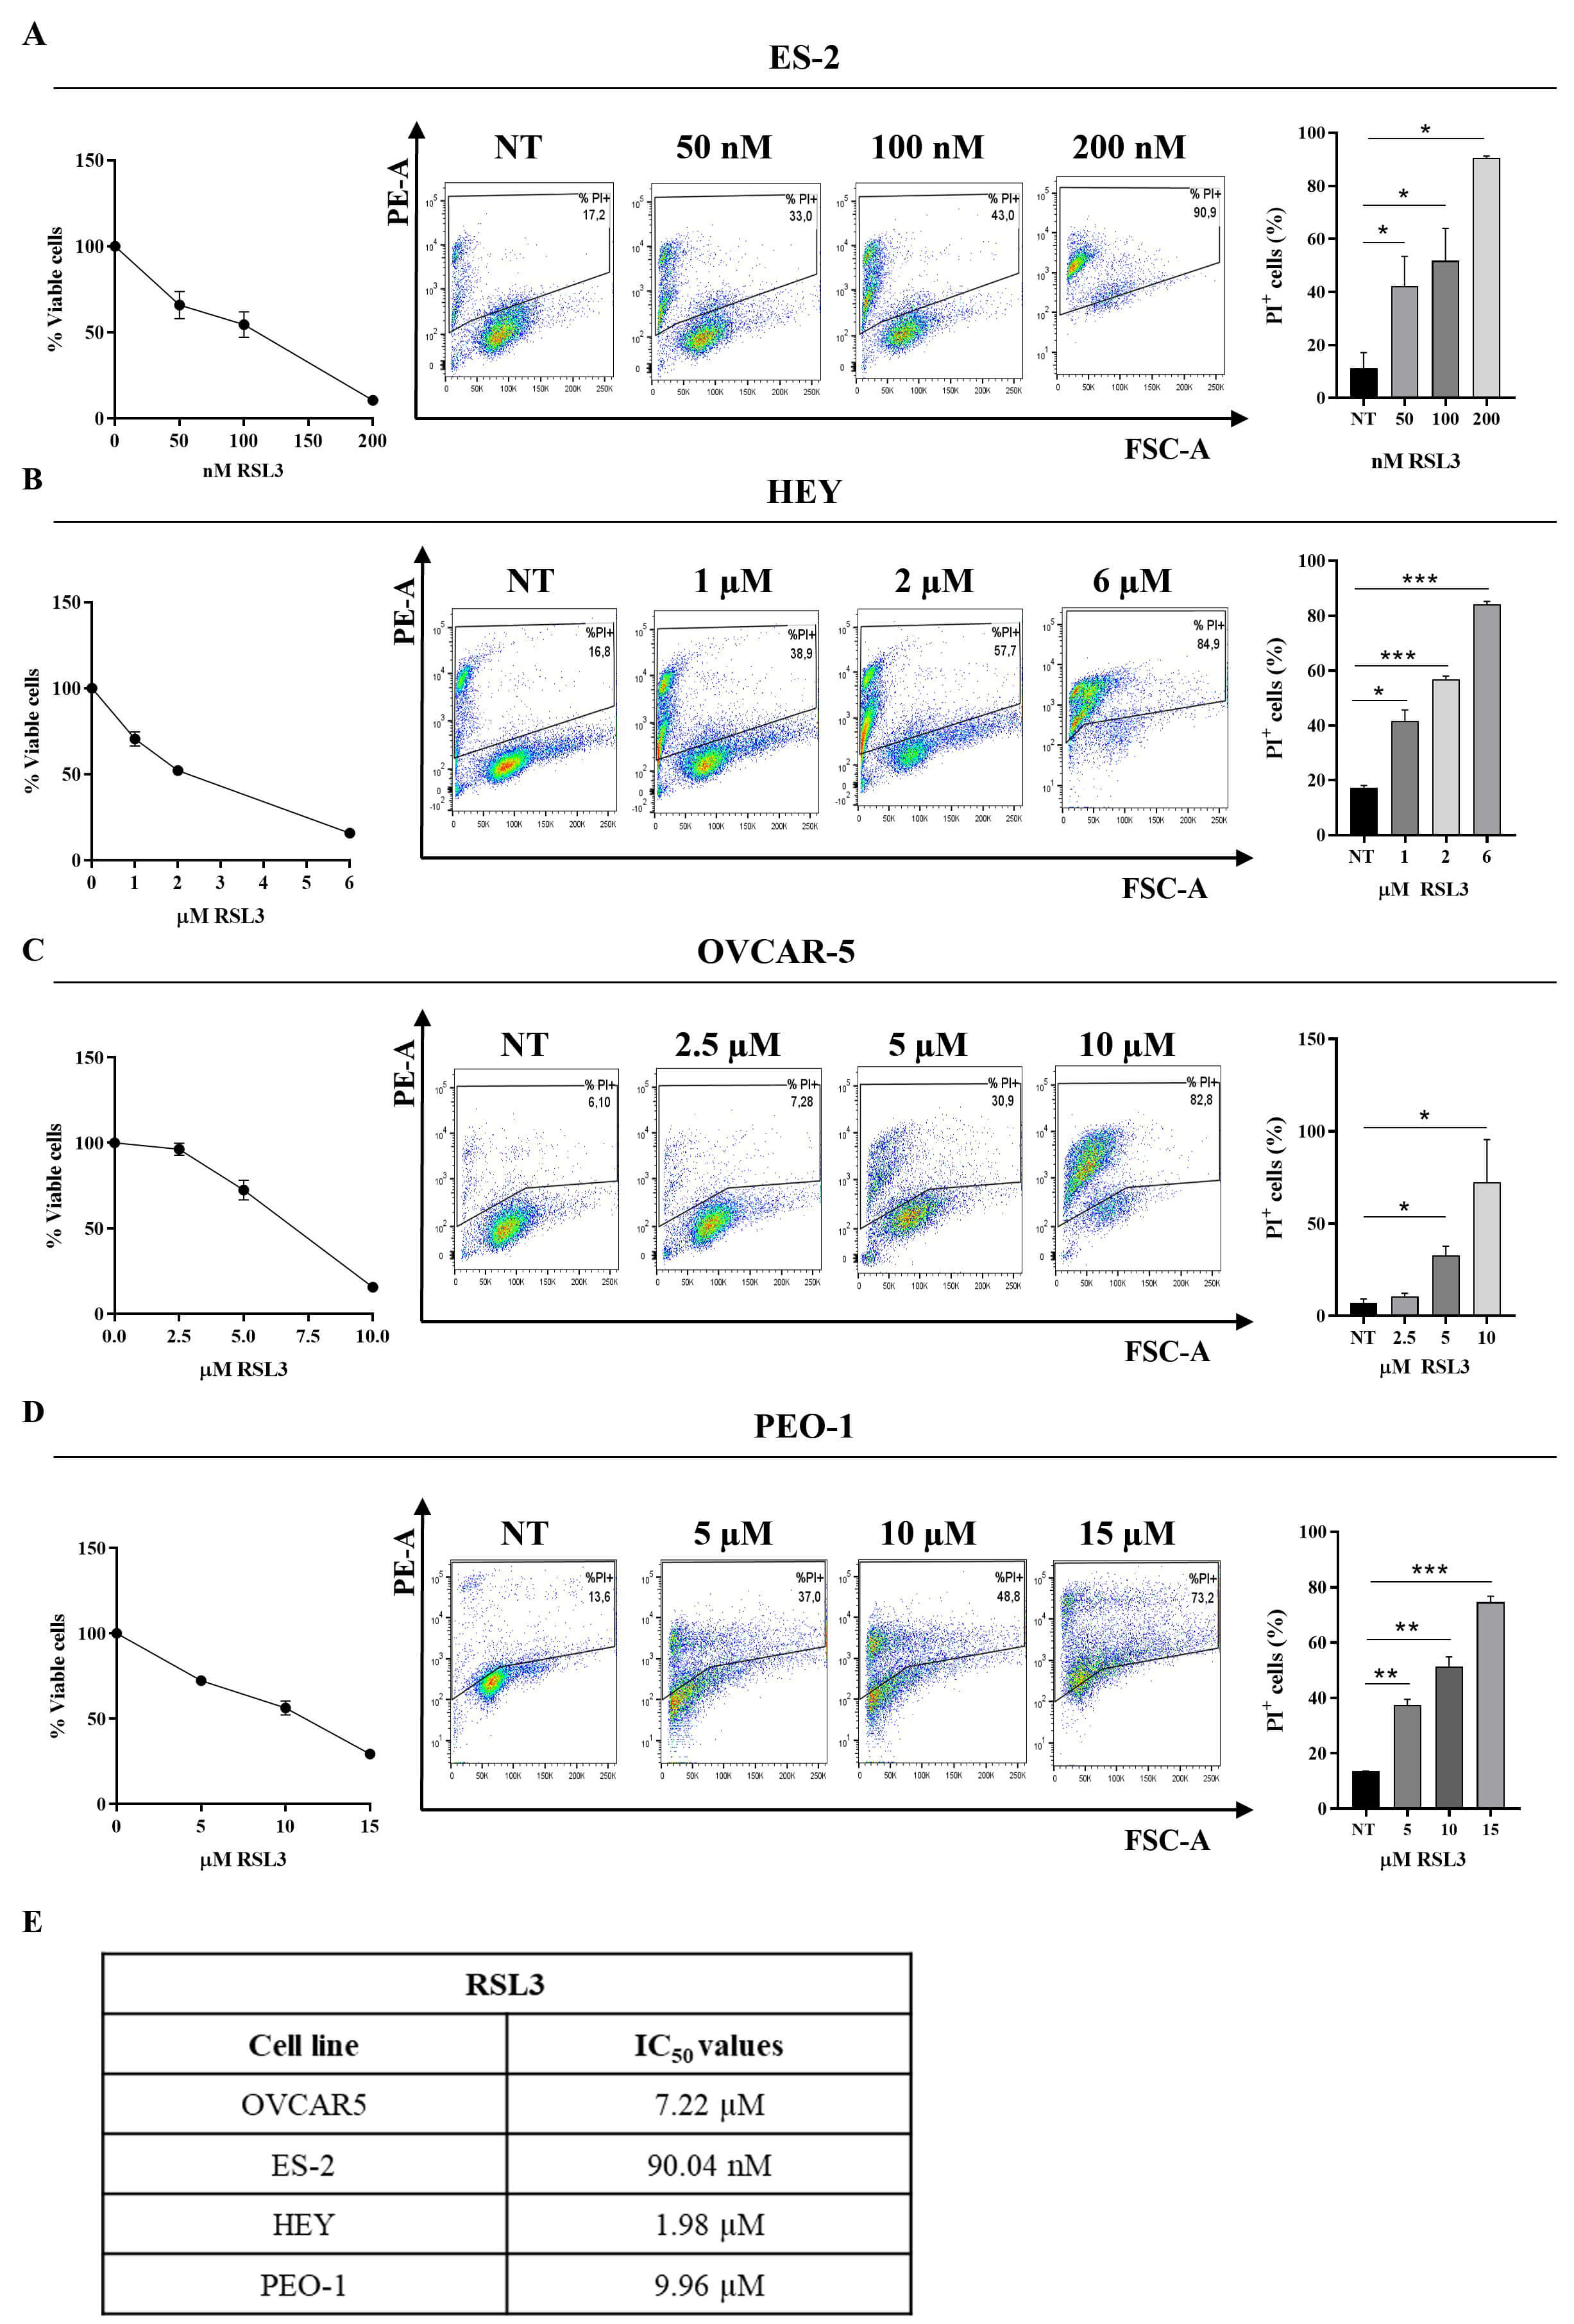 Fig. 1.
Dose-dependent RAS-Selective Lethal 3 (RSL3) cytotoxicity on
human ovarian cancer cell lines. Ovarian cancer cell lines were treated with
RSL3 for 24 hours at the following concentrations: (A) ES-2: 50, 100, 200 nM; (B)
HEY: 1, 2, 6 µM; (C) OVCAR-5: 2.5, 5, 10 µM; (D) PEO-1:
5, 10, 15 µM. The IC50 of RSL3 was determined for all cell
lines (A–D left panel). The percentage of dead cells (propidium iodide (PI)
positive) is reported in each representative plot (A–D, middle panel).
Statistical analysis of % of PI positive cells untreated (NT) and treated with
RSL3 was reported for each cell line tested (A–D right panel). All the
experiments were performed in technical and biological triplicates. Data were
represented as means
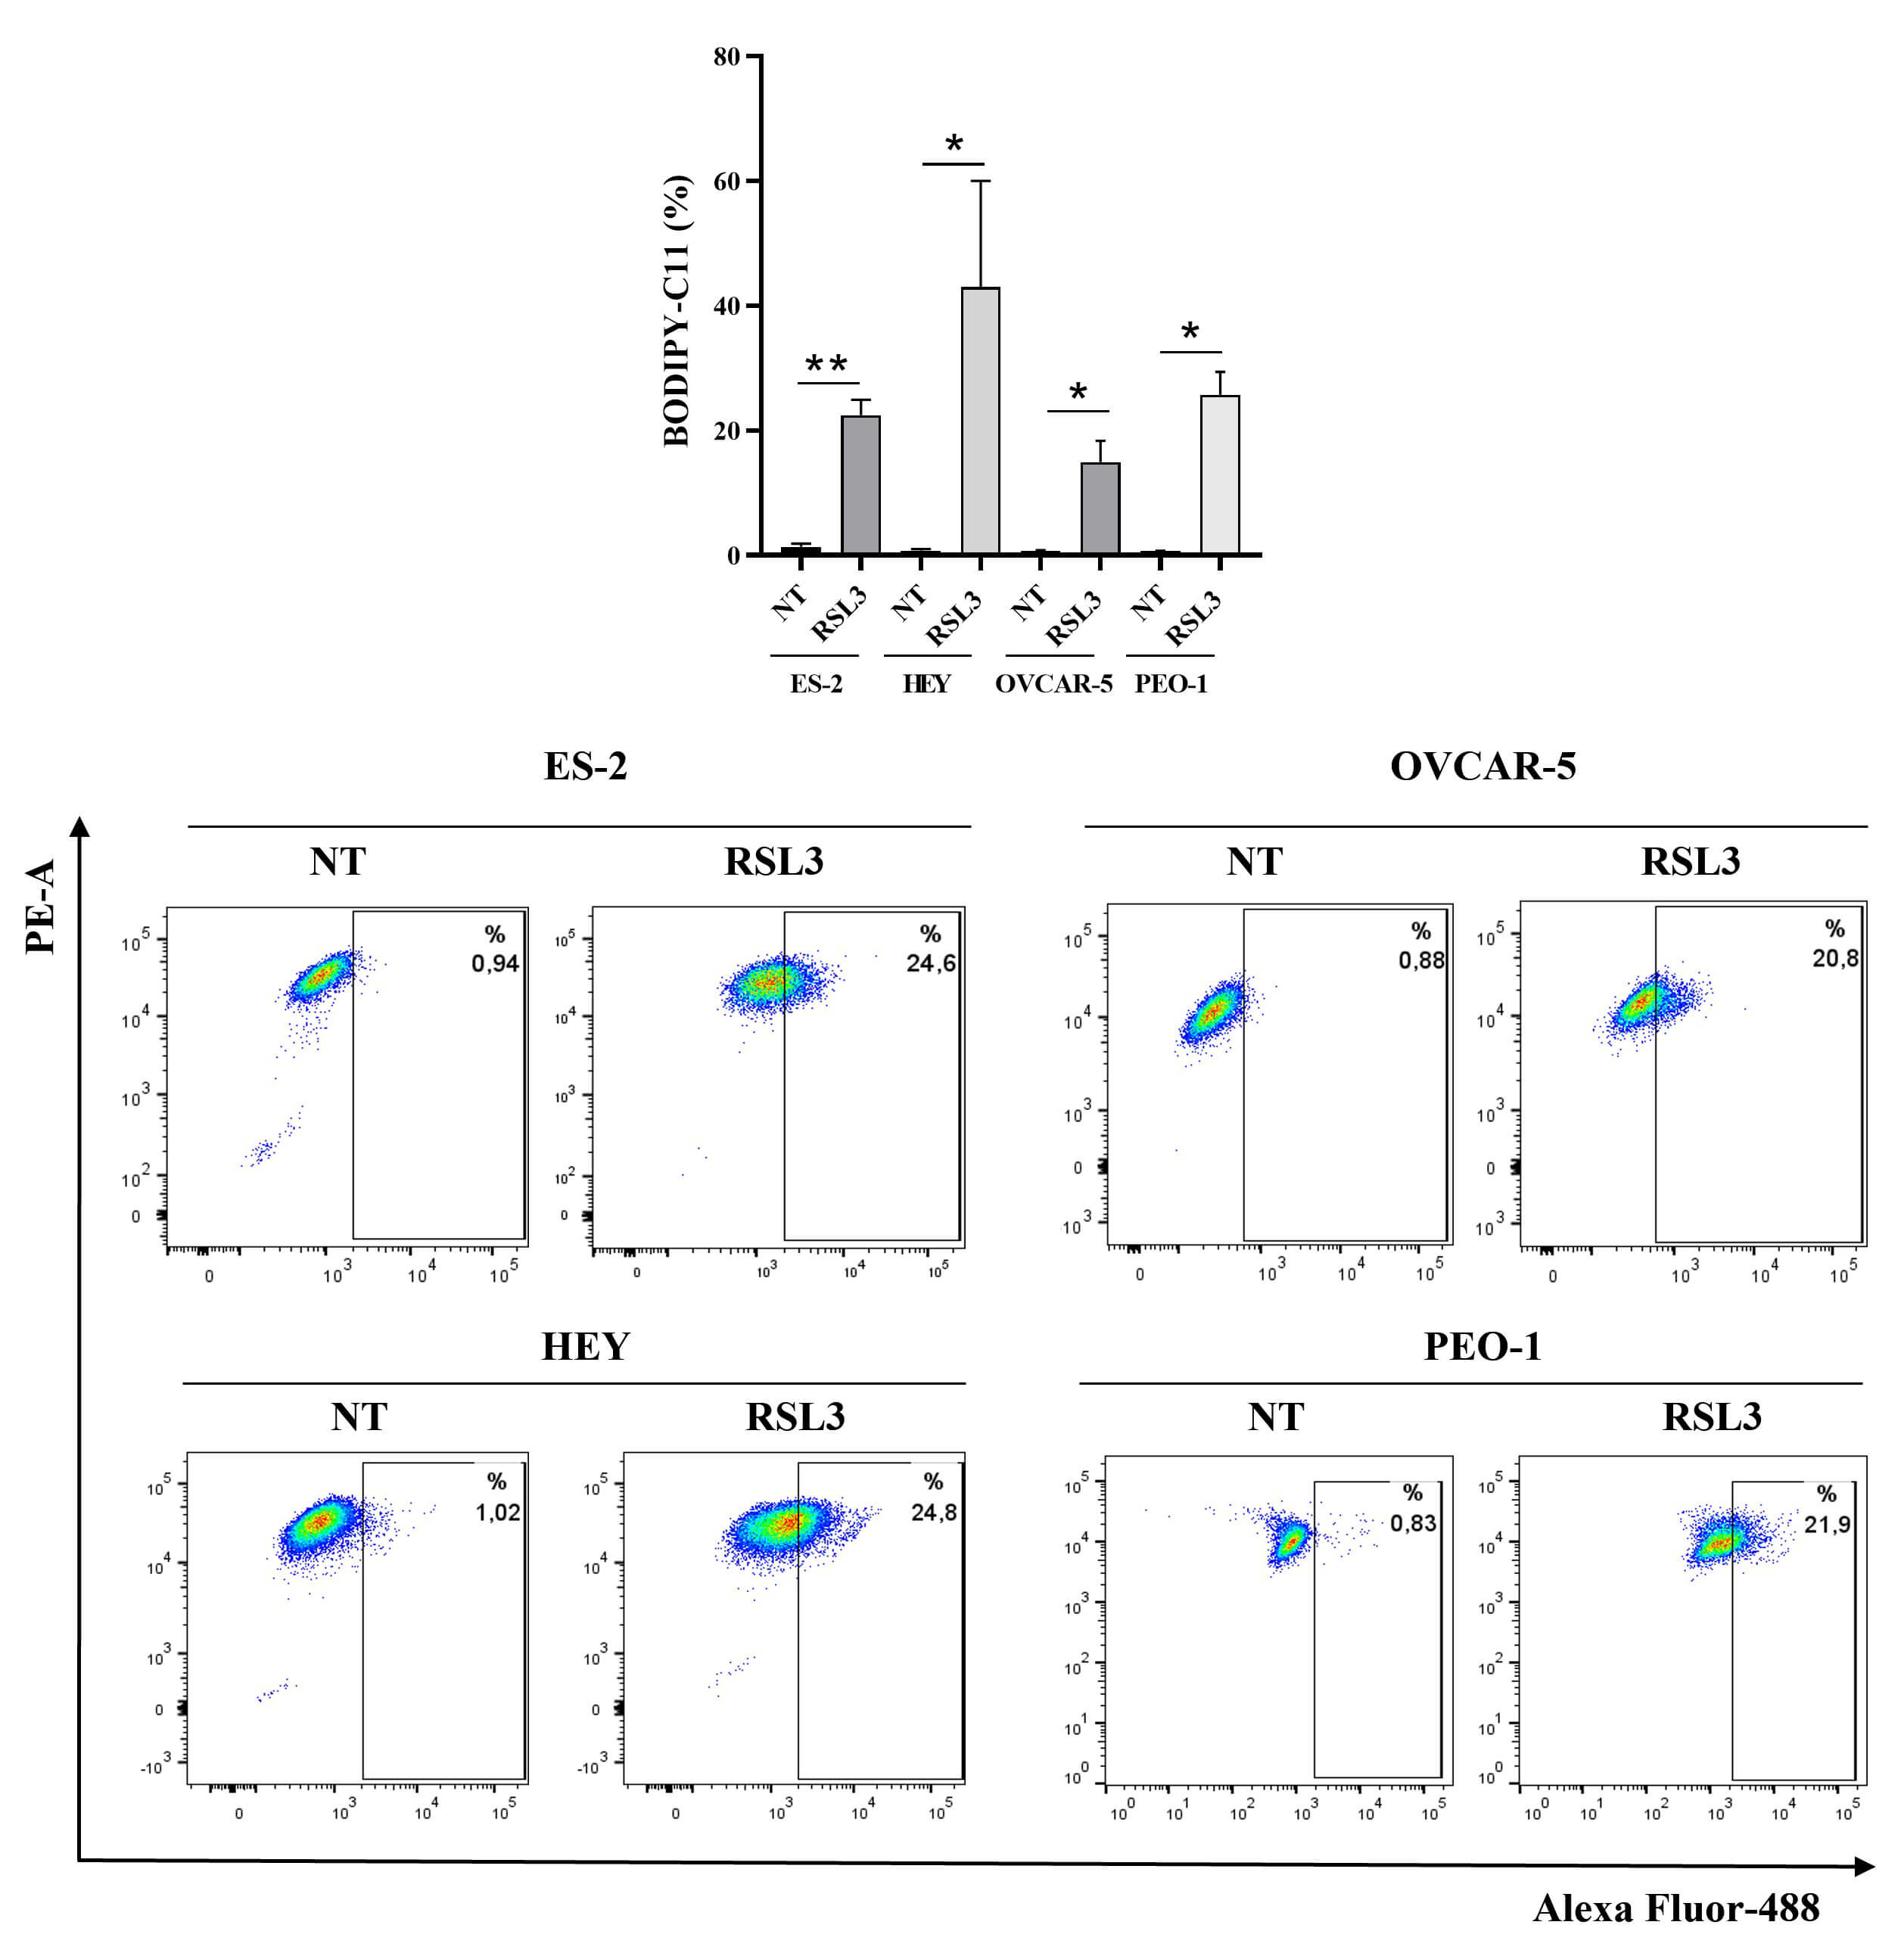 Fig. 2.
RSL3 induces lipid peroxidation in ovarian cancer cell lines.
Statistical analysis (upper panel) and representative plots (bottom panel) of the
percentage of positive cells for BODIPY-C11 are reported. Cells were treated with
RSL3 for 24 hours at the following concentrations: 50 nM (ES-2), 1
µM (HEY), 5 µM (OVCAR-5) and 5 µM (PEO-1).
All the experiments were performed in technical and biological triplicates. Data
were represented as means
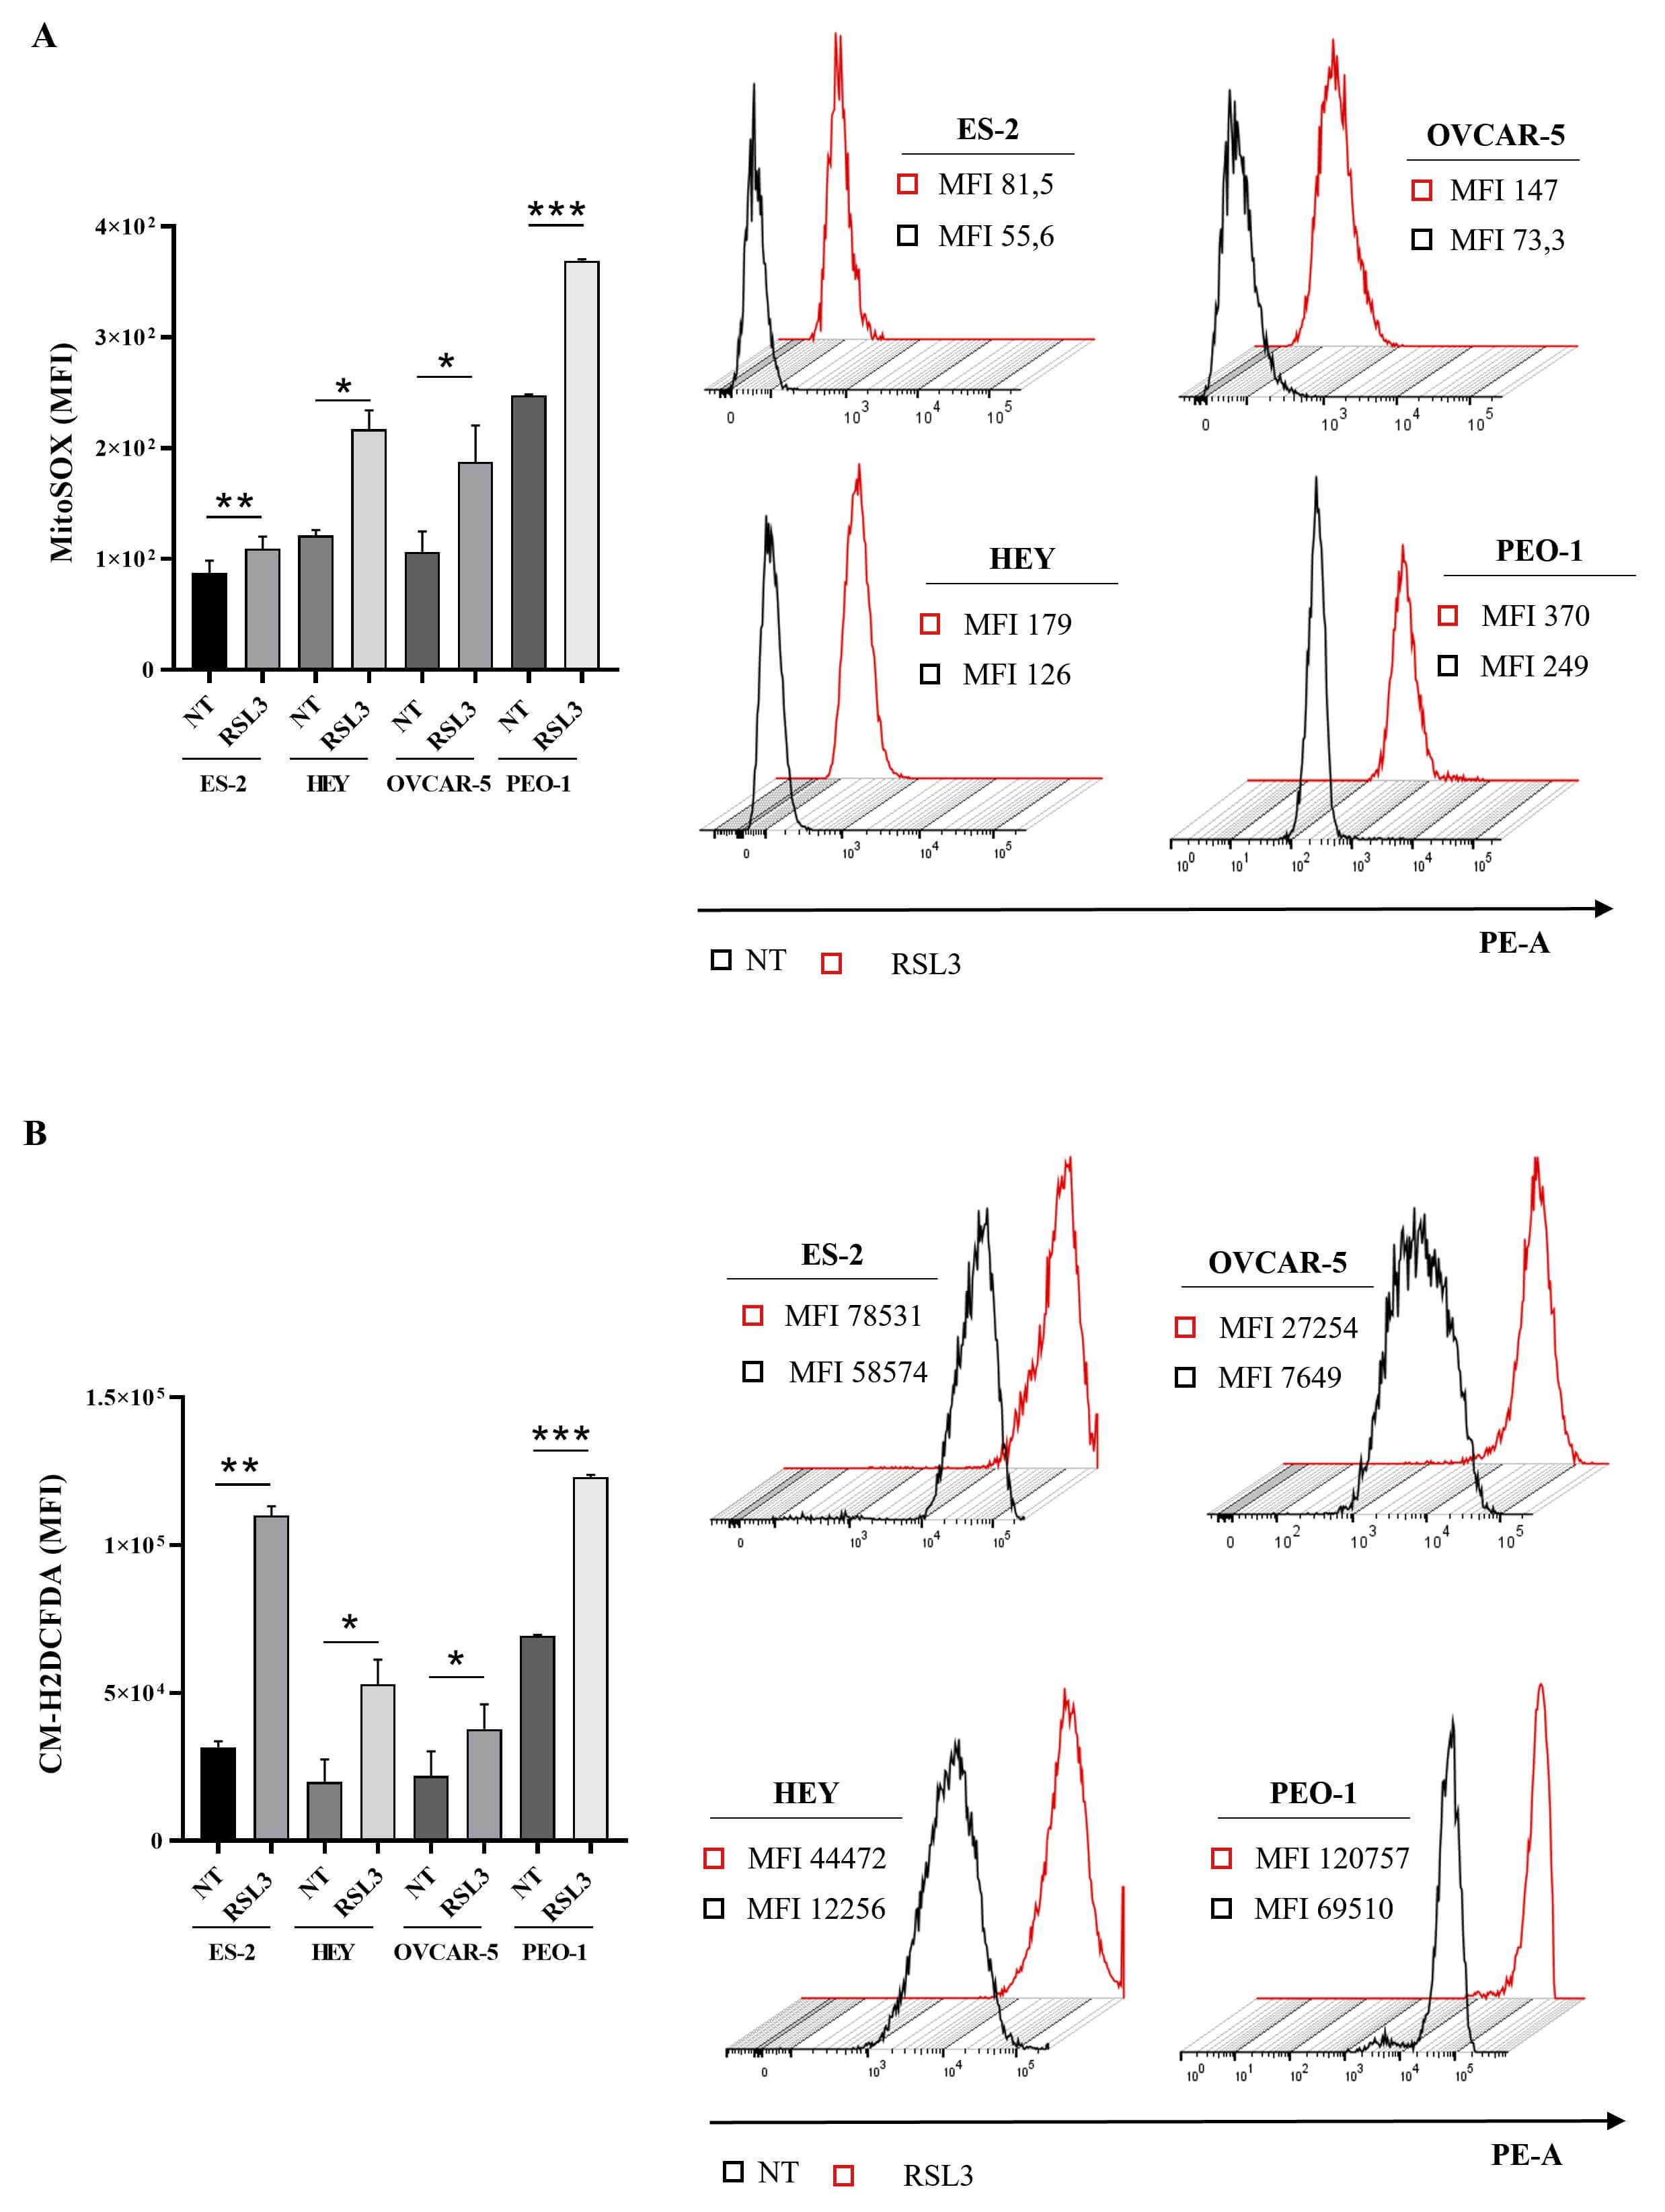 Fig. 3.
RSL3 enhances intracellular reactive oxygen species (ROS) in
ovarian cancer cell lines. (A) Statistical analysis of Median Fluorescence
Intensity (MFI) (left panel) and representative histograms (right panel) of
MitoSOX are reported. (B) Statistical analysis of MFI (left panel) and
representative histograms (right panel) of CM-H2DCFDA are reported. Cells were
treated with RSL3 for 24 hours at the following concentrations: 50 nM (ES-2), 1
µM (HEY), 5 µM (OVCAR-5), 5 µM (PEO-1).
All the experiments were performed in technical and biological triplicates. Data
were represented as means
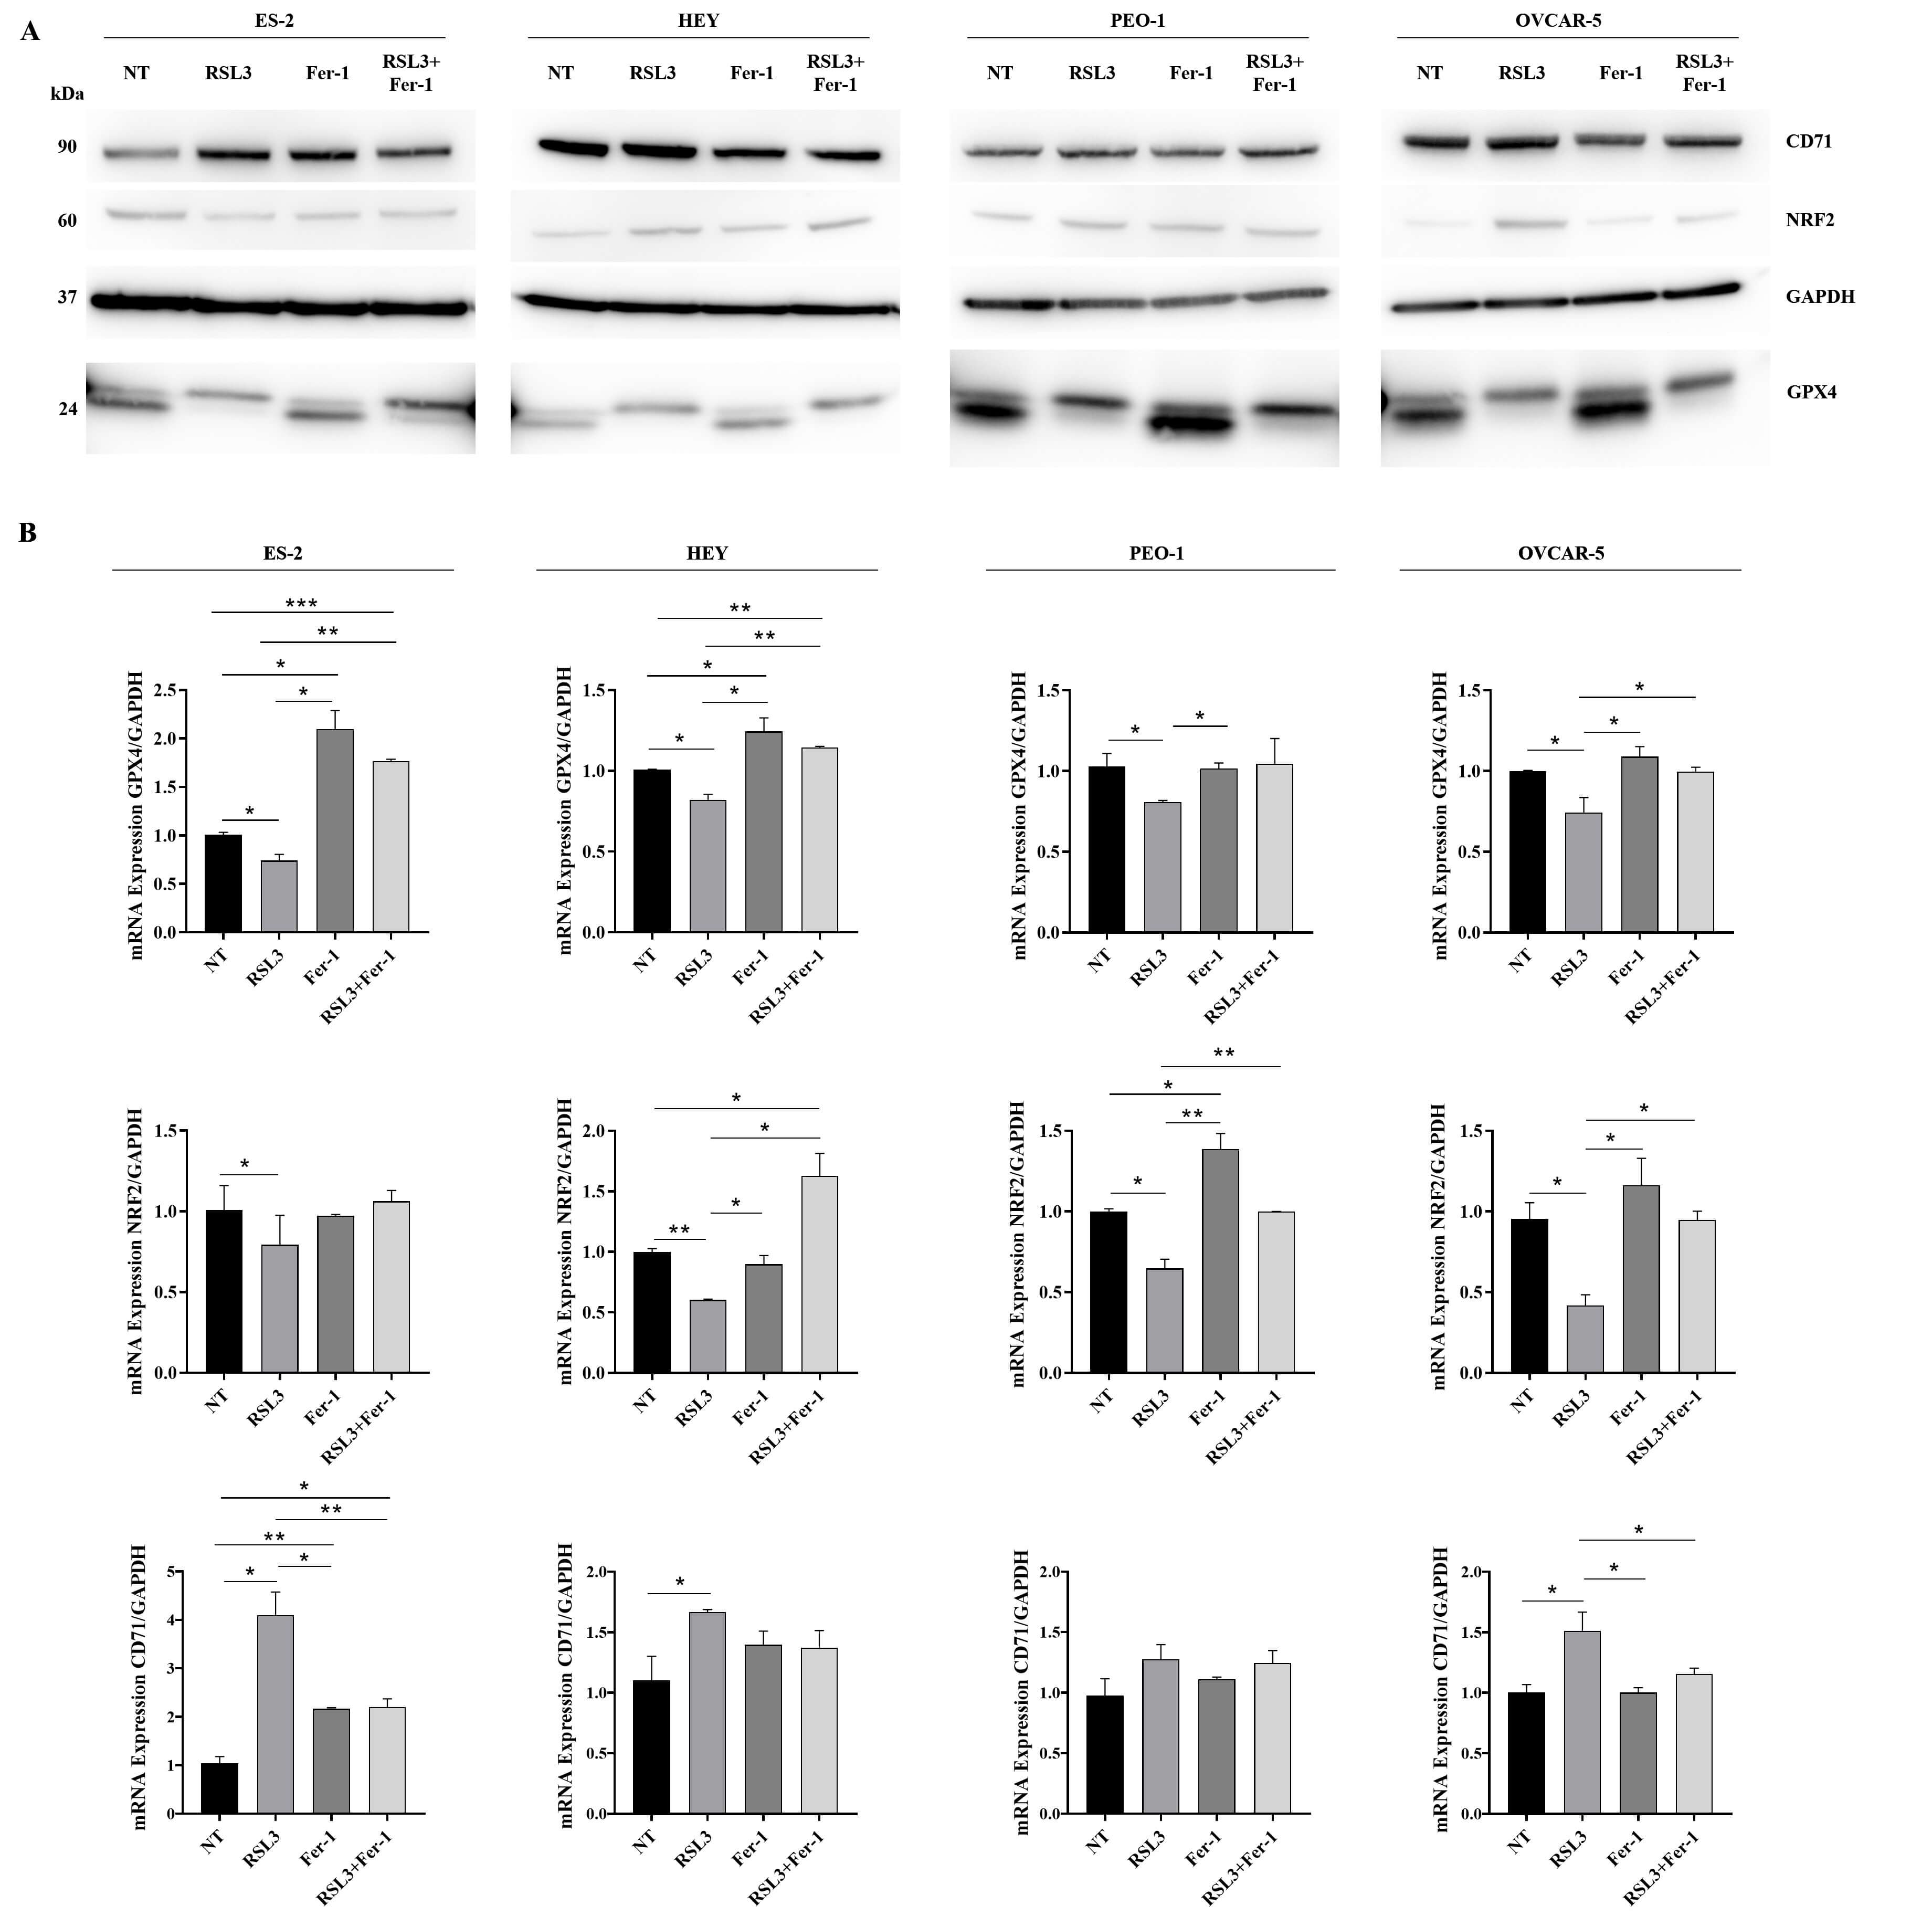 Fig. 4.
RSL3 induces mRNA and protein expression of
ferroptosis-associated markers in HGOC cell lines. Cells were treated with RSL3
or Fer-1 alone or co-treated with RSL3 and Ferrostatin-1 (Fer-1) for 24 hours (NT
indicates untreated cells). Proteins and total RNA, extracted from human ovarian
cancer cell lines, were analysed by western blot (A) and qRT-PCR (B) for the
expression of GPX4, NRF2 and CD71 in ES-2, HEY, OVCAR-5 and PEO-1. Results were
normalized using GAPDH as the housekeeping protein or gene. All experiments were
performed in technical and biological triplicates. Asterisks indicate
*p-value
Co-treatment with Fer-1 and RSL3 modulated RSL3-associated changes at both mRNA and protein levels (Fig. 4 and Supplementary Fig. 3). In particular, at mRNA levels, were observed changes in CD71 (Fer-1 + RSL3 vs RSL3: p value: 0.009 for ES-2; p value 0.029 for OVCAR-5), NRF2 (Fer-1 + RSL3 vs RSL3: p value 0.011 for HEY; p value 0.008 for PEO-1; p value 0.014 for OVCAR-5), and GPX4 (Fer-1 + RSL3 vs RSL3: p value 0.002 for ES-2; p value 0.005 for HEY; p value 0.022 for OVCAR-5). No significant changes were observed for CD71 in HEY and PEO-1 cells, for NRF2 in ES-2 cells, and for GPX4 in PEO-1 cells. At the protein levels, changes were observed in CD71 (Fer-1 + RSL3 vs RSL3: p value 0.019 for ES-2), NRF2 (Fer-1 + RSL3 vs RSL3: p value 0.020 for ES-2; p value 0.002 for OVCAR-5), and GPX4 (Fer-1 + RSL3 vs RSL3: p value 0.003 for ES-2; p value 0.011 for PEO-1). No significant changes were observed for CD71 in HEY and OVCAR-5, for NRF2 in HEY and PEO-1 and for GPX4 in HEY and OVCAR-5 cells. All together these results confirm that RSL3 induces ferroptosis in HGOC cell lines. Notably, none of the tested cell lines showed evidence of apoptosis upon exposure to RSL3 (Supplementary Fig. 4). Taken together, these results demonstrate that low doses of RSL3 are sufficient to induce ferroptosis in HGOC cell lines, establishing a basis for investigating its role in modulating NK cell-driven anti-tumor immunity.
To evaluate whether RSL3-induced ferroptosis directly affects the innate immune
response, we performed flow cytometric analysis of surface molecules (PVR,
Nectin-2, PD-L1, ULBP2, MICA/B) involved in NK cell recognition (Fig. 5).
Treatment with RSL3 led to a reduction of PVR and PD-L1 expression in ES-2 and
OVCAR-5 cells (RSL3-treated vs NT: 0.82
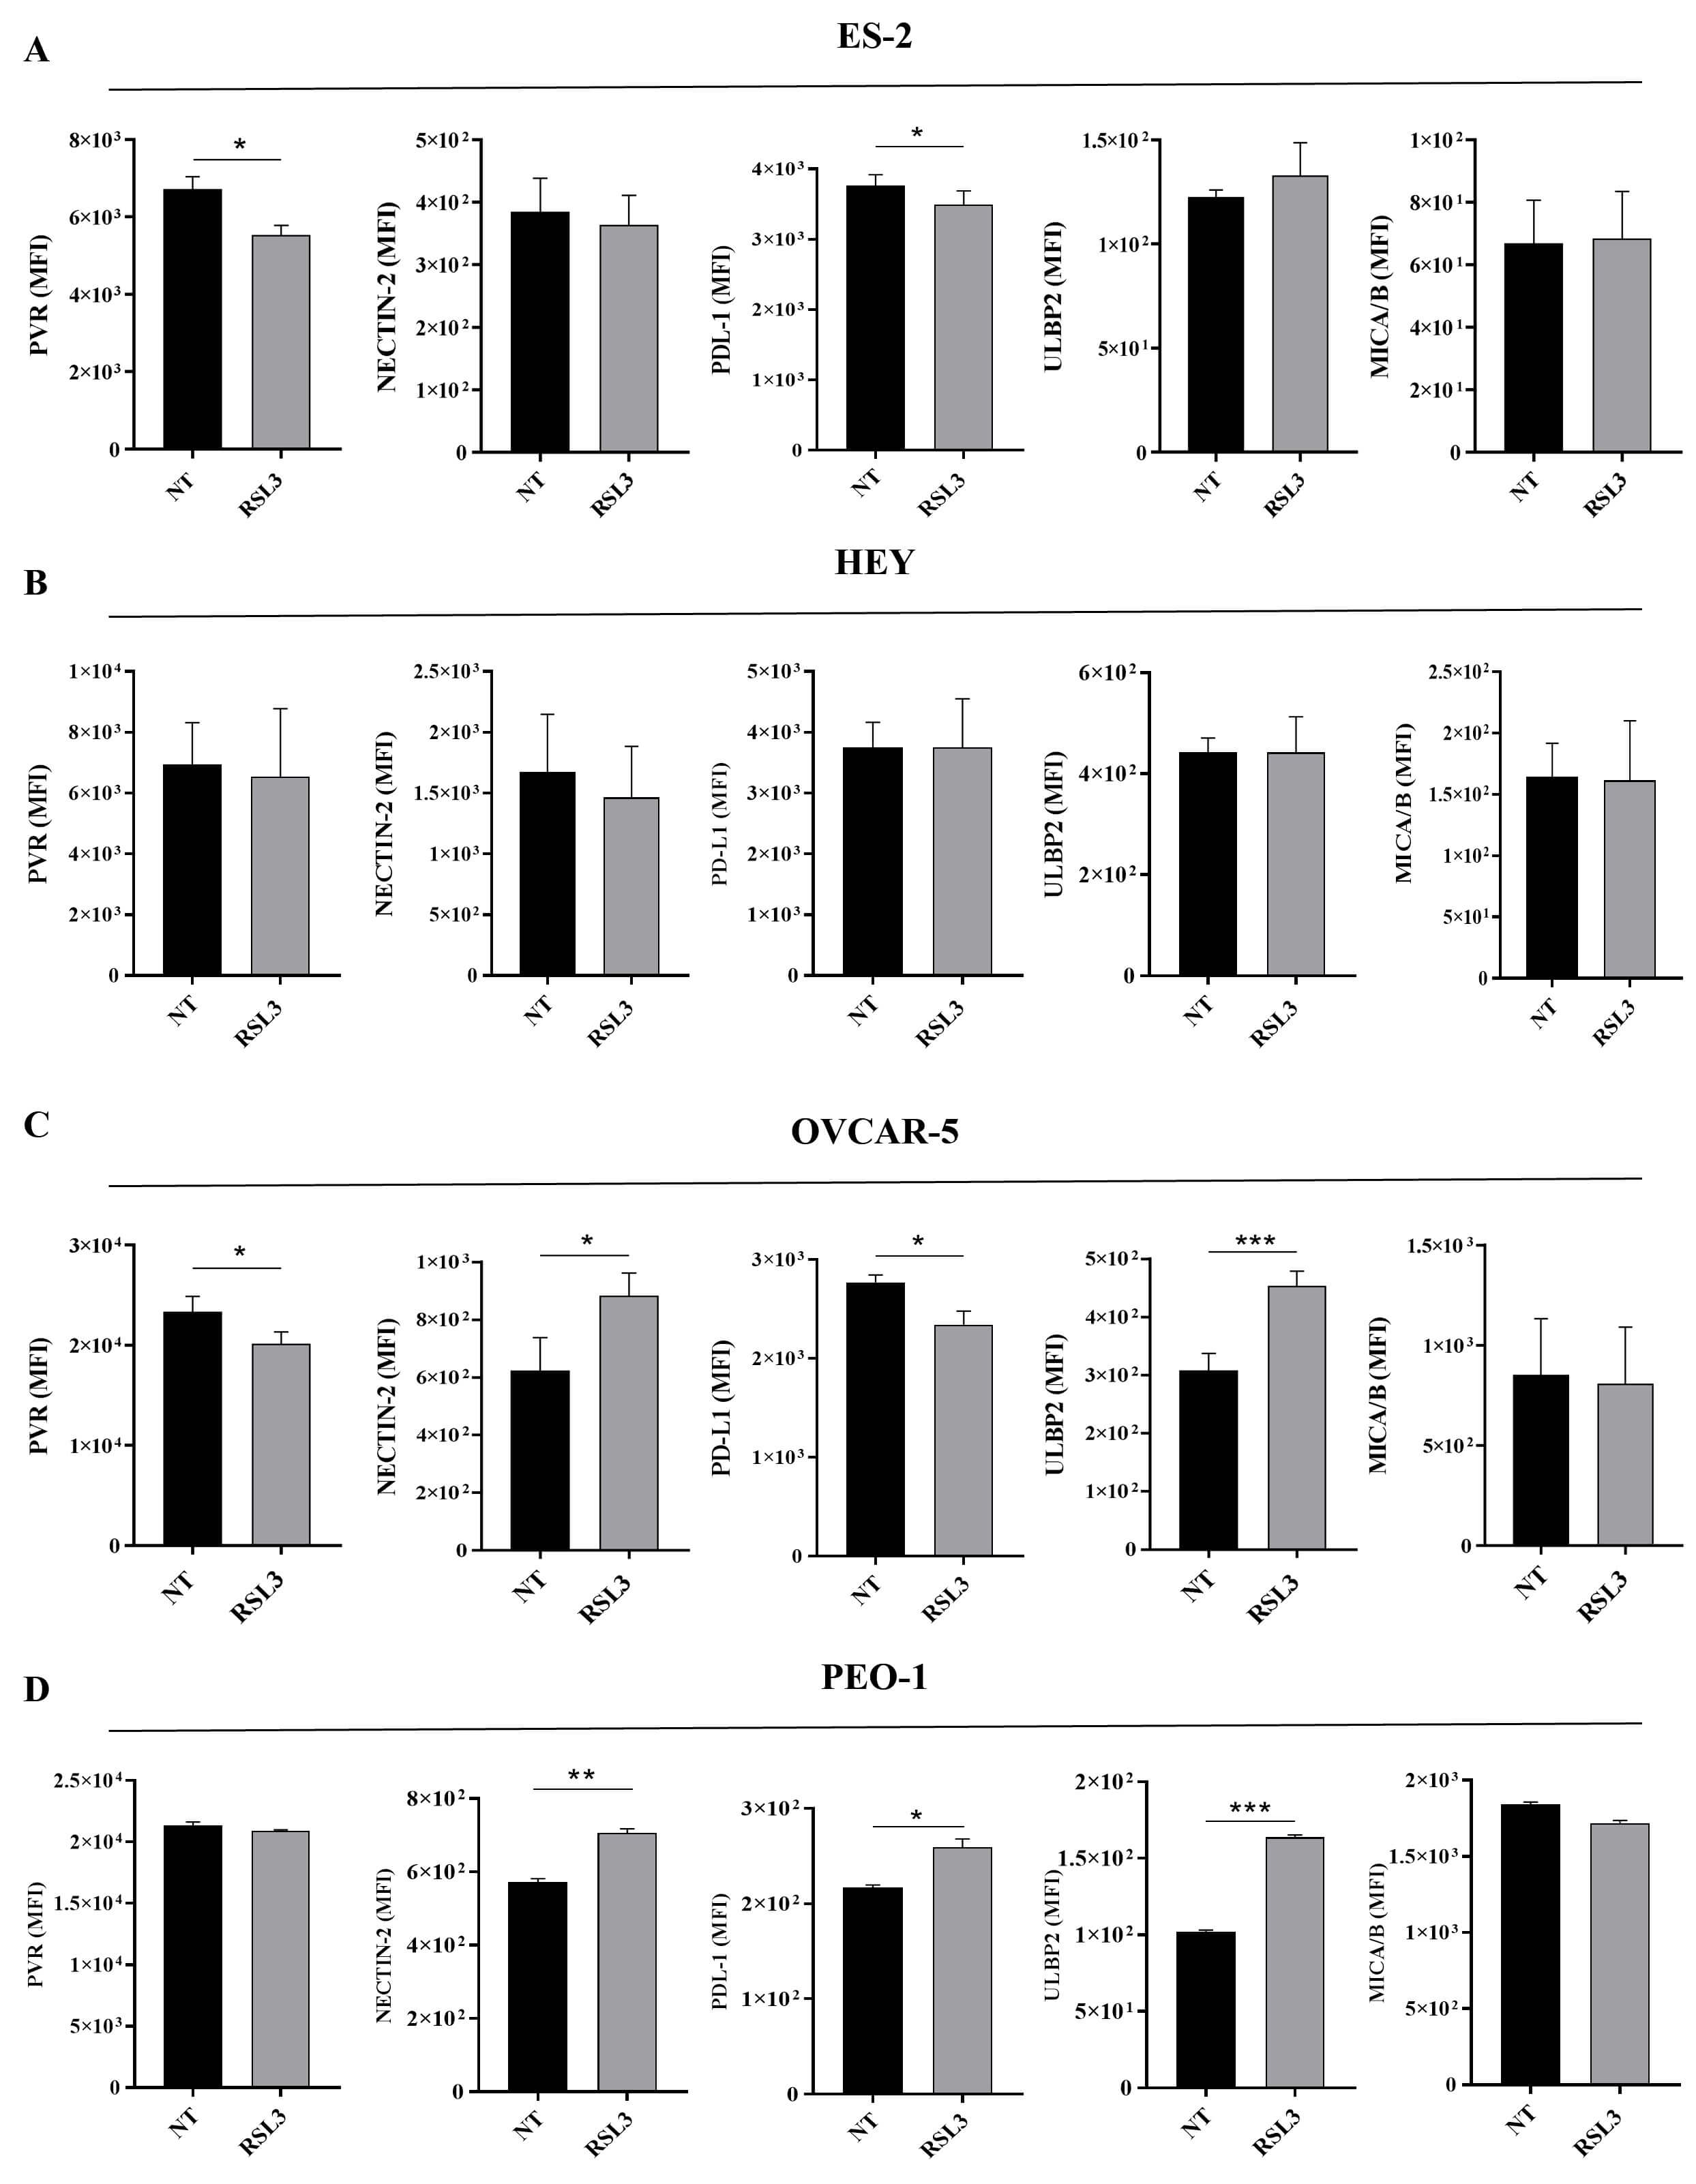 Fig. 5.
RSL3 modulates the expression of NK activating and inhibiting
molecules on ovarian cancer cell lines. Flow cytometry analysis of PVR,
Nectin-2, PD-L1, ULBP2, and MICA/B molecules expressed on (A) ES-2, (B) HEY, (C)
OVCAR-5, (D) PEO-1 cells was performed. Statistical analysis is reported. All the
experiments were performed in technical and biological triplicates. Data were
represented as means
To determine whether RSL3 treatment influences NK cell-mediated cytotoxicity, we
conducted LDH-release assays using purified NK cells from healthy donors
co-cultured with HGOC cells at different E:T ratios (Fig. 6). The results
demonstrated variable susceptibility among RSL3-treated ovarian cell lines. ES-2
and PEO-1 exhibited minimal lysis (Fig. 6A,D). HEY cells showed a decreased
lysis compared to untreated cells (Fig. 6B). Conversely, OVCAR-5 cells displayed
a significant increase in NK cell killing following RSL3 treatment (RSL3-treated
vs NT: 1.34
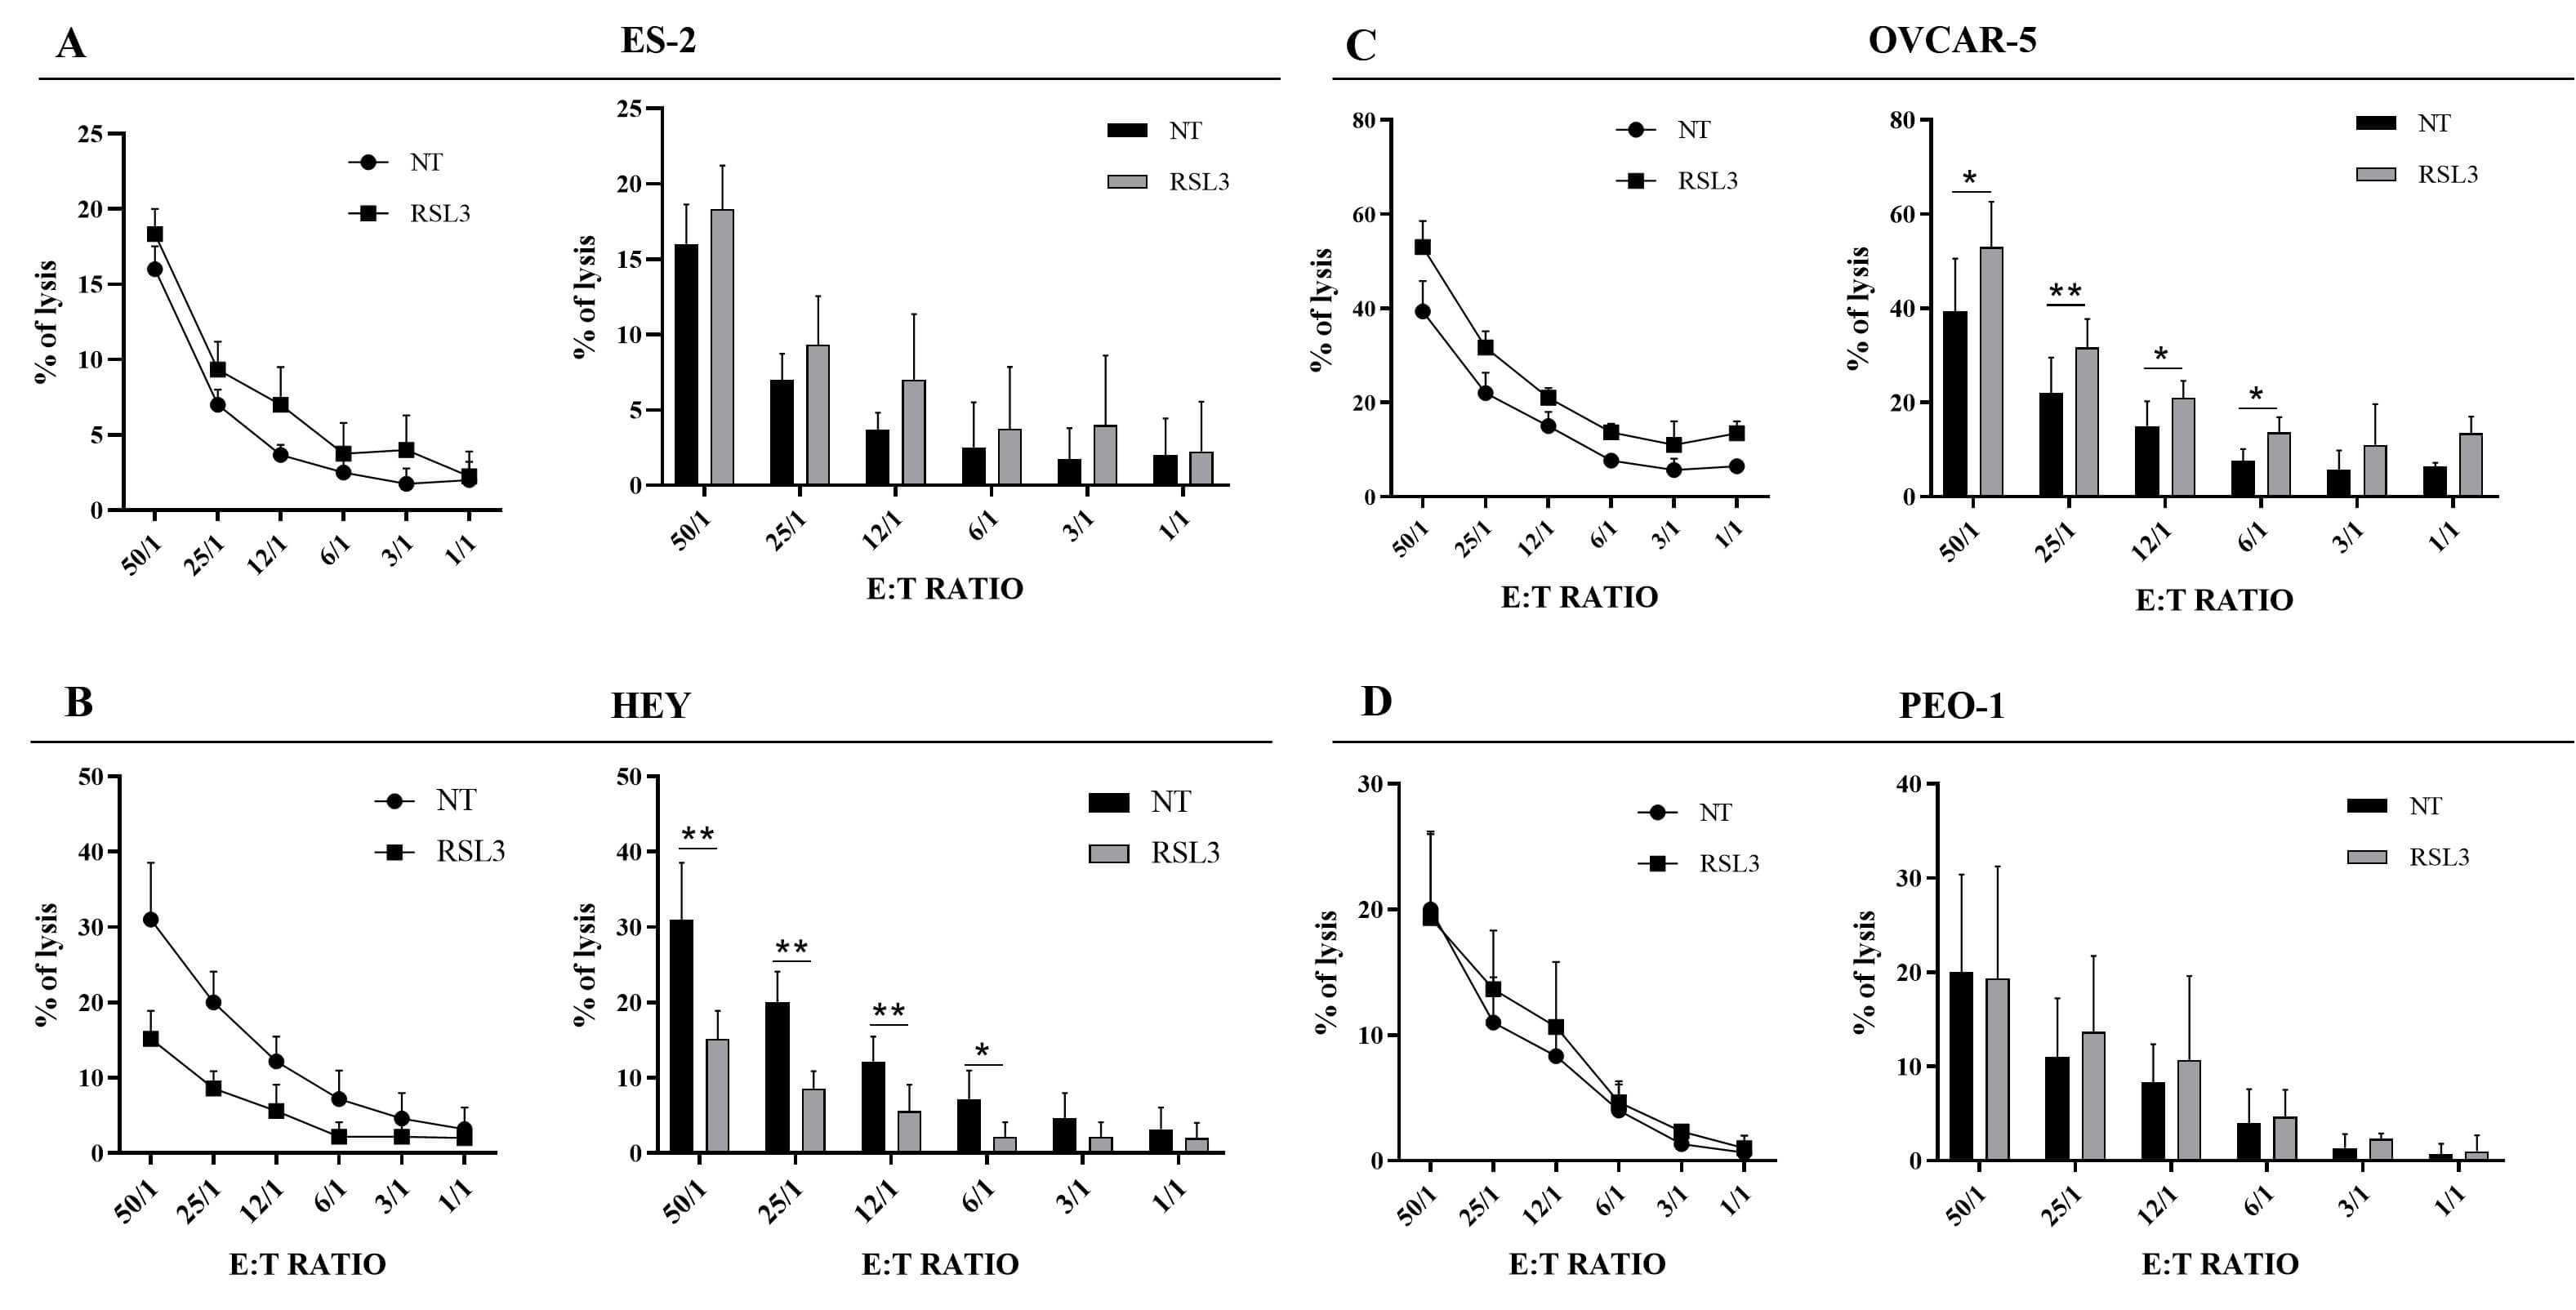 Fig. 6.
Susceptibility of RSL3-treated HGOC cell lines to NK
cell-mediated killing. Representative experiment (left panel) and statistical
analysis (right panel) of cytotoxicity assay against untreated (NT) and
RSL3-treated cells are reported. Purified NK cells were used as effector cells.
(A) ES-2 were treated with 50 nM of RSL3 for 24 hours. (B) HEY were treated with
1 µM of RSL3 for 24 hours. (C) OVCAR-5 were treated with 5
µM of RSL3 for 24 hours. (D) PEO-1 were treated with 5
µM of RSL3 for 24 hours. Different E:T ratio show the percentage of
NK cell lysis of untreated and RSL3-treated cells. All the experiments were
performed in technical and biological triplicates. Data were represented as means
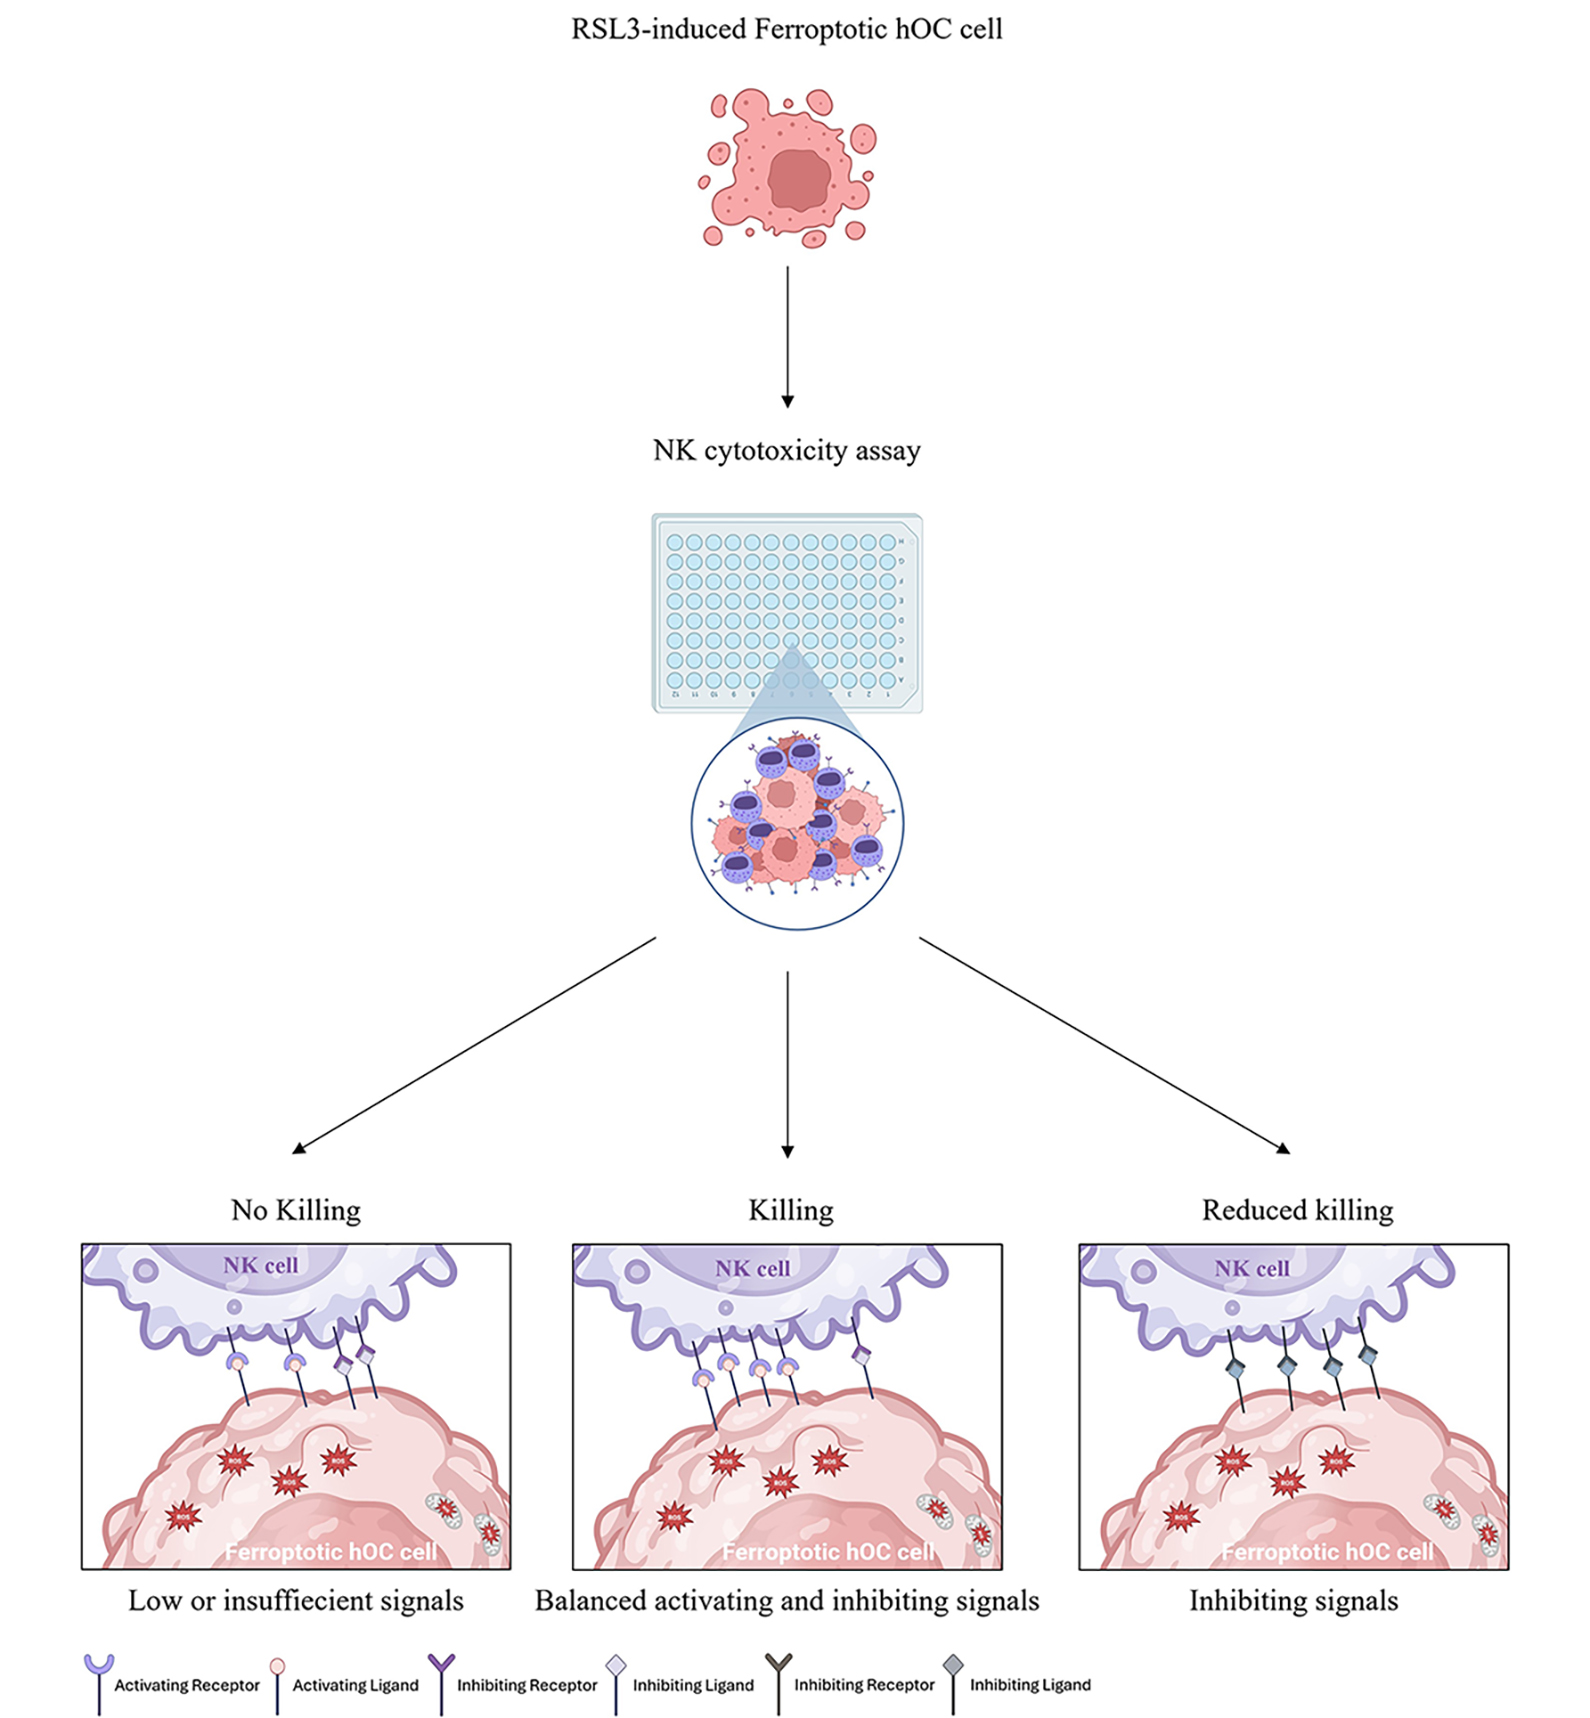
Conversely, the absence or insufficient modulation of ligands on ES-2, HEY, and PEO-1 cells results in impaired lysis, leading to either a lack of response or a reduced NK cell-mediated lysis.
In summary, these findings indicate that while RSL3-induced ferroptosis modulates the expression of immune ligands, it alone is insufficient to consistently elicit NK cell-mediated cytotoxicity across all HGOC cell lines.
The ability of Natural Killer cells to suppress tumors depends on receptor-ligands interaction with molecules displayed on cancer cell membranes [16]. Cancer cells can escape anti-tumor immunity through reduced expression of immune receptors, release of cytokines and soluble immunosuppressive factors, and inhibition of cytotoxic lymphocytes within the TME [14]. The immunosuppressive ovarian TME reduces NK cells’ cytotoxic capability and limits the efficacy of immunotherapy, with a percentage of patients developing relapses [8, 9, 10, 22].
Ferroptosis, a novel identified mechanism of iron-driven cell death, may represent a new and interesting mechanism that makes cancer cells more easily recognizable by the immune system [34, 35, 36], as observed in hepatocellular carcinoma [48]. FINs are currently used in preclinical studies to increase the chemosensitivity of HGOC cells [31, 32] and may represent potential pharmacological candidates in ovarian cancer therapy [31, 32, 33, 35]. Based on these observations, we analyzed the effect of RSL3-induced ferroptosis on ovarian cancer cells as a mechanism capable of modulating molecules potentially involved in NK cells–mediated response. First, we identified a minimal dose of RSL3 (Fig. 1) able to induce ferroptosis in HGOC cells through the accumulation of lipid peroxide (Fig. 2) and increased intracellular and mitochondrial ROS formation (Fig. 3). Western blot and qRT-PCR analyses (Fig. 4) shown that in HEY, PEO-1, and OVCAR-5 cells, Nrf2 mRNA and protein levels follow the pattern already reported in the literature: upon RSL3 treatment, a reduction in Nrf2 mRNA is observed together with an increase in its protein levels. This increase is not due to enhanced protein synthesis but rather to protein accumulation resulting from impaired KEAP1-mediated degradation [49]. In contrast, ES-2 cells exhibit a decrease in both Nrf2 mRNA and protein levels. Reduced NRF2 expression implies a diminished ability to activate major antioxidant and detoxification pathways and to maintain redox homeostasis [50]. Flow cytometry analysis (Fig. 3) further demonstrated that, among all cell lines tested, ES-2 cells display a markedly higher increase in intracellular ROS following treatment compared with their basal levels. This pronounced ROS accumulation is consistent with a compromised antioxidant response caused by the lower NRF2 expression. Collectively, these findings indicate that ES-2 cells are intrinsically more susceptible to RSL3-induced ferroptosis (Fig. 1), suggesting that NRF2 may be regulated differently in this specific ovarian cancer cell line. Data also indicates that Fer-1 also reverts cell viability (Supplementary Fig. 2A) and the ferroptotic phenotype as evaluated by reduced lipid peroxides formation and intracellular ROS expression (Supplementary Fig. 2B). No evidence of apoptosis was observed in RSL3-treated HGOC cell lines (Supplementary Fig. 4).
Here, we hypothesized that RSL3-mediated ferroptosis of HGOC cells modulates NK cell surface molecules, resulting in the possibly NK cell-cytotoxic effect. To assess this hypothesis, we performed an immune-phenotype analysis of RSL3-treated and untreated cells and investigated the main molecules involved in the NK cell-mediated regulation: PVR, Nectin-2, MICA/B, ULBP2 and PD-L1. PVR and Nectin-2 interact with DNAX accessory molecule-1 (DNAM-1), while stress-inducible cell surface proteins MICA/B and ULBP2 bind to NK group 2 member D (NKG2D) receptor, both contribute to the activation of NK cells [20, 51, 52]. PVR has high affinity also for TIGIT (T cell immunoreceptor with Ig and ITIM domains), essential for NK cell inhibition [53, 54]. Also, PD-L1, binding with PD-1 receptor (programmed death-1) exerts a significant NK cell inhibition [55, 56].
Our results demonstrated that RSL3 modulates the phenotype of the ovarian cancer
cell lines analyzed. Specifically, RSL3 decreased PVR and PD-L1 expression in
ES-2 (Fig. 5A) and OVCAR-5 cells (Fig. 5C), suggesting a potential role for RSL3
in limiting the pro-tumoral activity of PVR and PD-L1 in HGOC [27, 57, 58, 59, 60, 61]. No
changes in PVR expression were observed in HEY and PEO-1 cells (Fig. 5B,D).
While PD-L1 expression remained unchanged in HEY cells upon RSL3 treatment (Fig. 5B), it was upregulated in PEO-1 cells (Fig. 5D). Additionally, ULBP2 and
Nectin-2 levels were increased in RSL3-treated OVCAR-5 (Fig. 5C) and PEO-1 cells
(Fig. 5D). No significant differences in MICA/B expression were detected across
any of the cell lines tested (Fig. 5). In line with our data, recent studies
indicate that the induction of ferroptosis via iron oxide nanoparticles in
prostate cancer upregulates ULBPs, without affecting MICA/B levels thus enhancing
NK cell-mediated cytotoxicity [62]. Indeed, despite no direct evidence yet links
ferroptosis axes to the regulation of NK-cell ligands, emerging data suggest that
IFN-
Altogether, our data suggests that ferroptosis may regulate NK-cell ligand expression through molecular mechanisms linked to cellular redox homeostasis. Specifically, the level of NRF2 and the resulting oxidative stress appear to dictate which ligands are modulated, with ROS accumulation promoting the upregulation of stress-inducible activating ligands (such as ULBP2 and Nectin-2) while downregulating inhibitory or pro-tumoral molecules (such as PD-L1 and PVR) in a cell line-specific manner. These findings point to a mechanistic pathway in which ferroptosis-driven oxidative stress serves as a central regulator of NK-ligand expression, providing a molecular basis for the interplay between ferroptosis and NK cell-mediated cytotoxicity.
Based on these observations, we next assessed whether RSL3-driven immune-phenotype alterations in HGOC cells influence their recognition by NK cells.
We demonstrated that ES-2 and PEO-1 are less prone to be killed by NK cells both at baseline and after RSL3 treatment (Fig. 6A,D), while a reduction of lysis in RSL3-treated HEY cells was observed (Fig. 6B). These data indicate that the absence or not balanced signals (activating and inhibitory) from ovarian cancer cells may contribute to defective NK cell lysis. The inadequate interactions between activating and inhibiting NK cell receptors and their cognate ligands contribute to failure of NK cells cytotoxicity [25]. In contrast, RSL3-treated OVCAR-5 cells are more susceptible to NK cell lysis (Fig. 6C), due to the diminished expression of PVR and PD-L1 and increased levels of ULBP2 and Nectin-2 on cell membranes. These findings underscore the ability of NK cells to exert cytotoxic effects on ferroptotic ovarian cancer cells (OVCAR-5) in vitro.
However, to fully clarify the therapeutic implications of these findings, in vivo validation using patient-derived NK cells is essential, as it would provide valuable insights into the activity of tumor-infiltrating NK cells.
Notably, in three of the four ovarian cancer cell lines analyzed (ES-2, HEY, and PEO-1), despite clear ferroptosis induction evidenced by lipid peroxidation and intracellular ROS accumulation, consistent modulation of ligands sufficient to trigger NK cell recognition was not observed.
Several mechanistic explanations may underlie this differential response.
First, compensatory inhibitory pathways may be engaged by tumor cells to
counterbalance the pro-immunogenic signals triggered by ferroptotic stress. The
persistent or even upregulated expression of inhibitory ligands such as PD-L1,
HLA-E, could interact with inhibitory receptors on NK cells (e.g., PD-1, NKG2A),
dampening NK cell activation and cytotoxicity. Notably, in PEO-1 cells, PD-L1 was
upregulated upon ferroptosis induction, potentially contributing to an
immunosuppressive mechanism that blunts NK cell-mediated killing. Furthermore,
intrinsic signaling pathways activated in response to ferroptotic stress may
promote the secretion of immunosuppressive cytokines or soluble factors that
impair NK cell function within the TME. These factors might include TGF-
Although our in vitro system cannot fully recapitulate the complexity
of the TME, previous studies suggest that ferroptosis plays a dual role in
shaping tumor immunity. Tumor-associated macrophages (TAMs) and regulatory T
cells (Tregs), relatively resistant to ferroptosis due to the high GPX4
expression, may persist and reinforce immunosuppressive conditions, thus
impairing NK cell–mediated tumor clearance [64, 65, 66]. In contrast, CD8+ T
cell-derived IFN
Taken together, all these considerations emphasize that ferroptosis-induced immunogenicity is not uniform across all tumor cells and is subject to modulation by other mechanisms. Understanding these compensatory inhibitory pathways and tumor-intrinsic factors is crucial to developing combinatorial therapeutic strategies that can overcome immune evasion and harness ferroptosis to potentiate NK cell-mediated anti-tumor immunity.
Ovarian cancer heterogeneity and its immunosuppressive microenvironment contribute to therapeutic resistance and poor prognosis. Our findings show that RSL3-induced ferroptosis modulates NK cell ligand expression in HGOC cells but does not uniformly enhance NK cell–mediated tumor clearance. The in vitro nature of this work limits the ability to fully recapitulate the complexity of the in vivo tumor microenvironment. To address these limitations, future in vivo studies will be conducted using NOD/SCID or NSG mice, which permit engraftment of human HGOC cells and infusion of human NK cells. These models will allow assessment of RSL3’s therapeutic efficacy, alone or combined with NK cell therapy, by monitoring tumor growth, NK cell infiltration, and ferroptosis-related markers (GPX4 downregulation and lipid peroxidation) within the TME. Moreover, these experiments will help assess how ferroptosis induction influences immune cell dynamics and angiogenesis within the tumor microenvironment.
Collectively, our findings provide the first evidence linking ferroptosis to NK cell recognition in ovarian cancer and highlight the potential of ferroptosis-targeting strategies to enhance immune-based therapies and overcome tumor immune evasion.
HGOC, High-grade human ovarian cancer; TME, Tumor Microenvironment; EOC, Epithelial Ovarian Cancer; HGSOC, High-Grade Serous Ovarian Cancer; CCOC, Clear Cell Ovarian Cancer; NK, Natural Killer; ILCs, Innate Lymphoid cells; RCD, Regulated Cell Death; ROS, Reactive Oxygen Species; FINs, Ferroptotic Inducers; RSL3, RAS-Selective Lethal 3; PVR, Poliovirus Receptor; Nectin-2, Nectin-like molecules-2; MICA/B, MHC class I chain-related protein (MIC) A and B; ULBP2, Unique Long 16-Binding Protein 2; PD-L1, Programmed Death-Ligand 1; MFI, Median Fluorescence Intensity; DNAM-1, DNAX Accessory Molecule-1; NKG2D, NK group 2 member D; TIGIT, T cell immunoreceptor with Ig and ITIM domains; PD-1, Programmed Death-1; hEOC, human Epithelial Ovarian Cancer; ATCC, American Type Culture Collection; PI, Propidium Iodide; CMH2DCFDA, 2′-7′-Dichlorodihydrofluorescein diacetate; Fer-1, Ferrostatin-1; PBMCs, Peripheral Blood Monocytes Cells; GAPDH, Glyceraldehyde-3-Phosphate Dehydrogenase; GPX4, Glutathione Peroxidase 4; NRF2, NFE2 Like BZIP Transcription Factor 2; LDH, Lactate Dehydrogenase; E:T ratios, Effector : Target Ratio.
The datasets used and analyzed during the current study are available from the corresponding author on reasonable request.
CG and MCF designed the research study. CG, SS, EV performed the research. AN analysed data, provided help and advice on the collection of buffy coat samples derived from healthy donors. CDM provided Mycoplasma detection KIT and STR profiling of all cell lines used, performed the research and analysed data. CG, SS, FB, BQ and BS analyzed the data. CG, SS, MCF, FB, EV, BQ wrote the manuscript. All authors contributed to editorial changes in the manuscript. All authors read and approved the final manuscript. All authors have participated sufficiently in the work and agreed to be accountable for all aspects of the work.
Informed consent was obtained from all subjects involved in the study. This research follows the Declaration of Helsinki. In accordance with Italian regulations (Legislative Decree 196/2003 as amended by Legislative Decree 101/2018, and EU Regulation 2016/679 – GDPR), this study used residual biological material collected for routine diagnostic purposes. All samples were anonymized prior to analysis. No additional procedures or interventions were performed for research purposes. In line with national regulations, this type of retrospective, anonymized analysis does not require approval from an ethics committee.
We thank Caterina Alessi for providing technical support and the “blood transfusion center” of “Pugliese-Ciaccio Hospital”, Catanzaro, Italy, for providing buffy-coats.
This research received no external funding.
The authors declare no conflict of interest. Given her role as the Guest Editor, Flavia Biamonte had no involvement in the peer-review of this article and has no access to information regarding its peer review. Full responsibility for the editorial process for this article was delegated to Sung Eun Kim.
Supplementary material associated with this article can be found, in the online version, at https://doi.org/10.31083/FBL46641.
References
Publisher’s Note: IMR Press stays neutral with regard to jurisdictional claims in published maps and institutional affiliations.