


 , Alexandros G. Georgakilas 3,*
 , Athanasia Pavlopoulou 1,2,*
1 Izmir Biomedicine and Genome Center, 35340 Izmir, Türkiye
2 Izmir International Biomedicine and Genome Institute, Department of Genomics and Molecular Biotechnology, Dokuz Eylül University, 35340 Izmir, Türkiye
3 DNA Damage Laboratory, Physics Department, School of Applied Mathematical and Physical Sciences, National Technical University of Athens (NTUA), 15780 Athens, Greece
Abstract
Epithelial-mesenchymal transition (EMT) is a fundamental biological process. During EMT, epithelial cells transition to a mesenchymal phenotype, thereby contributing to embryonic development, tissue renewal, and cancer progression. EMT is a well-recognized key driver of tumor invasion and metastasis. However, the transcriptional differences between the physiological and cancer-associated EMT remain incompletely understood.
In the present study, we applied an integrative framework that combined transcriptomic profiling, functional enrichment analysis, and machine learning. The analysis was performed on 89 RNA-sequencing datasets derived from mouse cell lines and tissues, encompassing both normal and malignant contexts. This approach aimed to identify and prioritize genes systematically and signaling pathways associated with EMT.
Differential gene expression and pathway enrichment analyses revealed an over-representation of shared core biological processes related to cell adhesion, cytoskeletal remodeling, and morphogenesis, in both normal and cancer-associated EMT. Nonetheless, cancer-associated EMT exhibited additional enrichment for developmental and neural-related programs, including neurogenesis and gliogenesis. Machine learning models consistently prioritized candidate EMT biomarkers, with greater transcriptional heterogeneity observed in cancer samples.
Collectively, this integrative analysis delineates distinct transcriptional profiles between malignant and physiological EMT. The enrichment of neural-related programs in cancer-associated EMT highlights potential mechanisms that contribute to malignant cellular plasticity. In addition, the analysis identifies candidate biomarkers for future investigation of EMT heterogeneity.
Keywords
- epithelial–mesenchymal transition
- gene expression profiling
- neurogenesis
- gliogenesis
- axonogenesis
- cell plasticity
- cancer
- machine learning
- biomarker discovery
Epithelial-mesenchymal transition (EMT) is a reversible cellular process in which epithelial cells lose polarity, tight junctions, and epithelial morphology. During this process, cells acquire mesenchymal traits that promote motility and invasion [1]. The reverse process, mesenchymal-epithelial transition (MET), reinstates epithelial characteristics such as polarity and cell-cell adhesion. Together, EMT and MET are governed by interconnected signaling pathways and gene regulatory networks. These networks orchestrate the suppression of epithelial markers like E-cadherin and upregulation of mesenchymal markers such as vimentin and fibronectin. EMT is classically categorized in three major biological contexts: development (Type 1), tissue repair and fibrosis (Type 2), and cancer progression (Type 3) [1, 2].
In cancer, EMT promotes tumor cell invasion, dissemination, and therapeutic
resistance. This occurs through the activation of canonical signaling pathways,
including TGF-
Despite its importance, the regulatory mechanisms of EMT remain highly complex and not yet fully delineated. Several key inquiries remain unresolved, including how the tumor microenvironment, extracellular vesicles, and epigenetic modifications influence EMT. Another unresolved question concerns how baseline epithelial and mesenchymal gene expression programs differ between normal and malignant tissues. Large gaps remain in defining the molecular networks that regulate EMT in cancer [6, 9].
Recent studies point to significant similarities between EMT programs and neural developmental processes such as neural crest migration and neurogenesis [2, 10]. Key EMT-associated transcription factors, including Snail and Slug, can activate neural-like gene expression and stemness pathways, especially in gliomas. High-grade gliomas often express both developmental and pluripotency markers, suggesting that cancer cells may activate neural stemness programs that mimic or overlap with EMT [2]. However, it remains unclear whether tumor cells transition fully into mesenchymal states or instead adopt intermediate hybrid phenotypes influenced by neural developmental signals.
Machine learning (ML) approaches have become essential for biomarker discovery in EMT research due to their ability to analyze complex, high-dimensional datasets [11]. Widely used models include Random Forest (RF), Support Vector Machine (SVM), and Artificial Neural Networks (ANNs) [12]. RF is particularly useful for both classification and feature selection, providing feature-importance scores that help identify candidate biomarkers from transcriptomic data [13]. SVM performs well in classifying categorical data [14], while ANNs can recognize complex patterns within large datasets. Collectively, these ML approaches offer strong potential for uncovering key regulators of EMT and improving diagnostic and therapeutic strategies.
The objective of this study was to systematically characterize transcriptional programs associated with EMT and MET across diverse mouse cell line and tissue models. To this end, we integrated large-scale transcriptome data with differential gene expression and functional enrichment analyses to identify genes and biological pathways linked to EMT-related transcriptional dynamics. Additionally, we utilized machine learning models to prioritize candidate genes in both non-malignant and cancerous contexts. By stratifying the datasets into cancer and normal groups, we also sought to explore potential molecular relationships between EMT, cancer progression, and neural-related pathways. Altogether, this integrative approach provides a comprehensive framework for discovering candidate genes and regulatory networks for further investigation in tumor biology and neuronal development.
A comprehensive literature mining of PubMed was conducted up to January 24, 2025, to identify transcriptomic studies relevant to epithelial–mesenchymal transition (EMT) and mesenchymal–epithelial transition (MET). Searches were performed using combinations of the following keywords: (“epithelial–mesenchymal transition” or “EMT”), (“mesenchymal–epithelial transition” or “MET”), (“RNA-Seq” or “RNA sequencing”), (“transcriptome” or “gene expression”), (“E-cadherin” or “CDH1”), and (“ZEB1 knockdown” or “ZEB1 suppression”), following the PRISMA (Preferred Reporting Items for Systematic Reviews and Meta-Analyses) guidelines [15] (Fig. 1). In parallel, the NCBI Gene Expression Omnibus (GEO) DataSets repository (https://www.ncbi.nlm.nih.gov/gds/) was searched in order to retrieve relevant RNA sequencing (RNA-Seq) datasets. This strategy yielded 179 mouse RNA-Seq datasets associated with EMT and 286 datasets associated with MET across public repositories. Following manual screening of study descriptions, model systems, and experimental relevance, 190 datasets meeting the predefined inclusion criteria were selected (Fig. 1). After transcriptomic processing - including quality control, read alignment, and differential expression analysis - each dataset was evaluated based on the expression patterns of key EMT/MET markers, including CDH1, SNAI1 (Snail), ZEB1, and CDH2. Datasets that did not exhibit significant changes in at least two marker genes, or contained fewer than two biological replicates per condition were excluded from further analysis. Comprehensive metadata were compiled to ensure consistency across datasets. These included organism, cell line or tissue of origin, sample type, cancer status, experimental group, library layout, sequencing platform, and treatment conditions. In total, 89 RNA-Seq datasets were deemed eligible for further investigation (Supplementary Table 1).
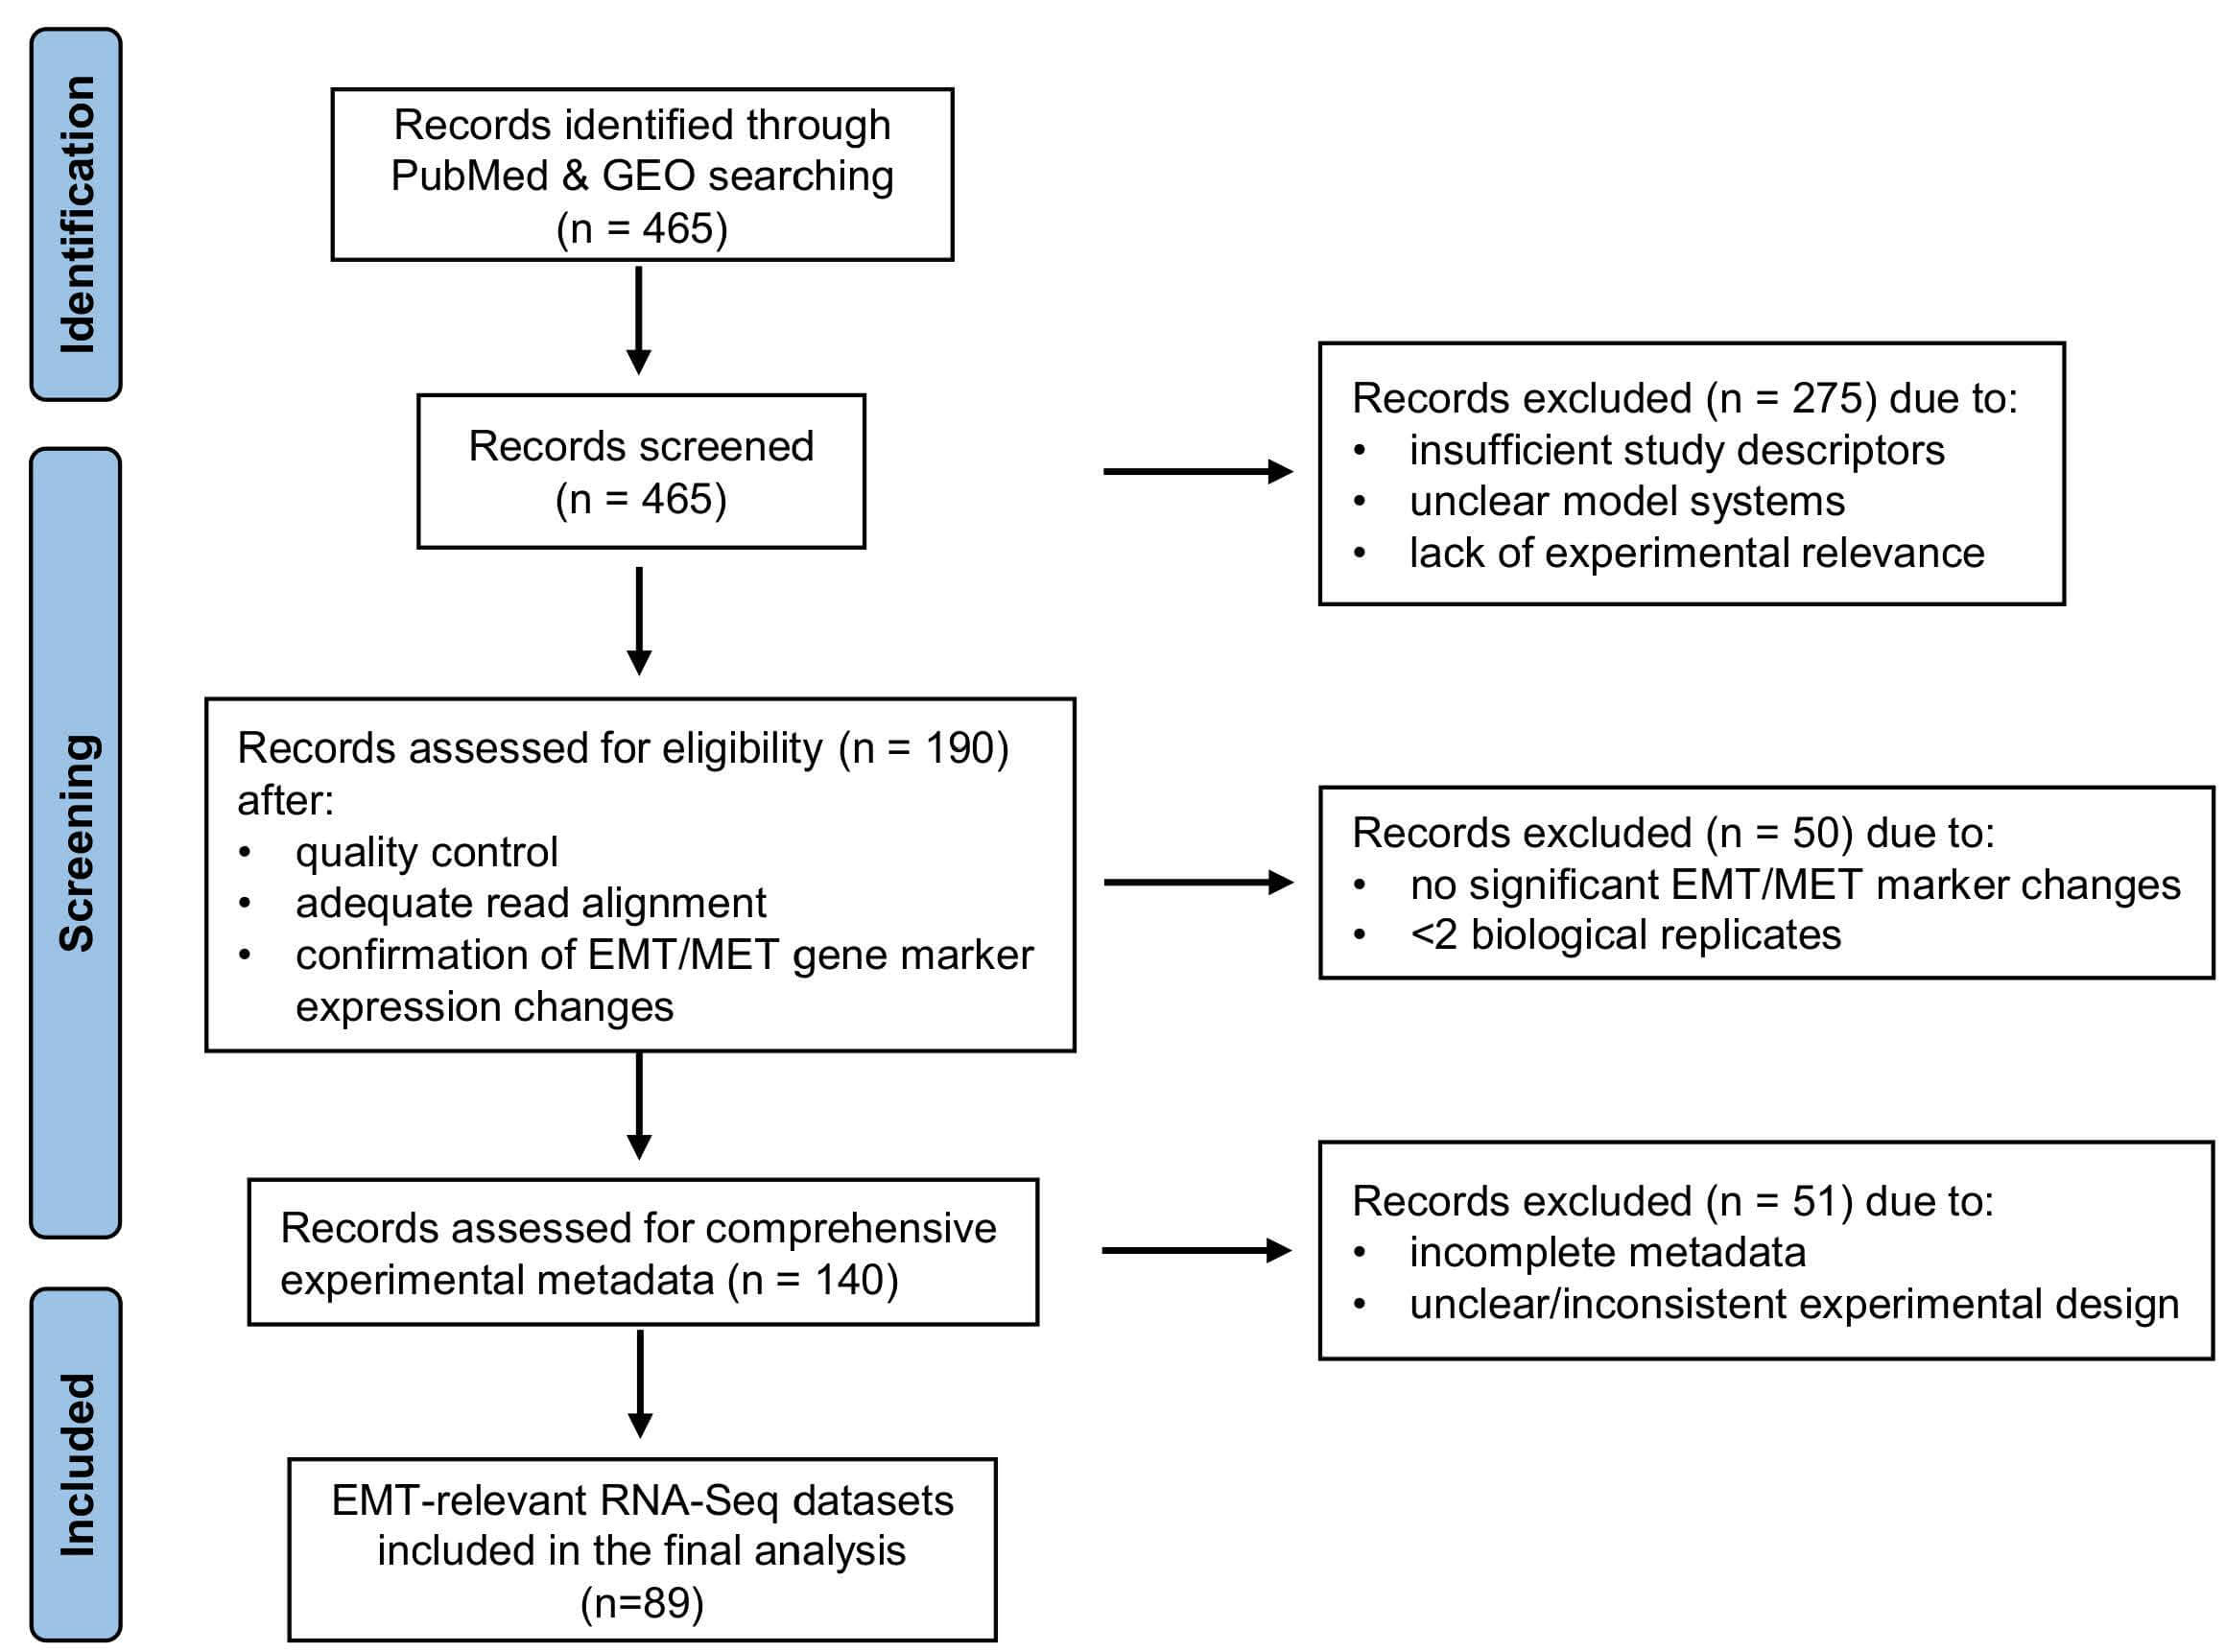 Fig. 1.
Flowchart of the transcriptomic study selection process. GEO, Gene Expression Omnibus; EMT, epithelial-mesenchymal transition; MET, mesenchymal-epithelial transition.
The curated RNA-Seq datasets were categorized into four groups based on
biological origin: cancer cell lines (n = 21), cancer tissues (n = 12), normal
cell lines (n = 39), and normal tissues (n = 17). This grouping was guided by
experimental and biological metadata to minimize treatment-related effects and
emphasize intrinsic differences in EMT programs across malignant and normal
contexts. Raw RNA-Seq data were downloaded from NCBI GEO via the Sequence Read
Archive (SRA) Toolkit v.3.0.0 (available at https://github.com/ncbi/sra-tools)
using the fasterq-dump utility. The raw RNA-Seq reads underwent quality
assessment and preprocessing, including adapter trimming, and filtering out
low-quality reads and contaminants using FastQC and Trimmomatic [16].
High-quality reads were aligned to the Mus musculus reference genome
(GRCm39) using HISAT v2.2.1 [17]. Datasets exhibiting poor alignment (
Gene annotation was performed using a customized GTF file (gencode.vM23) in
which version numbers were removed and duplicate entries were filtered out by
retaining only unique gene IDs. FPKM values were merged with gene annotations to
generate a unified expression matrix. Raw count data were formatted for
downstream analysis using the edgeR package v3.40.0 within the R computation
environment v4.4.1 (https://www.r-project.org). Counts were normalized using the
TMM (trimmed mean of M-values) approach implemented in the edgeR package, and
gene-wise dispersions were estimated with the estimateDisp function.
Differential expression analysis between EMT and MET conditions was performed
separately for each dataset using the exactTest function. Those genes
with an absolute log2-fold change (
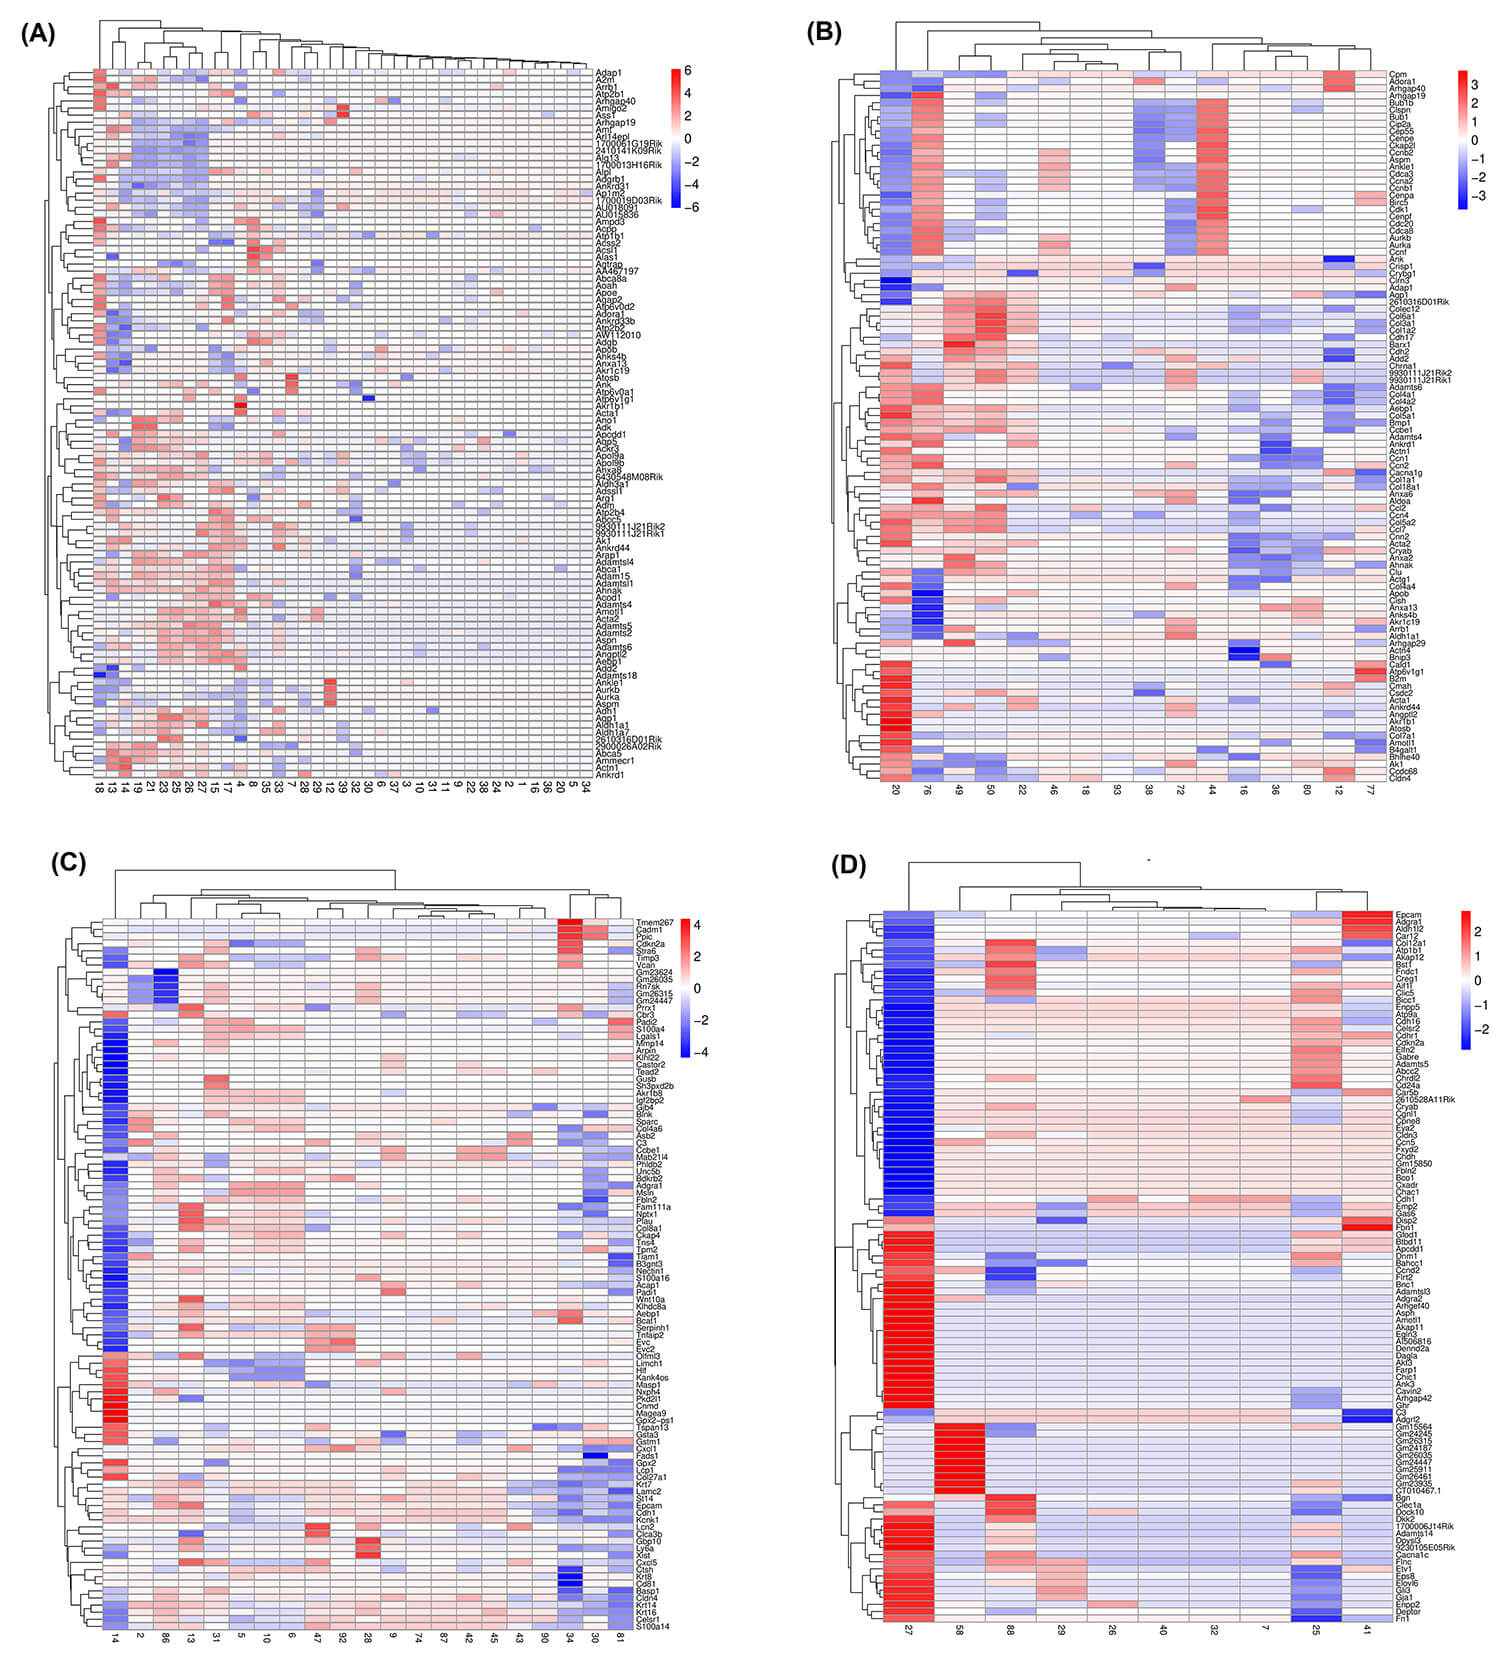 Fig. 2.
Heatmaps of the top 100 differentially expressed genes between mesenchymal and epithelial states. (A) normal cells (n = 39), (B) normal tissues (n = 17), (C) cancer cells (n = 21), and (D) cancer tissues (n = 12). Each row represents a gene, and each column corresponds to a sample. Up- and downregulated genes are shown in red and blue, respectively. A dendrogram depicting hierarchical gene clustering based on Euclidean distance is shown on the left.
To ensure that the selected datasets represented bona fide EMT and MET
states, a marker-based validation strategy was applied. Specifically, the
expression patterns of canonical epithelial and mesenchymal markers, including
CDH1 (E-cadherin), CDH2 (N-cadherin),
VIM (Vimentin), and SNAI2 (Slug), were
evaluated. Datasets were retained only if they displayed decreased expression of
epithelial markers (e.g., CDH1) alongside increased expression of
established mesenchymal markers (e.g., CDH2, VIM,
SNAI2). A threshold of
To elucidate the biological relevance of DEGs, gene set enrichment analysis was
performed using the clusterProfiler v4.8.1 in R. Over-representation analysis was
applied to identify significantly enriched Gene Ontology (GO) Biological Process
(BP) terms within each gene list. GO BP terms describe coordinated, multi-step
biological programs (e.g., EMT, cell cycle progression, apoptosis), making them
particularly suitable for the interpretation of transcriptomic data. In addition,
GO BP annotations are organism-agnostic and provide interpretable, biologically
meaningful insights across experimental contexts [19, 20]. The reference gene set
was defined based on gencode.vM23 annotations. The raw p-values were
corrected for multiple testing using the Benjamini-Hochberg method; GO terms with
adjusted p-values
EMT enrichment scores were calculated using the GSVA package in R (v4.4.1) (https://www.bioconductor.org/packages/release/bioc/html/GSVA.html) Log-transformed TPM matrices were used as input, and EMT gene sets were evaluated using the gsvaParam() function with a Gaussian kernel. The EMT gene set was based on the 76-gene EMT-signature score [21], obtained from a publicly available repository (https://github.com/sushimndl/EMT_Scoring_RNASeq/tree/master/Gene_signatures/76GS). GSVA enrichment scores were subsequently averaged across samples to generate a single EMT score for each dataset.
For the machine learning analysis, DEGs were compiled from the 89 RNA-Seq datasets, capturing epithelial-to-mesenchymal cell transitions across diverse biological contexts in both normal and cancer cells and tissues. This comprehensive dataset facilitated a systematic investigation of EMT-associated transcriptional dynamics.
The DEG sets were converted into differential expression (DE) matrices that served as feature spaces for machine learning analysis. RNA-Seq data were imported using pandas, and the sample_id field was parsed to extract phenotype information. To maintain a consistent binary classification scheme, only samples representing epithelial or mesenchymal states were included. The resulting gene expression values formed the feature matrix and the corresponding phenotype labels constituted the target vector. This standardized pipeline generated harmonized inputs suitable for downstream computational modeling and cross-dataset comparisons.
All analyses were conducted in Python v3.9.19 (https://www.python.org/) within a Jupyter Notebook v7.3.2 (https://jupyter-notebook.readthedocs.io/en/v7.3.2/index.html) environment. The machine learning models were implemented to classify EMT states and to prioritize candidate biomarkers. The SVM and RF models were trained and evaluated using scikit-learn. The SVM was configured with a radial basis function (RBF) kernel to capture non-linear complex decision boundaries between EMT states, and ANNs were constructed and optimized using TensorFlow/Keras. Auxiliary libraries such as NumPy facilitated efficient numerical computations, whereas matplotlib and seaborn were used to visualize classification results, feature importance, and overall model performance.
Feature selection was performed independently for each model based on its inherent importance-estimation strategy. For RF models, features were ranked using impurity-based importance scores. For SVM (linear kernel), coefficients of the decision function were used to derive feature weights. For ANNs, feature contributions were estimated via permutation importance. For each model and dataset, the top 50 ranked genes were retained. Although there was partial overlap among the selected genes, each model also identified distinct feature sets, reflecting differences in their learning mechanisms. For each dataset, the top 50 genes were selected according to their computed importance scores.
Model performance was evaluated on the test datasets, which comprised 30% of the original dataset. Standard classification metrics included Support, Precision, Recall (Sensitivity), F1 Score, and AUC (Area Under the Receiver Operating Characteristic Curve), where the maximum possible value for each metric is 1 (except Support). To mitigate overfitting in the 89-sample cohort, standardized preprocessing was applied. The 1000 most variable genes were retained, and a stratified 70/30 train–test split was implemented. Model training and hyperparameter optimization were restricted to the training subset, with performance assessed exclusively on an unseen hold-out test set.
All scripts used for preprocessing, model training, evaluation, and reproducibility instructions have been made publicly available on GitHub at: https://github.com/IBGBio/EMT-Biomarker-Discovery.
The functional and physical associations among the protein products of the
cancer tissue-associated signature genes were investigated and visualized using
STRING v12.0 (https://string-db.org/) [22], a database of experimentally
supported and predicted protein-protein interactions. A high-confidence
interaction score threshold (
Functional enrichment analysis of the DEGs across all datasets revealed that normal and cancer-associated EMT share core biological processes, yet exhibit distinct, context-specific regulatory features (Fig. 3 and Supplementary Table 2). In cancer tissues, EMT was predominantly related to the developmental and neural-associated pathways, including neurogenesis and regulation of cell adhesion. This pattern suggests a reactivation of embryonic programs that may facilitate tissue remodeling, invasion, and metastatic potential [23, 24]. Additional enriched terms, such as epithelial tube morphogenesis, regulation of apoptotic signaling, muscle tissue development, and response to peptide hormones. Together, these findings further highlight the convergence of developmental plasticity and tumor progression [25, 26].
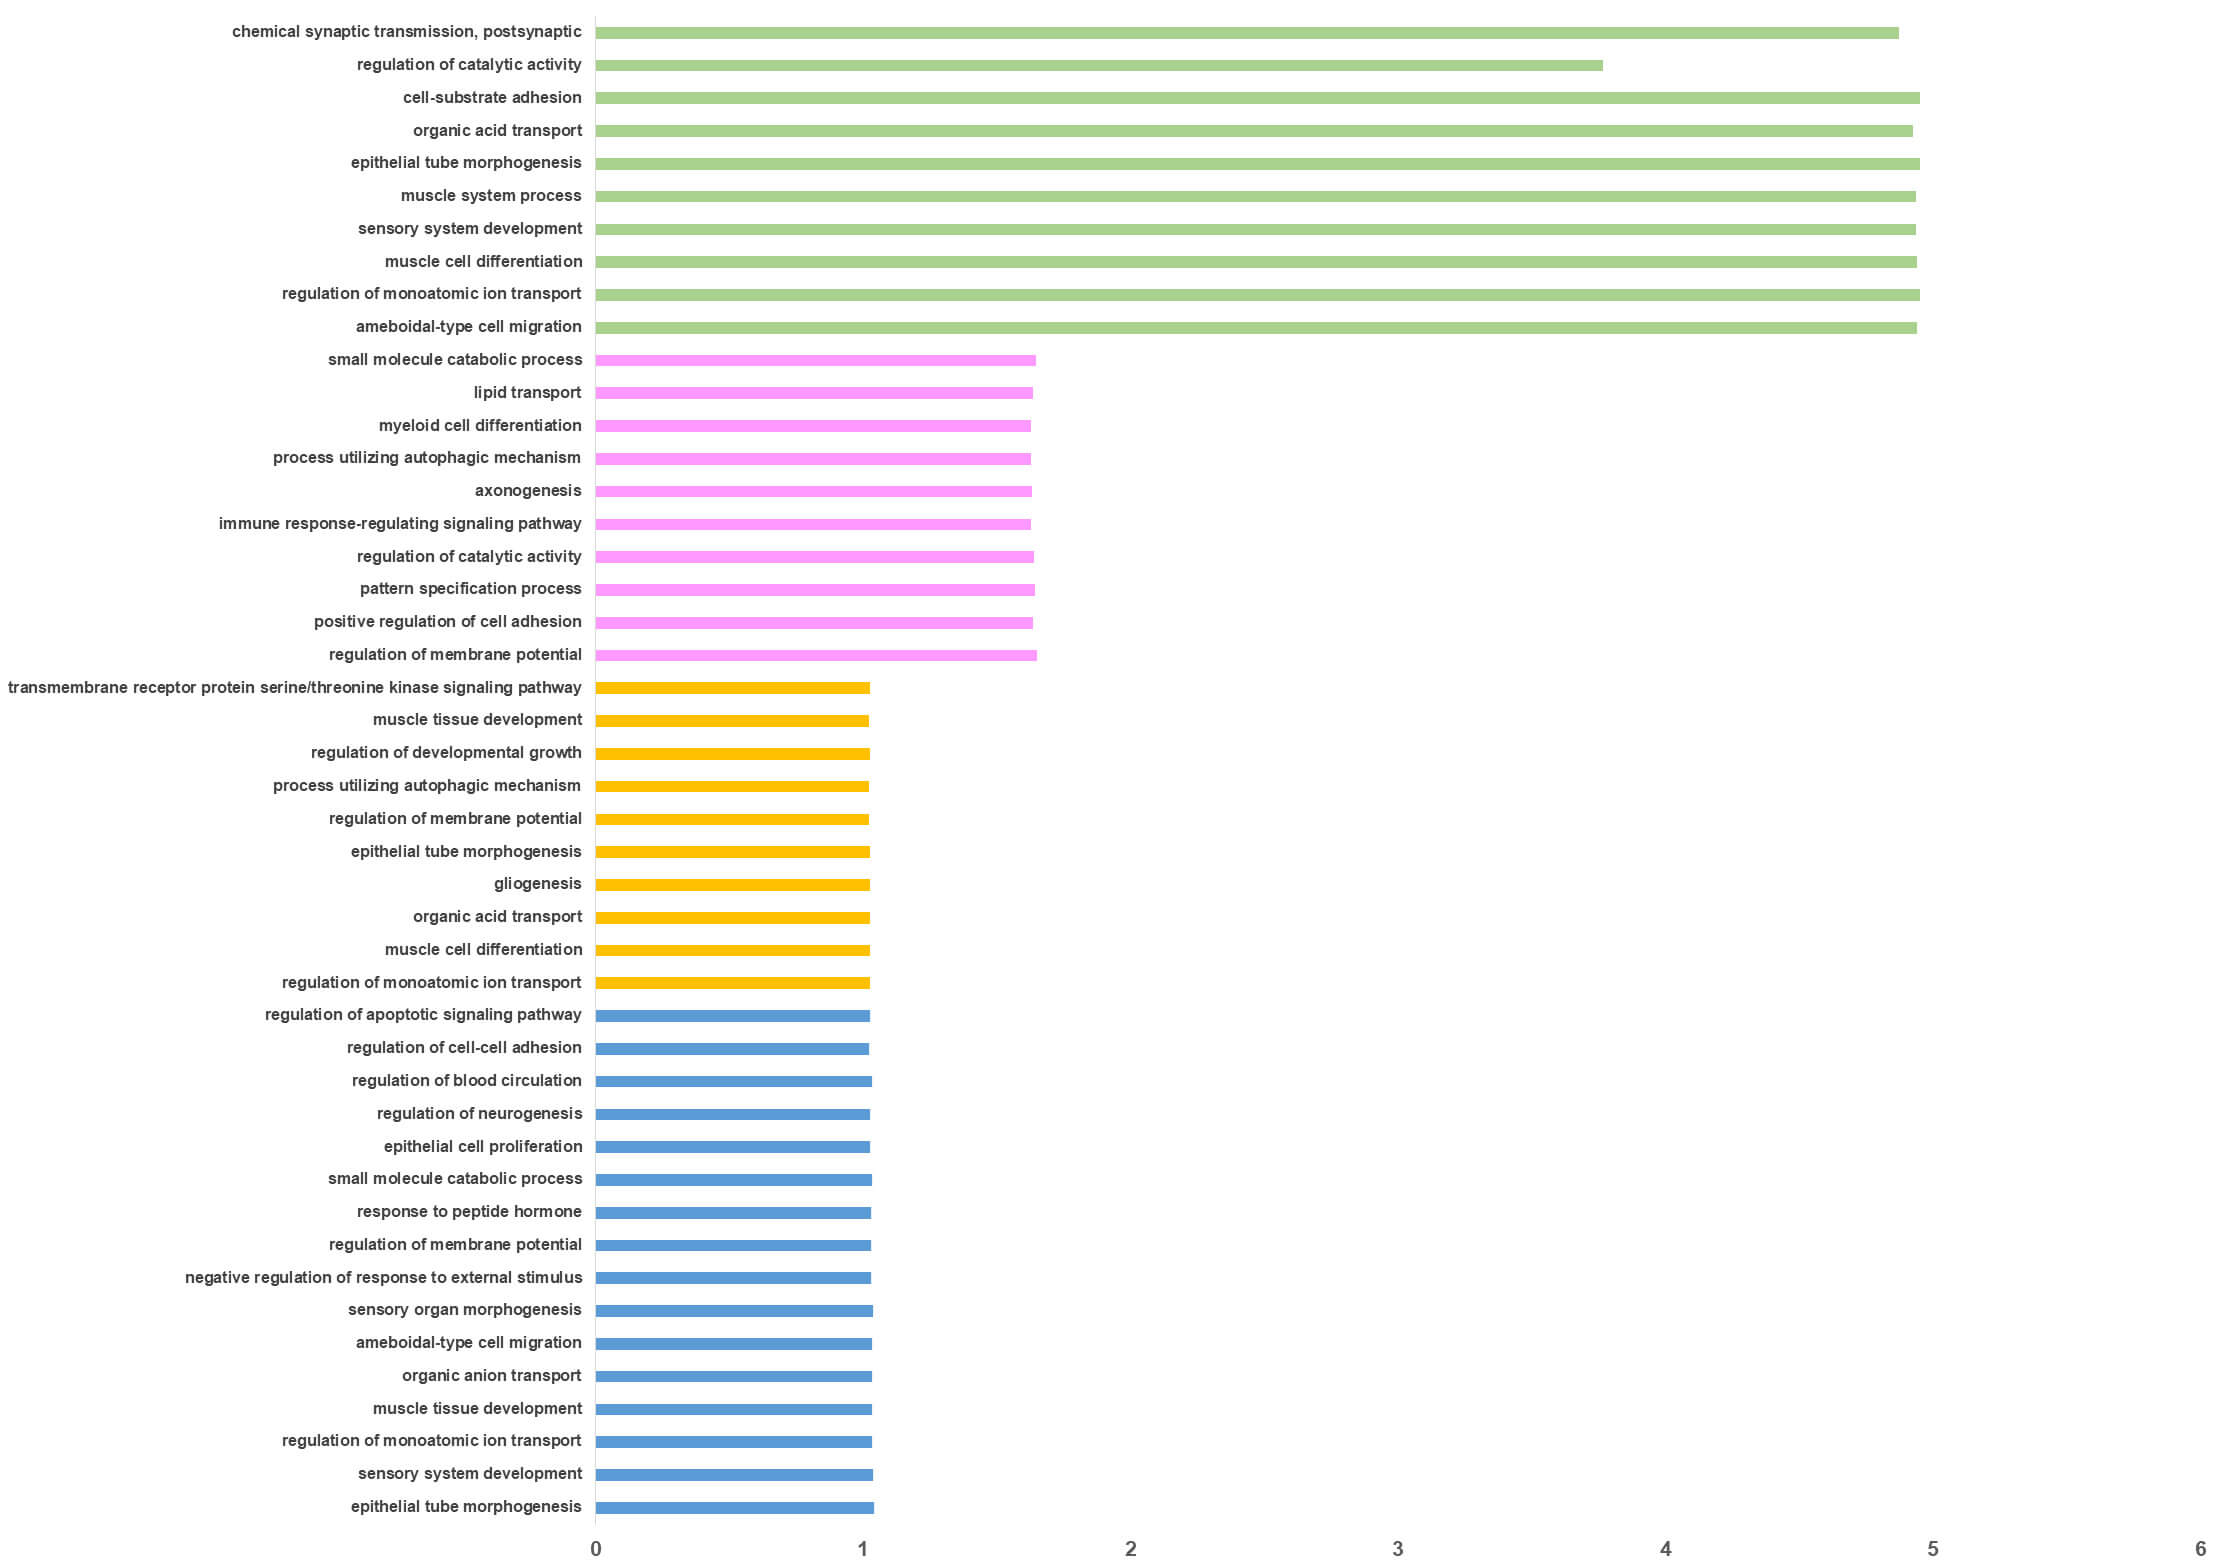 Fig. 3.
Functional enrichment analysis. Overrepresented biological processes in the genes differentially expressed among the four EMT dataset groups, i.e., normal cell lines (green), normal tissue (pink) cancer cell lines (orange) and cancer tissue (blue), are displayed on the y-axis. The x-axis indicates the enrichment ratio, i.e., the ratio between the observed number of genes in each process and the number of expected genes.
Cancer cell models displayed a broadly similar enrichment profile. Over-represented pathways were related to calcium ion transport, cytoskeletal remodeling, and transmembrane receptor signaling. These pathways are consistent with enhanced motility, intracellular communication, and metabolic adaptation during EMT [27, 28, 29]. In contrast, normal epithelial tissues undergoing EMT were enriched for pathways related to physiological regulation and differentiation. These included axonogenesis, immune response-regulating signaling, lipid transport, autophagy, and myeloid cell differentiation, reflecting tightly regulated developmental and homeostatic programs [30, 31] (Fig. 3). Enrichment of epithelial tube morphogenesis, chemical synaptic transmission, cell-substrate adhesion, muscle system processes, and regulation of catalytic activity in normal epithelial cells. These patterns indicate a coordinated remodeling of cellular architecture and communication during physiological EMT [24] (Fig. 3).
Overall, these findings indicate that while EMT in both normal and cancer contexts engages conserved biological programs related to adhesion, morphogenesis, and cytoskeletal dynamics. However, cancer-associated EMT shows a relative enrichment of neural and developmental signaling pathways, suggesting a potential functional link between neurogenesis, cellular plasticity, and malignant transformation.
Supervised machine learning models were employed to identify potential biomarker genes across transcriptomic datasets representing four distinct groups. Three supervised learning algorithms - random forest [13], SVM [14], and ANN [32] - were employed, and each group was analyzed independently. To derive an informative cancer-associated EMT gene signature, models were trained on each group’s datasets. The top 50 predictive genes from each model were compared to assess concordance among algorithms. In general, the ML models could accurately prioritize the most significant genes, as evidenced by the performance metrics shown in Tables 1,2,3,4.
| ML model | Support | Precision | Recall | F1 score | AUC score |
| RF | 47.000000 | 0.894426 | 0.893617 | 0.893617 | 0.955 |
| SVM | 47.000000 | 0.735202 | 0.723404 | 0.720882 | 0.822 |
| ANN | 47.000000 | 0.779555 | 0.765957 | 0.763823 | 0.810 |
ML, Machine learning; RF, Random Forest; SVM, Support Vector Machine; ANN, Artificial Neural Network; AUC, Area Under the Receiver Operating Characteristic Curve.
| ML model | Support | Precision | Recall | F1 score | AUC score |
| RF | 20.0 | 0.708333 | 0.7 | 0.696970 | 0.880 |
| SVM | 20.0 | 0.566667 | 0.55 | 0.52 | 0.780 |
| ANN | 20.0 | 0.708333 | 0.7 | 0.696970 | 0.720 |
| ML model | Support | Precision | Recall | F1 score | AUC score |
| RF | 28.000000 | 0.857143 | 0.857143 | 0.857143 | 0.923 |
| SVM | 28.000000 | 0.762500 | 0.714286 | 0.700535 | 0.500 |
| ANN | 28.000000 | 0.857143 | 0.857143 | 0.857143 | 0.969 |
| ML model | Support | Precision | Recall | F1 score | AUC score |
| RF | 14.000000 | 0.645833 | 0.642857 | 0.641026 | 0.714 |
| SVM | 14.000000 | 0.791667 | 0.642857 | 0.590643 | 0.776 |
| ANN | 14.000000 | 0.577778 | 0.571429 | 0.562500 | 0.531 |
Of note, the SVM model exhibits comparatively modest performance across the evaluation metrics relative to the other ML approaches. This is likely attributed to the fact that SVM is primarily a supervised classification algorithm optimized for sample-level discrimination rather than a statistical framework for gene-level differential expression testing. Therefore, SVM is not ideally suited as a standalone method for DEG prioritization [33, 34].
In addition, the comparatively lower performance observed in Table 4 relative to that obtained for normal cells/tissues and cancer cell lines (Tables 1,2,3) likely reflects the inherent complexity of bulk tumor transcriptomes rather than a limitation of the algorithm itself. Unlike cell lines or relatively homogeneous normal tissues, bulk cancer tissues consist of a heterogeneous mixture of malignant cells, stromal fibroblasts, endothelial cells, and diverse immune cell populations [35]. Signals arising from stromal contamination and immune infiltration can dominate transcriptional profiles. These signals may obscure EMT-associated expression patterns intrinsic to cancer cells [36, 37], challenging in this way sample-level classification. Under these conditions, SVM decision boundaries may be driven primarily by variation in cellular composition rather than by biologically meaningful EMT-related differences, ultimately resulting in reduced discriminatory power.
Several strategies could help mitigate these limitations. Tumor purity adjustment or cell-type deconvolution prior to model training could reduce conflicting signals from non-malignant cells [38]. Incorporating feature selection or pathway-level aggregation [39, 40], instead of individual gene expression values, may further improve model robustness by reducing dimensionality and attenuating noise and biological heterogeneity. Finally, integrating single-cell and/or spatial transcriptomic data [41, 42] could yield more accurate representations of tumor-intrinsic EMT programs. Such integration may also support the development of improved tissue-level classifiers.
The 50 highest-ranked predictive genes derived from RF, SVM and ANN models across cancer cell datasets are shown in Fig. 4. Intersection analysis across the three supervised learning models revealed a core set of 15 genes consistently identified by all methods. These included CTSL, S100A9, BC1, HBA-A1, HBA-A2, KRT8, KRT18, LGALS1, and several mitochondrial genes, i.e., MT-CO3, MT-CYTB, MT-ND3, and MT-RNR1. These mitochondrial genes encode components of the mitochondrial respiratory chain (MT-CO3, MT-CYTB, MT-ND3) or mitochondrial rRNA (MT-RNR1) and are central to oxidative phosphorylation and mitochondrial translation. Altered expression or mutation of mitochondrial genes has been associated with metabolic reprogramming, ROS production, and hypoxia-related signaling, processes that may influence EMT-associated transcriptional programs. Pairwise overlap analysis (Fig. 4) showed substantial agreement between models. Eleven genes shared between RF and SVM, fourteen between RF and ANN, and seventeen between SVM and ANN, indicating complementary predictive performance. Within these intersections, several key EMT- and metastasis-related genes - such as S100A8, KRT5, KRT14, CTSK, LGALS3, and EEF1A1- were recurrently identified. In contrast, S100A4 and MT-ND4 were uniquely detected by the RF model, suggesting potential model-specific sensitivity in capturing cytoskeletal and mitochondrial features associated with EMT progression.
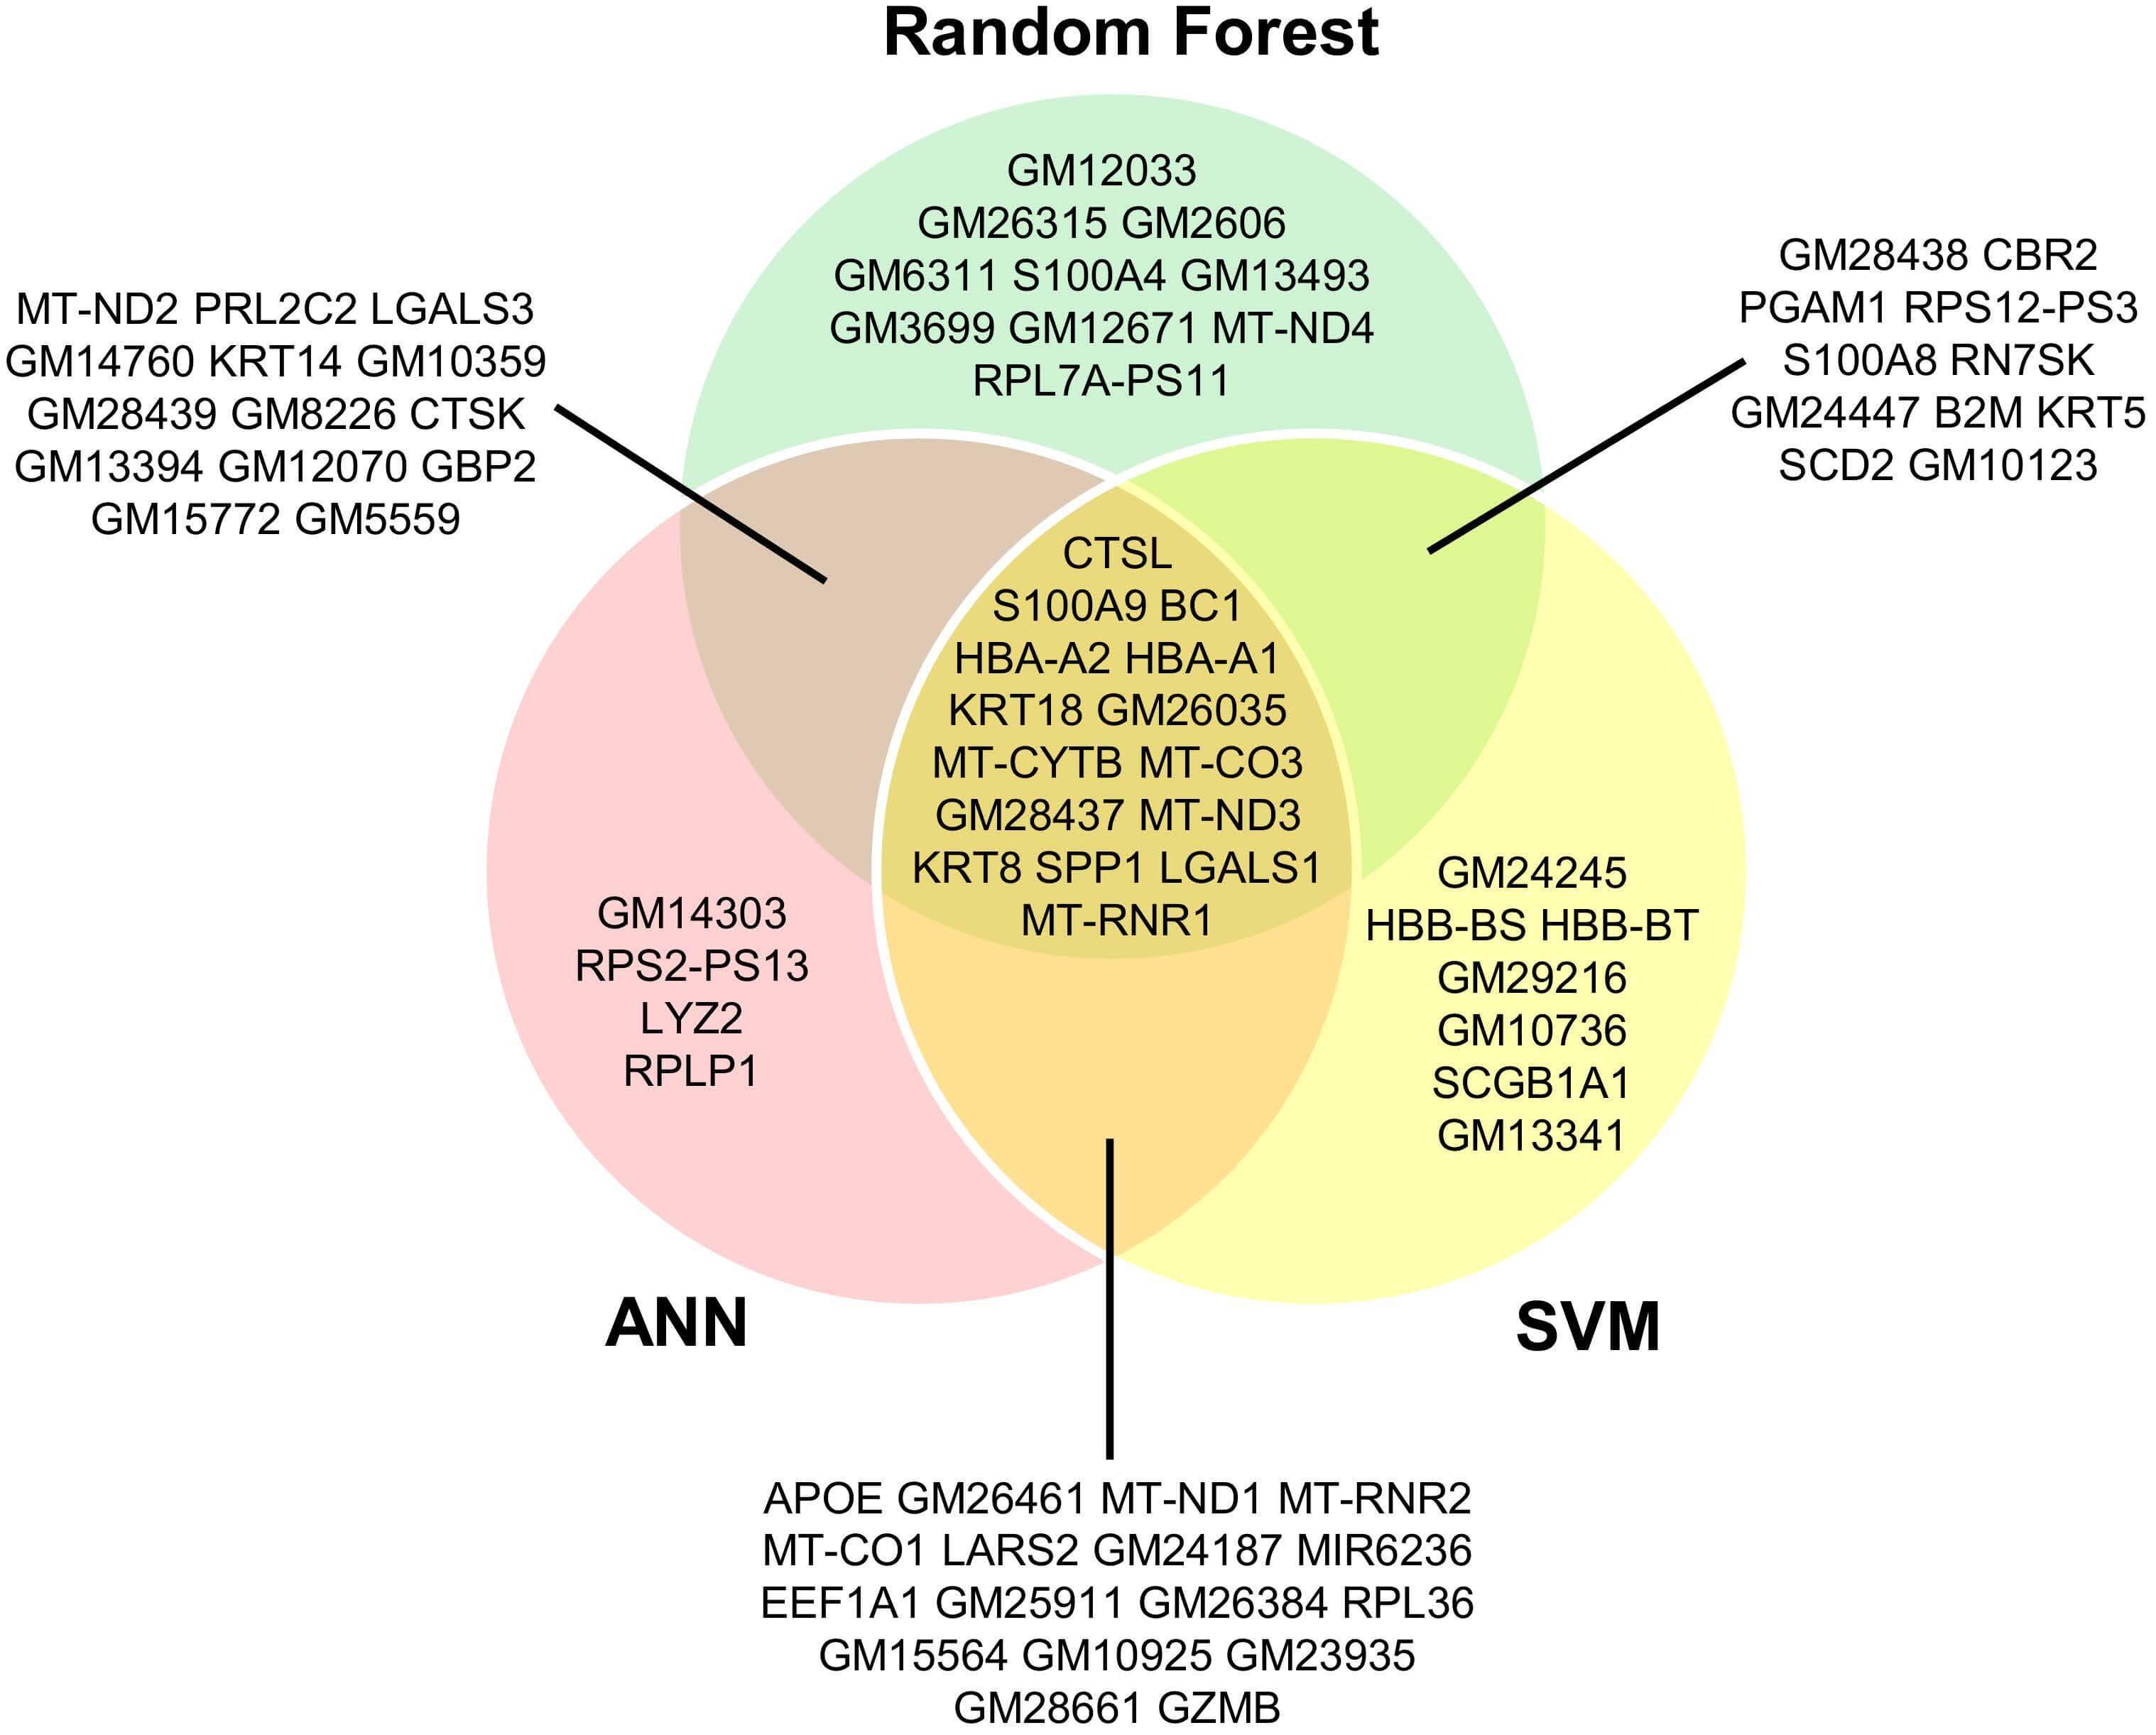 Fig. 4.
Venn diagram illustrating the overlap of the top 50 predictive genes from RF, SVM, and ANN models across distinct cancer cell transcriptomic datasets. Each model was trained independently to capture genes contributing to EMT-associated signatures. Genes shared among multiple models represent candidates for potential biomarker discovery.
To identify biomarkers associated with cancer-related EMT in vivo, the top 50 predictive genes from the three supervised ML models were compared (Fig. 5). This analysis revealed a core set of 15 genes detected by all three models, representing candidates for EMT-related biomarkers. Additionally, each algorithm identified model-specific genes: RF contributed 15 unique genes, SVM 5, and ANN 5. Pairwise overlaps were also observed, highlighting genes shared between two models but not the third, reflecting both shared and distinct predictive features captured by each approach (Fig. 5).
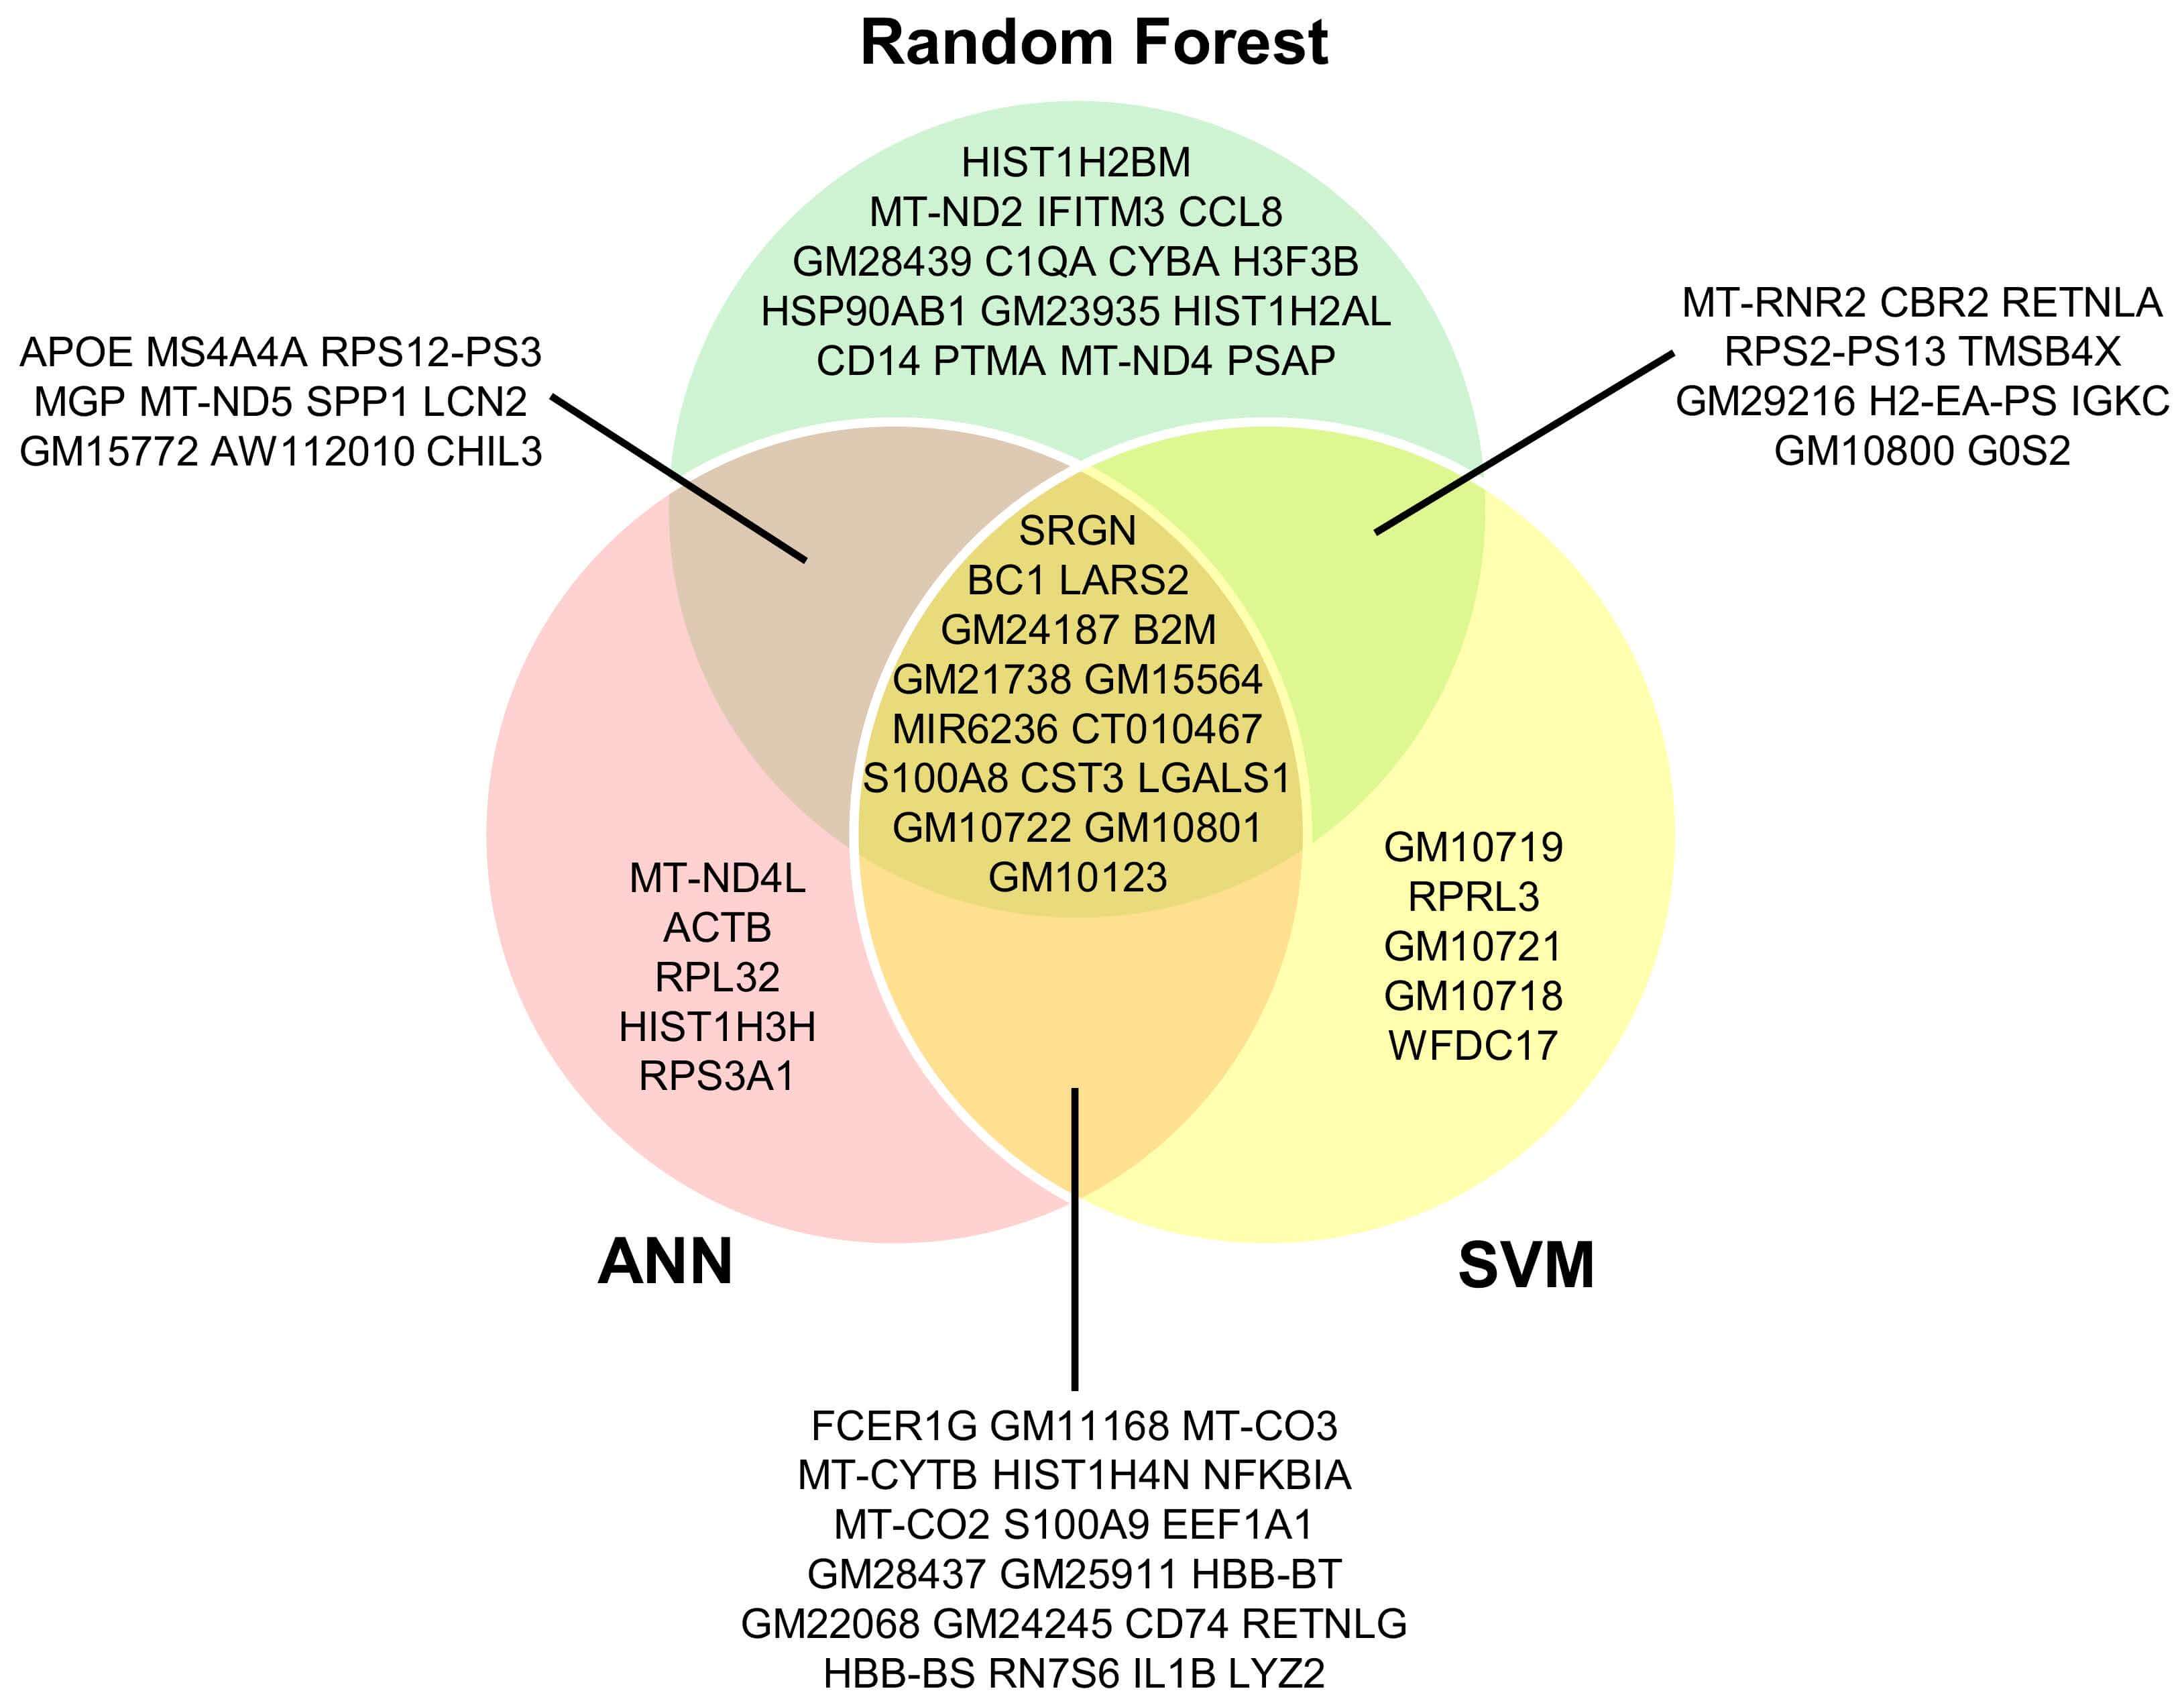 Fig. 5.
Comparative analysis of candidate biomarker genes identified by RF, SVM, and ANN models in cancer tissue. The diagram highlights both genes shared across all models and those unique to each, highlighting core and model-specific candidate biomarkers.
Furthermore, the potential functional synergy among the individual signature genes within a protein-protein interaction network was explored (Fig. 6). The protein products of these genes form a functionally interconnected network, either through direct interactions or indirectly via five putative connector proteins, namely VIM (Vimentin), CD44, GYPC (Glycophorin C), RRAGC (Ras Related GTP Binding C), and LGALS9C (Galectin 9C).
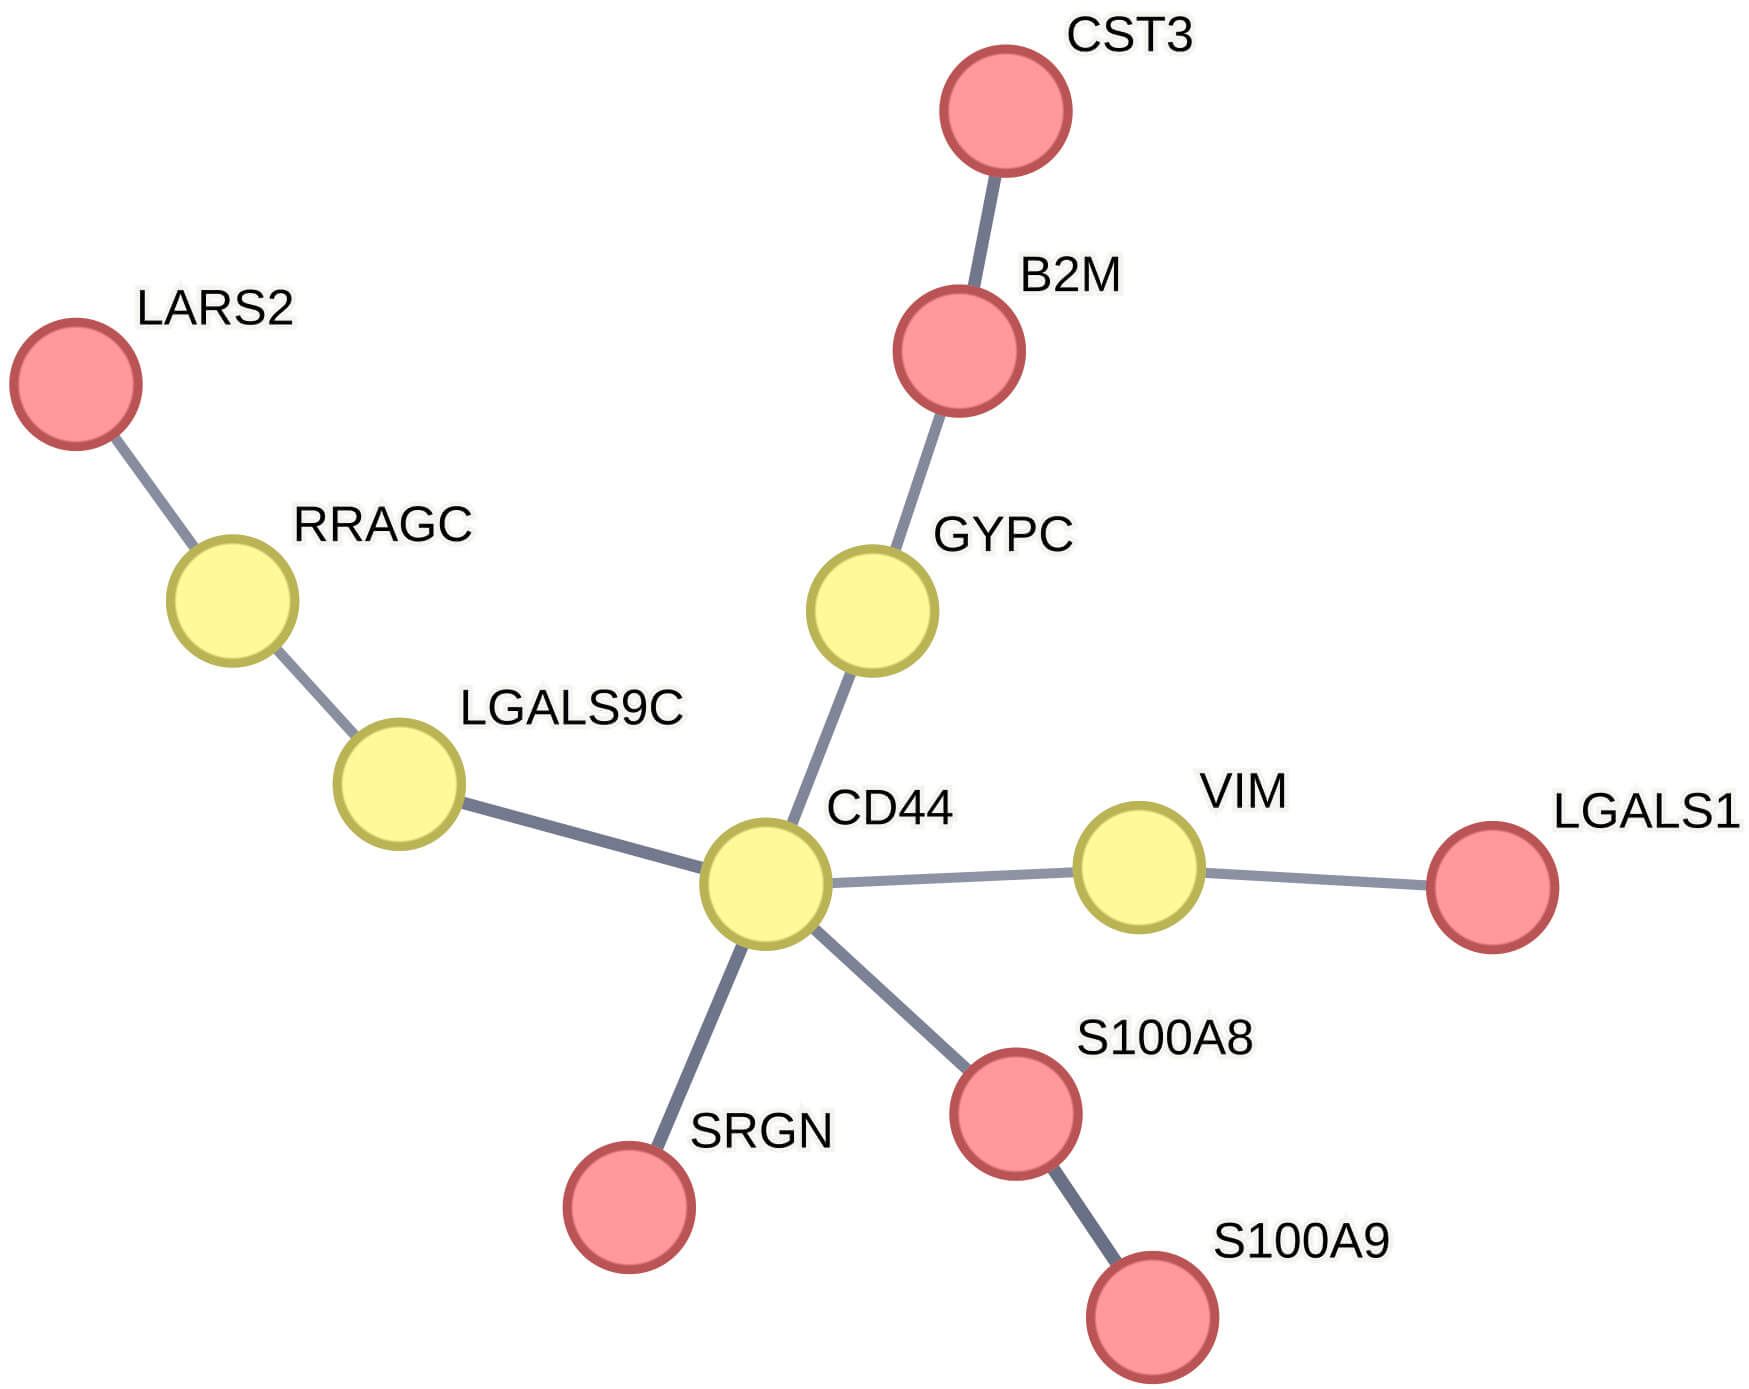 Fig. 6.
Network illustrating the associations among proteins corresponding to the signature genes. Nodes represent proteins, and interactions are indicated by connecting lines. Protein products of the original input signature genes are shown in red, whereas connector proteins are shown in yellow.
Gene sets from RF, SVM and ANN models were compared to explore candidate biomarkers of normal cellular states (Fig. 7). Ten genes were shared across all models, indicating a subset of consistently selected features. Pairwise overlaps were substantial (RF-SVM: 10 genes; RF-ANN: 11 genes; SVM-ANN: 24 genes), including members of the CRY gene family and MT-ND genes. In addition, model-specific signatures were detected (RF: 19; SVM: 6; ANN: 5 genes). These findings highlight both core biomarkers and complementary model-specific candidates.
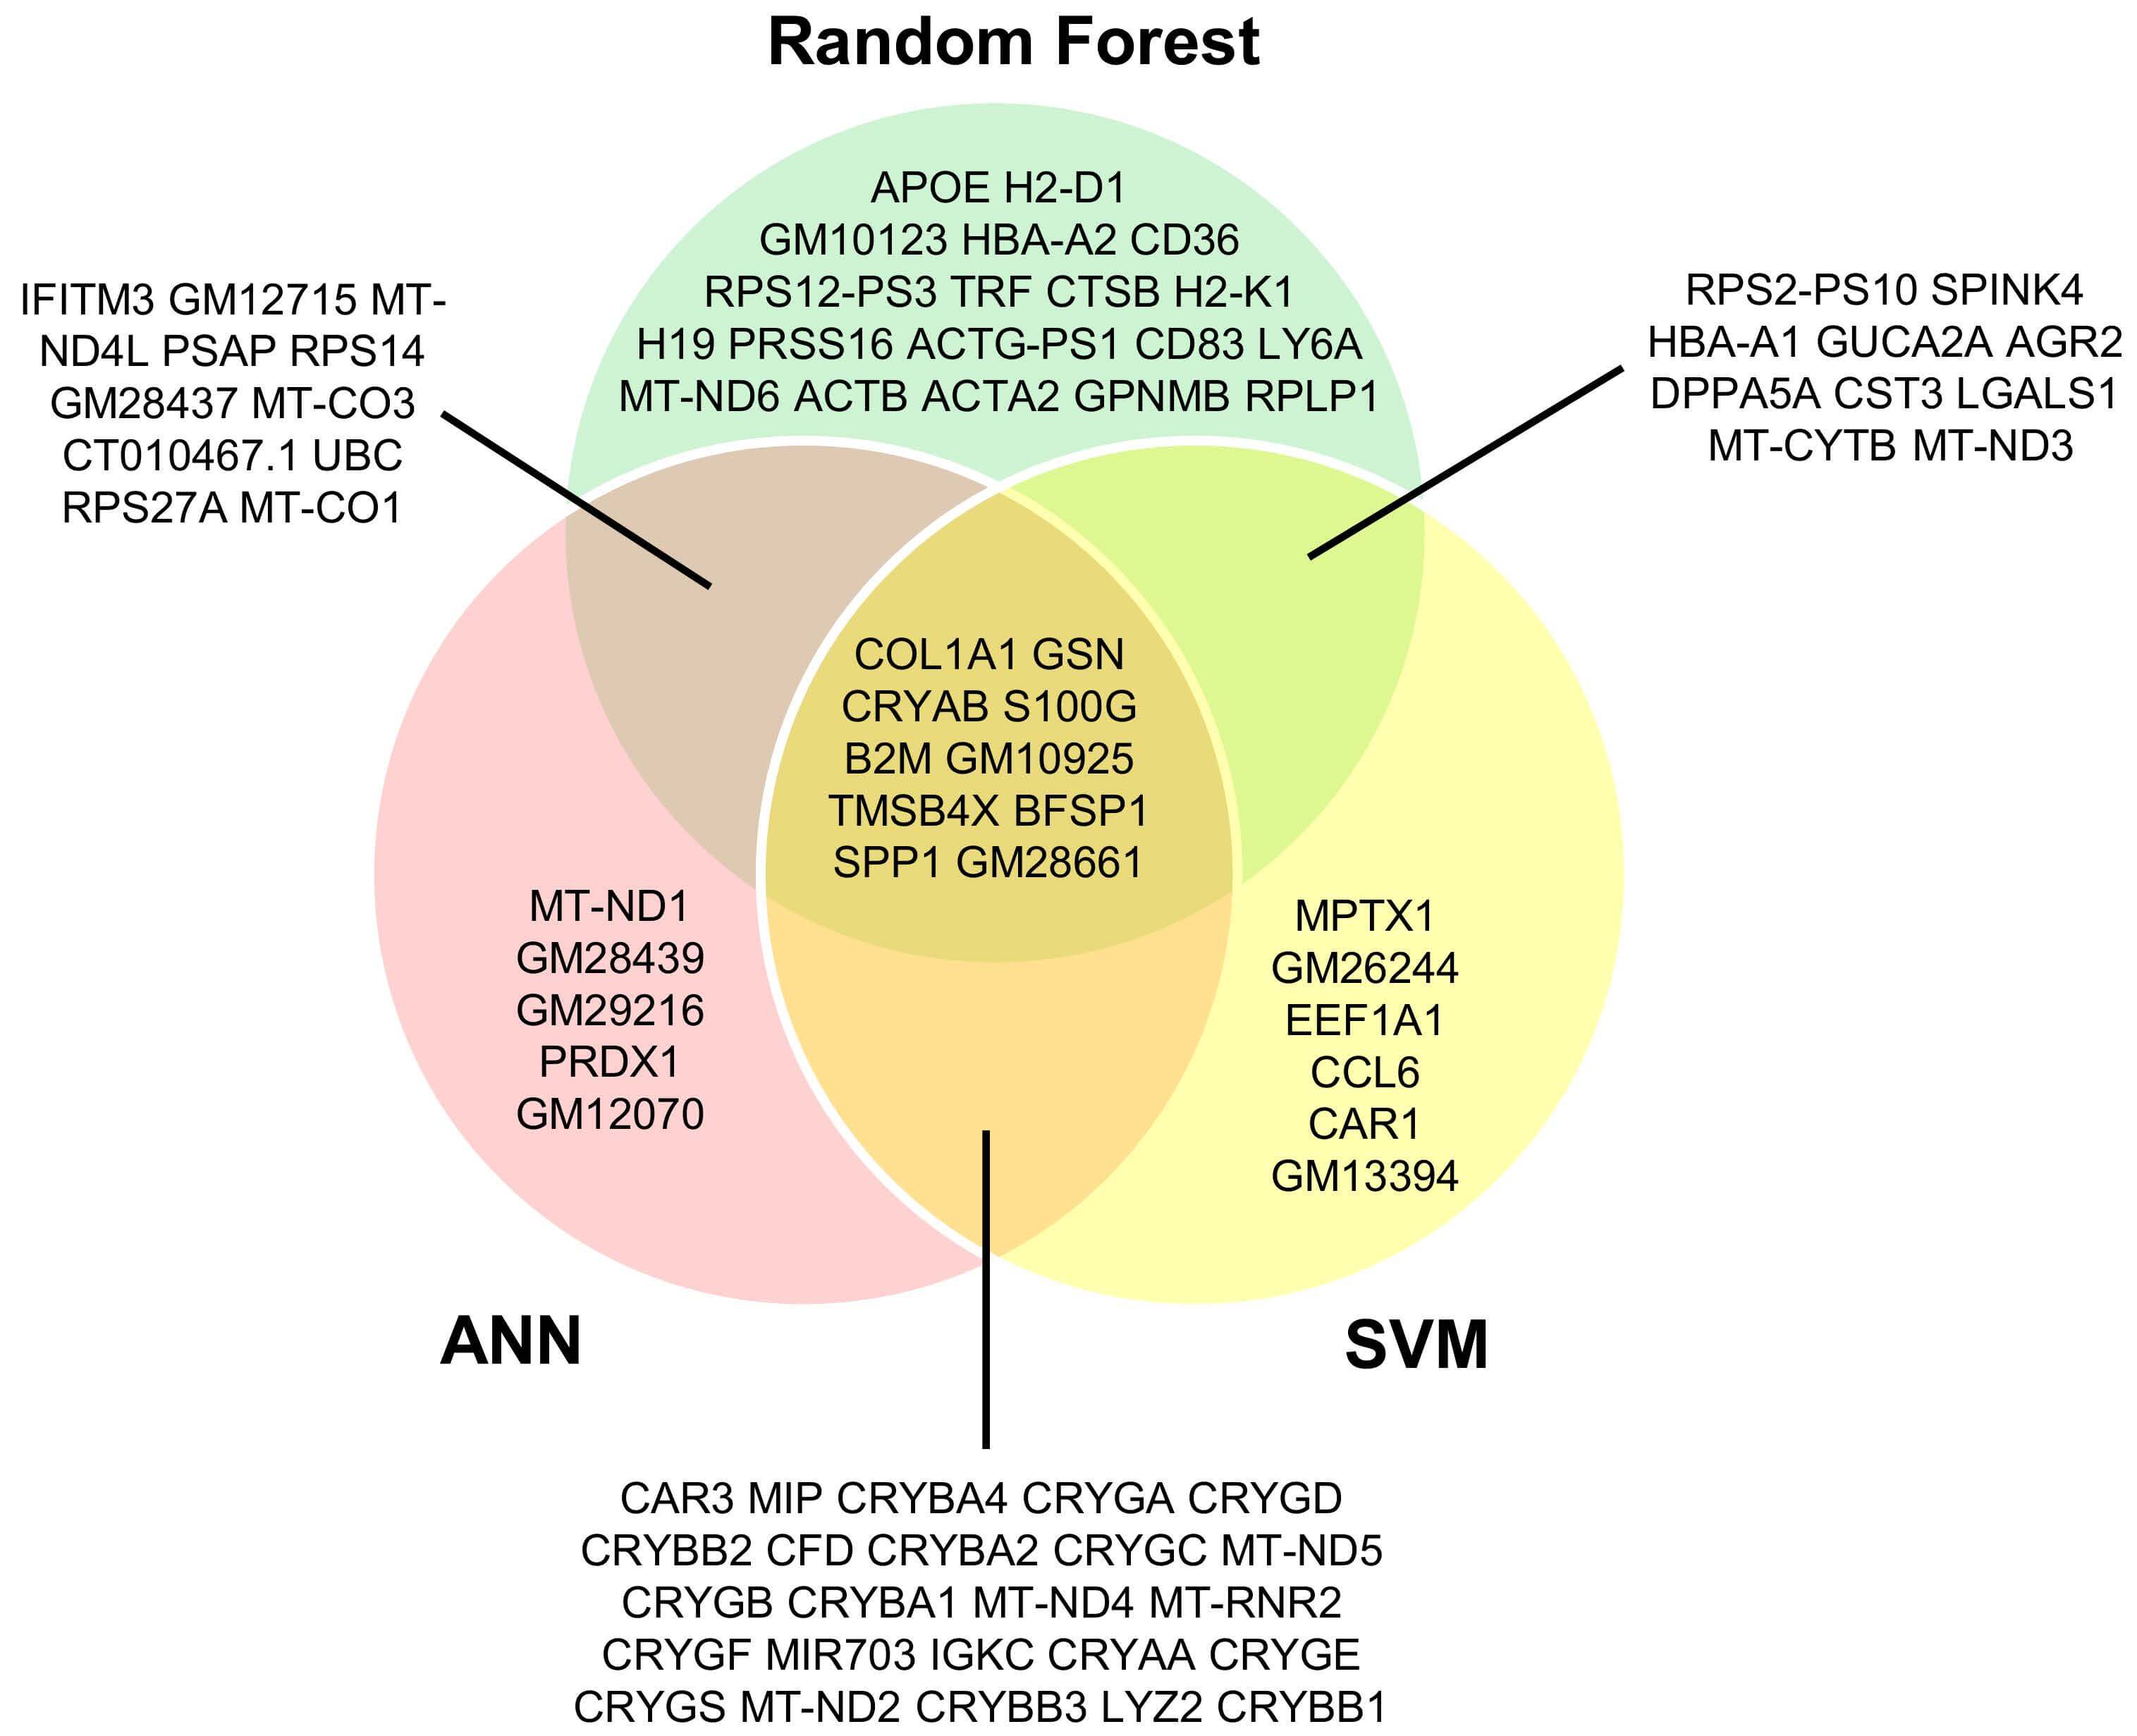 Fig. 7.
Overlap of potential biomarker genes identified by RF, SVM, and ANN models in normal cells. The overlap diagram reveals both common and model-specific candidates, emphasizing potential biomarkers in normal cellular contexts.
Comparison of gene sets from all three models (Fig. 8) identified nineteen core biomarkers of normal tissue. Pairwise overlaps revealed additional shared genes (RF-SVM: 4, RF-ANN: 5, and SVM-ANN: 25), while each model also yielded unique genes (RF: 22, SVM: 2, and ANN: 1). These findings highlight both shared and algorithm-specific biomarkers, reflecting the complementary strengths of different machine learning approaches.
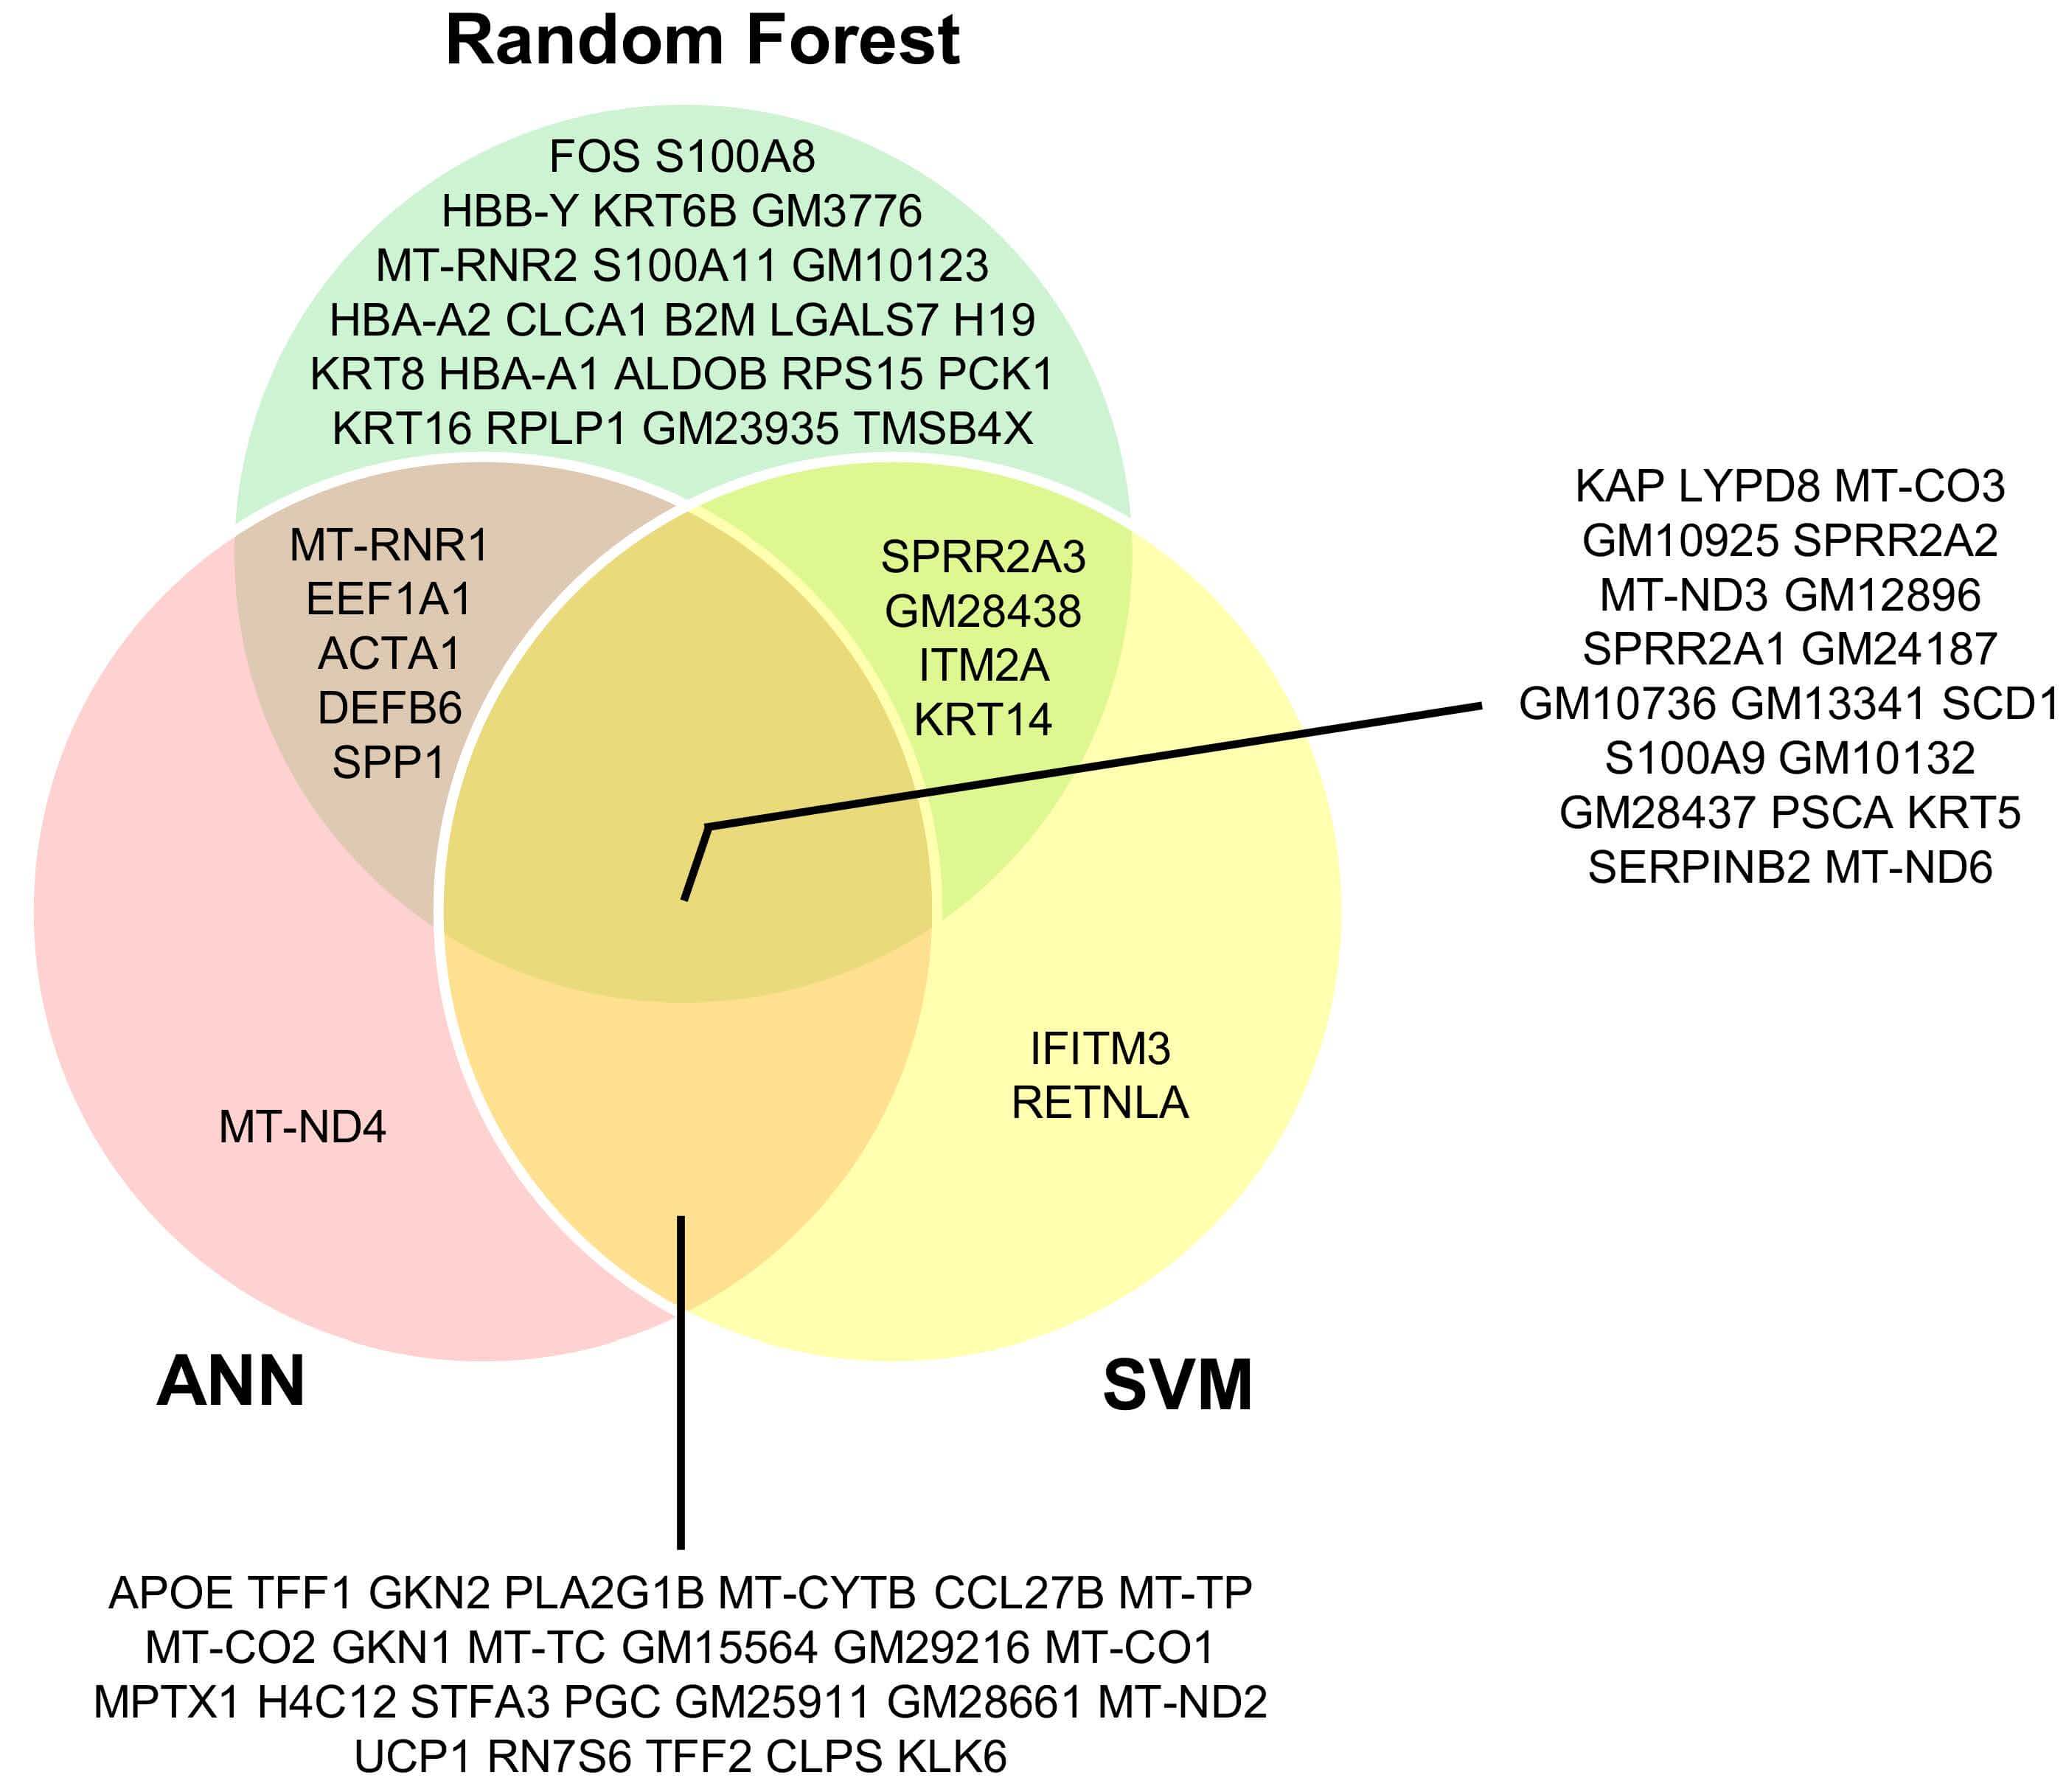 Fig. 8.
Intersection of candidate biomarker genes identified by RF, SVM, and ANN models in normal tissue.
In this study, we implemented an integrative framework to systematically compare EMT-associated transcriptional programs across normal and cancer datasets. By combining differential gene expression and functional enrichment analyses with machine learning-based classification, this approach enabled the identification of candidate EMT biomarkers and the delineation of regulatory networks and molecular patterns. Notably, our integrated analyses revealed recurrent enrichment of gene sets associated with neural-related processes in EMT, particularly neurogenesis, gliogenesis, and axonogenesis. Neurogenesis and gliogenesis proceed sequentially from common neural progenitors to ensure proper lineage specification and cell fate determination [43, 44], whereas axonogenesis facilitates the functional integration of newly generated neurons into pre-existing circuits [45, 46, 47].
The consistent enrichment of neural-related pathways observed across cancer datasets suggests that EMT-associated transcriptional reprogramming may extend beyond canonical epithelial and mesenchymal states. Rather, EMT appears to encompass neural-like characteristics that facilitate tumor-nerve interactions. Increasing evidence indicates that cancer cells undergoing EMT can engage molecular programs resembling those of neural progenitors or differentiated neural cells. Through this process, tumor cells acquire the capacity to sense, respond to, and reshape the neural microenvironment. This phenomenon is often referred to as “neuronal mimicry” [48]. Such neural-like plasticity may provide selective advantages during tumor progression by increasing cellular motility, enabling directed invasion along nerve fibers, and enhancing survival within neural-rich niches [49, 50].
In this context, the enrichment of pathways linked to neurogenesis and
gliogenesis may reflect the reactivation of evolutionarily conserved
developmental signaling cascades, including Notch, Wnt/
A clinically significant consequence of tumor-nerve interaction is perineural invasion (PNI), in which EMT programs facilitate tumor cell infiltration and spread along neural structures [53, 54]. EMT has been closely associated with PNI in multiple cancer types, including pancreatic, prostate, colorectal, and head and neck cancers. In these contexts, neurotrophic signaling axes such as NGF-Trk, BDNF-TrkB, and GDNF-RET contribute to directional tumor cell migration and invasive behavior [53, 55, 56].
More broadly, these observations are consistent with the rapidly emerging field of cancer neuroscience, which focuses on the bidirectional interactions between the nervous system and tumor biology [57]. Within this framework, neural activity plays an active role in tumor progression. Neurotransmitters (e.g., acetylcholine, norepinephrine, and glutamate), as well as neurotrophic factors are gaining recognition as key components of the tumor microenvironment that influence tumor growth, immune modulation, angiogenesis, and metastatic dissemination [58, 59, 60].
Collectively, the consistent enrichment of neural-related pathways across cancer EMT datasets supports a framework in which EMT-associated plasticity intersects with neural developmental and signaling programs. This convergence promotes tumor-nerve crosstalk and contributes to malignant progression. Future studies integrating single-cell and spatial transcriptomics with functional assays will be essential to elucidate the causal roles of these pathways and to explore their therapeutic potential in EMT-driven malignancies.
Focusing on pathological EMT, machine learning analyses identified a set of genes associated with neurodevelopmental processes that appeared recurrently across EMT-related cancer datasets [61]. Among these, BCYRN1 (the human ortholog of mouse Bc1), a neuronal long non-coding RNA involved in translational regulation and synaptic plasticity, was consistently detected across all cancer cell and tissue EMT datasets but was absent from normal EMT profiles [62]. This selective enrichment suggests potential reactivation of neurodevelopment-associated programs during cancer-associated EMT. Such reactivation may be linked to increased cellular plasticity and stem-like characteristics observed during cancer progression [2]. Clinically, elevated BCYRN1 expression correlates with both overall and disease-free survival [63].
In parallel, the identification of immune- and microenvironment-associated factors, including B2M, points to an immunomodulatory dimension of EMT in cancer [64]. B2M is frequently upregulated across multiple malignancies and has been reported to promote cancer cell survival, invasion, and metastasis through PI3K/AKT, MAPK, and PKA/CREB signaling; these findings suggest a context-dependent role in modulating EMT-related states and tumor-microenvironment interactions [65]. Consistently, elevated B2M expression has been associated with poor prognosis, including reduced progression-free survival [66, 67].
Additional mediators, S100A8 and S100A9 showed context-dependent patterns, with S100A8 detected only in cancer-associated EMT datasets and S100A9 only in normal EMT profiles; this divergence suggests differential involvement of inflammatory signaling in malignant versus physiological EMT [68, 69]. Notably, high expression of S100A8/A9 is generally associated with poor prognosis, metastasis, and advanced disease stage across several tumor types, including colorectal, breast, and gastric cancers [70].
SRGN (serglycin) was consistently detected in cancer-associated EMT datasets but not in normal EMT. Prior studies have linked SRGN to EMT-like transcriptional states, invasiveness, and microenvironmental responsiveness; these findings indicate that cancer-associated EMT may preferentially engage extracellular matrix- and developmental-related regulatory programs [71, 72]. Elevated SRGN expression is also associated with adverse clinical outcomes across multiple cancers [71, 73, 74]. In breast cancer, SRGN contributes to chemoresistance by sustaining stemness through crosstalk with YAP-dependent transcriptional programs [75].
LGALS1 was detected in cancer-associated EMT datasets and has been linked to tumor progression, angiogenesis, immune modulation, and therapy resistance. While its role in EMT may be indirect, elevated LGALS1 expression consistently correlates with increased recurrence risk and poorer survival in multiple cancers, including colorectal cancer, often through EMT-linked signaling pathways and immune regulatory mechanisms [76, 77, 78].
Finally, LARS2, primarily studied in neuronal contexts, has been associated with mitochondrial dysfunction and neurodegenerative disease; however, its relevance to cancer or EMT remains unclear [79, 80, 81]. CST3 has been associated with tumor invasion and poor prognosis in several cancers and may be influenced by hormonal regulation, although its specific role in EMT requires further investigation. Although no direct association has yet been reported between MIR6236 and EMT or TME regulation, limited evidence suggests a potential tumor-suppressive role in endometrial cancer.
Overall, these findings suggest that cancer cells may preferentially engage neural developmental programs and context-specific gene regulators to promote EMT and malignant phenotypes. In contrast, normal EMT processes appear more reversible and tightly regulated. The ML-identified genes in cancer tissues - particularly B2M, CST3, LARS2, SRGN, S100A8/A9, LGALS1, BCYRN1, and MIR6235 - were prioritized as candidate markers. Genes involved in functionally related disease processes tend to be interconnected within biological networks and are frequently co-regulated. Hence, it is plausible that these EMT-related genes participate in shared co-expression networks and are governed by common epigenetic regulatory programs [82, 83, 84].
Furthermore, the protein products of the identified signature genes form an
interconnected interaction network, linked either directly or through
intermediate putative nodes. This suggests coordinated physical and/or functional
associations that collectively modulate EMT and TME dynamics. One of the key
connector nodes is Vimentin, a canonical mesenchymal marker and structural
effector of EMT. Another prominent connector node, CD44, functions as a central
regulator of EMT and cancer stemness by suppressing epithelial markers (such as
E-cadherin) and inducing mesenchymal markers (e.g., N-cadherin and vimentin),
thereby enhancing invasion; CD44 silencing prevents or reverses EMT, supporting
its causal role in EMT regulation [85, 86]. LGALS9C, another connector node within
the network, belongs to the Galectin-9 family of
The coordinated activity of these genes/proteins suggests convergence of interconnected programs governing EMT dynamics and tumor microenvironment remodeling. In particular, inflammatory mediators (S100A8/S100A9, SRGN, LGALS1, LGALS9C) [88, 89] and immune interface components (B2M, CD44) [90, 91] can establish cytokine- and chemokine- dependent signaling. This signaling promotes EMT-associated transcriptional plasticity and may sensitize tumor cells to neural-derived signals. At the same time, factors involved in cell-extracellular matrix interactions and cytoskeletal organization (including CD44, VIM, and CST3) [92, 93, 94] are likely to promote directed migration and invasion along nerve-associated structures. These factors may also facilitate tumor cell engagement with the surrounding stroma. In parallel, metabolic and stress-adaptation pathways (RRAGC, LARS2) [95, 96] may support the energetic demands of EMT, including tumor cell survival within nerve-rich microenvironments. Together, these coordinated programs provide a plausible mechanistic link between EMT, extracellular matrix remodeling, and reorganization of the neural niche within the tumor microenvironment. These interactions may contribute to the stabilization of EMT states and the advancement of tumor progression.
To further delineate the differences between physiological and cancer-associated EMT, we found that SPP1 is the only gene shared between both contexts. In contrast, several other recurrently detected genes (BC1, HBA-A2, HBA-A1, KRT18, GM26035, GM28437, MT-CO3, MT-CYTB, MT-ND3, KRT8, and MT-RNR1) currently lack clear evidence linking them to cancer, EMT, or neurogenesis. Nevertheless, their consistent detection across the analyzed datasets suggests potential biological relevance and highlights the need for targeted in vitro and in vivo experimental studies to clarify their roles.
This study has several limitations that should be acknowledged: (i) dataset heterogeneity, (ii) the analysis was restricted to canonical epithelial/mesenchymal states, with intermediate or hybrid E/M phenotypes excluded due to the intrinsic limitations of bulk transcriptomic data; this represents a major limitation, given the established biological and clinical relevance of hybrid E/M states in cancer, and underscores the need for future single-cell-based studies to more comprehensively resolve EMT heterogeneity, (iii) potential tissue contamination, (iv) the sample sizes of the normal (n = 17) and cancer (n = 12) tissue groups are relatively small, which may limit statistical power and generalizability; therefore, validation in larger, independent cohorts will be necessary to confirm and strengthen the robustness and accuracy of the findings derived from these groups, (v) the absence of experimental validation.
Nevertheless, despite these limitations, the findings presented herein may serve as a foundation for the rational design of future experimental and translational studies. The cancer tissue-associated signature genes identified in the present study could be incorporated into clinical settings to improve diagnostic strategies. These genes may complement and refine currently established EMT-related biomarkers, especially in tumors exhibiting pronounced mesenchymal features. Beyond their diagnostic utility, these genes could represent promising anti-cancer therapeutic targets. This potential arises either from their direct involvement in EMT-relevant signaling pathways or from their function as non-coding epigenetic regulators that modulate EMT-associated protein-coding genes within complex regulatory networks. This dual contribution highlights the multifaceted nature of EMT regulation during cancer progression. Notably, targeting specific components of this signature, such as SRGN, has been reported to sensitize tumor cells to chemotherapeutic agents, suggesting that EMT-linked molecular vulnerabilities may be therapeutically exploitable. Furthermore, the expression profiles of BCYRN1, B2M, S100A8/A9, SRGN, and LGALS1 are associated with poor prognostic outcomes in EMT-high tumors, underscoring their potential value as prognostic biomarkers and potential predictors of therapeutic response.
Herein, an integrative computational strategy was applied to explore EMT-associated transcriptional programs across normal and cancer-related mouse RNA-seq datasets. While EMT processes - such as cell adhesion, cytoskeletal remodeling, and tissue morphogenesis - were shared across contexts, cancer-associated EMT showed additional enrichment of developmental and neural-related pathways. This pattern suggests that malignant cells may rely on a broader range of plasticity-associated programs compared to normal EMT. The application of complementary machine learning models enabled the prioritization of candidate genes associated with EMT across heterogeneous datasets, revealing both shared and context-specific features. Collectively, the results of this study provide a comprehensive overview for understanding the transcriptional differences between physiological and cancer-associated EMT and provide the foundation for future targeted experimental studies.
ANN, artificial neural network; EMT, epithelial-mesenchymal transition; MET, mesenchymal-epithelial transition; SVM, support vector machine.
Publicly available data were utilized in this study. The relevant database sources and the corresponding links are provided below: PubMed (NCBI): https://pubmed.ncbi.nlm.nih.gov/; NCBI Gene Expression Omnibus (GEO): https://www.ncbi.nlm.nih.gov/gds/; STRING Protein-Protein Interaction Database: https://string-db.org/. All necessary data have been provided in the Supplementary Material.
Conceptualization, ŞB, HA, AGG and AP; methodology, ŞB, HA, AGG and AP; software ŞB and AP; validation, ŞB, HA and AP; formal analysis, ŞB, AGG and AP; data curation, ŞB; writing—original draft preparation, ŞB, HA, AGG and AP; writing—review and editing, ŞB, HA, AGG and AP; supervision, AP; project administration, AP. All authors contributed to editorial changes in the manuscript. All authors read and approved the final manuscript. All authors have participated sufficiently in the work and agreed to be accountable for all aspects of the work.
Not applicable.
We would like to express our sincere gratitude to the peer reviewers for their constructive comments and valuable suggestions, which helped improve the quality of this work.
This research received no external funding.
Given his role as the Editorial Board member, Alexandros G. Georgakilas had no involvement in the peer-review of this article and has no access to information regarding its peer review. Full responsibility for the editorial process for this article was delegated to Nguyen Quoc Khanh Le and Yudong Cai.
Supplementary material associated with this article can be found, in the online version, at https://doi.org/10.31083/FBL48085.
References
Publisher’s Note: IMR Press stays neutral with regard to jurisdictional claims in published maps and institutional affiliations.